Article

Effect of MHC Linked 7-Gene Signature on Delayed Hepatocellular Carcinoma Recurrence

1
Department of Biosciences, COMSATS University, Islamabad 44000, Pakistan
2
Department of Molecular Biology, Shaheed Zulfiqar Ali Bhutto Medical University, Islamabad 44000, Pakistan
3
College of Medicine, Texas A&M University, College Station, TX 77840-77845, USA
4
Department of Biology, College of Science, Ha’il University, Ha’il 55211, Saudi Arabia
5
Research and Scientific Studies Unit, College of Nursing and Allied Health Sciences, Jazan University, Jazan 45142, Saudi Arabia
6
Faculty of Medicine, Görükle Campus, Bursa Uludağ University, Bursa 16059, Turkey
7
Department of Cardiology, University Hospital of Wales, Wales CF14 4XW, UK
8
Department of Basic Dental and Medical Sciences, College of Dentistry, Ha’il University, Ha’il 55211, Saudi Arabia
*
Authors to whom correspondence should be addressed.
Both Authors contributed equally to this work and share first authorship.
J. Pers. Med. 2021, 11(11), 1129; https://doi.org/10.3390/jpm11111129
Submission received: 18 September 2021 / Revised: 26 October 2021 / Accepted: 28 October 2021 / Published: 2 November 2021
(This article belongs to the Topic Oncogenomics and Pediatric Health)

Abstract

:
Dysregulated immune response significantly affects hepatocellular carcinoma’s (HCC) prognosis. Human Leukocyte Antigens are key in devising immune responses against HCC. Here, we investigated how HLAs modulate HCC development at the transcriptomic level. RNA-seq data of 576 patients from two independent cohorts was retrieved. The clinicopathological relevance of all HLA genes was investigated using Fisher-Exact, correlation, and Kaplan–Meier and cox regression survival tests. Clustering of ~800 immune-related genes against HLAs was completed using a ward-agglomerative method. Networks were generated using 40 HLA associated unique genes and hub genes were investigated. HLAs including HLA-DMA, HLA-DMB, HLA-DOA and HLA-DRB6 were associated with delayed recurrence in both discovery (204 HCC cases) and validation (372 HCC cases) cohorts. Clustering analyses revealed 40 genes associated with these four HLAs in both cohorts. A set of seven genes (NCF4, TYROBP, LCP2, ZAP70, PTPRC, FYN and WAS) was found co-expressed at gene–gene interaction level in both cohorts. Furthermore, survival analysis revealed seven HLA-linked genes as predictors of delayed recurrence. Multivariate analysis also predicted that mean expression of 7-gene is an independent predictor of delayed recurrence in both cohorts. We conclude that the expression of 7-gene signature may lead to improved patient prognosis. Further studies are required for consideration in clinical practice.

1. Introduction

HCC is a common heterogeneous malignancy of the liver with a high mortality rate. It is second most common cause of mortality in males and overall third most common worldwide [1,2]. Despite continuously improving therapeutic approaches, the overall survival rate of HCC patients is still very low. Studies revealed that 40–80% of HCC patients will have recurrence and metastasis within 5 years after receiving treatment [1]. Therefore, a new and distinct approach is required for early-stage diagnosis and improving survival of HCC patients.
Major Histocompatibility Complex (MHC) assists the immune system in “host defense mechanism”, which comprises of genes that encode proteins present on the cell surface, also known as Human Leukocyte Antigens (HLAs) [3]. MHCs can be divided into three classes: class I, II and III. The class I region contains genes including three classical (HLA-A, HLA-B and HLA-C), three non-classical (HLA-E, HLA-F and HLA-G) and twelve non-coding genes or pseudogenes [4]. Recent studies demonstrated the association of HLA expression with the prognosis of cancer, suggesting new immunotherapeutic options. However, contradictory results are observed in HLA expression-based prognosis prediction. For instance, overexpression of HLA-G, an MHC class I gene, was found in high grade tumors and suggested as a new checkpoint in different cancers [5,6]. The expression of HLA-B and HLA-E showed linkage with cancer cell migration, metastasis and poor overall survival in pancreatic and endometrial cancers [7,8]. On the contrary, MHC class I genes were also linked with better prognosis in breast and gastrointestinal tumors, suggesting tissue specific roles of HLAs [9,10]. Similarly, overexpression of MHC class II genes including HLA-DP, HLA-DQ and HLA-DR showed association with better prognosis in lung cancer [11]. Additionally, HLA-DR expression was also suggested to improve the prognosis of metastatic breast cancer patients [12].
In HCC, MHC class II molecules are most commonly expressed [13]. Previous studies have also shown that HLAs may play a role in HCC prognosis [14,15,16]. However, due to contradictory results on prognosis prediction, no HLA based immunotherapies are suggested in clinical practice. Additionally, limited information is available regarding the linkage of major HCC associated pathways with HLA expression. Therefore, a comprehensive and integrated study is required to ascertain the prognostic role of all HLA genes in HCC as well as their linkage with genetic pathways associated with HCC.
Thus, the current study is devised to investigate the association of HLA genes with the prognosis and survival of HCC patients. For that purpose, high throughput whole transcriptomic data of 372 and 204 HCC patients along with complete clinical information was retrieved for the analysis. Initially, the clinicopathological relevance of 23 HLA genes from all classes was established. Next, the prognostic role of immune response genes linked with HLA expression was also evaluated. The current study has immense clinical implications as we classified HCC patients into different prognostic groups based on the expression of HLAs and HLA-associated immune response genes.

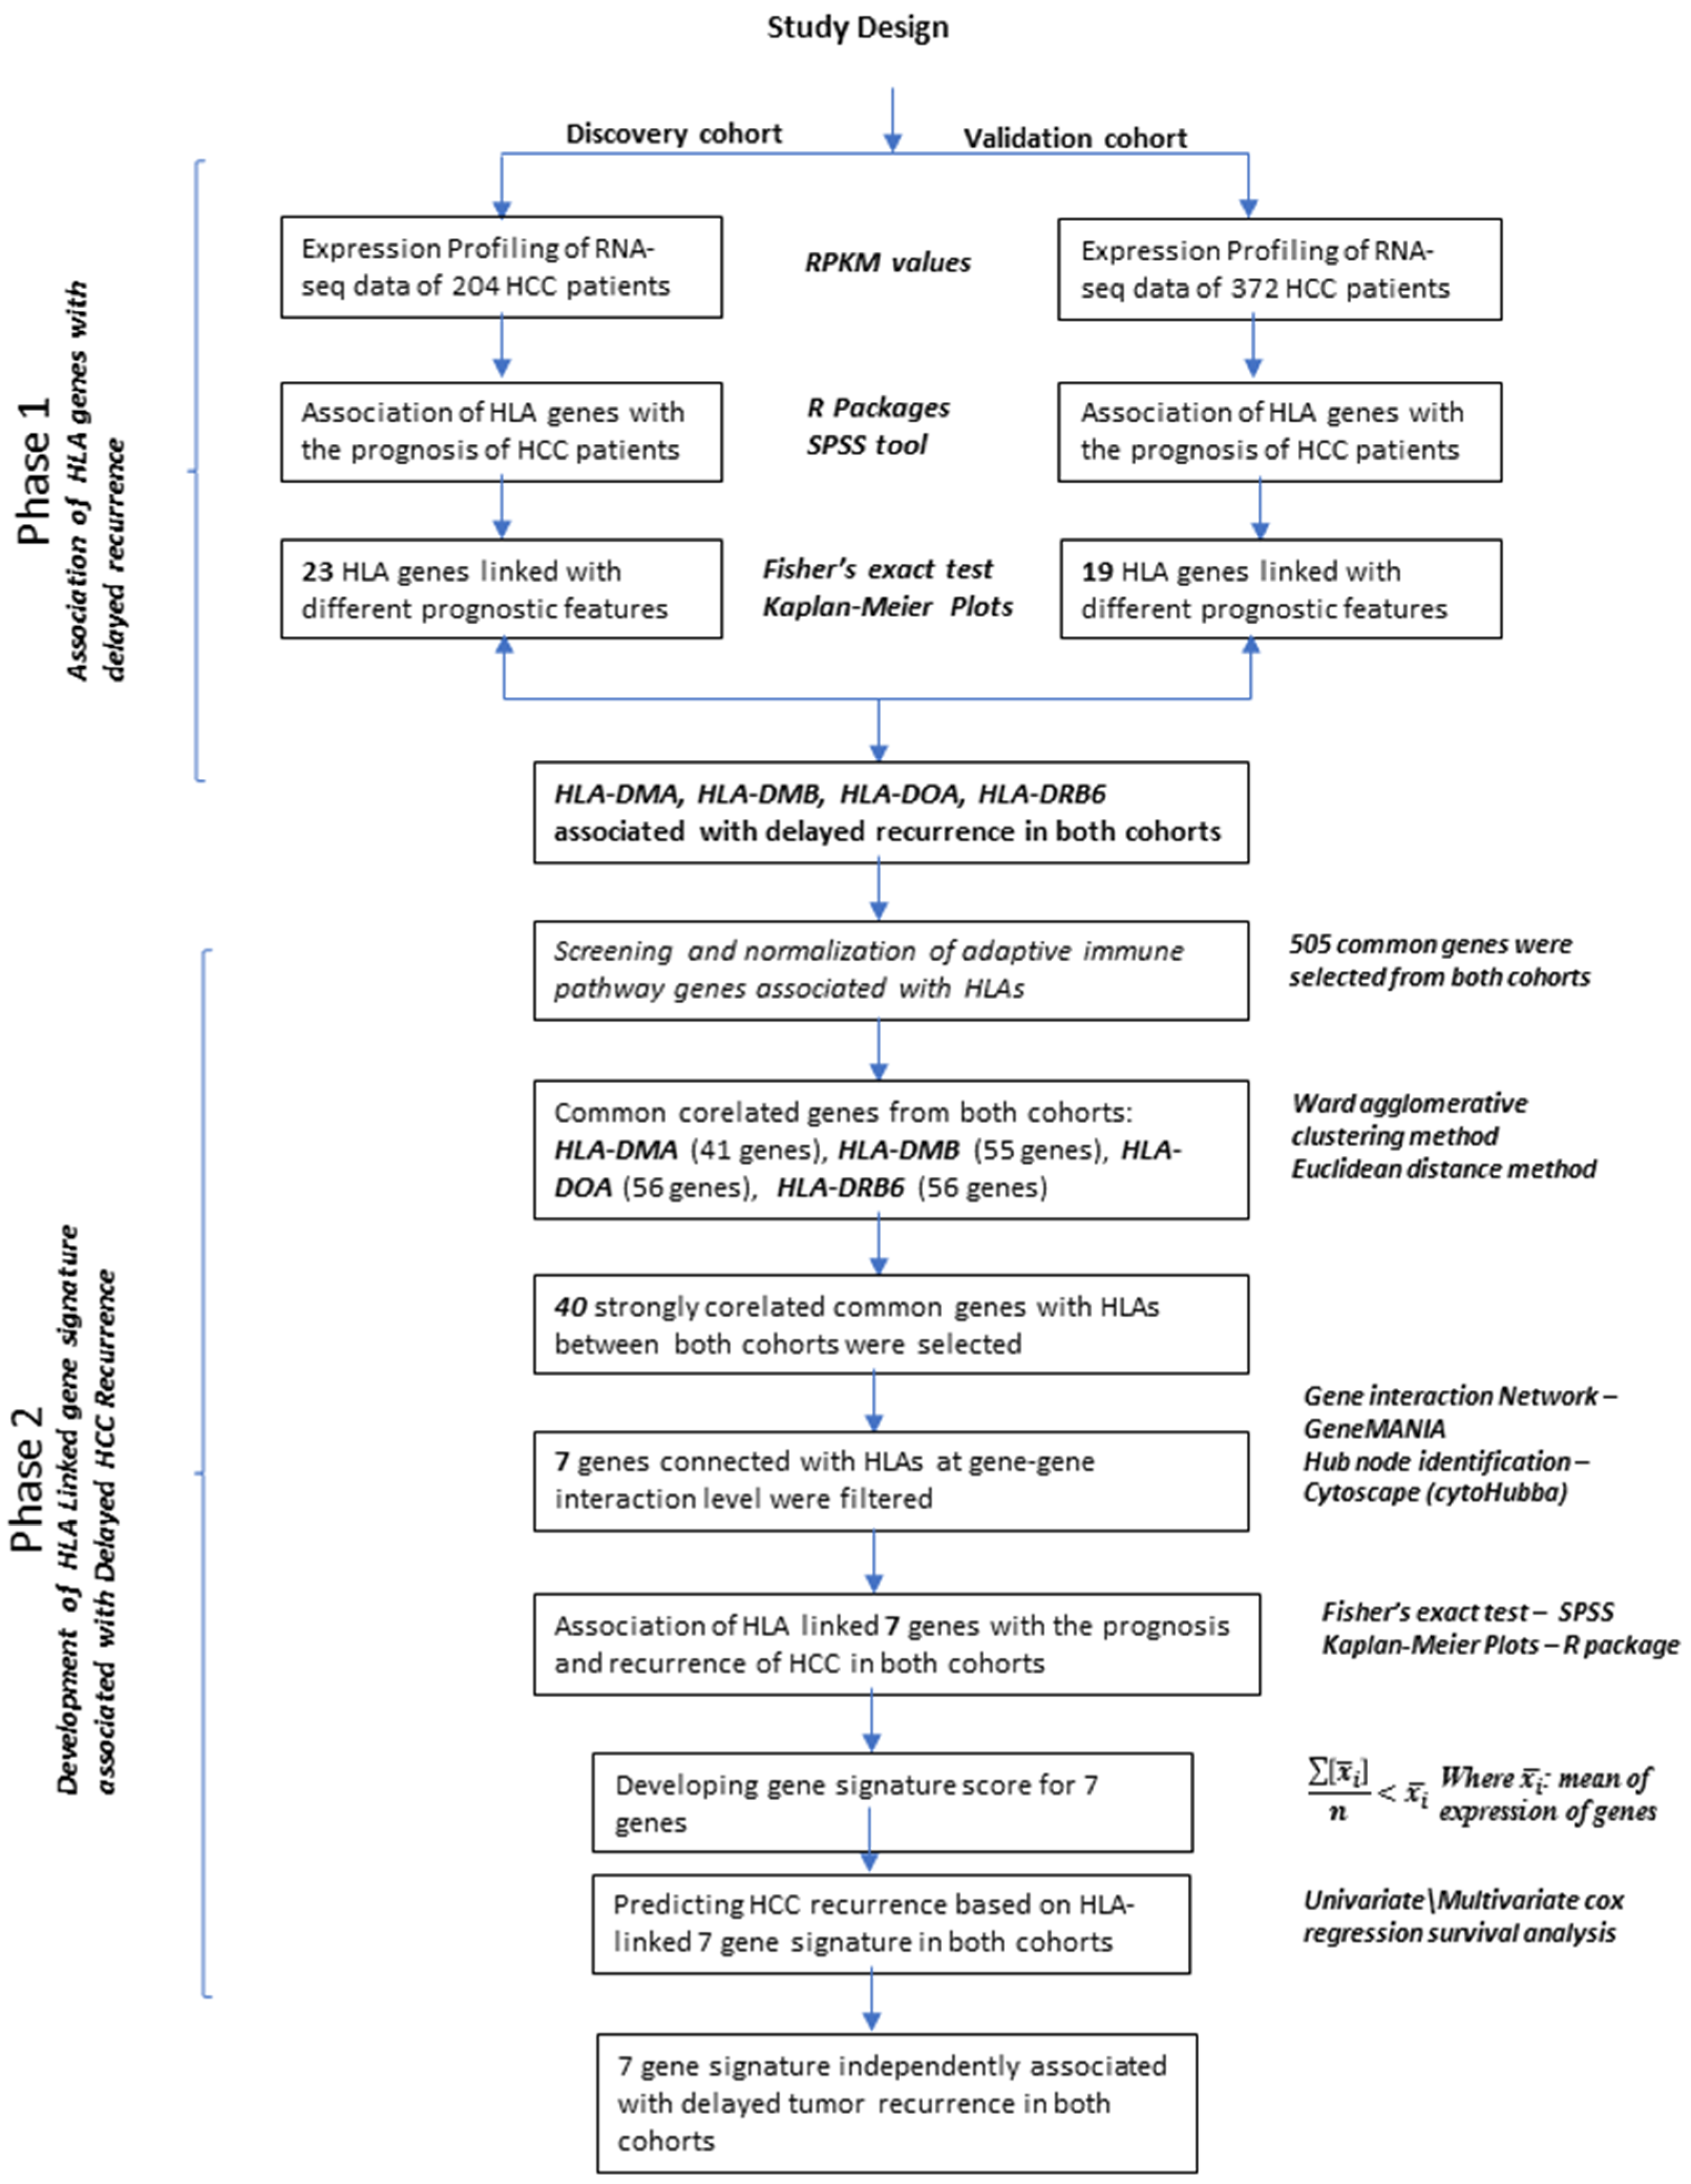
2. Materials and Methods

2.1. RNA Sequencing Data of 204 HCC Patients (Discovery Cohort)

Overall study design is presented in Figure 1. The tissues samples of 204 HCCs patients diagnosed between 2005 to 2013 were obtained from the Bio-Resource Center, Korea Biobank Network. All procedures performed in studies involving human participants were in accordance with the ethical standards of the institutional and national research committee and with the 1964 Helsinki declaration and its later amendments or comparable ethical standards ((IRB # 2012–0389, ASAN Medical Center, Korea), (COMSATS University Islamabad (CIIT/Bio/ERB/16/21)). Library preparation and RNA quality assessment is described in previous studies [17,18]. Quality check was performed using FASTQC on raw FASTQ files. Alignment was done using STAR RNA-Seq Aligner v2.x7.2 [19]. Duplicates were marked using a Picard tool (https://broadinstitute.github.io/picard/ last accessed on 30 March 2020). After post-alignment clean-up, all the mapped sequences were merged into a Binary Aligned/Mapped (BAM) file. Gene expression analysis was performed using HTSEQ-count (https://htseq.readthedocs.io/en/master/ last accessed on 30 March 2020). The numbers of aligned reads that overlap each gene in the annotations were counted. Lastly, Reads per Kilobase Million (RPKM) values were generated for the analysis. To calculate z-score, = mean expression in reference sample was subtracted from each expression in the tumor sample and the result was divided by the standard deviation of expression in the reference sample [20]. Clinical information included age, sex, HBV, HCV, tumor size, Edmonson most grade, alpha-fetoprotein level, microvascular invasion, cirrhosis, fibrosis, overall survival and disease free survival (Table S1).

2.2. RNA Sequencing Data of 372 HCC Patients (Validation Cohort)

RPKM and z-score values of 372 HCC patients were downloaded from The Cancer Genome Atlas (TCGA) database (https://portal.gdc.cancer.gov/ last accessed on 30 March 2020) [21]. Complete clinical information of these samples was downloaded from the cBioPortal database (http://www.cbioportal.org/public-portal/, last accessed on 30 March 2020). Clinical information includes sex, HBV, HCV, tumor size, M stage, T stage, N stage, vascular invasion, cirrhosis, fibrosis, overall survival and disease free survival (Table S2).

2.3. Statistical Analysis

SPSS 21.0 software (IBM, Armonk, NY, USA) and R version 3.5.1 were used for all statistical analyses. Multiple statistical tests were performed including Fisher Test, Chi square Test, Kaplan–Meier survival and univariate and multivariate cox regression survival analysis. p  <  0.05 was considered as statistically significant.

2.4. Clustering and Correlation Analysis

For clustering analysis, more than ~800 immune pathway and major HCC-related pathway genes were extracted through extensive text mining and database search. Correlation and clustering analysis of those genes against HLAs were performed. Spearman test was performed for correlation analysis. Hierarchical clustering was performed using Ward’s agglomerative method [22]. HLAs in samples were indicated by a colored bar: red for upregulation and yellow for downregulation. Rows indicated clustering of genes (Figure S1).

2.5. Network Analysis of Candidate Co-Expressed Genes

The gene interactions among HLA genes and immune pathway genes were retrieved using GeneMania based parameters including physical contacts, co-expression, genetic interactivity, shared protein domains and co-localization. The hub was obtained using the CytoHubba [23]. Frequently occurring hub nodes in the gene interaction network with respect to mcc centrality measure, betweenness, bottleneck and degree measure were selected for the analysis.

2.6. Gene Signature Score Calculation

Lastly, a signature score was calculated for the HLA-linked immune response genes which showed association with HCC prognosis. The following equation was used to calculate gene score:
[ x ¯ i ] n < x i ¯     1
where   x i ¯ : mean of expression of genes. Briefly, mean expression of all genes was calculated separately for each sample. Then mean of mean was calculated across the samples. Lastly, if the mean expression in each sample was greater than the overall mean, we gave it a score of 1. If the mean expression in each sample was less than the overall mean, we gave it a score of 0.
After generating the score for significant genes using Kaplan Meier plots and univariate, multivariate cox regression methods were applied on validation and discovery cohorts for analyzing the association of gene signature with disease free survival (DFS) and overall survival (OS). Associations with p-values < 0.05 were considered significant.

3. Results

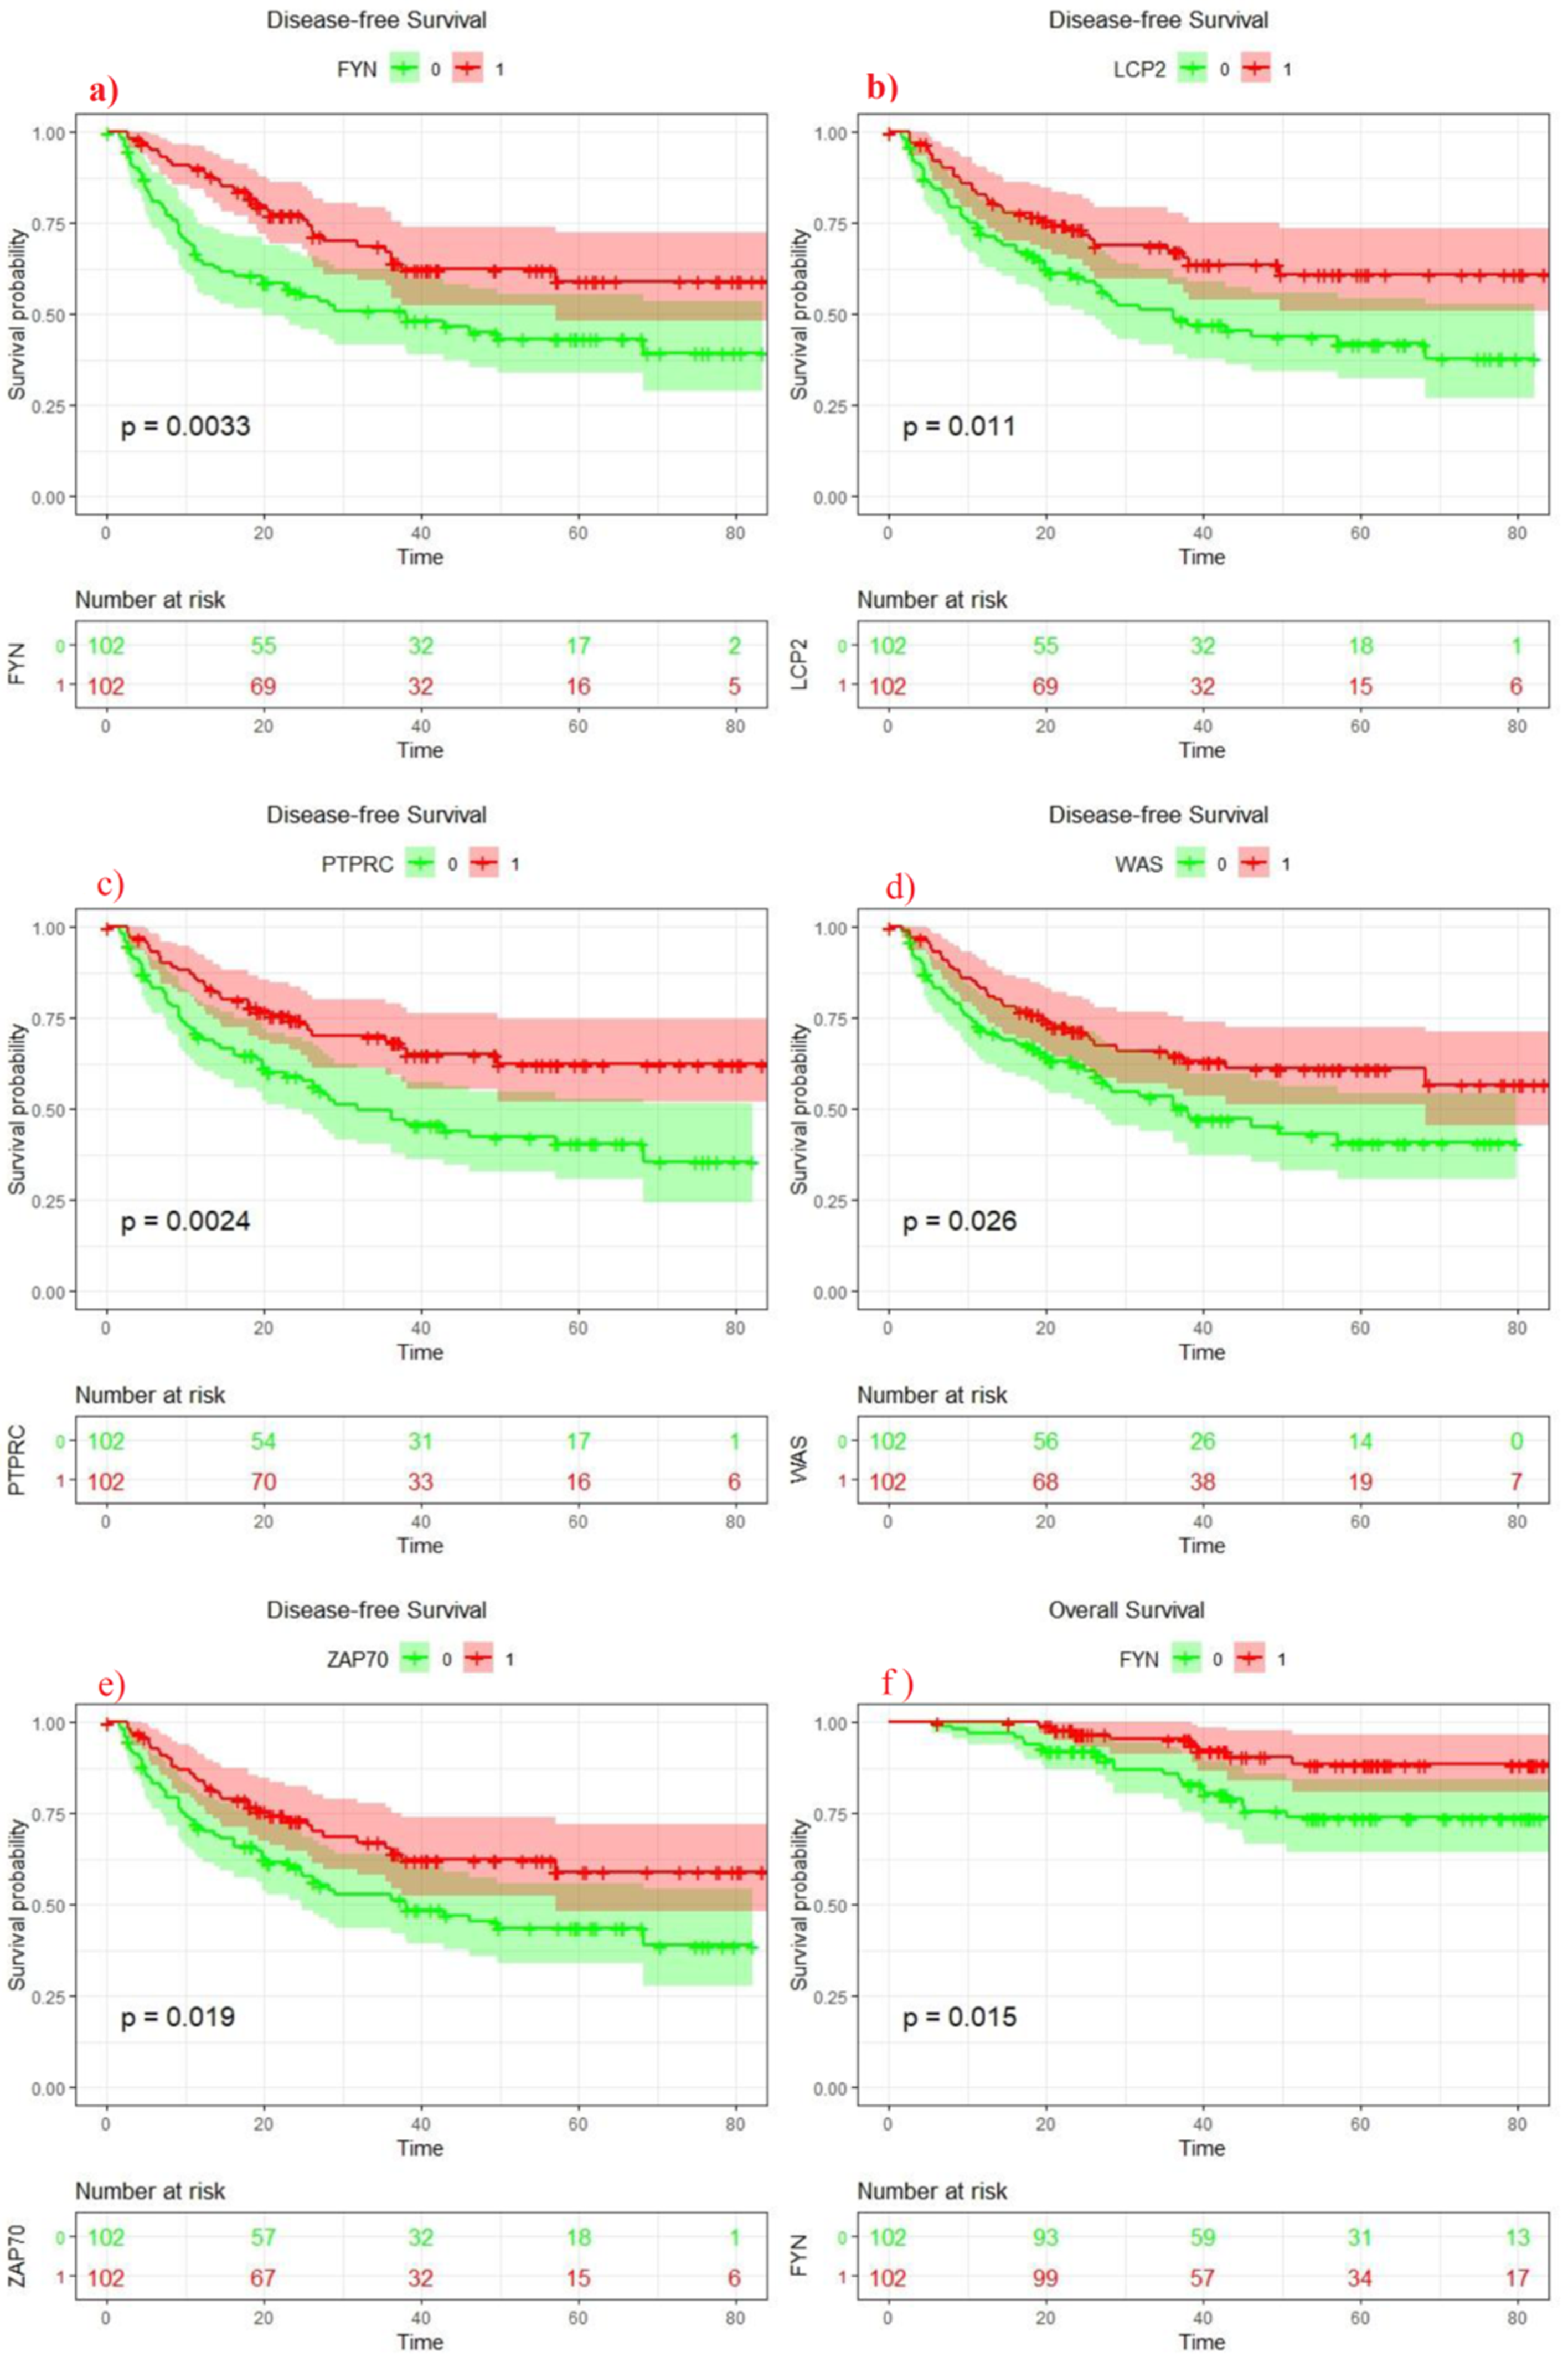
3.1. Clinical Analysis of MHC Genes (Discovery Cohort)

Initially, mRNA expression of all HLA genes was screened from both discovery and validation for the analysis. Tables S1 and S2 consist of clinical characteristics of HCC patients for discovery and validation cohorts, respectively. In the discovery cohort, high expression of MHC Class I genes showed significant association with different clinical features including sex (HLA-G p = 0.003, HLA-L p = 0.018), non-HBV (HLA-E p = 0.004), Edmonson grade (HLA-C p = 0.029, HLA-E p = 0.029), tumor size (HLA-L p = 0.047) and cirrhosis (HLA-F, p = 0.034). According to survival analysis results, HLA-E (p = 0.041) showed association with better disease-free survival while HLA-G (p < 0.05) was associated with better disease free as well as overall survival of HCC patients (Table S3). MHC class II genes showed significant associations with multiple clinical features including age (HLA-DPA1 p = 0.035, HLA-DMB p = 0.001, HLA-DPB1 p = 0.017, HLA-DQA2 p = 0.017, HLA-DQB2 p = 0.000, HLA-DRA p = 0.017, HLA-DRB6 p = 0.003), tumor number (HLA-DQA1 p = 0.029, HLA-DRA p = 0.029), tumor size (HLA-DQA2 p = 0.047, HLA-DQB2 p = 0.047, HLA-DRB6 p = 0.011), Edmonson most grade (HLA-DOB, p = 0.003 HLA-DQA2 p = 0.007, HLA-DQB2 p = 0.014) and cirrhosis (HLA-DOB p = 0.034, HLA-DQA1 p = 0.008, HLA-DRB1 p = 0.034). According to survival analysis results HLA-DMA (p = 0.011), HLA-DMB (p = 0.027), HLA-DOA (p = 0.025), HLA-DOB (p = 0.002), HLA-DPB1 (p = 0.047), HLA-DQA2 (p = 0.004), HLA-DQB2 (p = 0.021) and HLA-DRB6 (p = 0.006) were significantly associated with better disease-free survival status (Table S3).

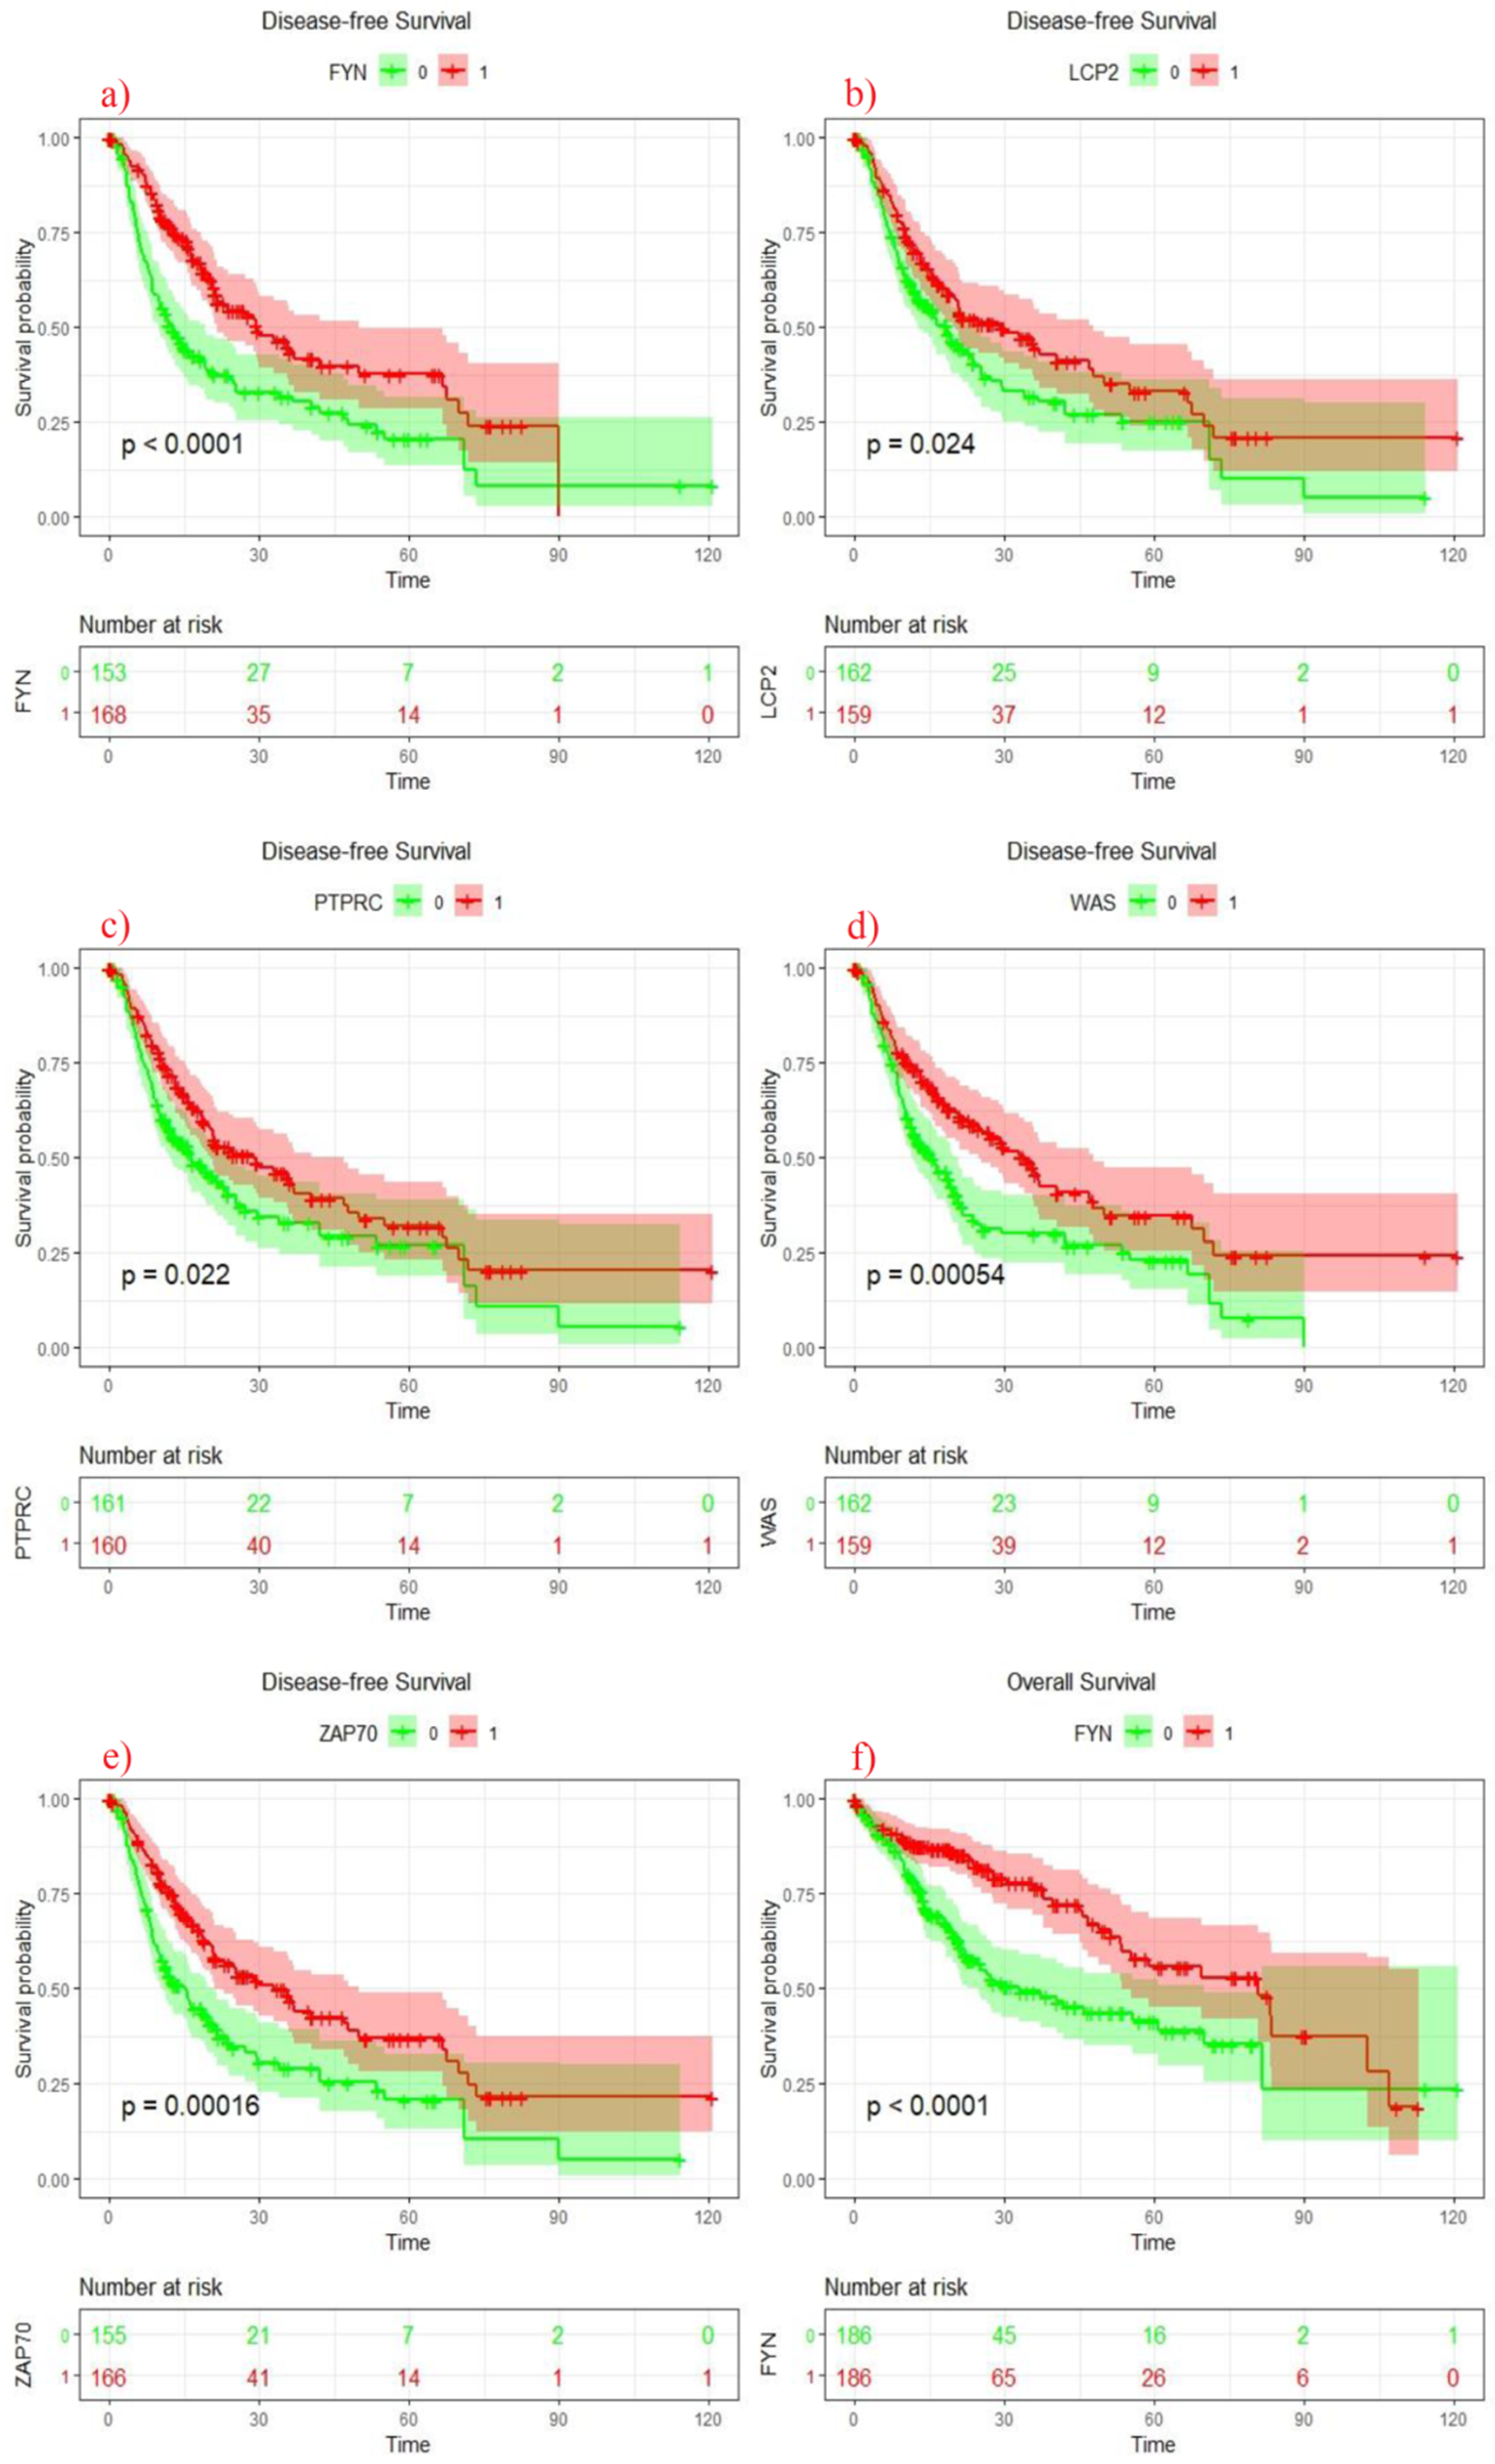
3.2. Clinical Analysis of HLA Genes (Validation Cohort)

Association between HLA genes and clinicopathological factors in the validation cohort is summarized in Table S4. According to the results, elevated levels of MHC class 1 genes including HLA-C, HLA-H, HLA-E, HLA-F, HLA-G, and HLA-H were associated with HCV (HLA-C p = 0.002, HLA-E p = 0.005, HLA-F p = 0.000, HLA-G p = 0.009, HLA-H p = 0.007). HLA-C showed an association with sex, alcohol consumption, cirrhosis with p values = 0.001, 0.045, 0.043 respectively. Of note, the HLA-H gene showed maximum association with clinical parameters including age (p = 0.048), sex (p = 0.023), tumor-stage (0.004) and T stage (p = 0.002). HLA-G (p = 0.007) and HLA-E (p = 0.003) also showed association with disease recurrence. Moreover, survival curves demonstrated that patients with high levels of HLA-E (p = 0.034) and HLA-H (0.045) were significantly associated with improved survival (Table S4). In addition, MHC class II genes including HLA-DMA (p = 0.003), HLA-DMB (p = 0.027), HLA-DOB (p = 0.005), HLA-DRB1 (p = 0.027) and HLA-DRB5 (p = 0.019) showed significant association with alcohol (Table S4). Elevated levels of HLA-DOB (p = 0.014) and HLA-DQA2 (p = 0.049) were significantly associated with T-stage <2. HLA-DOA (p = 0.033), HLA-DQA2 (p = 0.032), HLA-DRA (p = 0.038) and HLA-DOB (p = 0.005) showed association with initial tumor stage. Kaplan–Meier survival analysis revealed that high expression of HLA-DOA (p = 0.038), HLA-DMA (p = 0.022), HLA-DMB (p = 0.005), HLA-DRA (p = 0.006), HLA-DRB1 (p = 0.018) and HLA-DRB6 (p = 0.016) were associated with delayed recurrence (Table S4). Interestingly, four genes of MHC Class II HLA-DOA, HLA-DMA, HLA-DMB and HLA-DRB6 showed significant association with disease free survival in both cohorts.

3.3. Clustering Analysis of HLA Genes with Adaptive Immune and HCC Related Genes

Out of a total 822 genes, expression levels of 505 genes were identified in both cohorts. Hierarchical clustering was performed on both cohorts using normalized expression of 505 genes by applying a heatmap function and ward d2 clustering method. Significant clusters of genes were selected which showed possible co-expression with HLAs (Figure S1). Selected clusters were further validated using the Spearman correlation method (Table S5).
Lastly, out of all these genes, a set of 40 unique genes showing positive correlation with HLAs were selected for further analysis (Table S6).

3.4. Network Analysis and Hub Gene Identification of 40 Genes Co-Expressed with HLAs

Next, gene–gene interaction among 40 unique genes and HLAs were obtained from GeneMania. The gene–gene interaction network showed interactions based on various parameters where co-expression based interactions (in light purple color) were 72.63%, physical interactions among the genes scored 6.40% (marked in pink color) of all interactions, genetic interactions (in light green color) were 5.60% and the rest were the rare interactions (Figure S2).
Furthermore, degree centrality, betweenness, closeness, bottleneck and MCC calculation methods were chosen as the measure of hub node identification in CytoHubba. Network results showed the top 10 genes as potential hub nodes (Figure S3). Common genes present in all five networks including NCF4, TYROBP, LCP2, ZAP70, PTPRC, FYN and WAS were identified as key hub nodes.

3.5. Clinical Analysis of Seven Genes Signature

Next, the clinical relevance of these seven HLA associated genes was evaluated. All these genes showed significant associations with different clinical features (Table 1). Upregulation of TYROBP and WAS showed significant association with age <60 (p value = 0.035). Elevated expression level of FYN (p value = 0.000), LCP2 (p value = 0.002), PTPRC (p value = 0.011), WAS (p value = 0.005), ZAP70 (p values = 0.000) and NCF4 (p values = 0.047) were associated with tumor size. TYROBP (p values = 0.029) and NCF4 (p values = 0.003) were also significantly associated with Edmonson most grade. Kaplan–Meier survival results showed that upregulation of LCP2, PTPRC, ZAP70, FYN and WAS was significantly associated with increased disease-free survival. In addition, elevated expression of only FYN was associated with better overall survival (Figure 2).
Similarly, in validation cohort, high expression of these genes showed significant association with different clinical features including sex (FYN p = 0.038), grade (FYN p = 0.001), tumor stage WAS p = 0.037, ZAP70 p = 0.043) and T stage (WAS p = 0.049, ZAP70 p = 0.049) (Table 2). Kaplan–Meier survival curves results showed that elevated expression of LCP2, PTPRC, WAS, ZAP70 and FYN were associated with delayed recurrence. Furthermore, upregulation of FYN and ZAP70 showed significant association with better survival (Figure 3).

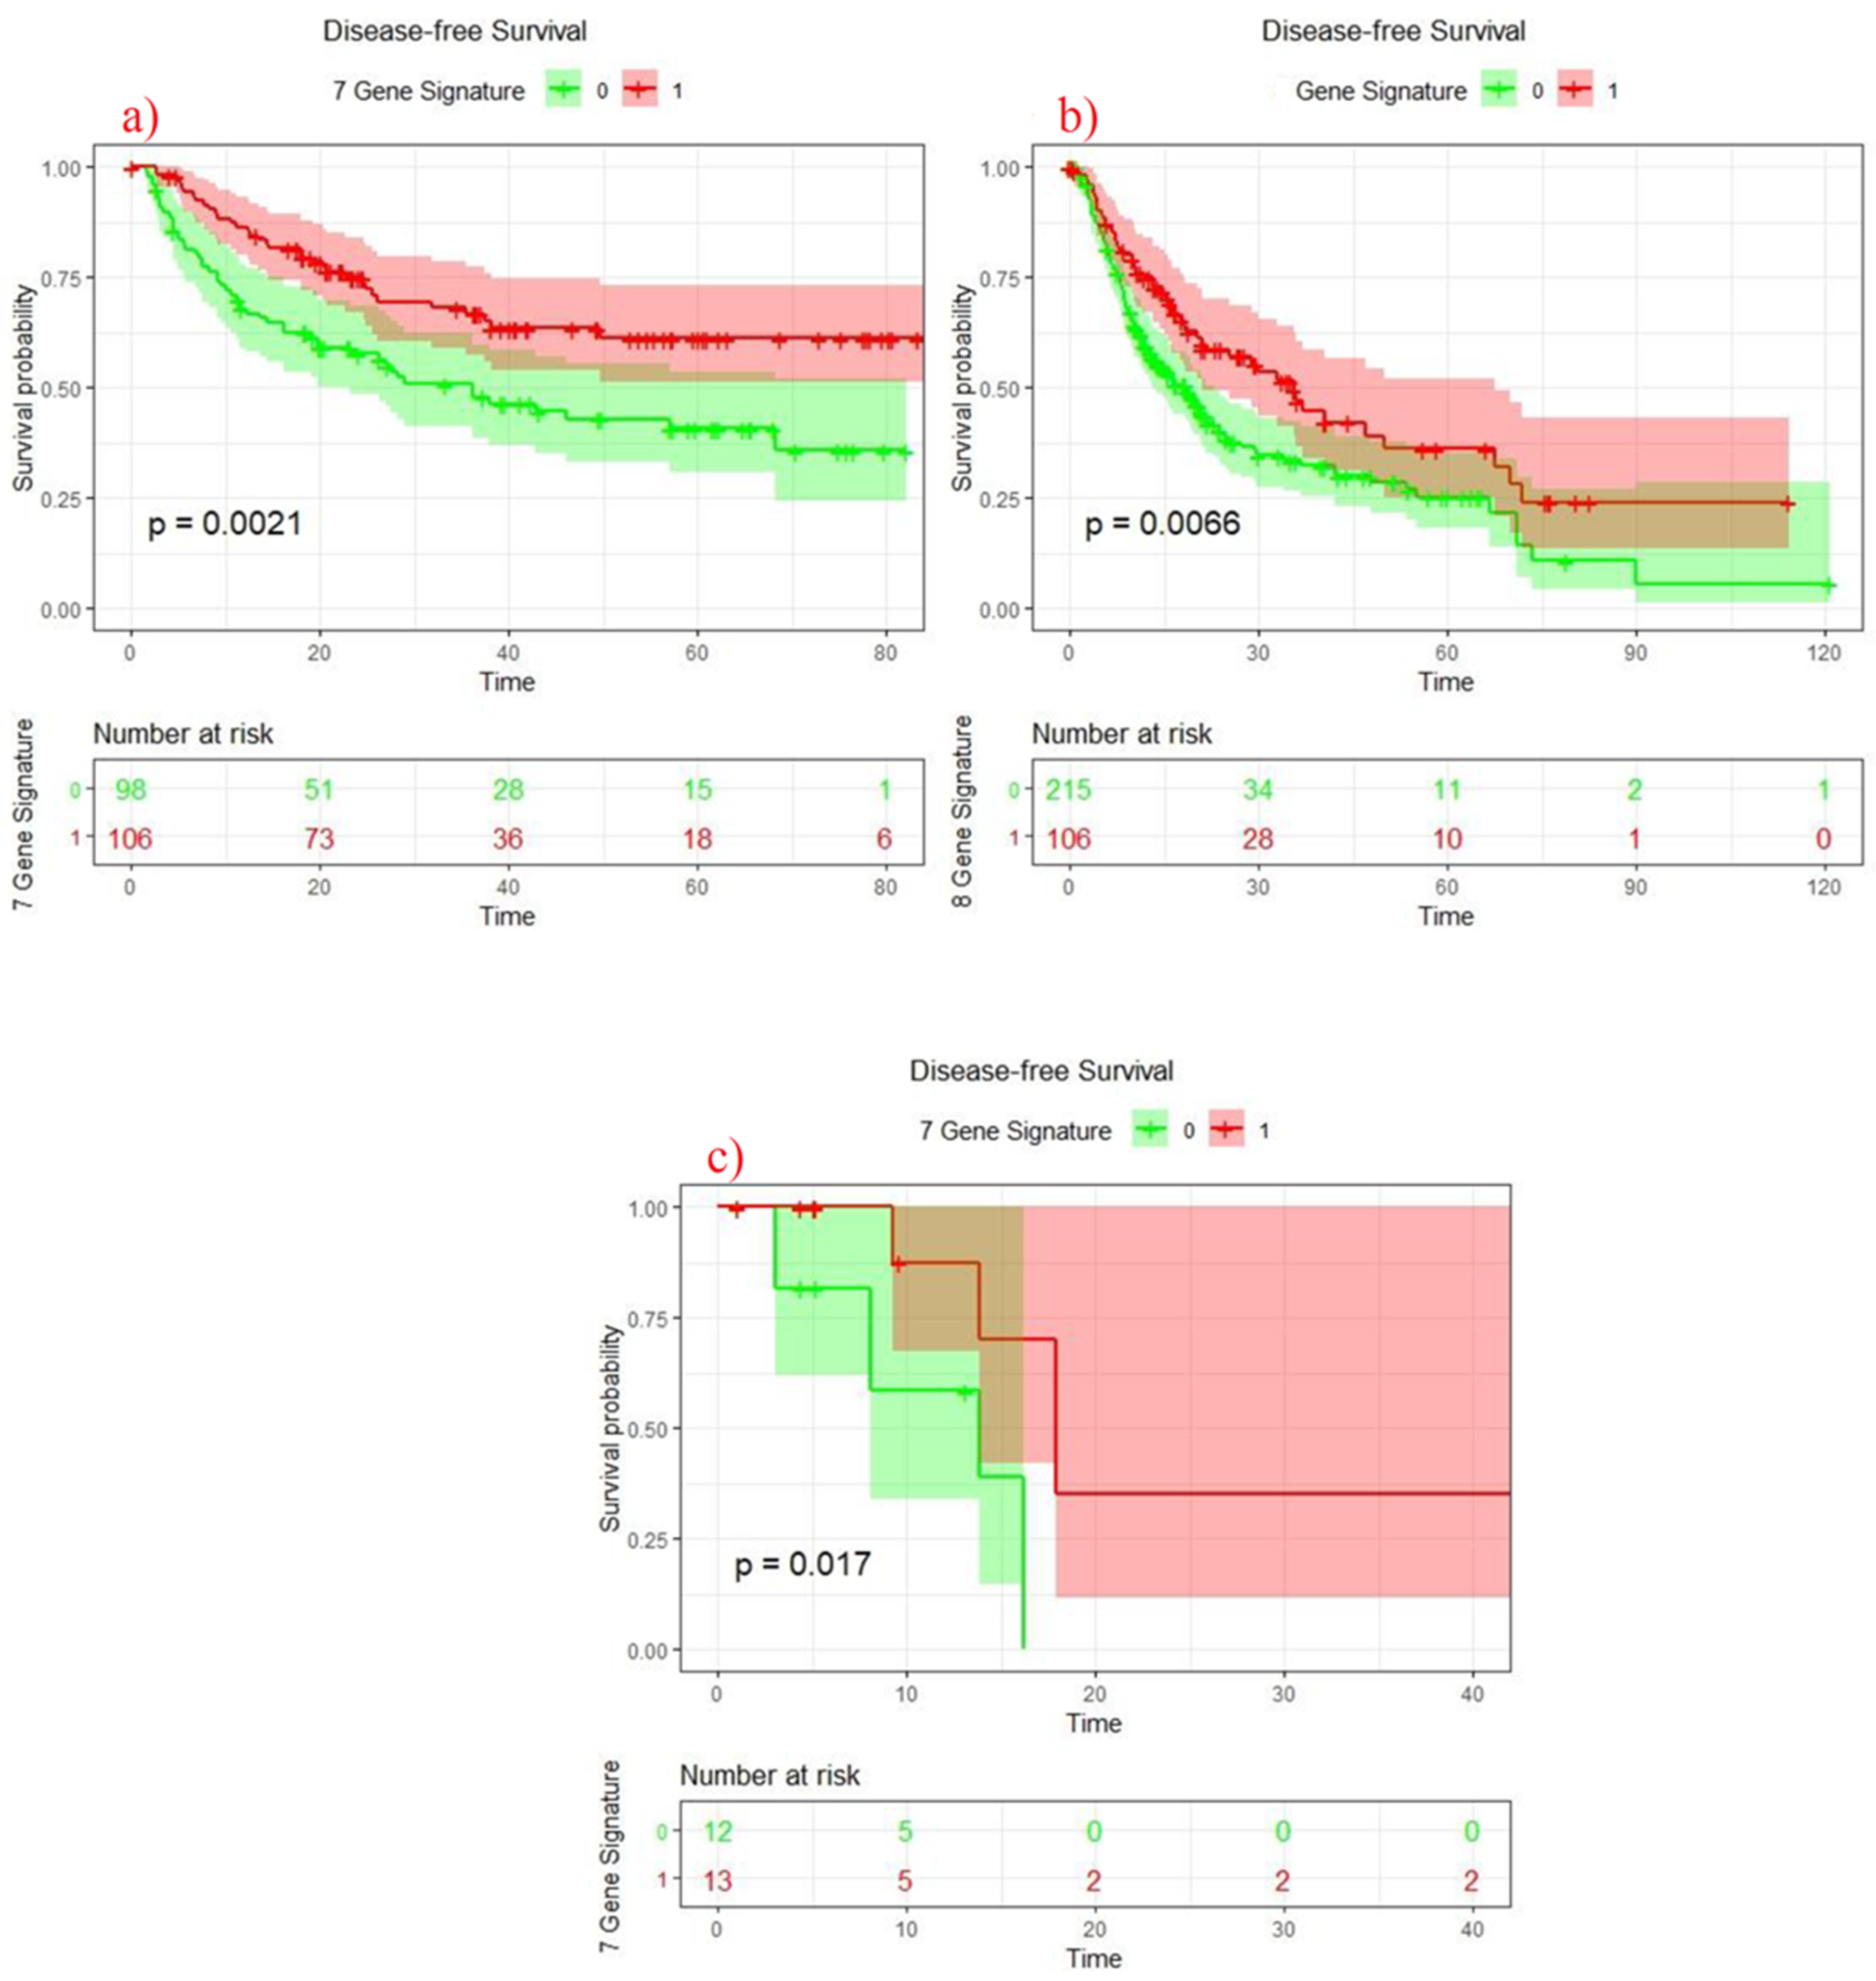
3.6. Survival Analysis of 7 Genes Signature Score

Lastly, after identifying the significance of these seven MHC linked genes at multiple genetic and prognostic levels, we generated a score based on the mean expression of all significant genes. Interestingly, Kaplan–Meier survival analysis revealed that upregulation of seven gene signature in both cohorts (Discovery p = 0.0021) and (Validation p = 0.0066) showed improved disease-free survival in HCC patients (Figure 4a,b). Of note, we also downloaded another HCC expression cohort (ID: GSE45114) to further establish the association between seven gene signature and disease recurrence. Interestingly, after gene signature score estimation, we identified that upregulation of seven gene signature showed association with increased DFS of HCC patients (p = 0.017) (Figure 4c).

3.7. COX Regression Survival Analysis in Discovery and Validation Cohorts

Next, to further evaluate whether 7-gene signature may act as an independent biomarker for DFS, cox regression analysis was performed. According to multivariate analysis results of discovery cohort, disease free survival was positively associated (i.e., Hazard Ratio (HR) < 1) with 7-gene signature (HR 0.454, CI 0.291–0.710, p = 0.001), AFP (HR 0.573, CI 0.352–0.935, p = 0.026), while negatively associated (i.e., HR > 1) with tumor number (HR 5.895, CI 2.621–13.259, p = 0.000) (Table 3). Furthermore, according to multivariate analysis results validation cohort, 7-gene signature (HR 0.598, CI 0.390–0.917, p = 0.018) and HBV (HR 0.608, CI 0.403–0.920, p = 0.018) were positively associated with DFS, while tumor stage (HR 1.874, CI 1.248–2.814, p = 0.002) was negatively associated with DFS of HCC patients (Table 4).
Overall, the results depicted that HLA genes are significantly associated with delayed tumor recurrence. In addition, HLA linked gene signature was found to be an independent prognostic marker for delayed recurrence in three independent HCC datasets.

4. Discussion

Clinically, HCC is one of the most challenging cancers with an increasing mortality rate. In order to improve patient prognosis, the focus of HCC is gradually transforming from treatment to boosting host immune response [24,25]. Hence, identification of potential biomarkers for devising new immunotherapies and boosting patient prognosis are the prime focus of the study. In this study, using RNA-seq data of 576 HCC patients, a panel of seven genes (including LCP2, TYROBP, ZAP70, PTPRC, FYN, WAS and NCF4) has been identified which are independent predictors of delayed tumor recurrence and improved patient prognosis.
According to the statistical analysis results, several HLA genes (including HLA-A, HLA-C, HLA-E, HLA-F, HLA-G, HLA-L, HLA-DMB, HLA-DQA2 and HLA-DRA) showed association with different clinicopathological features in both HCC cohorts. Recent studies demonstrated the linkage of all MHC classes with HCC prognosis [26]. Interestingly, according to our results, HLA-E, HLA-DMA, HLA-DMB, HLA-DOA and HLA-DRB6 showed association with improved disease-free survival in both cohorts, emphasizing the need to investigate the functional implications of HLA expression in HCC using pre-clinical and clinical studies.
Interestingly, our study showed strong association of five HLA genes (including HLA-DMA, HLA-DMB, HLA-DOA, HLA-DRB6 and HLA-E) with delayed tumor recurrence in both cohorts. Previous studies have demonstrated aberrant expression of HLA class II components in epithelial ovarian cancer cells [27]. Consistent with our findings, HLA-DMB expression in ovarian cancer epithelial cells was associated with CD8 T cell infiltration and a marked improvement in disease survival [27]. Similarly, a recent study showed decreased expression of HLA-DMA, HLA-DMB and HLA-DOA in HBV associated HCC patients [26]. In a recent study, HLA-DRB6 was found to be upregulated among cervical cancer tissues and cell line data [28]. Additionally, a decreased expression of HLA-DRB6 was also reported in HCC patients compared to non-tumor liver tissues [26,29]. Furthermore, a cell line based study suggested that the upregulation of HLA-E represents a mechanism of tumor escape from NK cytotoxicity in ovarian cancer and melanoma [30]. Additionally, dysregulation of HLA-E expression and genetic mutations are also previously reported in HCC. However, the clear mechanism of how HLA-E affects tumor environment is largely unknown.
Recently, reactivation of the T cell receptor (TCR) signaling pathway gained focus in HCC [31,32]. Interestingly, most of the HLA linked genes identified in our study work in concordance to modulate TCR signaling, except NCF4. For instance, activation of CD3 heterodimer complex (TCR-CD3) on T cell membrane stimulates ZAP70 responsible for both recruitment and phosphorylation of numerous downstream adaptors proteins. Two main substrates for ZAP70 are linked for the activation of T cells (LAT) and LCP-2/SLP-76 [33]. Interestingly, ZAP70 influences calcium mobilization (via PL-Cγ1) and ras activation (via GRB2) by interacting with LAT, while for cytoskeleton rearrangement (via VAV1), LCP-2 complex plays a pivotal role. Regulation of these signaling cascades sets the threshold of activation of naive T cells so that they are not activated by self-peptide-MHC complexes but respond only to foreign peptide–MHC complex [34]. This signaling triggers Rho family GTPases (Rac1 and Rac2), leading to actin polymerization via Wiskott–Aldrich syndrome protein (WASP) and ARP2-ARP3 complex. This structural rearrangement is desired for both recognition and induction of cytotoxic effect on APC cells. Hence, enhanced LCP-2 significantly boosts cell mediated immune response. Involvement of LCP-2 as the key mediator responsible for enhanced T cell activation and immune function is already known [35].
Additionally, several co-stimulatory factors also regulate maturation of naive T-cells. TCR-CD3 complex also activates Src family kinase members (Lck and Fyn), leading to activation of several signaling pathways, such as the ERK pathway [36]. Interestingly, FYN irrespective of Lck can also stimulate the ERK pathway while PTPRC (CD45) maintains dephosphorylated form at Tyr505 of C-terminal residues of Lck and Fyn retaining their active conformation inside cell [37]. Of note, TYROBP is also previously identified as a substrate of PTPRC gene in TCR signaling [38].
Of note, these seven genes were linked with different cancers in previous studies. For instance, LCP2 expression was linked with improved survival in breast and ovarian cancer [39]. Similarly, ZAP70, PTPRC, FYN and WASP2 were found to be dysregulated in different cancers including breast, leukemia, colorectal cancer, etc. [40,41,42,43]. However, none of the studies showed any linkage of these seven genes with delayed tumor recurrence in HCC. Our integrated approach provided a novel insight in predicting new prognostic subtypes of HCC. However, due to the sparsity of the high throughput sequencing data and mixture of HBV and HCV infected patients, further in-vitro and in-vivo studies are warranted to evaluate the effect of HBV/HCV infection before consideration of gene signature in clinical practice.
In conclusion, our data suggests that the seven gene signature can boost immune response in HCC patients by mainly regulating TCR signaling. Earlier studies showed that TCR associated immunotherapies are also emerging as new treatment options against HCC. Interestingly, we demonstrated that despite the substantial heterogeneity of HCC at the genomic level, whole transcriptomic data analysis is an excellent strategy to identify new biomarkers for improving HCC prognosis. Of note, this immune related signature is also validated in three independent cohorts, suggesting it as a potential biomarker for HCC patients worldwide.

Supplementary Materials

The following are available online at https://www.mdpi.com/article/10.3390/jpm11111129/s1, Figure S1: Hierarchical clustering of 505 gene signature in discovery and validation cohorts of HCC patients based on upregulation and downregulation of HLA-DMA, HLA-DMB, HLA-DRB6, HLA-DOA, HLA-E (colored bar red for upregulation and yellow for downregulation), Figure S2: GeneMania interaction network of 40 genes signature and HLA-DMA, HLA-DMB, HLA-DRB6, HLA-DOA, HLA-E with co-expression, colocalization and pathways, Figure S3: Network of 40 genes signature and HLA-DMA, HLA-DMB, HLA-DRB6, HLA-DOA, HLA-E. Network shows top 10 hub genes based on (A): Degree measure, (B): MCC, (C): Betweenness, (D): Closeness, (E): Bottleneck, Table S1: Clinicopathological characteristics of Discovery cohort (204 HCC patients), Table S2: Clinicopathological characteristics of Validation cohort (372 HCC patients), Table S3: Association of expression of HLA genes with clinical features in Discovery cohort, Table S4: Association of expression of HLA genes with clinical features in Validation cohort, Table S5: MHC gene and their correlated gene list, Table S6: Gene name and chromosomal location of 40 unique genes.

Author Contributions

Conceptualization, S.K. and F.H.; Data curation, M.F.A.M. and F.H.; Formal analysis, F.T., W.K. and W.A.; Funding acquisition, S.K.; Investigation, W.K., M.K., S.S. and S.H.; Supervision, F.H.; Validation, W.K., S.K.R., S.H., M.F.A.M. and M.J.I.; Visualization, M.F.A.M. and F.H.; Writing—original draft, F.T., W.K., M.F.A.M. and F.H.; Writing—review and editing, W.K., M.J.I. and F.H. All authors have read and agreed to the published version of the manuscript.

Funding

This research has been funded by Scientific Research Deanship at University of Ha’il–Saudi Arabia through Project Number RG-20011.

Institutional Review Board Statement

All procedures performed in studies involving human participants were in accordance with the ethical standards of the institutional and national research committee and with the 1964 Helsinki declaration and its later amendments or comparable ethical standards ((IRB # 2012–0389, ASAN Medical Center, Korea), (COMSATS University Islamabad (CIIT/Bio/ERB/16/21)).

Informed Consent Statement

Informed consent was obtained from all subjects involved in the study.

Data Availability Statement

Multiple publicly available datasets are used in the study. The details are provided in the methodology section where necessary.

Conflicts of Interest

The authors declare no conflict of interest.

References

  1. Chen, C.-T.; Lee, H.-L.; Chiou, H.-L.; Chou, C.-H.; Wang, P.-H.; Yang, S.-F.; Chou, Y.-E. Impacts of WNT1-Inducible Signaling Pathway Protein 1 Polymorphism on Hepatocellular Carcinoma Development. PLoS ONE 2018, 13, e0198967. [Google Scholar] [CrossRef] [PubMed] [Green Version]
  2. Bosch, F.X.; Ribes, J.; Cléries, R.; Díaz, M. Epidemiology of Hepatocellular Carcinoma. Clin. Liver Dis. 2005, 9, 191–211. [Google Scholar] [CrossRef] [PubMed]
  3. Charles, A.; Janeway, J.; Travers, P.; Walport, M.; Shlomchik, M.J. The Major Histocompatibility Complex and Its Functions. In Immunobiology: The Immune System in Health and Disease, 5th ed.; Garland Science: New York, NY, USA, 2001. [Google Scholar]
  4. Choo, S.Y. The HLA System: Genetics, Immunology, Clinical Testing, and Clinical Implications. Yonsei Med. J. 2007, 48, 11–23. [Google Scholar] [CrossRef] [PubMed] [Green Version]
  5. Swets, M.; König, M.H.; Zaalberg, A.; Dekker-Ensink, N.G.; Gelderblom, H.; van de Velde, C.J.H.; van den Elsen, P.J.; Kuppen, P.J.K. HLA-G and Classical HLA Class I Expression in Primary Colorectal Cancer and Associated Liver Metastases. Hum. Immunol. 2016, 77, 773–779. [Google Scholar] [CrossRef]
  6. Krijgsman, D.; Roelands, J.; Hendrickx, W.; Bedognetti, D.; Kuppen, P.J.K. HLA-G: A New Immune Checkpoint in Cancer? Int. J. Mol. Sci. 2020, 21, 4528. [Google Scholar] [CrossRef]
  7. Sliker, B.H.; Goetz, B.T.; Barnes, R.; King, H.; Maurer, H.C.; Olive, K.P.; Solheim, J.C. HLA-B Influences Integrin Beta-1 Expression and Pancreatic Cancer Cell Migration. Exp. Cell Res. 2020, 390, 111960. [Google Scholar] [CrossRef]
  8. Ben Yahia, H.; Boujelbene, N.; Babay, W.; Ben Safta, I.; Dhouioui, S.; Zemni, I.; Ali Ayadi, M.; Charfi, L.; Ouzari, H.I.; Rebmann, V.; et al. Expression Analysis of Immune-Regulatory Molecules HLA-G, HLA-E and IDO in Endometrial Cancer. Hum. Immunol. 2020, 81, 305–313. [Google Scholar] [CrossRef]
  9. Najafimehr, H.; Hajizadeh, N.; Nazemalhosseini-Mojarad, E.; Pourhoseingholi, M.A.; Abdollahpour-Alitappeh, M.; Ashtari, S.; Zali, M.R. The Role of Human Leukocyte Antigen Class I on Patient Survival in Gastrointestinal Cancers: A Systematic Review and Meta- Analysis. Sci. Rep. 2020, 10, 728. [Google Scholar] [CrossRef] [Green Version]
  10. Kaneko, K.; Ishigami, S.; Kijima, Y.; Funasako, Y.; Hirata, M.; Okumura, H.; Shinchi, H.; Koriyama, C.; Ueno, S.; Yoshinaka, H.; et al. Clinical Implication of HLA Class I Expression in Breast Cancer. BMC Cancer 2011, 11, 454. [Google Scholar] [CrossRef]
  11. He, Y.; Rozeboom, L.; Rivard, C.J.; Ellison, K.; Dziadziuszko, R.; Yu, H.; Zhou, C.; Hirsch, F.R. MHC Class II Expression in Lung Cancer. Lung Cancer 2017, 112, 75–80. [Google Scholar] [CrossRef]
  12. Park, I.A.; Hwang, S.-H.; Song, I.H.; Heo, S.-H.; Kim, Y.-A.; Bang, W.S.; Park, H.S.; Lee, M.; Gong, G.; Lee, H.J. Expression of the MHC Class II in Triple-Negative Breast Cancer Is Associated with Tumor-Infiltrating Lymphocytes and Interferon Signaling. PLoS ONE 2017, 12, e0182786. [Google Scholar] [CrossRef] [PubMed]
  13. Xie, Y.; Xiang, Y.; Sheng, J.; Zhang, D.; Yao, X.; Yang, Y.; Zhang, X. Immunotherapy for Hepatocellular Carcinoma: Current Advances and Future Expectations. J. Immunol. Res. 2018, 2018. [Google Scholar] [CrossRef]
  14. Lee, M.-H.; Huang, Y.-H.; Chen, H.-Y.; Khor, S.-S.; Chang, Y.-H.; Lin, Y.-J.; Jen, C.-L.; Lu, S.-N.; Yang, H.-I.; Nishida, N.; et al. Human Leukocyte Antigen Variants and Risk of Hepatocellular Carcinoma Modified by Hepatitis C Virus Genotypes: A Genome-Wide Association Study. Hepatology 2018, 67, 651–661. [Google Scholar] [CrossRef] [PubMed]
  15. Li, S.; Qian, J.; Yang, Y.; Zhao, W.; Dai, J.; Bei, J.-X.; Foo, J.N.; McLaren, P.J.; Li, Z.; Yang, J.; et al. GWAS Identifies Novel Susceptibility Loci on 6p21.32 and 21q21.3 for Hepatocellular Carcinoma in Chronic Hepatitis B Virus Carriers. PLoS Genet 2012, 8. [Google Scholar] [CrossRef] [PubMed]
  16. Sawai, H.; Nishida, N.; Khor, S.-S.; Honda, M.; Sugiyama, M.; Baba, N.; Yamada, K.; Sawada, N.; Tsugane, S.; Koike, K.; et al. Genome-Wide Association Study Identified New Susceptible Genetic Variants in HLA Class I Region for Hepatitis B Virus-Related Hepatocellular Carcinoma. Sci. Rep. 2018, 8, 7958. [Google Scholar] [CrossRef]
  17. Wagenaar, T.R.; Zabludoff, S.; Ahn, S.-M.; Allerson, C.; Arlt, H.; Baffa, R.; Cao, H.; Davis, S.; Garcia-Echeverria, C.; Gaur, R.; et al. Anti–MiR-21 Suppresses Hepatocellular Carcinoma Growth via Broad Transcriptional Network Deregulation. Mol. Cancer Res. 2015, 13, 1009–1021. [Google Scholar] [CrossRef] [Green Version]
  18. Ahn, S.-M.; Jang, S.J.; Shim, J.H.; Kim, D.; Hong, S.-M.; Sung, C.O.; Baek, D.; Haq, F.; Ansari, A.A.; Lee, S.Y.; et al. Genomic Portrait of Resectable Hepatocellular Carcinomas: Implications of RB1 and FGF19 Aberrations for Patient Stratification. Hepatology 2014, 60, 1972–1982. [Google Scholar] [CrossRef] [PubMed]
  19. Dobin, A.; Davis, C.A.; Schlesinger, F.; Drenkow, J.; Zaleski, C.; Jha, S.; Batut, P.; Chaisson, M.; Gingeras, T.R. STAR: Ultrafast Universal RNA-Seq Aligner. Bioinformatics 2013, 29, 15–21. [Google Scholar] [CrossRef]
  20. Deng, M.; Brägelmann, J.; Schultze, J.L.; Perner, S. Web-TCGA: An Online Platform for Integrated Analysis of Molecular Cancer Data Sets. BMC Bioinform. 2016, 17, 72. [Google Scholar] [CrossRef] [Green Version]
  21. Ally, A.; Balasundaram, M.; Carlsen, R.; Chuah, E.; Clarke, A.; Dhalla, N.; Holt, R.A.; Jones, S.J.M.; Lee, D.; Ma, Y.; et al. Comprehensive and Integrative Genomic Characterization of Hepatocellular Carcinoma. Cell 2017, 169, 1327–1341.e23. [Google Scholar] [CrossRef] [Green Version]
  22. Murtagh, F.; Legendre, P. Ward’s Hierarchical Clustering Method: Clustering Criterion and Agglomerative Algorithm. J. Classif. 2014, 31, 274–295. [Google Scholar] [CrossRef] [Green Version]
  23. Chin, C.-H.; Chen, S.-H.; Wu, H.-H.; Ho, C.-W.; Ko, M.-T.; Lin, C.-Y. CytoHubba: Identifying Hub Objects and Sub-Networks from Complex Interactome. BMC Syst. Biol. 2014, 8, S11. [Google Scholar] [CrossRef] [PubMed] [Green Version]
  24. Bishayee, A. The Role of Inflammation and Liver Cancer. Adv. Exp. Med. Biol. 2014, 816, 401–435. [Google Scholar] [CrossRef] [PubMed]
  25. Fu, Y.; Liu, S.; Zeng, S.; Shen, H. From Bench to Bed: The Tumor Immune Microenvironment and Current Immunotherapeutic Strategies for Hepatocellular Carcinoma. J. Exp. Clin. Cancer Res. 2019, 38, 396. [Google Scholar] [CrossRef] [Green Version]
  26. Wang, X.-K.; Liao, X.-W.; Yang, C.-K.; Yu, T.-D.; Liu, Z.-Q.; Gong, Y.-Z.; Huang, K.-T.; Zeng, X.-M.; Han, C.-Y.; Zhu, G.-Z.; et al. Diagnostic and Prognostic Biomarkers of Human Leukocyte Antigen Complex for Hepatitis B Virus-Related Hepatocellular Carcinoma. J. Cancer 2019, 10, 5173–5190. [Google Scholar] [CrossRef] [PubMed]
  27. Callahan, M.J.; Nagymanyoki, Z.; Bonome, T.; Johnson, M.E.; Litkouhi, B.; Sullivan, E.H.; Hirsch, M.S.; Matulonis, U.A.; Liu, J.; Birrer, M.J.; et al. Increased HLA-DMB Expression in the Tumor Epithelium Is Associated with Increased CTL Infiltration and Improved Prognosis in Advanced-Stage Serous Ovarian Cancer. Clin. Cancer Res. 2008, 14, 7667–7673. [Google Scholar] [CrossRef] [Green Version]
  28. Roychowdhury, A.; Samadder, S.; Das, P.; Mazumder, D.I.; Chatterjee, A.; Addya, S.; Mondal, R.; Roy, A.; Roychoudhury, S.; Panda, C.K. Deregulation of H19 Is Associated with Cervical Carcinoma. Genomics 2020, 112, 961–970. [Google Scholar] [CrossRef] [PubMed]
  29. Pan, B.; Liu, L.; Li, W. A Prognostic Risk Model Based on Immune-related Genes Predicts Overall Survival of Patients with Hepatocellular Carcinoma. Health Sci. Rep. 2020, 3. [Google Scholar] [CrossRef]
  30. Malmberg, K.-J.; Levitsky, V.; Norell, H.; de Matos, C.T.; Carlsten, M.; Schedvins, K.; Rabbani, H.; Moretta, A.; Söderström, K.; Levitskaya, J.; et al. IFN-γ Protects Short-Term Ovarian Carcinoma Cell Lines from CTL Lysis via a CD94/NKG2A-Dependent Mechanism. J. Clin. Invest. 2002, 110, 1515–1523. [Google Scholar] [CrossRef]
  31. Koh, S.; Shimasaki, N.; Suwanarusk, R.; Ho, Z.Z.; Chia, A.; Banu, N.; Wu Howland, S.; Ong, A.S.M.; Gehring, A.J.; Stauss, H.; et al. A Practical Approach to Immunotherapy of Hepatocellular Carcinoma Using T Cells Redirected Against Hepatitis B Virus. Mol. Ther. Nucleic Acids 2013, 2, e114. [Google Scholar] [CrossRef] [Green Version]
  32. Ma, W.; Wu, L.; Zhou, F.; Hong, Z.; Liu, Z.; Yuan, Y. T Cell–Associated Immunotherapy for Hepatocellular Carcinoma. CPB 2017, 41, 609–622. [Google Scholar] [CrossRef] [PubMed] [Green Version]
  33. Qu, X.; Lan, X.; Deng, C.; Zhou, J.; Du, J.; Huang, S.; Li, Y. Molecular Mechanisms Underlying the Evolution of the Slp76 Signalosome. Sci. Rep. 2017, 7, 1–14. [Google Scholar] [CrossRef] [PubMed] [Green Version]
  34. Courtney, A.H.; Lo, W.-L.; Weiss, A. TCR Signaling: Mechanisms of Initiation and Propagation. Trends Biochem. Sci. 2018, 43, 108–123. [Google Scholar] [CrossRef]
  35. Shui, J.-W.; Boomer, J.S.; Han, J.; Xu, J.; Dement, G.A.; Zhou, G.; Tan, T.-H. Hematopoietic Progenitor Kinase 1 Negatively Regulates T Cell Receptor Signaling and T Cell-Mediated Immune Responses. Nat. Immunol. 2007, 8, 84–91. [Google Scholar] [CrossRef] [PubMed]
  36. zur Hausen, J.D.; Burn, P.; Amrein, K.E. Co-Localization of Fyn with CD3 Complex, CD45 or CD28 Depends on Different Mechanisms. Eur. J. Immunol. 1997, 27, 2643–2649. [Google Scholar] [CrossRef]
  37. Shiroo, M.; Goff, L.; Biffen, M.; Shivnan, E.; Alexander, D. CD45 Tyrosine Phosphatase-Activated P59fyn Couples the T Cell Antigen Receptor to Pathways of Diacylglycerol Production, Protein Kinase C Activation and Calcium Influx. EMBO J. 1992, 11, 4887–4897. [Google Scholar] [CrossRef] [PubMed]
  38. Mason, L.H.; Willette-Brown, J.; Taylor, L.S.; McVicar, D.W. Regulation of Ly49D/DAP12 Signal Transduction by Src-Family Kinases and CD45. J. Immunol. 2006, 176, 6615–6623. [Google Scholar] [CrossRef] [Green Version]
  39. Garg, A.D.; Ruysscher, D.D.; Agostinis, P. Immunological Metagene Signatures Derived from Immunogenic Cancer Cell Death Associate with Improved Survival of Patients with Lung, Breast or Ovarian Malignancies: A Large-Scale Meta-Analysis. OncoImmunology 2016, 5, e1069938. [Google Scholar] [CrossRef] [Green Version]
  40. Landskron, J.; Kraggerud, S.M.; Wik, E.; Dørum, A.; Bjørnslett, M.; Melum, E.; Helland, Ø.; Bjørge, L.; Lothe, R.A.; Salvesen, H.B.; et al. C77G in PTPRC (CD45) Is No Risk Allele for Ovarian Cancer, but Associated with Less Aggressive Disease. PLoS ONE 2017, 12, e0182030. [Google Scholar] [CrossRef] [PubMed] [Green Version]
  41. Frugtniet, B.; Jiang, W.G.; Martin, T.A. Role of the WASP and WAVE Family Proteins in Breast Cancer Invasion and Metastasis. Breast Cancer 2015, 7, 99–109. [Google Scholar] [CrossRef] [Green Version]
  42. Claus, R.; Lucas, D.M.; Ruppert, A.S.; Williams, K.E.; Weng, D.; Patterson, K.; Zucknick, M.; Oakes, C.C.; Rassenti, L.Z.; Greaves, A.W.; et al. Validation of ZAP-70 Methylation and Its Relative Significance in Predicting Outcome in Chronic Lymphocytic Leukemia. Blood 2014, 124, 42–48. [Google Scholar] [CrossRef] [PubMed]
  43. Chen, Z.-Y.; Cai, L.; Zhu, J.; Chen, M.; Chen, J.; Li, Z.-H.; Liu, X.-D.; Wang, S.-G.; Bie, P.; Jiang, P.; et al. Fyn Requires HnRNPA2B1 and Sam68 to Synergistically Regulate Apoptosis in Pancreatic Cancer. Carcinogenesis 2011, 32, 1419–1426. [Google Scholar] [CrossRef] [PubMed] [Green Version]
Figure 1. A detailed workflow of the study.
Jpm 11 01129 g001
Figure 2. Kaplan–Meier estimates of disease-free survival of (a): FYN, (b): LCP2, (c): PTPRC, (d): WAS, (e): ZAP70 expression in HCC patients (Discovery cohort). (f): Kaplan–Meier estimates of overall survival of FYN gene (Discovery cohort).
Jpm 11 01129 g002
Figure 3. Kaplan–Meier estimates of disease-free survival of (a): FYN, (b): LCP2 (c): PTPRC, (d): WAS, (e): ZAP70 expression in HCC patients (Validation cohort) (f): Kaplan–Meier estimates of overall survival of FYN expression in HCC patients (Validation cohort).
Jpm 11 01129 g003
Figure 4. Survival analysis of seven genes signature ((a): Discovery cohort, (b): Validation cohort and (c): GSE45114 dataset).
Jpm 11 01129 g004
Table 1. Association of expression of 7 genes signature with clinical features in Discovery cohort.
Gene IDAge
(Age < 60)
Tumor Size
(Size < 5)
Edmonson Grade
(Advance)
Microvascular Invasion
(Negative)
AFP LevelOverall Survival
(Better)
Disease Free Survival
(Delayed)
FYN-Upregulation-UpregulationUpregulation(High)Upregulation -Upregulation
LCP2-Upregulation-Upregulation--Upregulation
NCF4-UpregulationUpregulation----
PTPRC-Upregulation-UpregulationUpregulation(Low)-Upregulation
TYROBPUpregulation-Upregulation----
WASUpregulationUpregulation----Upregulation
ZAP70-Upregulation-UpregulationUpregulation(Low)-Upregulation
Table 2. Association of expression of seven genes signature with clinical features (Validation cohort).
Gene IDSex
(Male)
Grade
(Early)
HCV
(Negative)
AFP Level
(Low)
Alcohol Consumption
(High)
Tumor Stages
(Early)
Overall Survival
(Better)
Disease Free Survival
(Delayed)
FYNUpregulationUpregulation-Upregulation--Upregulation-Upregulation
LCP2-------Upregulation
NCF4--Upregulation-Upregulation---
PTPRC-------Upregulation
TYROBP----Upregulation---
WAS--Upregulation-UpregulationUpregulation-Upregulation
ZAP70--Upregulation-UpregulationUpregulationUpregulationUpregulation
Table 3. Cox Regression Analysis for disease free survival (Discovery cohort).
Univariate AnalysisMultivariate Analysis
BSEWaldSig.Exp(B)95.0% CI for Exp(B)BSEWaldSig.HR95.0% CI for Exp(B)
LowerUpperLowerUpper
7GeneSignature−0.6650.2219.0750.0030.5140.3340.793−0.7890.22811.9830.0010.4540.2910.710
AFP high/low−0.5090.2384.5840.0320.6010.3770.958−0.5560.2494.9800.0260.5730.3520.935
Size0.4610.2224.2980.0381.5861.0262.453-------
Tumor Number1.4400.37514.7100.0004.2212.0228.8101.7740.41418.4030.0005.8952.62113.259
Table 4. Cox Regression Analysis for disease free survival (Validation cohort).
Univariate AnalysisMultivariate Analysis
BSEWaldSig.Exp(B)95.0% CI for Exp(B)BSEWaldSig.HR95.0% CI for Exp(B)
LowerUpperLowerUpper
7GeneSignature−0.4500.1677.2470.0070.6380.4600.885−0.5140.2185.5630.0180.5980.3900.917
HBV−0.6640.18013.5920.0000.5150.3610.733−0.4970.2115.5610.0180.6080.4030.920
Metastasis1.5810.5927.1340.0084.8621.52315.516-------
T-stage0.8340.16326.0380.0002.3021.6713.1700.6280.2079.1810.0021.8741.2482.814
Publisher’s Note: MDPI stays neutral with regard to jurisdictional claims in published maps and institutional affiliations.

