
Is Hyperspectral Imaging Suitable for Assessing Collateral Circulation Prior Radial Forearm Free Flap Harvesting? Comparison of Hyperspectral Imaging and Conventional Allen’s Test

 ,
, 
Abstract
:1. Introduction
2. Materials and Methods
2.1. Patients
2.2. Methods
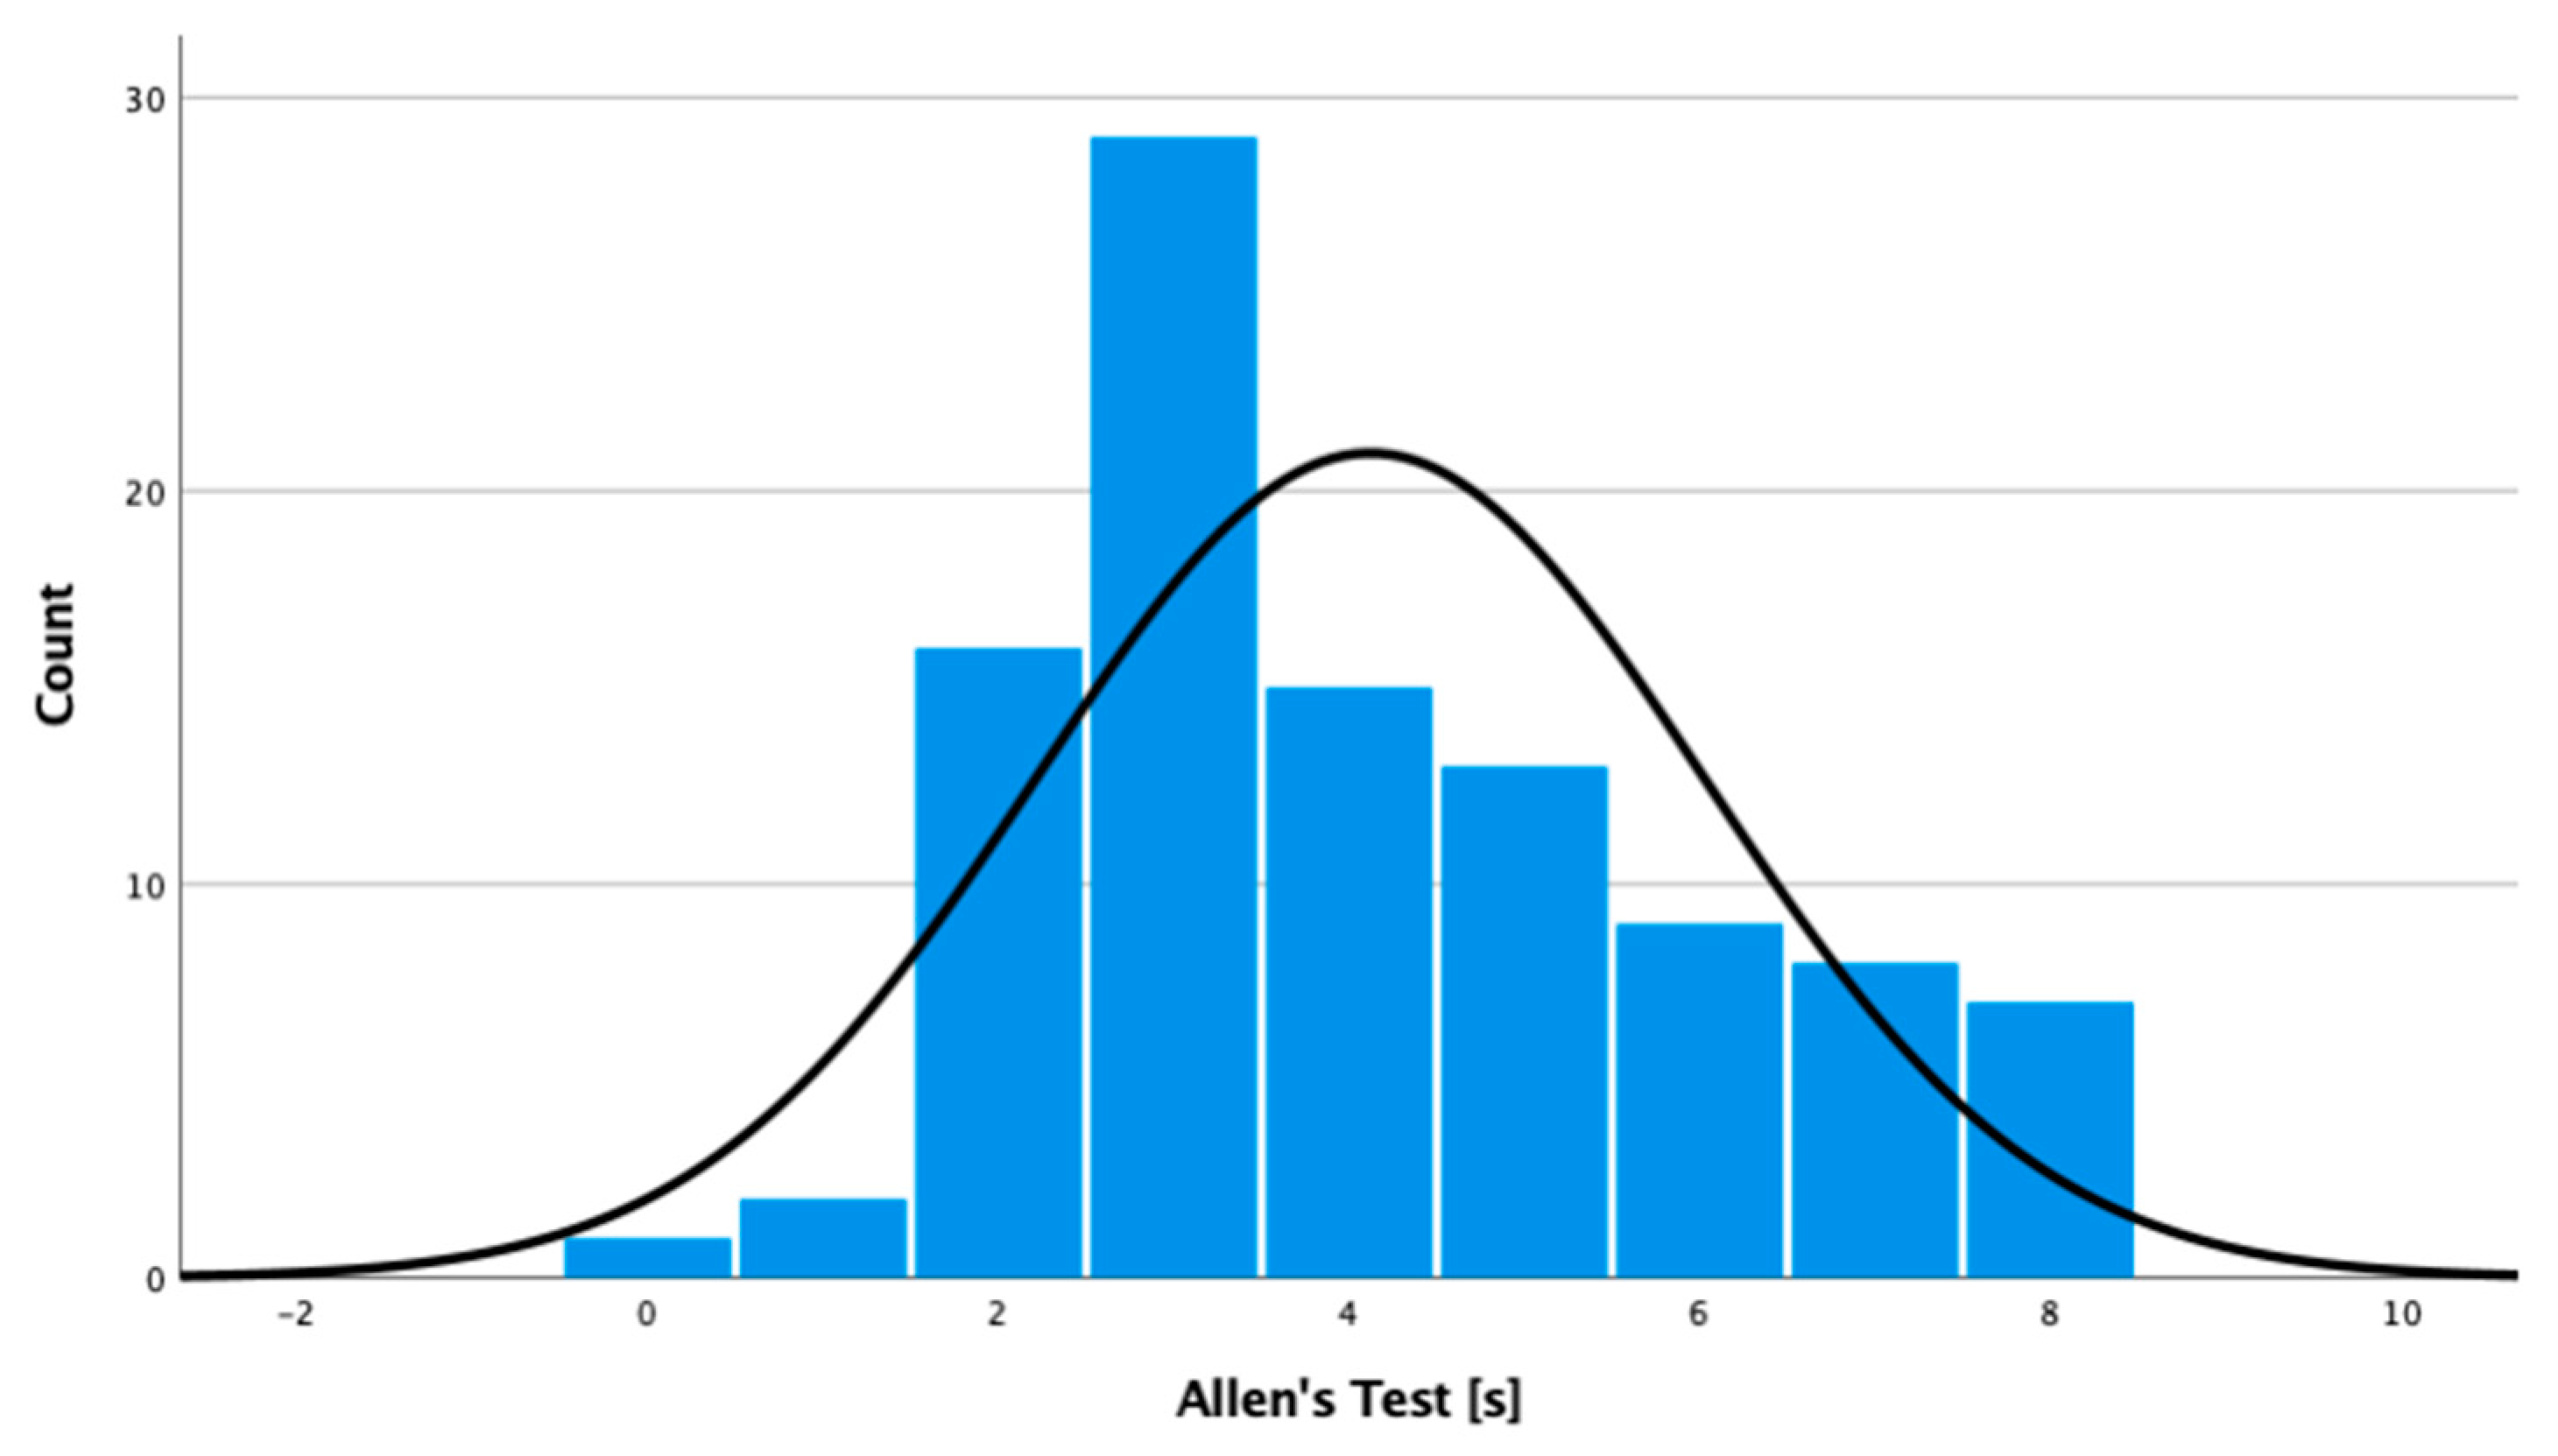
2.2.1. Allen’s Test
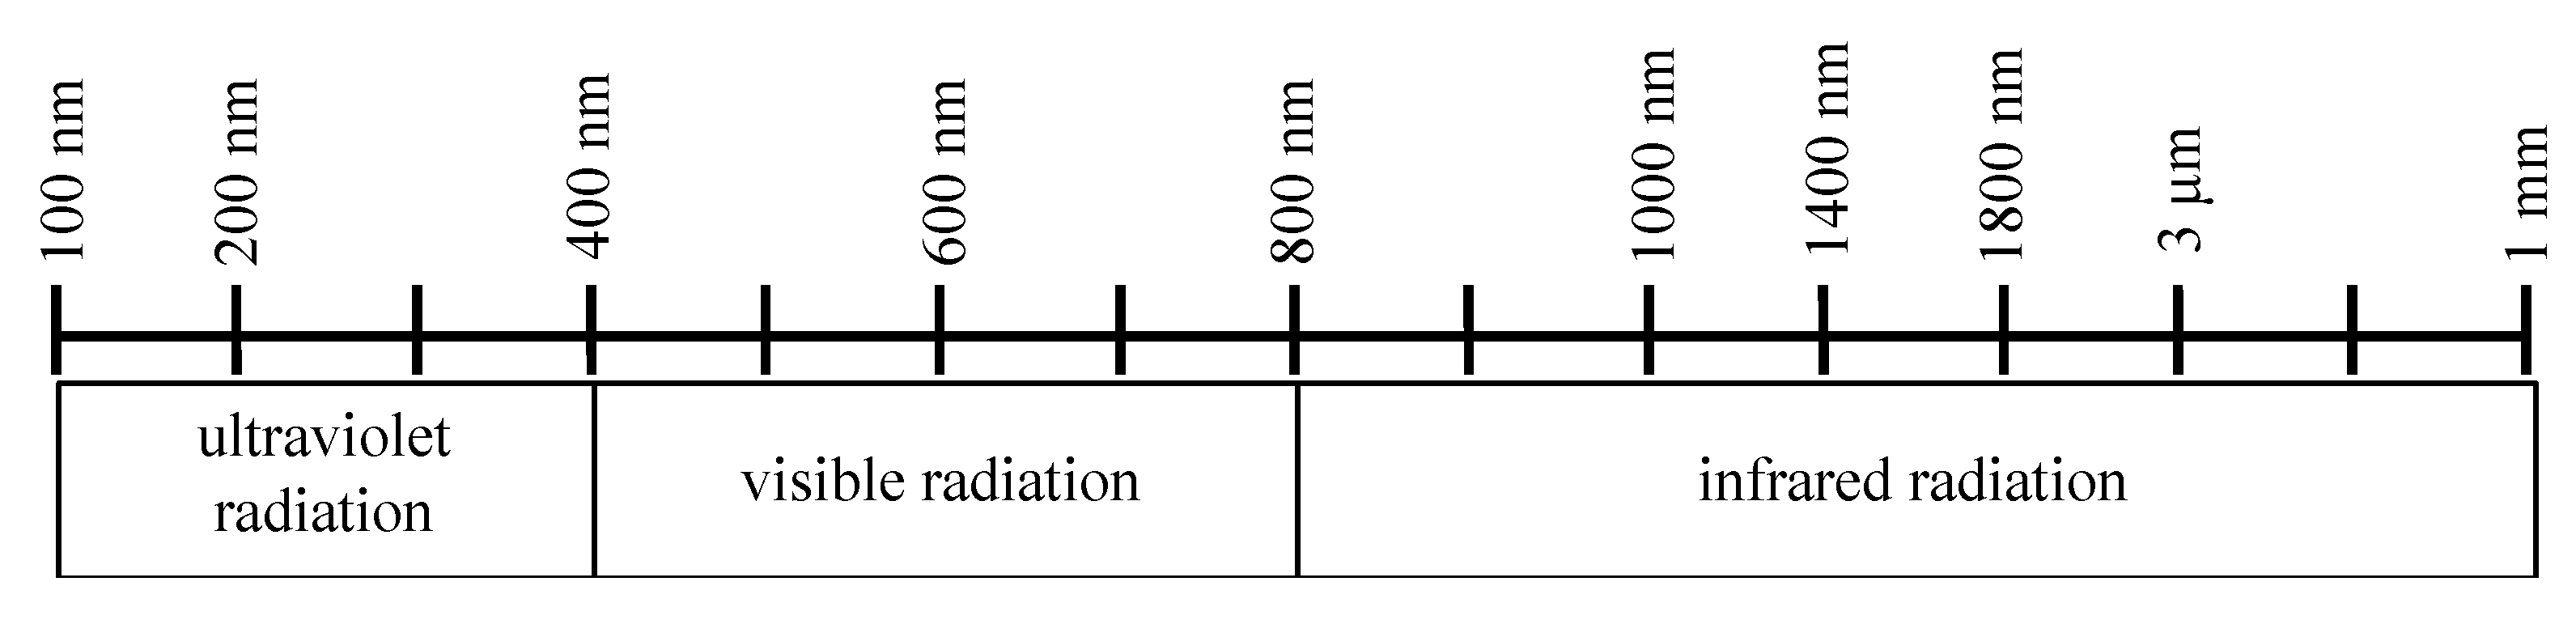
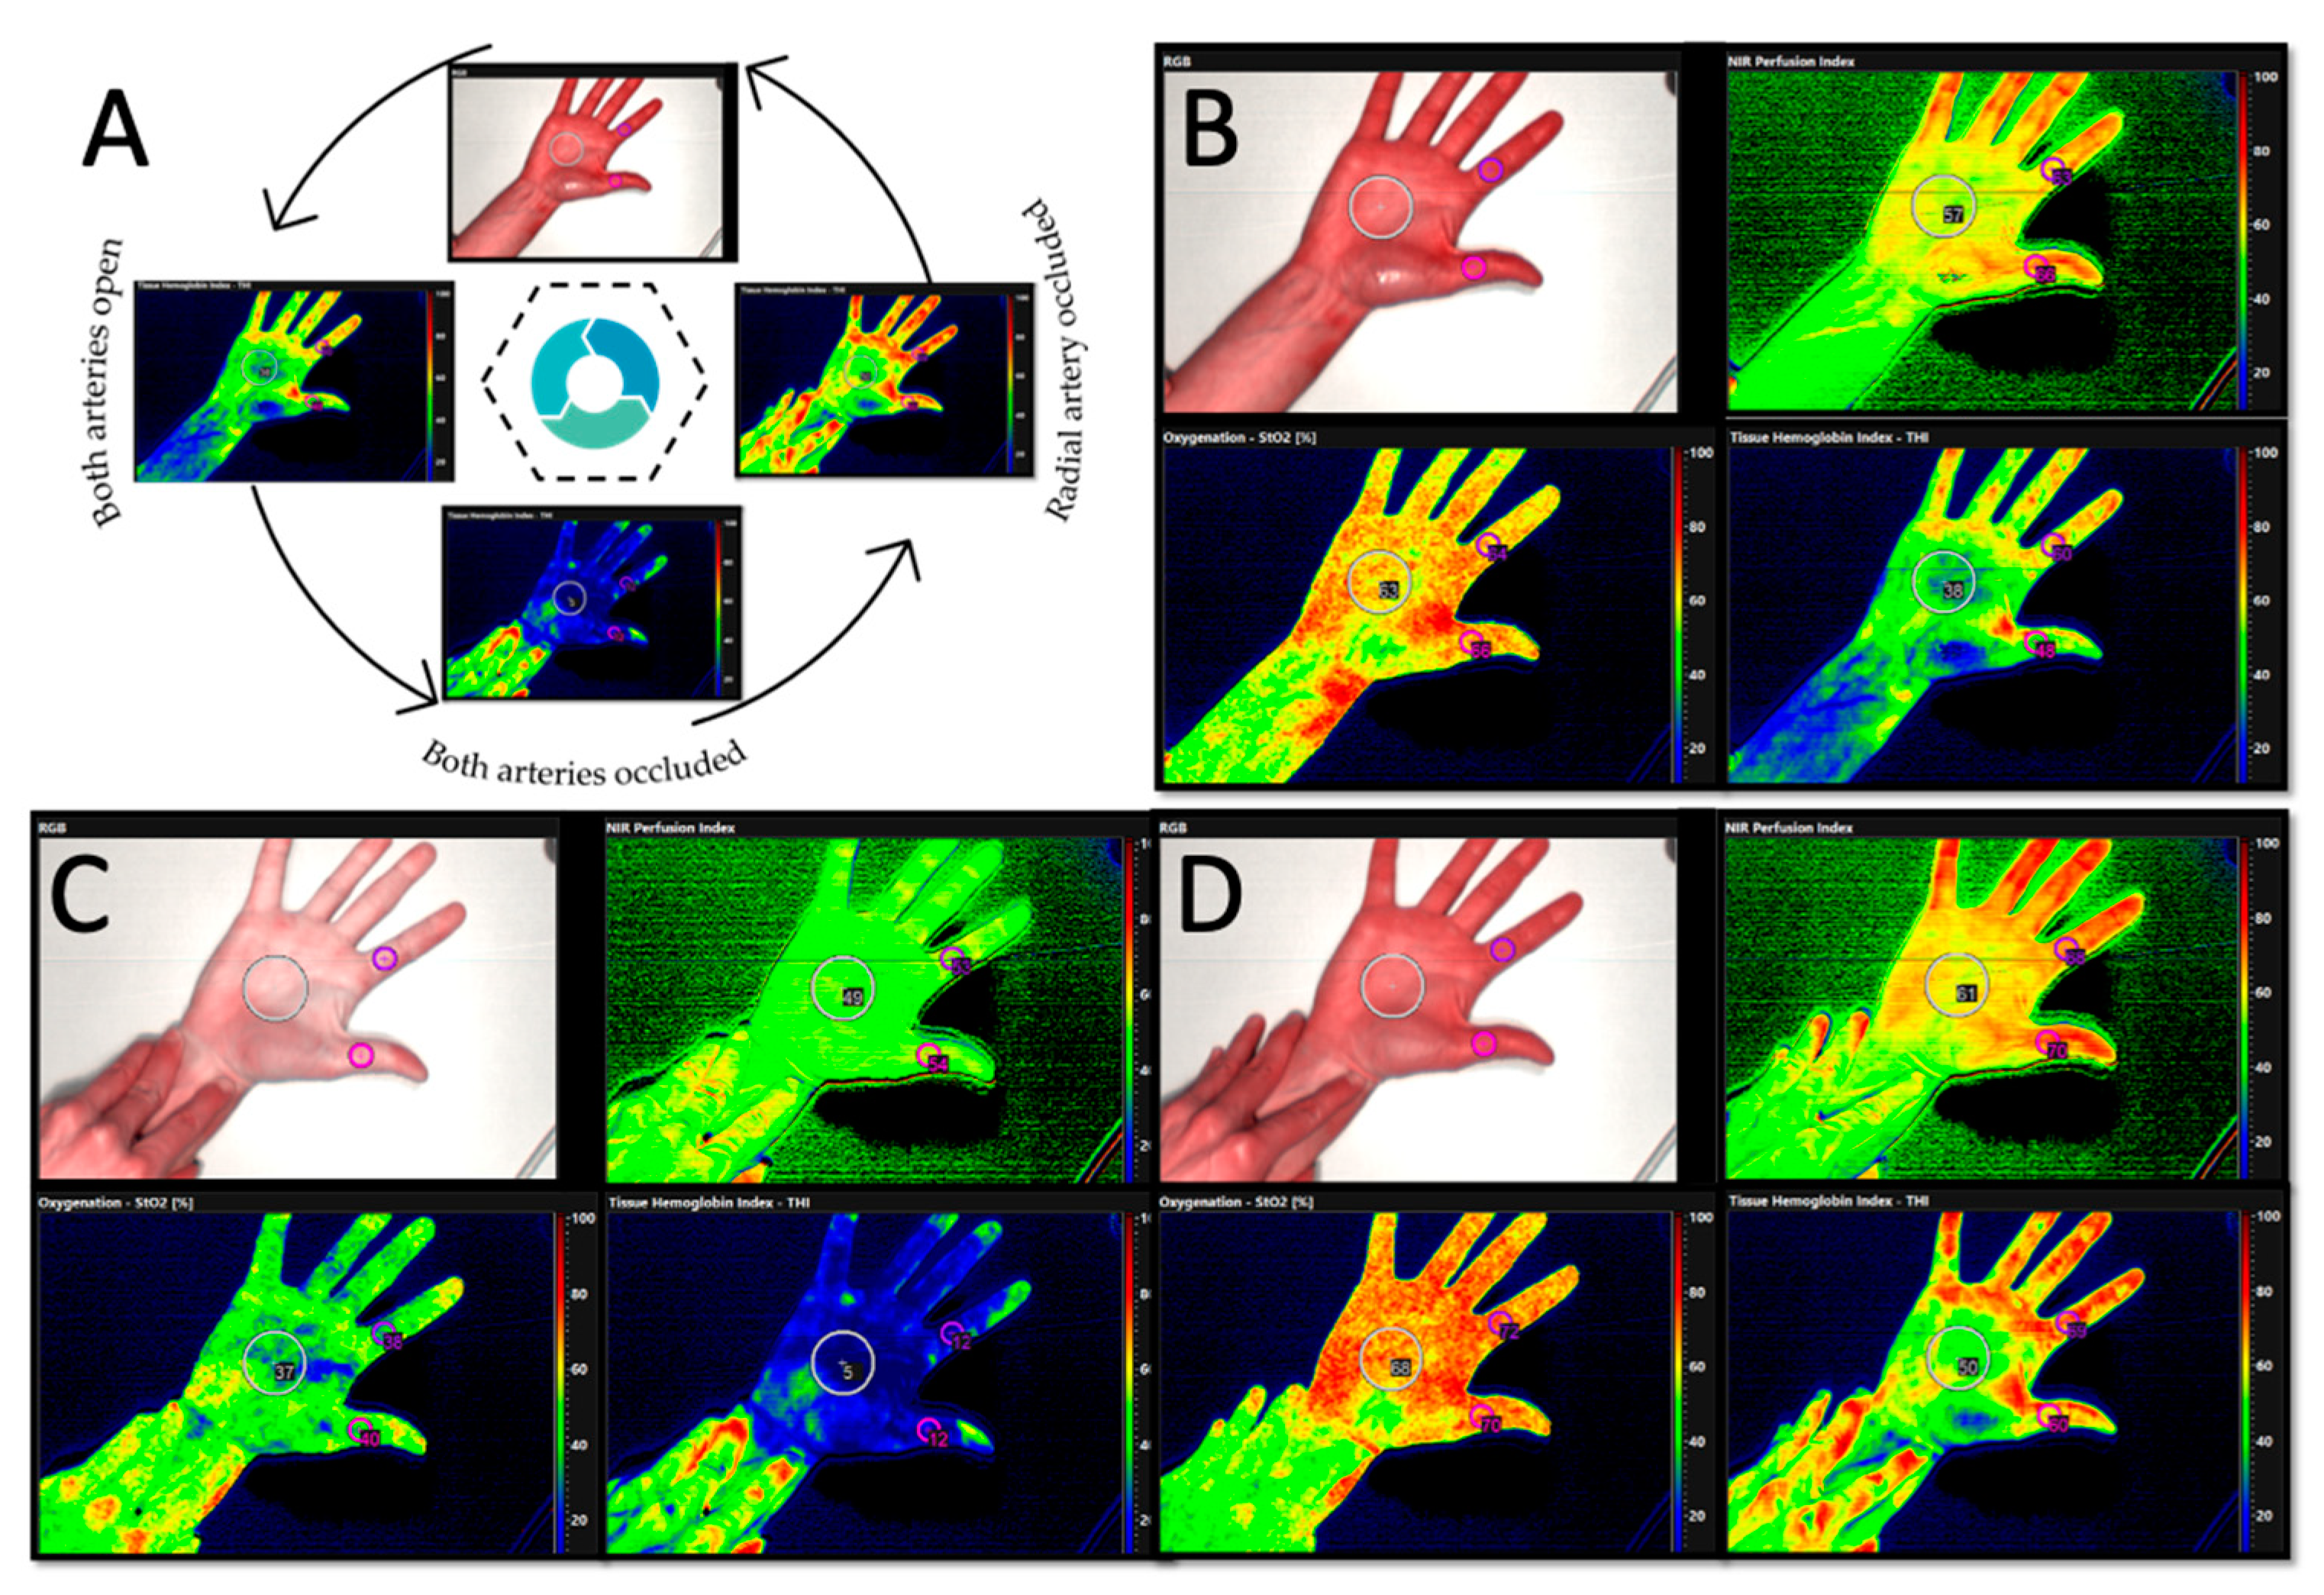
2.2.2. HSI Imaging
2.3. Statistics
3. Results
3.1. Population with a Non-Pathological Modified Allen’s Test
Allen’s Test
3.2. Hyperspectral Imaging
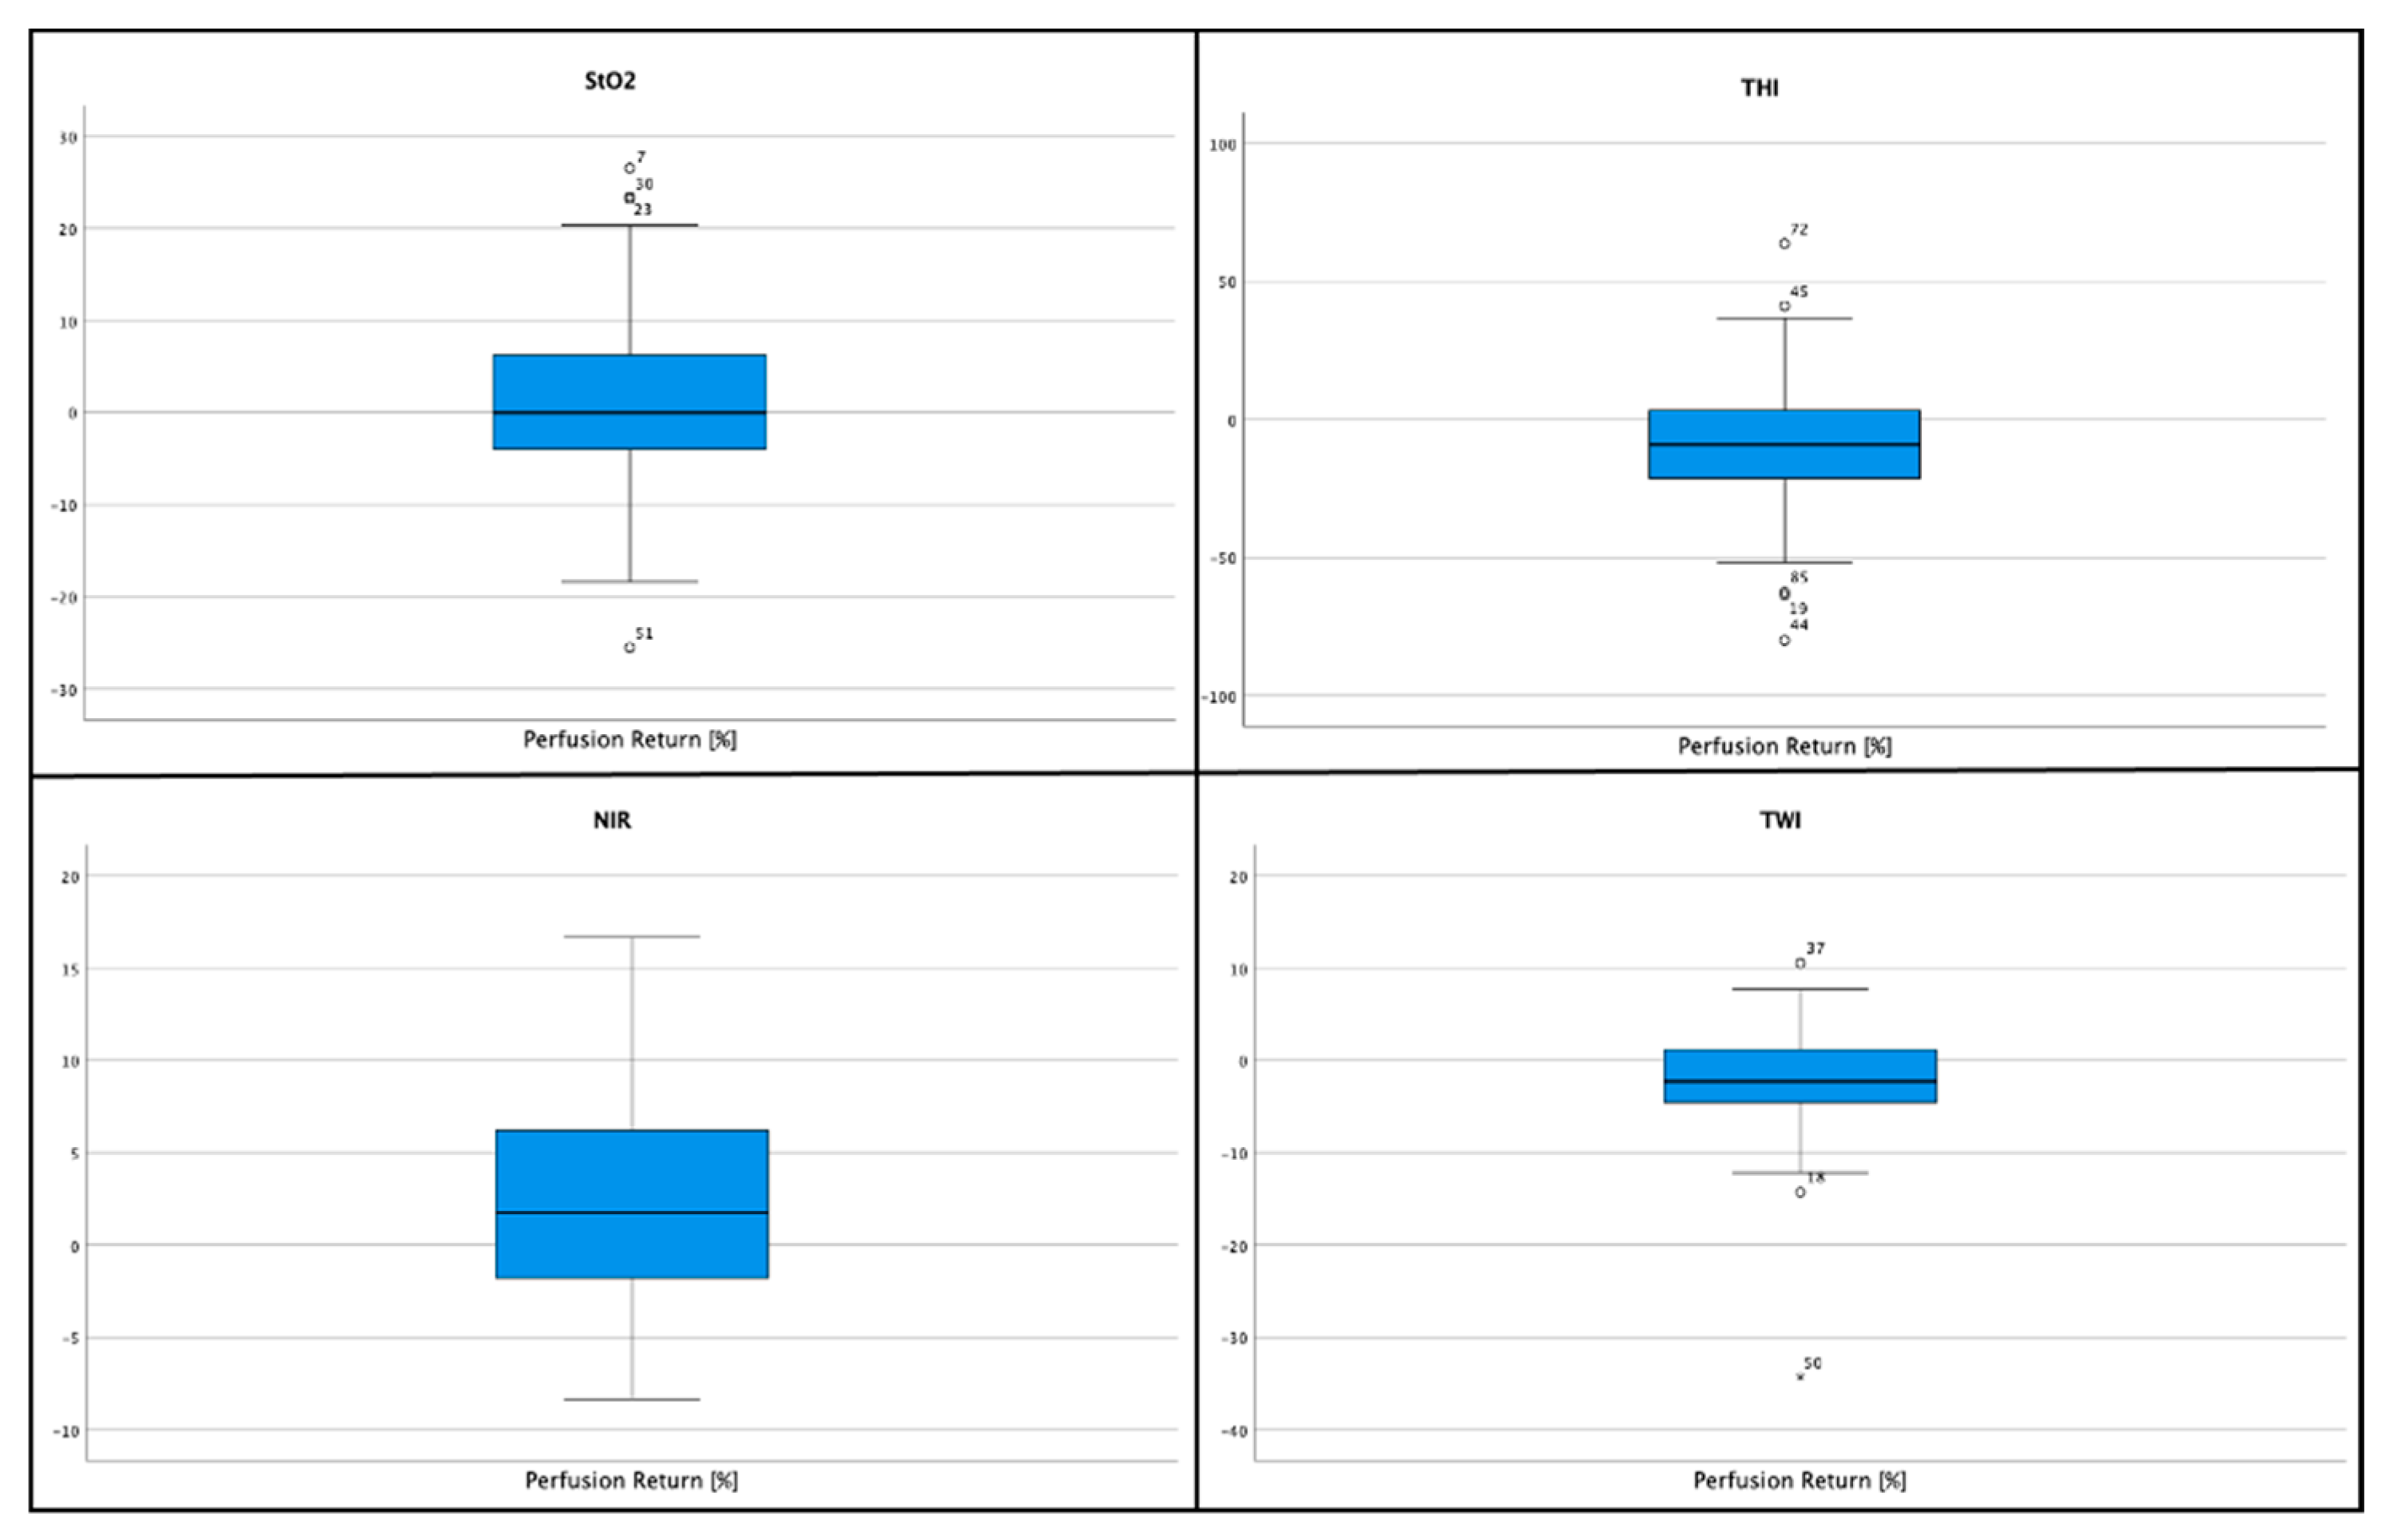
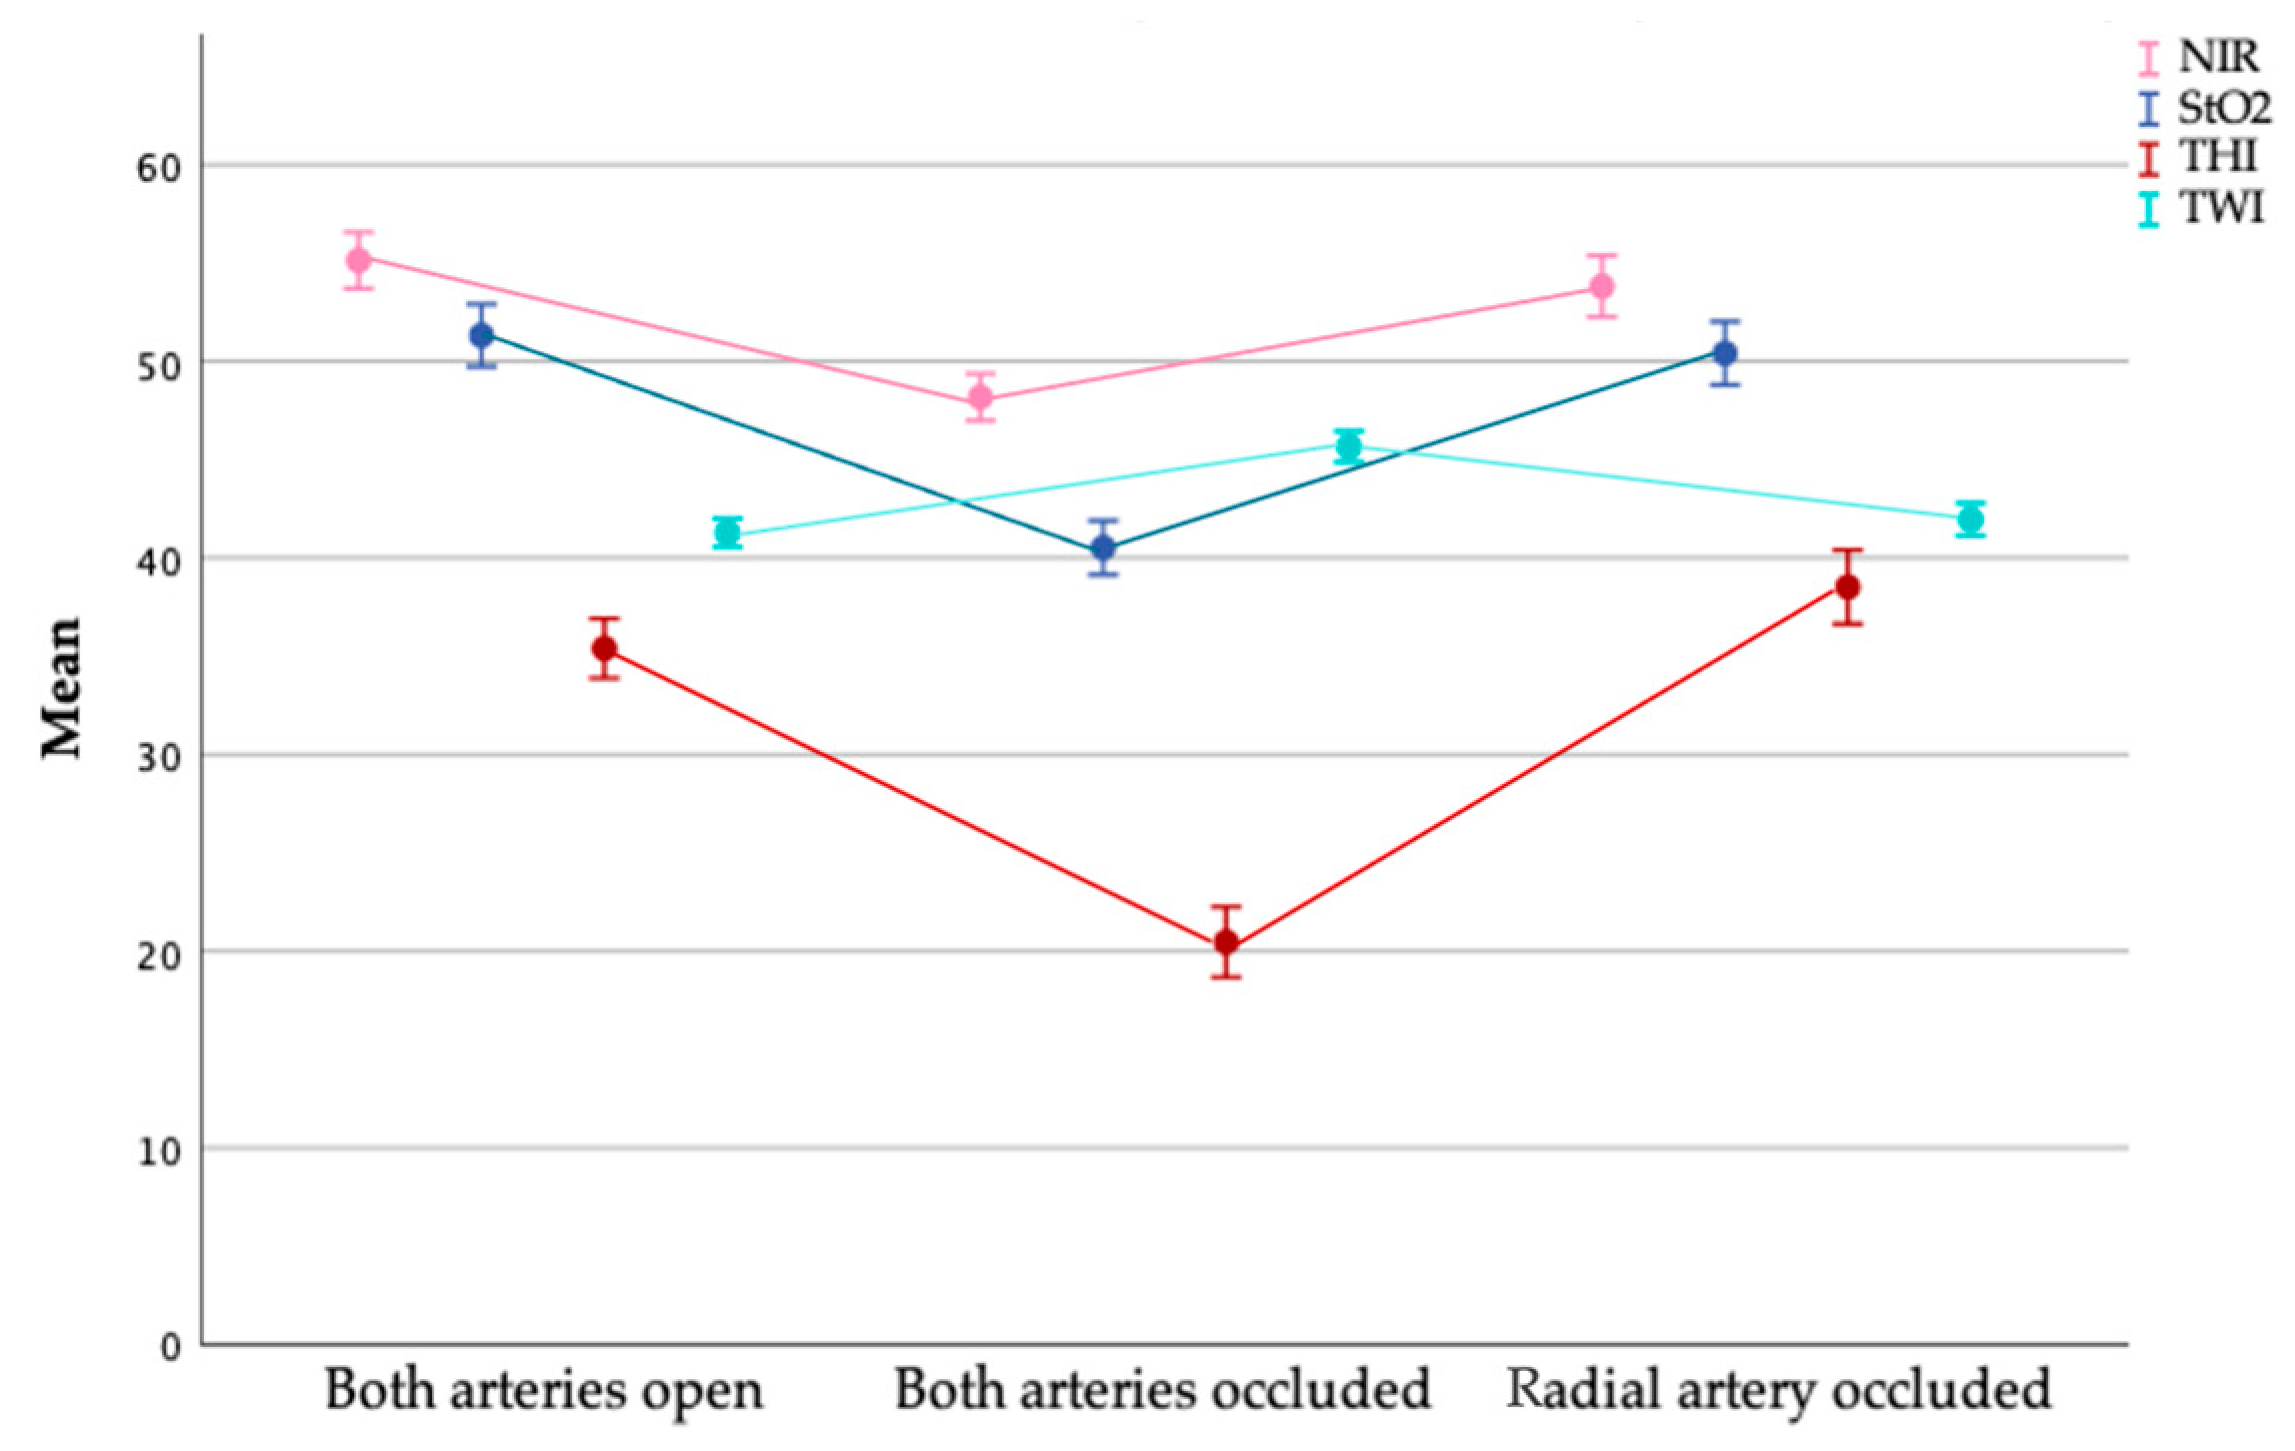
3.2.1. Tissue Oxygenation (StO2)
3.2.2. Near Infrared Perfusion Index (NIR)
3.2.3. Tissue Hemoglobin Index (THI)
3.2.4. Tissue Water Index (TWI)
3.2.5. Return-to-Perfusion Measurement
3.3. Cases with Impaired Perfusion
3.3.1. Allen’s Test
3.3.2. Tissue Oxygenation (StO2)
3.3.3. Near Infrared Perfusion Index (NIR)
3.3.4. Tissue Hemoglobin Index (THI)
3.3.5. Tissue Water Index (TWI)
3.3.6. Return-to-Perfusion Measurement
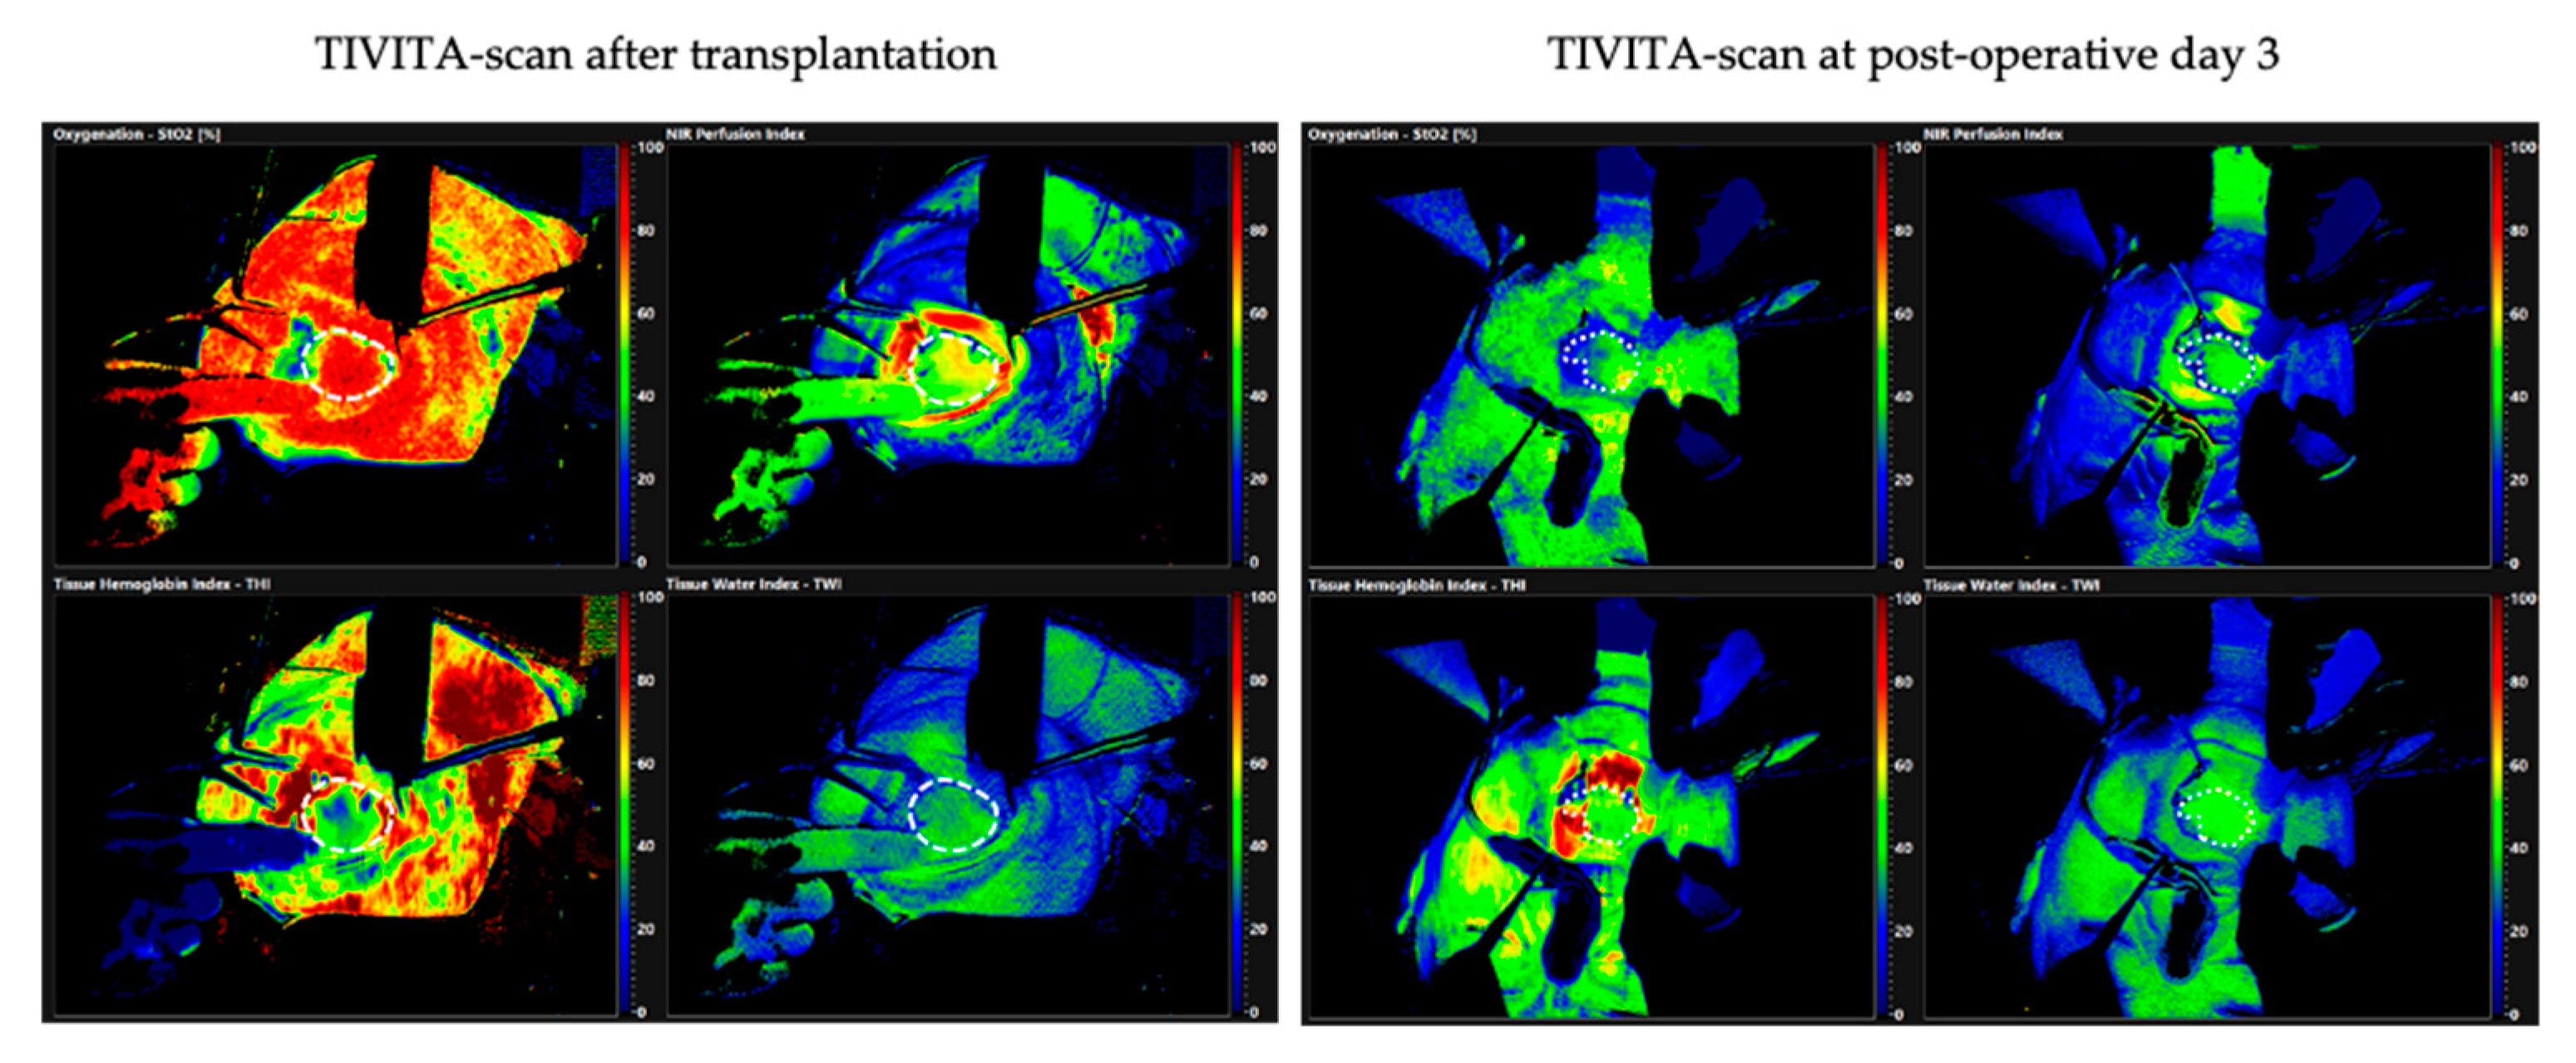
3.4. Patient Case
4. Discussion
5. Conclusions
Author Contributions
Funding
Institutional Review Board Statement
Informed Consent Statement
Data Availability Statement
Conflicts of Interest
References
- Wolff, K.D.; Hölzle, F. Raising of Microvascular Flaps—A Systematic Approach; Springer: New York, NY, USA, 2011; Volume 2. [Google Scholar]
- Hosokawa, K.; Hata, Y.; Yano, K.; Matsuka, K.; Ito, O.; Ogli, K. Results of the Allen test on 2,940 arms. Ann. Plast. Surg. 1990, 24, 149–151. [Google Scholar] [CrossRef] [PubMed]
- Kerawala, C.J.; Martin, I.C. Palmar arch backflow following radial forearm free flap harvest. Br. J. Oral. Maxillofac. Surg. 2003, 41, 157–160. [Google Scholar] [CrossRef]
- Wood, J.W.; Broussard, K.C.; Burkey, B. Preoperative testing for radial forearm free flaps to reduce donor site morbidity. JAMA Otolaryngol. Head Neck Surg. 2013, 139, 183–186. [Google Scholar] [CrossRef] [Green Version]
- Rashid, M.; Kwok, C.S.; Pancholy, S.; Chugh, S.; Kedev, S.A.; Bernat, I.; Ratib, K.; Large, A.; Fraser, D.; Nolan, J.; et al. Radial artery occlusion after transradial interventions: A systematic review and meta-analysis. J. Am. Heart Assoc. 2016, 5. [Google Scholar] [CrossRef] [Green Version]
- Ganesan, K.; Stead, L.; Smith, A.B.; Ong, T.K.; Mitchell, D.A.; Kanatas, A.N. Duplex in the assessment of the free radial forearm flaps: Is it time to change practice? Br. J. Oral. Maxillofac. Surg. 2010, 48, 423–426. [Google Scholar] [CrossRef]
- Abdullakutty, A.; Bajwa, M.S.; Patel, S.; D’Souza, J. Clinical audit and national survey on the assessment of collateral circulation before radial forearm free flap harvest. J. Cranio-Maxillofac. Surg. 2017, 45, 108–112. [Google Scholar] [CrossRef] [PubMed]
- Romeu-Bordas, O.; Ballesteros-Pena, S. Reliability and validity of the modified Allen test: A systematic review and metanalysis. Emergencias 2017, 29, 126–135. [Google Scholar]
- Sachithanandan, A.; Ahmed, A.; Muir, A.; Graham, A. Simple method for monitoring hand perfusion following radial artery harvest for coronary artery bypass grafting. Interact. Cardiovasc. Thorac. Surg. 2002, 1, 50–51. [Google Scholar] [CrossRef] [Green Version]
- Yudovsky, D.; Nouvong, A.; Pilon, L. Hyperspectral imaging in diabetic foot wound care. J. Diabetes Sci. Technol. 2010, 4, 1099–1113. [Google Scholar] [CrossRef] [Green Version]
- Khaodhiar, L.; Dinh, T.; Schomacker, K.T.; Panasyuk, S.V.; Freeman, J.E.; Lew, R.; Vo, T.; Panasyuk, A.A.; Lima, C.; Giurini, J.M.; et al. The use of medical hyperspectral technology to evaluate microcirculatory changes in diabetic foot ulcers and to predict clinical outcomes. Diabetes Care 2007, 30, 903–910. [Google Scholar] [CrossRef] [Green Version]
- Nouvong, A.; Hoogwerf, B.; Mohler, E.; Davis, B.; Tajaddini, A.; Medenilla, E. Evaluation of diabetic foot ulcer healing with hyperspectral imaging of oxyhemoglobin and deoxyhemoglobin. Diabetes Care 2009, 32, 2056–2061. [Google Scholar] [CrossRef] [PubMed] [Green Version]
- Lu, G.; Fei, B. Medical hyperspectral imaging: A review. J. Biomed. Opt. 2014, 19, 10901. [Google Scholar] [CrossRef]
- Calin, M.A.; Parasca, S.V.; Savastru, R.; Manea, D. Characterization of burns using hyperspectral imaging technique—A preliminary study. Burns 2015, 41, 118–124. [Google Scholar] [CrossRef]
- Zuzak, K.J.; Schaeberle, M.D.; Lewis, E.N.; Levin, I.W. Visible reflectance hyperspectral imaging: Characterization of a noninvasive, in vivo system for determining tissue perfusion. Anal. Chem. 2002, 74, 2021–2028. [Google Scholar] [CrossRef]
- Meier, J.K.; Prantl, L.; Muller, S.; Moralis, A.; Liebsch, G.; Gosau, M. Simple, fast and reliable perfusion monitoring of microvascular flaps. Clin. Hemorheol. Microcirc. 2012, 50, 13–24. [Google Scholar] [CrossRef] [PubMed]
- Kulcke, A.; Holmer, A.; Wahl, P.; Siemers, F.; Wild, T.; Daeschlein, G. A compact hyperspectral camera for measurement of perfusion parameters in medicine. Biomed. Tech. 2018, 63, 519–527. [Google Scholar] [CrossRef]
- Holmer, A.; Tetschke, F.; Marotz, J.; Malberg, H.; Markgraf, W.; Thiele, C.; Kulcke, A. Oxygenation and perfusion monitoring with a hyperspectral camera system for chemical based tissue analysis of skin and organs. Physiol. Meas. 2016, 37, 2064–2078. [Google Scholar] [CrossRef] [PubMed]
- Marotz, J.; Siafliakis, A.; Holmer, A.; Kulcke, A.; Siemers, F. First results of a new hyperspectral camera system for chemical based wound analysis. Wound Med. 2015, 10, 17–22. [Google Scholar] [CrossRef]
- Holmer, A.; Marotz, J.; Wahl, P.; Dau, M.; Kammerer, P.W. Hyperspectral imaging in perfusion and wound diagnostics—Methods and algorithms for the determination of tissue parameters. Biomed. Tech. 2018, 63, 547–556. [Google Scholar] [CrossRef] [PubMed]
- Thiem, D.G.E.; Frick, R.W.; Goetze, E.; Gielisch, M.; Al-Nawas, B.; Kammerer, P.W. Hyperspectral analysis for perioperative perfusion monitoring-a clinical feasibility study on free and pedicled flaps. Clin. Oral. Investig. 2021, 25, 933–945. [Google Scholar] [CrossRef]
- Habib, J.; Baetz, L.; Satiani, B. Assessment of collateral circulation to the hand prior to radial artery harvest. Vasc. Med. 2012, 17, 352–361. [Google Scholar] [CrossRef] [PubMed]
- Abu-Omar, Y.; Mussa, S.; Anastasiadis, K.; Steel, S.; Hands, L.; Taggart, D.P. Duplex ultrasonography predicts safety of radial artery harvest in the presence of an abnormal Allen test. Ann. Thorac. Surg. 2004, 77, 116–119. [Google Scholar] [CrossRef]
- Ruengsakulrach, P.; Brooks, M.; Hare, D.L.; Gordon, I.; Buxton, B.F. Preoperative assessment of hand circulation by means of Doppler ultrasonography and the modified Allen test. J. Thorac. Cardiovasc. Surg. 2001, 121, 526–531. [Google Scholar] [CrossRef] [Green Version]
- Kranke, P.; Schuster, F.; Muellenbach, R.; Kranke, E.-M.; Roewer, N.; Smul, T. Grundlagen und Prinzipien klinischer Studien: Wie viele Patienten sollen (müssen) untersucht werden? Fallzahlschätzung in klinischen Studien. Kardiotechnik 2008, 4, 114–117. [Google Scholar]
- Grambow, E.; Dau, M.; Holmer, A.; Lipp, V.; Frerich, B.; Klar, E.; Vollmar, B.; Kammerer, P.W. Hyperspectral imaging for monitoring of perfusion failure upon microvascular anastomosis in the rat hind limb. MicroVasc. Res. 2018, 116, 64–70. [Google Scholar] [CrossRef] [PubMed]
- Baetz, L.; Satiani, B. Palmar arch identification during evaluation for radial artery harvest. Vasc. Endovasc. Surg. 2011, 45, 255–257. [Google Scholar] [CrossRef] [PubMed]
- Nuckols, D.A.; Tsue, T.T.; Toby, E.B.; Girod, D.A. Preoperative evaluation of the radial forearm free flap patient with the objective Allen’s test. Otolaryngol. Head Neck Surg. 2000, 123, 553–557. [Google Scholar] [CrossRef]
- Coleman, S.; Anson, B. Arterial patterns in the hand based upon a study of 650 specimens. Surg. Gynecol. Obstet. 1961, 113, 409–424. [Google Scholar] [CrossRef] [PubMed]
- Ruengsakulrach, P.; Eizenberg, N.; Fahrer, C.; Fahrer, M.; Buxton, B.F. Surgical implications of variations in hand collateral circulation: Anatomy revisited. J. Thorac. Cardiovasc. Surg. 2001, 122, 682–686. [Google Scholar] [CrossRef] [Green Version]
- Loukas, M.; Holdman, D.; Holdman, S. Anatomical variations of the superficial and deep palmar arches. Folia Morphol. 2005, 64, 78–83. [Google Scholar]
- Gellman, H.; Botte, M.J.; Shankwiler, J.; Gelberman, R.H. Arterial patterns of the deep and superficial palmar arches. Clin. Orthop. Relat. Res. 2001, 41–46. [Google Scholar] [CrossRef]
- American Cancer Society. Key Statistics for Oral Cavity and Oropharyngeal Cancers. Available online: https://www.cancer.org/cancer/oral-cavity-and-oropharyngeal-cancer/about/key-statistics.html (accessed on 8 June 2021).
- Dietrich, M.; Marx, S.; Bruckner, T.; Nickel, F.; Muller-Stich, B.P.; Hackert, T.; Weigand, M.A.; Uhle, F.; Brenner, T.; Schmidt, K. Bedside hyperspectral imaging for the evaluation of microcirculatory alterations in perioperative intensive care medicine: A study protocol for an observational clinical pilot study (HySpI-ICU). BMJ Open 2020, 10, e035742. [Google Scholar] [CrossRef]
- Grambow, E.; Dau, M.; Sandkuhler, N.A.; Leuchter, M.; Holmer, A.; Klar, E.; Weinrich, M. Evaluation of peripheral artery disease with the TIVITA(R) Tissue hyperspectral imaging camera system. Clin. Hemorheol. Microcirc. 2019, 73, 3–17. [Google Scholar] [CrossRef] [PubMed]
- Schulz, T.; Marotz, J.; Stukenberg, A.; Reumuth, G.; Houschyar, K.S.; Siemers, F. Hyperspectral imaging for postoperative flap monitoring of pedicled flaps. Handchir. Mikrochir. Plast. Chir. 2020, 52, 316–324. [Google Scholar] [CrossRef] [PubMed]
- Sucher, R.; Wagner, T.; Kohler, H.; Sucher, E.; Guice, H.; Recknagel, S.; Lederer, A.; Hau, H.M.; Rademacher, S.; Schneeberger, S.; et al. Hyperspectral imaging (HSI) of human kidney allografts. Ann. Surg. 2020. [Google Scholar] [CrossRef] [PubMed]
- Jansen-Winkeln, B.; Holfert, N.; Kohler, H.; Moulla, Y.; Takoh, J.P.; Rabe, S.M.; Mehdorn, M.; Barberio, M.; Chalopin, C.; Neumuth, T.; et al. Determination of the transection margin during colorectal resection with hyperspectral imaging (HSI). Int. J. Colorectal Dis. 2019, 34, 731–739. [Google Scholar] [CrossRef] [PubMed]
- Mehdorn, M.; Kohler, H.; Rabe, S.M.; Niebisch, S.; Lyros, O.; Chalopin, C.; Gockel, I.; Jansen-Winkeln, B. Hyperspectral Imaging (HSI) in acute mesenteric ischemia to detect intestinal perfusion deficits. J. Surg. Res. 2020, 254, 7–15. [Google Scholar] [CrossRef]
- Muhle, R.; Ernst, H.; Sobottka, S.B.; Morgenstern, U. Workflow and hardware for intraoperative hyperspectral data acquisition in neurosurgery. Biomed. Tech. 2020. [Google Scholar] [CrossRef]


Publisher’s Note: MDPI stays neutral with regard to jurisdictional claims in published maps and institutional affiliations. |
© 2021 by the authors. Licensee MDPI, Basel, Switzerland. This article is an open access article distributed under the terms and conditions of the Creative Commons Attribution (CC BY) license (https://creativecommons.org/licenses/by/4.0/).
Share and Cite
Heimes, D.; Becker, P.; Thiem, D.G.E.; Kuchen, R.; Kyyak, S.; Kämmerer, P.W. Is Hyperspectral Imaging Suitable for Assessing Collateral Circulation Prior Radial Forearm Free Flap Harvesting? Comparison of Hyperspectral Imaging and Conventional Allen’s Test. J. Pers. Med. 2021, 11, 531. https://doi.org/10.3390/jpm11060531
Heimes D, Becker P, Thiem DGE, Kuchen R, Kyyak S, Kämmerer PW. Is Hyperspectral Imaging Suitable for Assessing Collateral Circulation Prior Radial Forearm Free Flap Harvesting? Comparison of Hyperspectral Imaging and Conventional Allen’s Test. Journal of Personalized Medicine. 2021; 11(6):531. https://doi.org/10.3390/jpm11060531
Chicago/Turabian StyleHeimes, Diana, Philipp Becker, Daniel G. E. Thiem, Robert Kuchen, Solomiya Kyyak, and Peer W. Kämmerer. 2021. "Is Hyperspectral Imaging Suitable for Assessing Collateral Circulation Prior Radial Forearm Free Flap Harvesting? Comparison of Hyperspectral Imaging and Conventional Allen’s Test" Journal of Personalized Medicine 11, no. 6: 531. https://doi.org/10.3390/jpm11060531