
Armor Damage of Overtopped Mound Breakwaters in Depth-Limited Breaking Wave Conditions


1
Laboratory of Ports and Coasts, Institute of Transport and Territory, Universitat Politècnica de València, 46022 Valencia, Spain
2
INGEOMAR, c/Maximiliano Thous, 20-1°B, 46009 Valencia, Spain
*
Author to whom correspondence should be addressed.
J. Mar. Sci. Eng. 2021, 9(9), 952; https://doi.org/10.3390/jmse9090952
Submission received: 30 July 2021
/
Revised: 23 August 2021
/
Accepted: 23 August 2021
/
Published: 1 September 2021
(This article belongs to the Special Issue Breakwater Behaviour)
Abstract
:Armor damage due to wave attack is the principal failure mode to be considered when designing conventional mound breakwaters. Armor layers of mound breakwaters are typically designed using formulas in the literature for non-overtopped mound breakwaters in non-breaking wave conditions, although overtopped mound breakwaters in the depth-induced breaking wave zone are common design conditions. In this study, 2D physical tests with an armor slope H/V = 3/2 are analyzed in order to better describe the hydraulic stability of overtopped mound breakwaters with double-layer rock, double-layer randomly-place cube and single-layer Cubipod® armors in depth-limited breaking wave conditions. Hydraulic stability formulas are derived for each armor section (front slope, crest and rear slope) and each armor layer. The front slope of overtopped double-layer rock structures is more stable than the front slope of non-overtopped mound breakwaters in breaking wave conditions. When wave attack increases, armor damage appears first on the front slope, later on the crest and, finally, on the rear side. However, once the damage begins on the crest and rear side, the progression is much faster than on the front slope, because more wave energy is dissipated through the armored crest and rear side.
1. Introduction
The armor damage on mound breakwaters due to wave attack is the first problem to assess in the design phase. Extensive literature can be found reporting different hydraulic stability formulas to design the armor layer of mound breakwaters [1,2,3]. Although most mound breakwaters are built in the depth-limited wave breaking zone, most of the aforementioned formulas were developed using physical tests conducted in non-breaking wave conditions with null or insignificant overtopping (crest freeboard higher than two times the design significant wave height). Herrera et al. [4] found that the formulas derived in non-breaking conditions are not fully valid in breaking conditions, since the breakwater must withstand wave storms with a percentage of waves breaking before reaching the structure.
Another key aspect to consider in mound breakwater design is the current context of climate change. Overtopping risk in coastal structures is even more relevant due to rising sea levels and more extreme wave storms. Higher sea levels will reduce dimensionless crest freeboards leading to higher overtopping rates. In overtopped mound breakwaters (crest freeboard similar to the design significant wave height), part of the wave energy passes through the structure [5]; the wave energy is dissipated not only in the armored front slope, but also in the armored crest and rear slope. Thus, the hydraulic stability of the front slope, crest and rear slope becomes relevant for design purposes and related to the overtopping. Vidal et al. [6] reported that the hydraulic stability of overtopped mound breakwaters was dependent on the dimensionless crest freeboard, Fd = Rc/Dn50, where Rc is the crest freeboard and Dn50 = M50/ρr is the nominal diameter of the armor rocks, M50 is the median rock mass and ρr is the mass density of the rocks. As Fd decreases, the overtopping rate increases, the hydraulic stability of the front slope increases while that of the crest and rear slope decreases. Thus, special attention is required to design the armor crest and rear slope in overtopped mound breakwaters.
Argente [7] performed 2D physical tests with overtopped mound breakwaters (0.4 ≤ Rc/Hm0 ≤ 2.0 and 1.5 ≤ Rc/Dn ≤ 4.7, where Hm0 = 4 (m0)0.5 is the spectral significant wave height) with double-layer rock, double-layer randomly-place cube and single-layer Cubipod® armors in depth-limited breaking wave conditions. This author proposed formulas to describe the hydraulic stability of these structures using the 5-power relationship between the design wave height and the armor damage recommended by [2,8] for non-overtopped and non-breaking wave conditions. Nevertheless, recent studies [4,9] found a 6-power relationship when depth-induced breaking wave conditions are considered.
This study reanalyzes the data by [7] to examine the hydraulic stability of overtopped mound breakwaters with armor slope H/V = 3/2 and with double-layer rock, double-layer randomly-place cube and single-layer Cubipod® armors in depth-limited breaking conditions. New hydraulic stability formulas are proposed assuming a n-power relationship between the design wave height and the armor damage. The exponent of the power is estimated in order to better describe armor damage in depth-limited breaking wave conditions. This paper is organized as follows. In Section 2, a review of the literature on the hydraulic stability of low-crested mound breakwaters in breaking wave conditions is presented. In Section 3, data reported in [7] are described. In Section 4, the experimental database is analyzed. In Section 5, results of the analysis of the armor damage of the tested overtopped mound breakwaters are discussed; the influence of the armor unit, the armor section and overtopped conditions are specified. Finally, in Section 6, conclusions are drawn.
2. Literature Review
As mentioned in the previous section, most studies in the literature related to the stability of mound breakwaters analyzed non-overtopped structures in non-breaking wave conditions. Here, the literature on the hydraulic stability of mound breakwaters is briefly reviewed, focusing on mound breakwaters located in the surf zone with relevant overtopping rates.
2.1. Armor Damage Measurement
Armor damage is typically assessed considering both quantitative and qualitative methods. Although a quantitative analysis provides a reasonably objective value for armor damage, qualitative criteria are needed to characterize the severity of the damage. Here, both quantitative and qualitative methods are summarized.
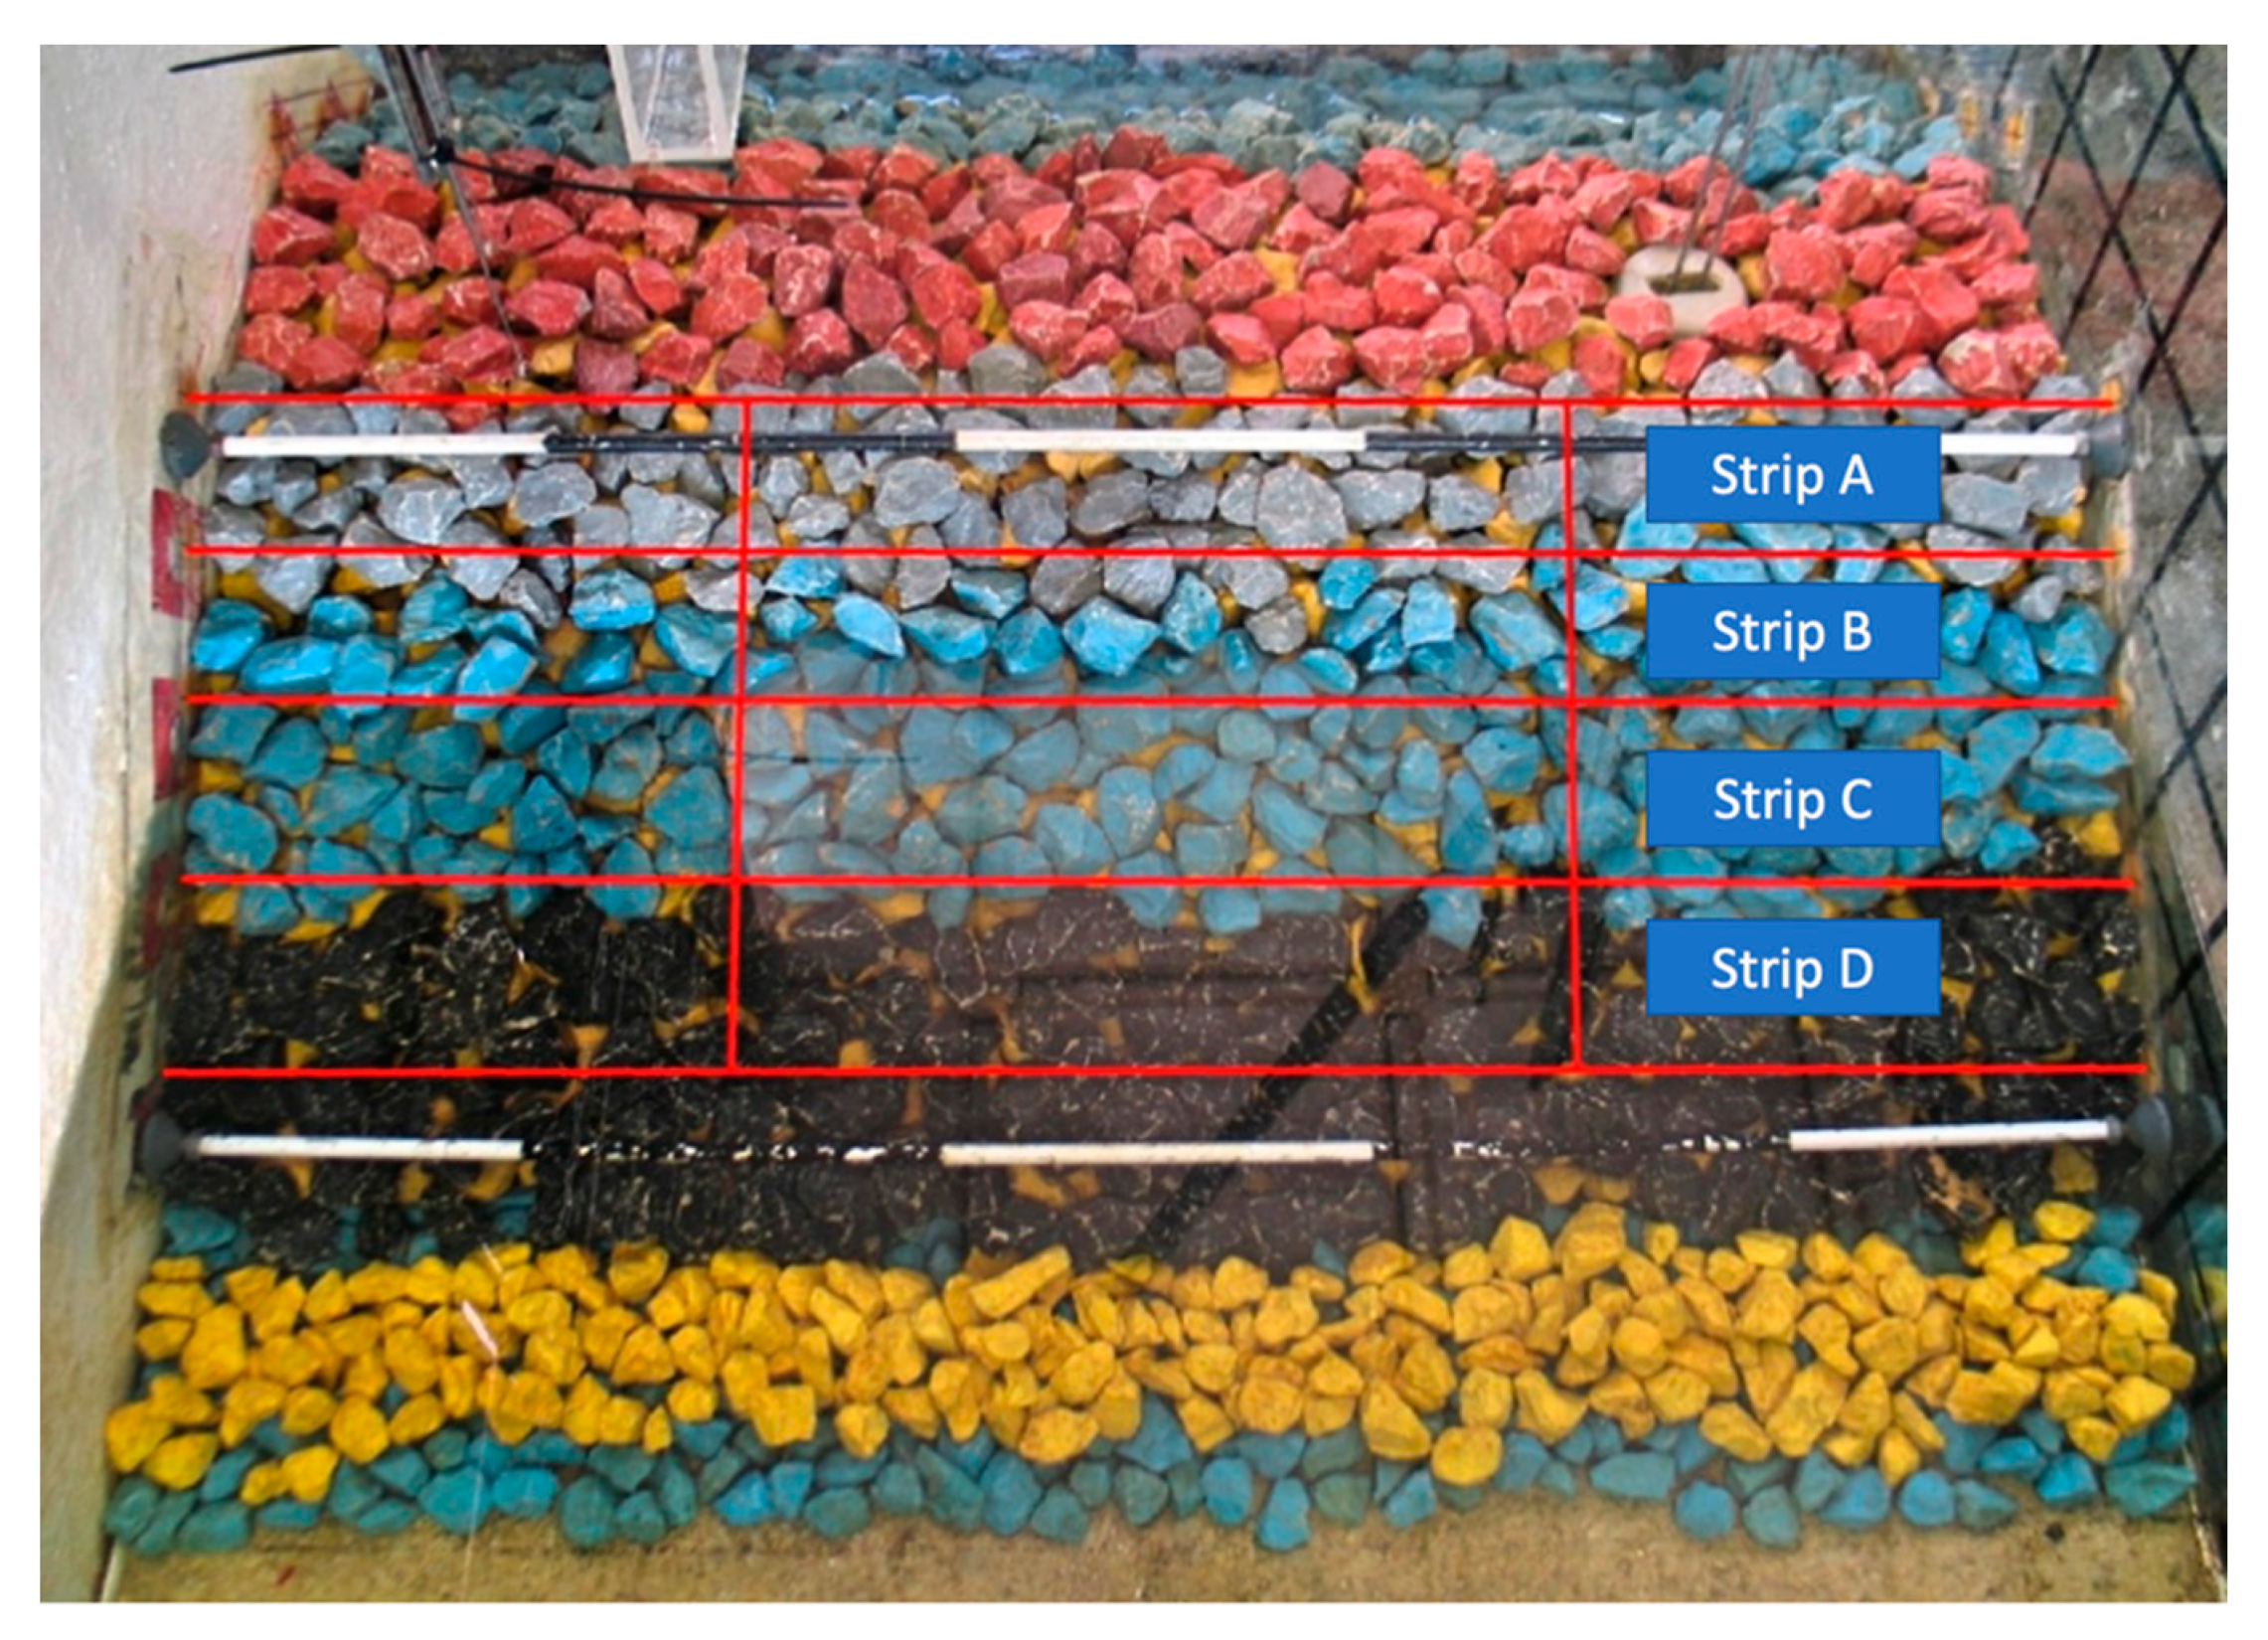
It is not easy to standardize the quantitative armor damage to mound breakwaters in a manner valid for different armor units, number of layers and slopes. Several criteria for quantitative armor damage can be found in the literature, but the most commonly used criterion is the measurement of the dimensionless armor damage. The dimensionless armor damage parameter is defined as S = Ae/Dn2, where Ae is the average eroded cross-section area, and Dn = M/ρ is the nominal diameter or equivalent cube size, being M the median mass of the armor unit, and ρ the mass density of the armor unit. Ae can be determined using mechanical or laser profilers as well as the visual counting method [10], assuming a constant armor porosity during the erosion process. However, Gómez-Martín and Medina [11] indicated that these conventional methods were not adequate when analyzing armor units with significant Heterogeneous Packing, HeP (e.g., cube armors). The HeP failure mode, further explained in [12], involves an increase in the local packing density in the lower area of the armor and a reduction in the local packing density in the upper area, due to an undesired face-to-face arrangement of the armor units. Gómez-Martín and Medina [11] also proposed the Virtual Net method to analyze the armor damage considering the changes in the porosity of the armor and, thus, the HeP. The Virtual Net method divides the armor into strips of constant width (w = aDn) and length (l = bDn). The dimensionless damage is measured in each strip (Si) considering the porosity evolution in time and space. The equivalent dimensionless armor damage parameter (Se) is obtained by integrating Si over the slope, as shown in Equation (1).
where a is the number of rows in the strip, I is the number of strips, pi = 1 − (NiDn2/wl) is the armor porosity of the strip i, being Ni the number of armor units within the strip i, p0i the initial armor porosity of the strip i, Φi = n (1 − pi) the packing density of the strip i, being n the number of armor layers, and Φ0i the initial packing density of the strip i. In the present study, the Virtual Net method is used in order to consider the HeP failure mode.
As previously mentioned, qualitative analysis of damage is also required to properly describe the severity of the armor damage. Losada et al. [13] and Vidal et al. [14] proposed four qualitative levels of armor damage for conventional double-layer armors:
- Initiation of Damage (IDa): some units are lost from the upper armor;
- Initiation of Iribarren’s Damage (IIDa): a large area of the upper armor is damaged, so the extraction of units from the bottom armor layer is possible;
- Initiation of Destruction (IDe): the filter is clearly visible due to the extraction of at least one element from the bottom armor layer;
- Destruction (De): several elements from the filter layer are removed.
In order to describe the severity of damage on conventional mound breakwaters with single-layer armors, Gómez-Martín [15] defined three levels of armor damage:
- Initiation of Damage (IDa): some isolated units are removed from the armor, producing holes whose size is close to the size of the armor units;
- Initiation of Destruction (IDe): several adjacent units are removed from the armor, producing cracks and holes whose size is larger than the armor unit. The filter is clearly visible;
- Destruction (De): several elements from the filter layer are removed.
In the present study, two levels of armor damage are considered: Initiation of Damage (IDa) and Initiation of Destruction (IDe).
2.2. Hydraulic Stability of Mound Breakwaters in Breaking Wave Conditions
Most hydraulic stability formulas are based on the stability number, Ns = H/ΔDn, where H is the design wave height, Δ = (ρ − ρw)/ρw is the relative submerged mass density, ρ is the mass density of the armor units, and ρw is the mass density of the sea water. Hudson [1] proposed Equation (2), the most widely used stability formula, which was validated using physical tests with regular waves in non-breaking wave conditions. KD is the stability coefficient which depends on the type of armor unit, armor placement, the number of layers in the armor and the section of the breakwater (trunk or head); cotα is the armor slope.
In order to account for the depth-limited wave breaking conditions, USACE [16,17] proposed reducing the value of KD in Equation (2). According to [16], KD = 4.0 for double-layer rough-angular rock armor in non-breaking wave conditions while KD = 3.5 for the same armor in breaking wave conditions. On the other hand, USACE [17] recommended applying KD = 4.0 for double-layer rough-angular rock armor in non-breaking wave conditions and KD = 2.0 for the same armor in breaking wave conditions. It should be noted that [16] proposed using H = Hs = H1/3 (average of the one-third highest waves) while [17] recommended H = H1/10 (average of the one-tenth highest waves) in non-breaking wave conditions and H = Hb (Hb = 0.78hs, where hs is the water depth at the toe of the structure) in breaking wave conditions.
Van der Meer [2] performed physical tests focused on the hydraulic stability of rock armors and combined these results with those by [18]. A wide range of stability numbers (1 ≤ Hs/ΔDn ≤ 4), armor slopes (1.5 ≤ cotα ≤ 6.0) and structural permeabilities were covered. Most of these tests were conducted in non-breaking wave conditions. Based on this experimental database, Van der Meer [2] proposed Equation (3).
where ξmc = (6.2P0.31tanα0.5)1/(P+0.5) is the critical breaker parameter, 0.1 ≤ P ≤ 0.6 represents the permeability of the structure, Nz is the number of waves and ξm = tanα/(2πHs/[gTm2])0.5 is the surf similarity parameter calculated using the mean period (Tm).
Van der Meer [2] conducted 293 tests in non-breaking wave conditions but also 16 physical tests in breaking wave conditions on a bottom slope m = 1/30 and 3.3 ≤ hs/ΔDn50 ≤ 6.5, where hs is the water depth at the toe of the structure. A permeable structure with cotα = 2.0 composed of rocks with Dn50 = 3.6 cm was considered. Based on these additional tests, Van der Meer [2] proposed replacing Hs in Equation (3) by H2%/1.4, where H2% is the average of the 2% highest waves. Note that H2%/Hs ≈ 1.4 for a Rayleigh distribution.
Van Gent et al. [3] performed additional physical tests in breaking and non-breaking conditions on bottom slopes m = 1/30 and 1/100 with rock armors with permeable and impermeable core. The tested rock armored structures considered cotα = 2.0 and 4.0, and Dn50 = 2.2 and 3.5 cm. Van Gent et al. [3] combined their experimental database with that by [19] to validate Equation (4) within the ranges 1.5 ≤ hs/ΔDn50 ≤ 11 and 0.5 ≤ Hs/ΔDn ≤ 4.5; in total, 207 tests were used.
where ξs−1 = tanα/(2πHs/[gTm−1,02])0.5 is the surf similarity parameter calculated using the spectral period Tm−1,0 = m−1/m0, in which mi is the i-th spectral moment obtained as , being S(f) the wave spectrum. Equations (3) and (4) have several common elements.
In order to account for Dn50 of the core of the structure, Van Gent et al. [3] also derived Equation (5).
Prevot et al. [20] carried out physical tests with rubble mound breakwaters in breaking wave conditions on a bottom slope m = 1/30. These authors compared their experimental results with Equations (3) and (4) and concluded that the best estimations were given by Equation (4).
Herrera et al. [4] also analyzed the armor damage of non-overtopped rock armors and depth-limited breaking wave conditions. In total, 45 physical tests within the experimental ranges 1.0 ≤ Hm0/ΔDn ≤ 2.5 and 3.8 ≤ hs/ΔDn ≤ 7.5 were performed on a bottom slope m = 2% using conventional rock armored structures with cotα = 1.5 and Dn50 = 3.18 cm. Herrera et al. [4] did not find that the wave steepness sm = Hm0/Lm and water depth at the toe hs significantly influenced the armor damage, and recommended using Hm0 at a distance of 3 times hs from the toe of the structure as design wave height. These authors derived Equation (6) to describe the hydraulic stability rock armors in breaking wave conditions, where Se is the equivalent dimensionless armor damage.
Recently, Etemad-Shahidi et al. [9] examined the 791 physical tests by [2,3,10,18] on non-overtopped rubble mound breakwaters and considered Equation (7) as valid for both breaking and non-breaking conditions within the ranges 1.0 ≤ Hs/ΔDn ≤ 4.3 and 1.35 ≤ hs/Hs ≤ 19.68.
where Cp = (1 + [Dn50 core/Dn50]3/10)3/5 is the coefficient of permeability.
After describing the formulas given in the literature to assess the hydraulic stability of rock-armored breakwaters, it can be concluded that no consensus exists regarding neither the variables involved nor the power of the relationship between Ns and the dimensionless armor damage when the breakwater is placed in depth-limited breaking wave conditions. The 5-power relationship recommended by [8] based on [17] and Equations (3) and (4) for non-breaking wave conditions must be assessed when compared to the 6-power relationship proposed by Equations (6) and (7) valid for structures in depth-limited breaking wave conditions.
Gómez-Martín et al. [21] carried out 2D physical model tests to analyze the trunk hydraulic stability of single- and double-layer Cubipod® armors in depth-limited regular wave breaking and non-overtopping conditions with horizontal foreshore (m = 0) and armor slope cotα = 1.5. Gómez-Martín et al. [21] proposed Equation (8) to design safe Cubipod® armored breakwaters (cotα = 1.5) on gentle bottom slopes (0 ≤ m ≤ 2%), for any deep-water wave climate, regardless of the wave height at the toe of the structure, considering a design water depth (h) at a distance three times the water depth at the toe of the structure, h = hs (1 + 3 m).
2.3. Hydraulic Stability of Overtopped Mound Breakwaters
As previously mentioned, most studies focus on the hydraulic stability of non-overtopped mound breakwaters and only consider the damage to the front slope. However, when overtopping rates become relevant, the hydraulic stability of the crest and rear side of the structure must be considered. In this section, the literature related to the hydraulic stability of overtopped mound breakwaters is reviewed.
The European project DELOS (Environmental design of low-crested coastal defense structures) was one of the main projects analyzing the performance of low-crested structures. During this project, 2D and 3D physical tests were performed to analyze the hydraulic stability of the head and trunk of low-crested mound breakwaters. However, most of the existing studies on low-crested structures consider breakwaters with very high overtopping with crest levels similar to the mean water level. Thus, their behavior is different from overtopped mound breakwaters with crest freeboards similar to the design significant wave height.
Van der Meer et al. [22] summarized the results published by [23] and classified low-crested structures into three categories: (1) dynamically stable reef breakwaters, (2) statically stable low-crested structures with the crest above the mean water level and (3) statically stable submerged breakwaters. Regarding the second category, statically stable low-crested structures, Van der Meer et al. [22] concluded that their front slope was between 20% and 30% more stable than the front slope of non-overtopped structures. These authors also proposed applying Equation (9) as a reduction factor to estimate the required size of rock armor calculated with formulas for non-overtopped breakwaters.
where s0p = 2πHm0/gTp2 is the fictitious wave steepness. Equation (9) can be applied within 0 ≤≤ 0.052.
Vidal et al. [6] tested rubble mound breakwaters with armor slope H/V = 3/2 within the ranges −0.63 ≤ Rc/Hm0 ≤ 1.00 and −2.01 ≤ Fd = Rc/Dn50 ≤ 2.41. These authors divided the model in four sections to analyze the hydraulic stability: (1) front slope, (2) crest, (3) rear slope and (4) total section. Vidal et al. [6] observed that the stability of the front slope decreased with increasing values of Fd while the stability of the crest increased for higher values of Fd. In addition, the minimum stability for the rocks in the armored crest was determined for a null crest freeboard. Burger [24] reached similar conclusions when reanalyzing the data by [6,25].
Later, Vidal et al. [26] conducted new physical tests with emerged and submerged rubble mound breakwaters with H/V = 1/2 and 1/1.15, and four crest freeboards within −4 ≤ Fd ≤ 4. The authors proposed threshold values for the damage parameter S for IDa, distinguishing between the three sections of the armor: S (IDa) = 1.0 for the front slope and crest and S (IDa) = 0.5 for the rear slope. Vidal et al. [26] also derived a quadratic relationship between Fd and the stability number for IDa, Ns50 = H50/ΔDn50, where H50 is the average of the 50 highest waves of the incident wave train, given by
where A, B and C are empirical coefficients calibrated for the three sectors of the armor.
Van der Linde [27] performed the first tests on overtopped mound breakwaters with precast concrete armor units. This author tested XBlock-armored mound breakwaters with H/V = 4/3 within the range −0.8 ≤ Fd ≤ 0.8. Later, Muttray et al. [28] reanalyzed the data provided by [27] and recommended values of Ns to design low-crested mound breakwaters with XBlock on the armor layer.
Argente et al. [29] carried out physical model tests on overtopped mound breakwaters (0.3 ≤ Rc/Hm0 ≤ 2.6) with armor slope H/V = 3/2 in depth-limited breaking conditions on a bottom slope m = 2%. Three armor layers were considered: double-layer rock (rock-2L), double-layer randomly-place cube (cube-2L), and a single-layer Cubipod® (Cubipod®-1L) armors. No significant damage was observed for Cubipod®-1L. Argente et al. [29] proposed a relationship between Se and Ns for rock-2L and cube-2L given by
where C1 and C2 are empirical coefficients calibrated for rock-2L and cube-2L armors, as shown in Table 1, and Ns is calculated with Hm0 estimated at a distance of 3hs from the toe of the model [4]. Note that the 5-power relationship between the design wave height and the armor damage recommended by [8] for non-breaking wave conditions was assumed.
Recently, the database compiled by [29] was extended by [7], who performed additional physical tests on m = 4% considering the same three armors (rock-2L, cube-2L and Cubipod®-1L) and similar experimental ranges, 0.4 ≤ Rc/Hm0 ≤ 2.0 and 1.5 ≤ Rc/Dn ≤ 4.7. Although no significant differences were observed in the quantitative data regarding armor damage, Argente [7] analyzed m = 2% and m = 4% separately. Using the extended database, Argente [7] re-fitted Equation (11).
It should be noted that in Equation (11) the 5-power relationship between the design wave height and the armor damage for non-overtopped and non-breaking wave conditions was assumed. However, both [4,9] found a 6-power relationship better to describe the armor damage on rubble mound breakwaters in depth-limited breaking wave conditions. Therefore, the exponent of the power must be assessed in order to determine the optimal exponent when describing the hydraulic stability of overtopped mound breakwaters in depth-limited breaking wave conditions.
3. Experimental Methodology
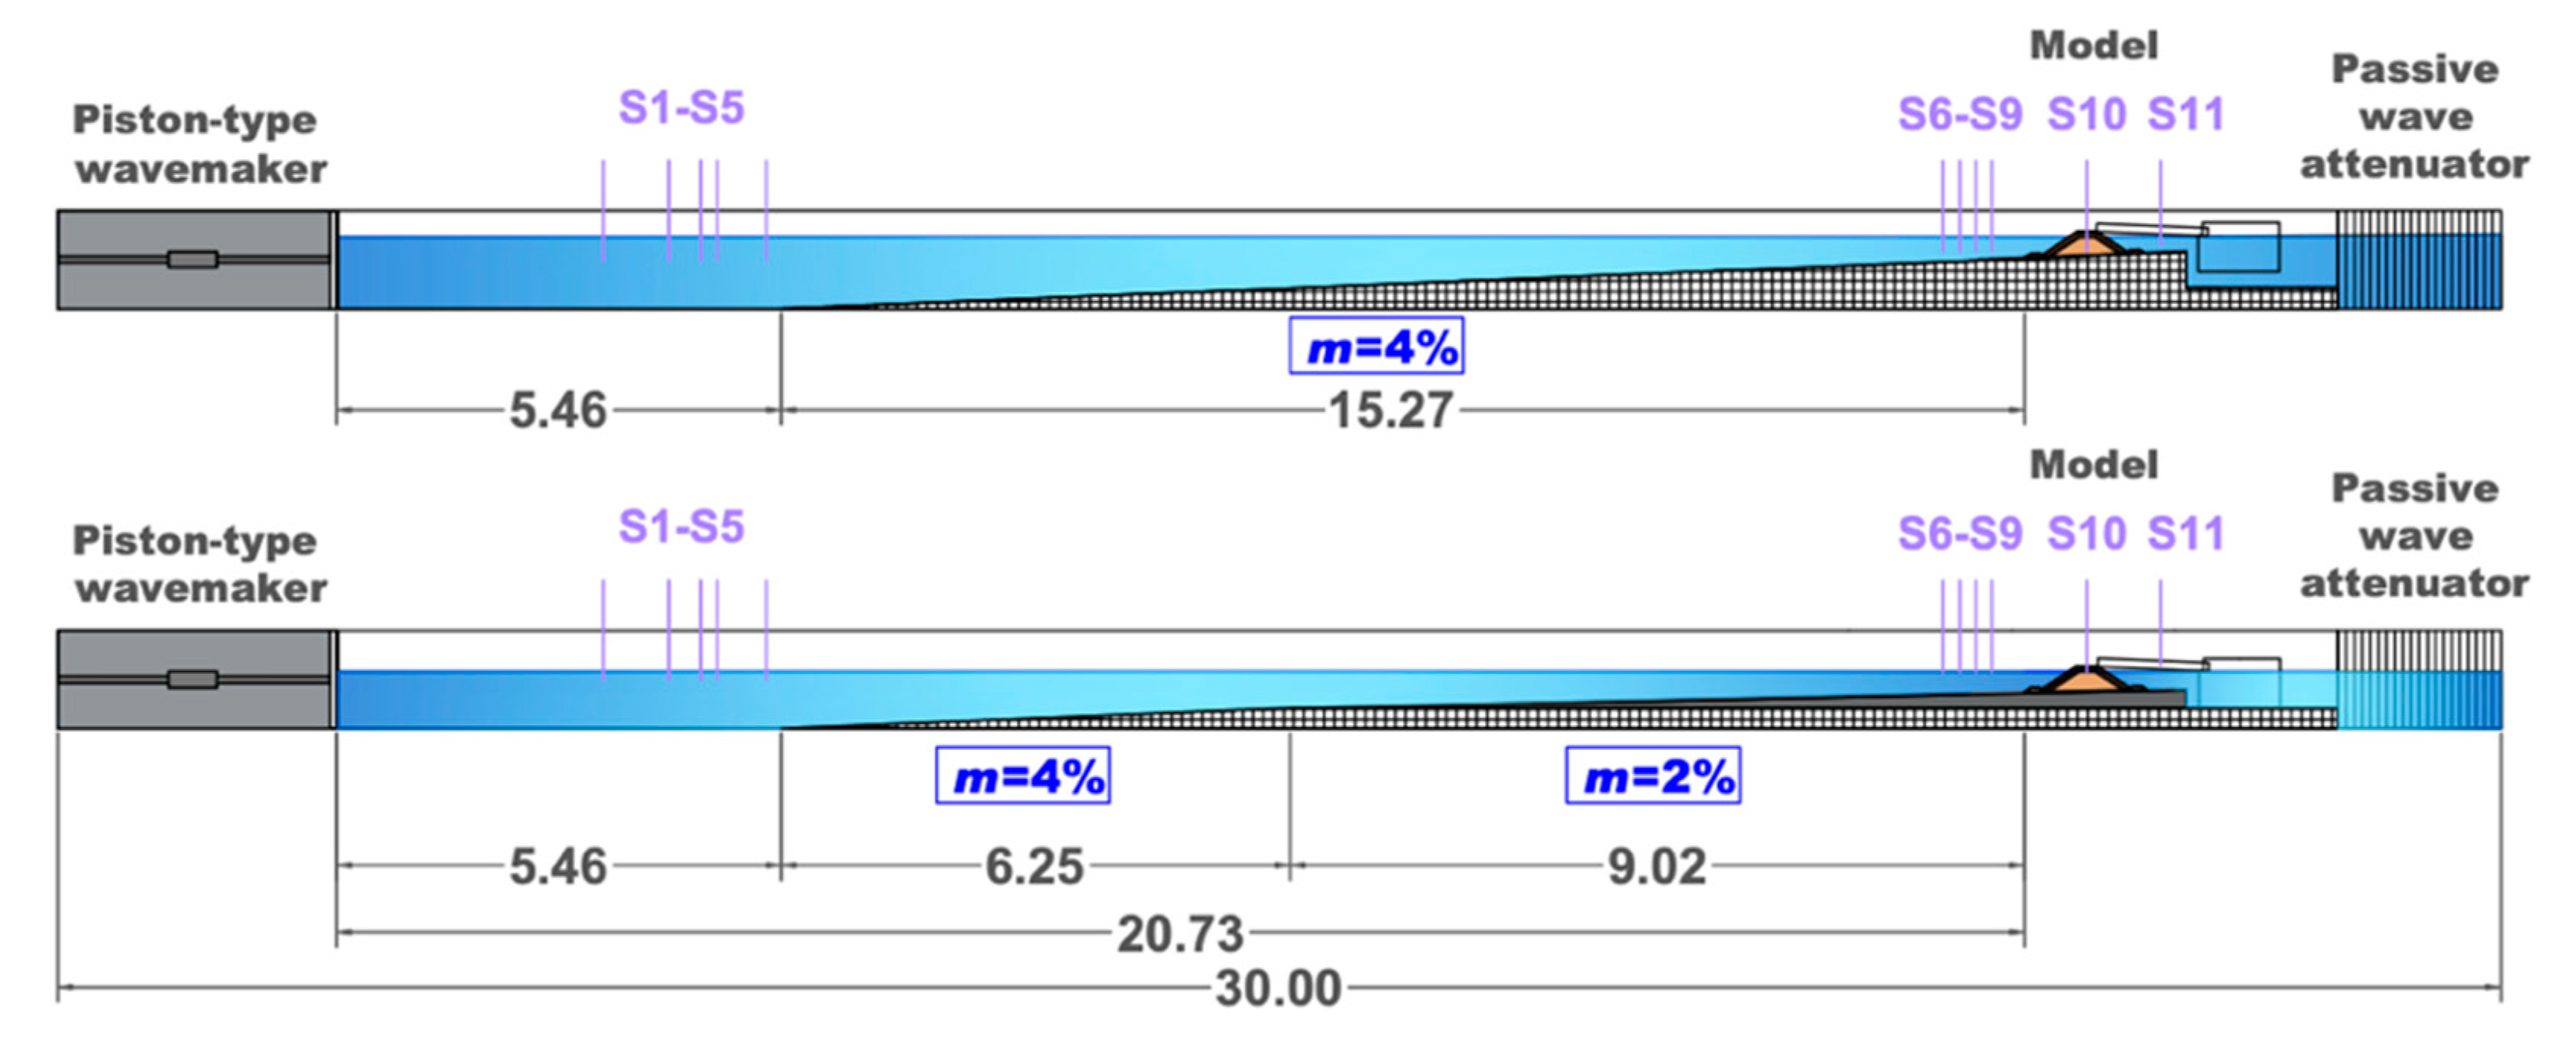
Two-dimensional physical tests were performed by [7] in the wave flume (30 × 1.2 × 1.2 m) of the Laboratory of Ports and Coasts at the Universitat Politècnica de València (LPC-UPV). Two configurations of the wave flume were considered: (1) a continuous ramp with a bottom slope m = 4%, and (2) a 6.25 m-long m = 4% ramp followed by a 9.0 m-long m = 2% ramp. These bottom slope configurations are depicted in Figure 1.
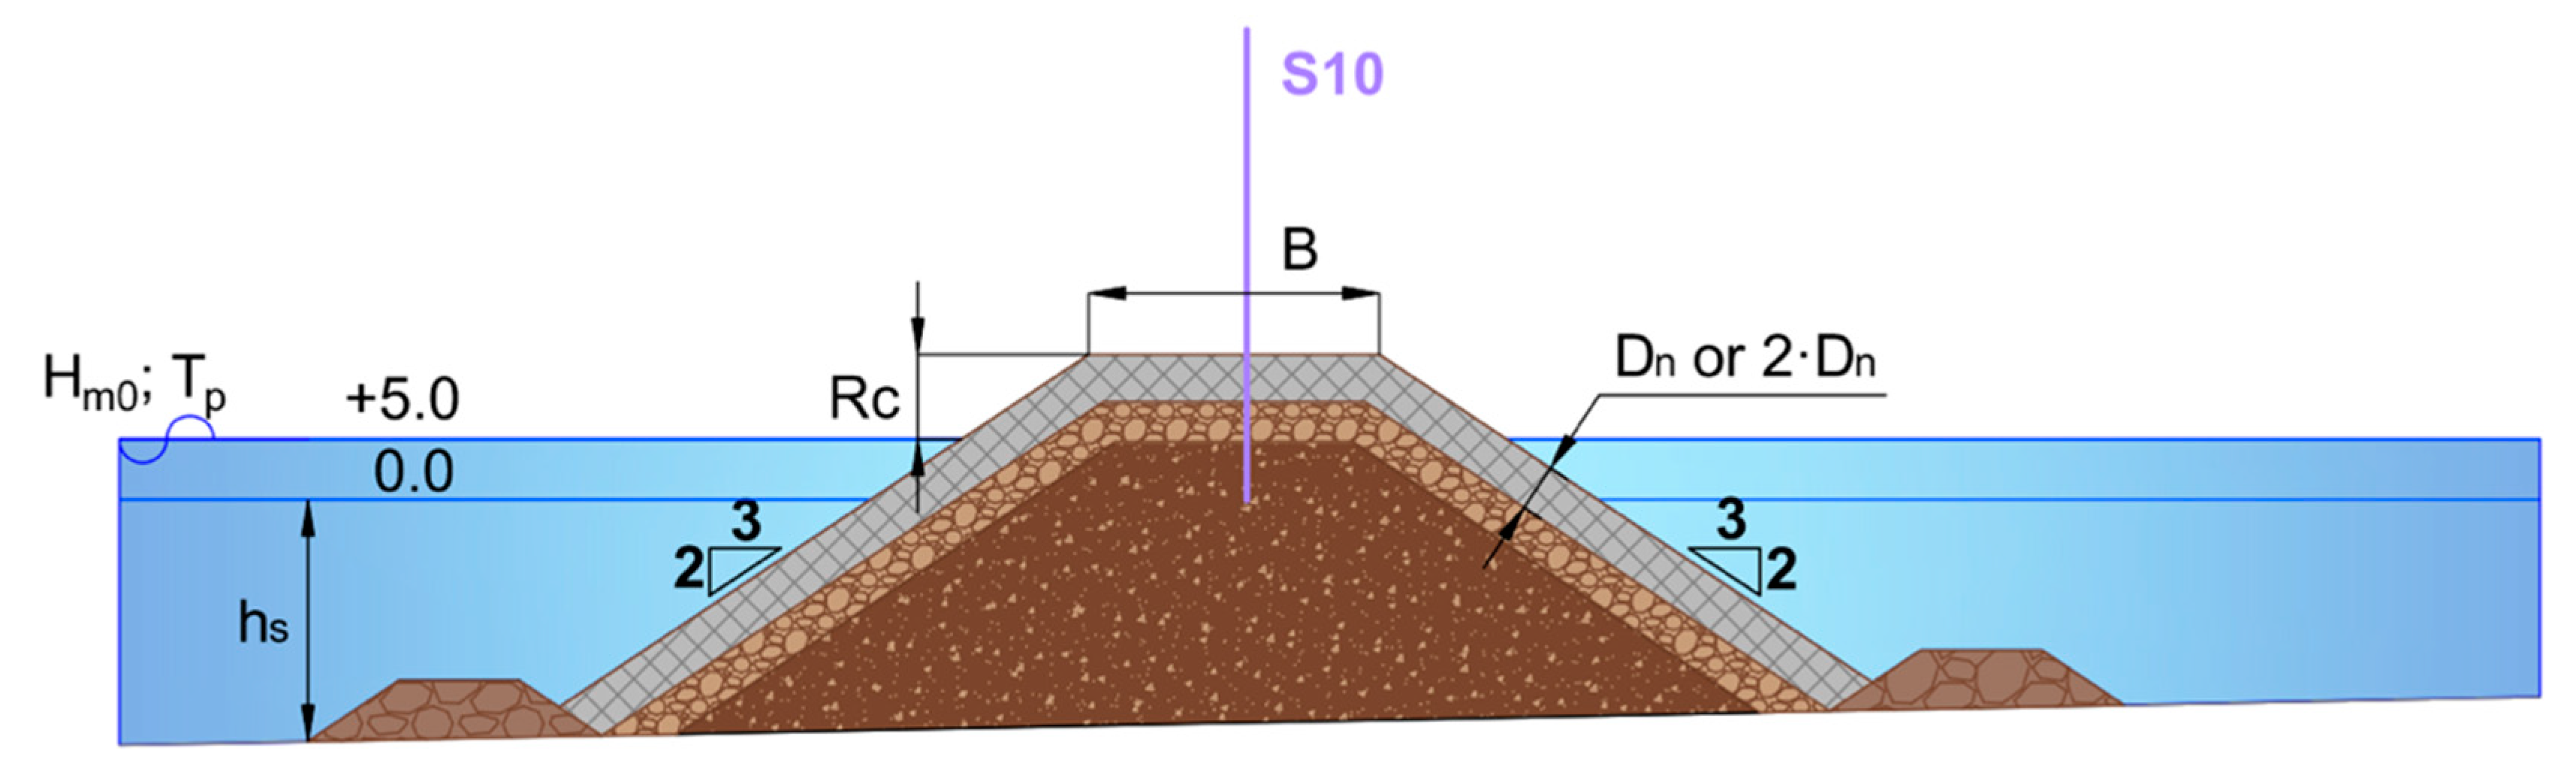
Mound breakwaters with armor slope H/V = 3/2 and rock toe berms were tested. Three armor layers were considered: (1) double-layer randomly placed rock (rock-2L with Dn50 = 3.18 cm), (2) double-layer randomly-placed cube (cube-2L with Dn = 3.97 cm) and (3) single-layer Cubipod® (Cubipod®-1L with Dn = 3.79 cm). The initial packing density of the tested armors was Φ = (1 − p) = 0.63, 0.59 and 0.60 for rock-2L, cube-2L and Cubipod®-1L, respectively. To guarantee the toe berm hydraulic stability during the experiments, tests carried out on a bottom slope m = 2% were conducted using a medium-sized rock toe berm (Dn50 = 2.3 cm) while tests conducted with m = 4% were performed with a larger rock toe berm (Dn50 = 3.9 cm). The same filter and core materials were considered for the three armor layers; a filter layer with Dn = 1.78 cm and a core with Dn = 0.68 cm were placed under the armor. Figure 2 shows the tested cross-section whereas Table 2 provides a summary of the characteristics of the materials used during the tests.
Runs of 1000 random waves were generated following a JONSWAP spectrum (γ = 3.3). The AWACS wave absorption system was activated to avoid multireflections in the wave flume. Neither low-frequency oscillations nor piling-up were significant during the tests. The LPC-UPV wave flume prevents piling-up by allowing water to recirculate through a double floor.
Two water depths (hs) at the toe of the structure were tested for each model and foreshore configuration (m = 2% and 4%). All tests except those corresponding to cube-2L with m = 2% were performed with hs = 20 cm and 25 cm. Tests with cube-2L on m = 2% were conducted with hs = 25 cm and 30 cm. For each water depth at the toe (hs), Hm0 and the peak period (Tp) at the wave generation zone were calculated so as to maintain approximately constant the wave steepness (s0p = Hm0/L0p = 2πHm0/(gTp2)) through each test series (s0p = 0.02 and 0.05). For each s0p, Hm0 at the wave generation zone (Hm0,g) was augmented in steps of 1 cm from no damage to initiation of destruction of the armor layer or wave breaking at the wave generation zone. Table 3 shows the range of the main variables during the tests. Note that wave characteristics (Hm0 and Tp) are provided at a distance of 3hs from the toe of the structure following recommendations by [4].
Eleven capacitive wave gauges were installed to measure water surface elevation all along the wave flume. Five wave gauges (S1 to S5) were placed in the wave generation zone following [30]; S1 to S5 were used to separate incident and reflected waves in the wave generation zone. Four wave gauges (S6 to S9) were installed close to the model at distances from the model toe 5hs, 4hs, 3hs and 2hs, respectively. It should be noted that depth-induced wave breaking takes place in the model zone, so the existing methods to separate incident and reflected waves are not reliable. Two extra wave gauges were placed in the middle of the breakwater crest (S10) and behind the breakwater model (S11); S10 was used to analyze the overtopping layer thickness [31] whereas S11 was used to detect possible phenomena of water piling-up. Overtopping discharges were recorded using a weighting system located behind the model [32].
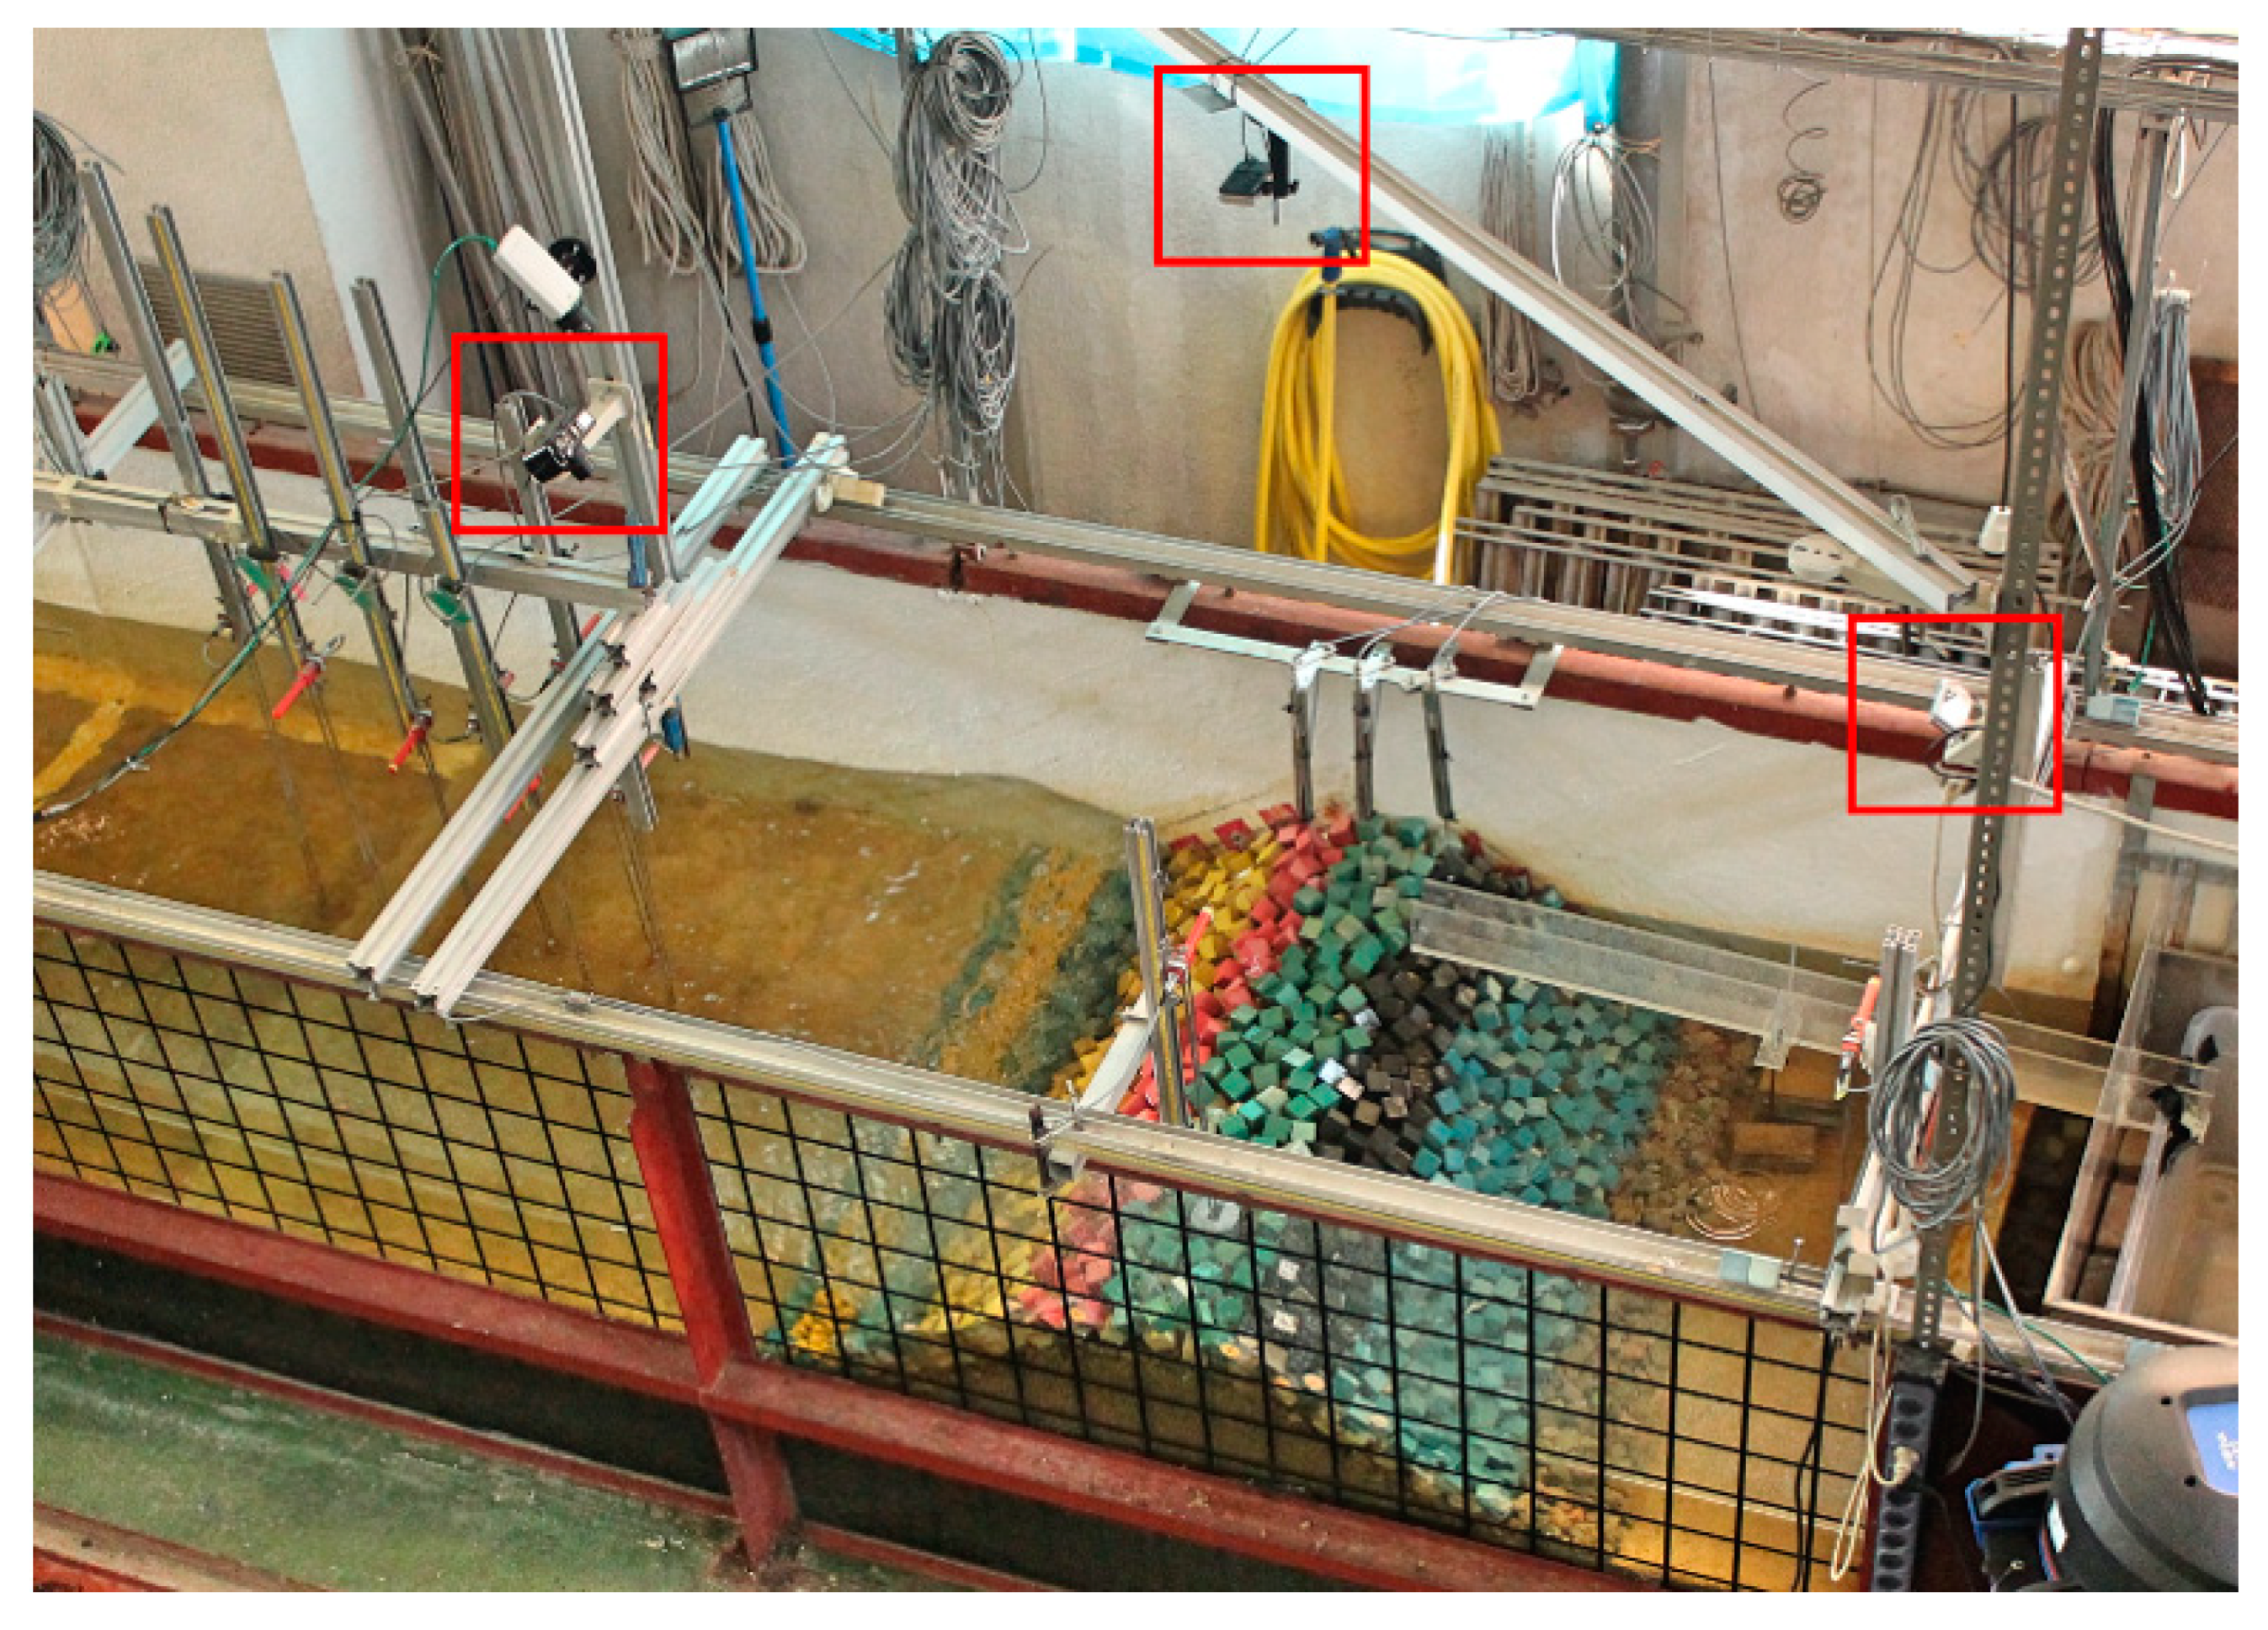
Three cameras were also installed perpendicular to front slope, crest and rear side of the armor in order to analyze the armor damage using the Virtual Net method (see Figure 3). Photographs were taken before starting the tests and after each test run.
4. Data Analysis
In Section 3, the experimental set up and instrumentation are described. Here, data from the described experiments are analyzed; the incident wave characteristics in the model zone and the equivalent dimensionless armor damage (Se) after each test are obtained using the Virtual Net method.
4.1. Wave Analysis
As mentioned in Section 3, wave gauges S1 to S5 were placed close to the wave maker. The LASA-V method [33] together with wave gauges S1 to S5 were used to separate incident and reflected waves in the wave generation zone. Note that LASA-V method can be applied to nonstationary and nonlinear irregular waves. However, it is not possible to separate incident and reflected waves using methods in the literature when wave breaking occurs. Therefore, the SwanOne model [34] was applied to characterize waves in the model zone. The SwanOne model uses the input incident wave conditions to fit a JONSWAP spectrum (γ = 3.3) in the wave generation zone. This spectrum is propagated along a given bathymetry and the Composite Weibull distribution recommended by [35] is assumed to characterize the wave height distribution in shallow foreshores. Since the SwanOne model considers frequencies within a range typical for prototype scale (0.03–0.8 Hz), a reference scale 1/30 was assumed in this study.
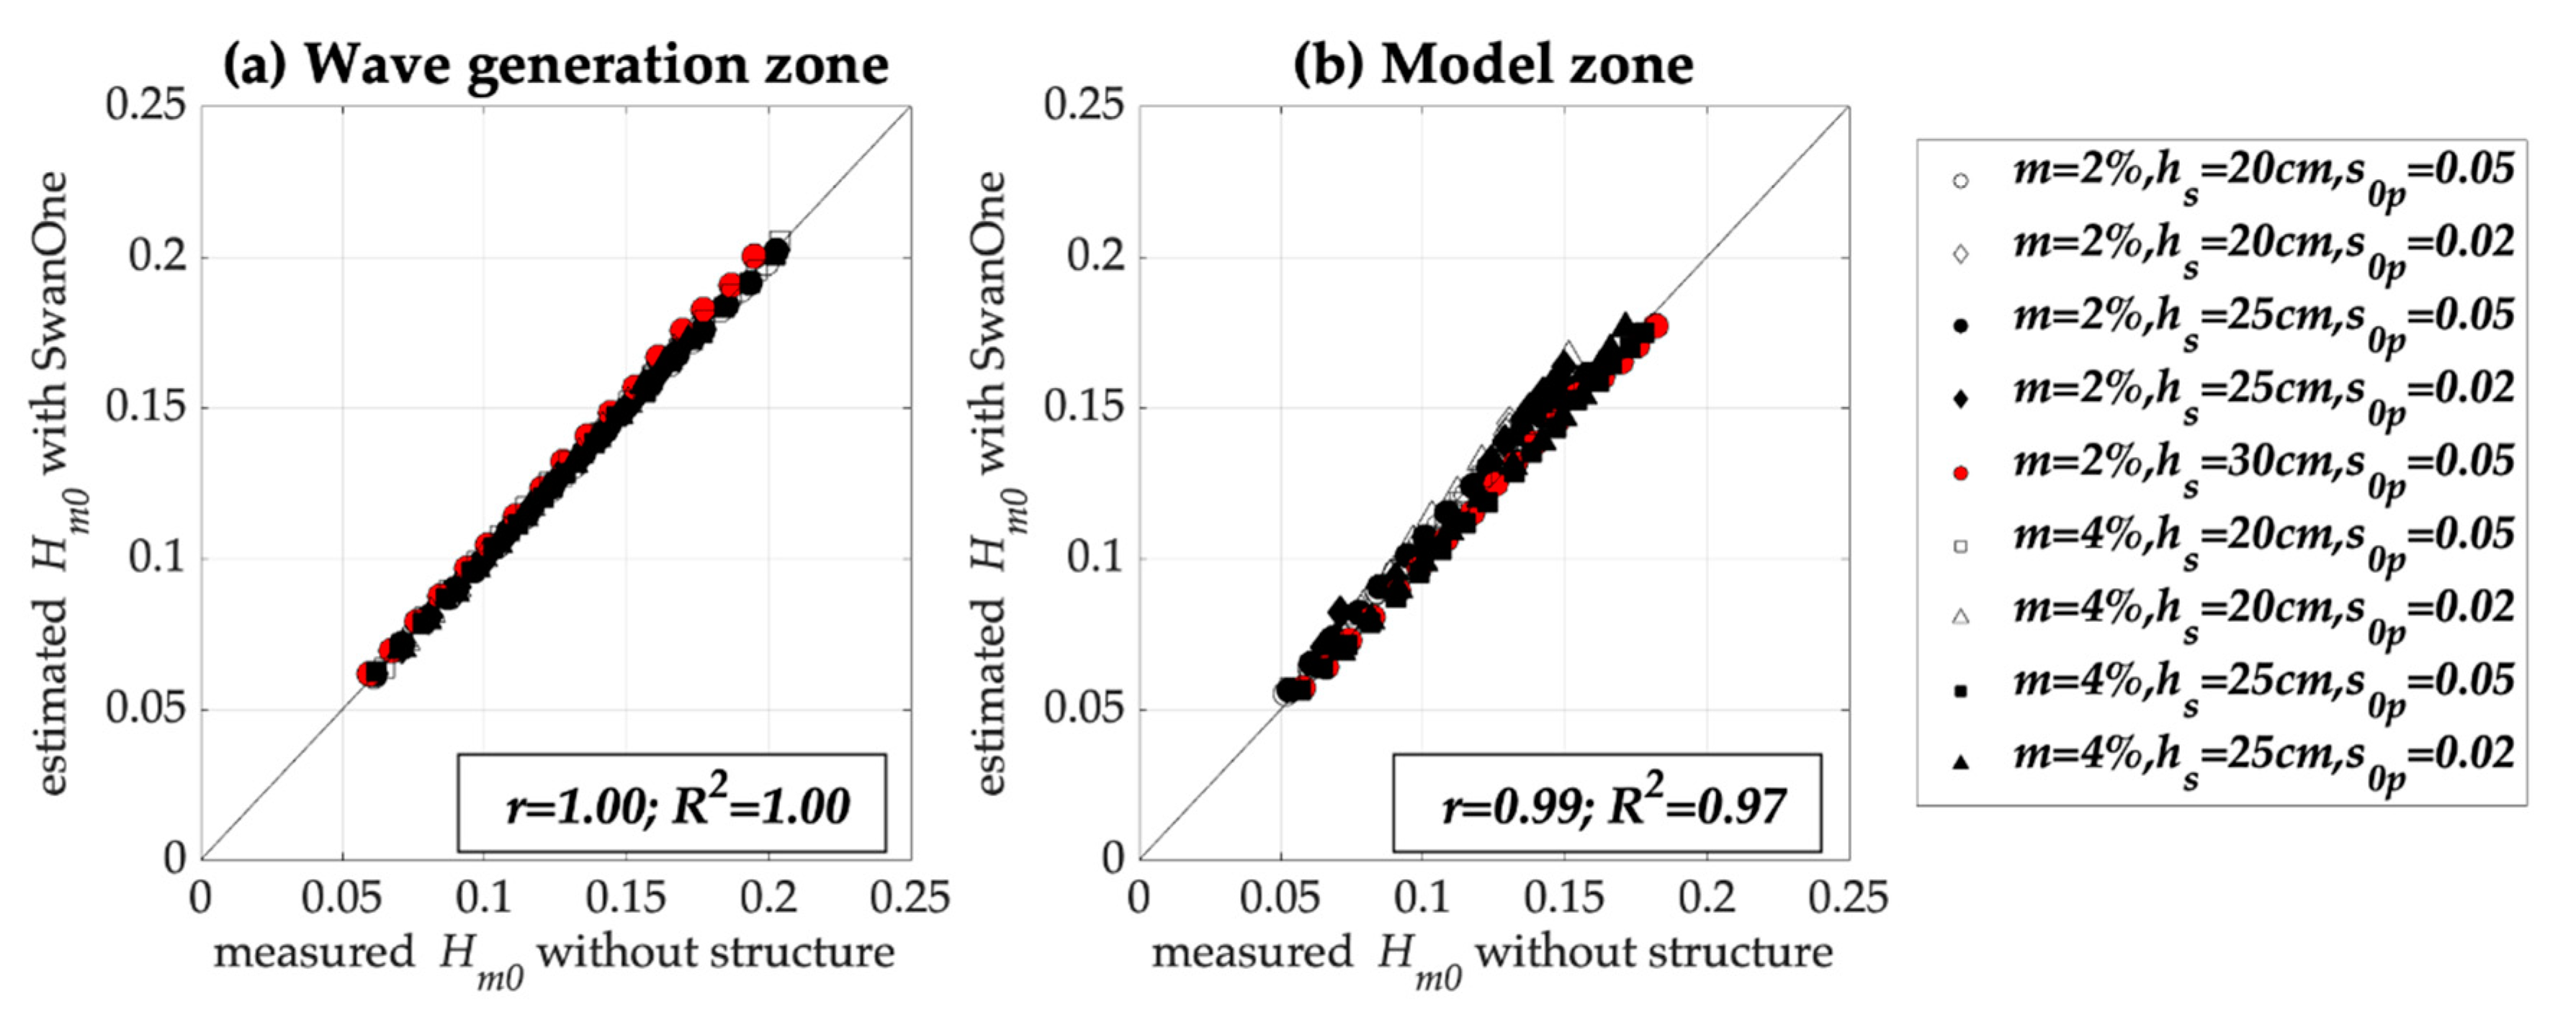
Following [4], the SwanOne model is validated here using tests without a structure. An efficient passive wave absorption system was installed at the end of the flume (Kr = Hm0,r/Hm0,i < 0.25) during the test without a structure. The measurements of these test (total waves) were compared with results provided by the SwanOne model at both the wave generation zone (Figure 4a) and the model zone (Figure 4b). The comparisons at the wave generation zone represent the capability of the SwanOne model to fit to the input incident waves to a JONSWAP spectrum.
Two statistics were used in this study to quantify the goodness of fit: (1) the correlation coefficient (r), and (2) the coefficient of determination (R2). 0 ≤ r ≤ 1 assessed the correlation, and 0 ≤ R2 ≤ 1 estimates the proportion of variance explained by the model. Therefore, the higher the r and the higher the R2, the better.
where No is the number of observations; oi and ei are the observed and estimated values, and is the average observed value. Figure 4 shows a good performance of the SwanOne model to estimate the incident significant wave height both in the wave generation zone (R2 = 1.00) and the model zone (R2 = 0.97).
During the design phase of a mound breakwater, the design significant incident wave height has to be estimated at the location where the mound breakwater will be built; thus, Hm0 estimated by SwanOne is applied in this study to estimate the significant incident wave height at the toe of the structure.
4.2. Armor Damage
In Section 2.1, quantitative and qualitative methods to analyze the hydraulic stability of mound breakwaters are summarized. As previously mentioned, the Virtual Net method by [11] is applied in this study in order to account for the HeP failure mode in the quantitative analysis of armor damage. Pictures were taken perpendicular to the slope using the cameras as shown in Figure 3 before starting the tests and after each test to analyze the evolution of armor damage over time. The front slope, crest and rear slope were divided into strips. The front slope and rear slope were divided in four strips of 3Dn or 4Dn while one strip of 6Dn was considered on the crest. Only the central part of the model was included in the analysis to avoid interference with the boundaries of the flume or the instrumentation on the crest (see Figure 3). Si was calculated for each strip after each test, and it was integrated to obtain Se. An example of the application of the Virtual Net method on the rock-armored model is presented in Figure 5.
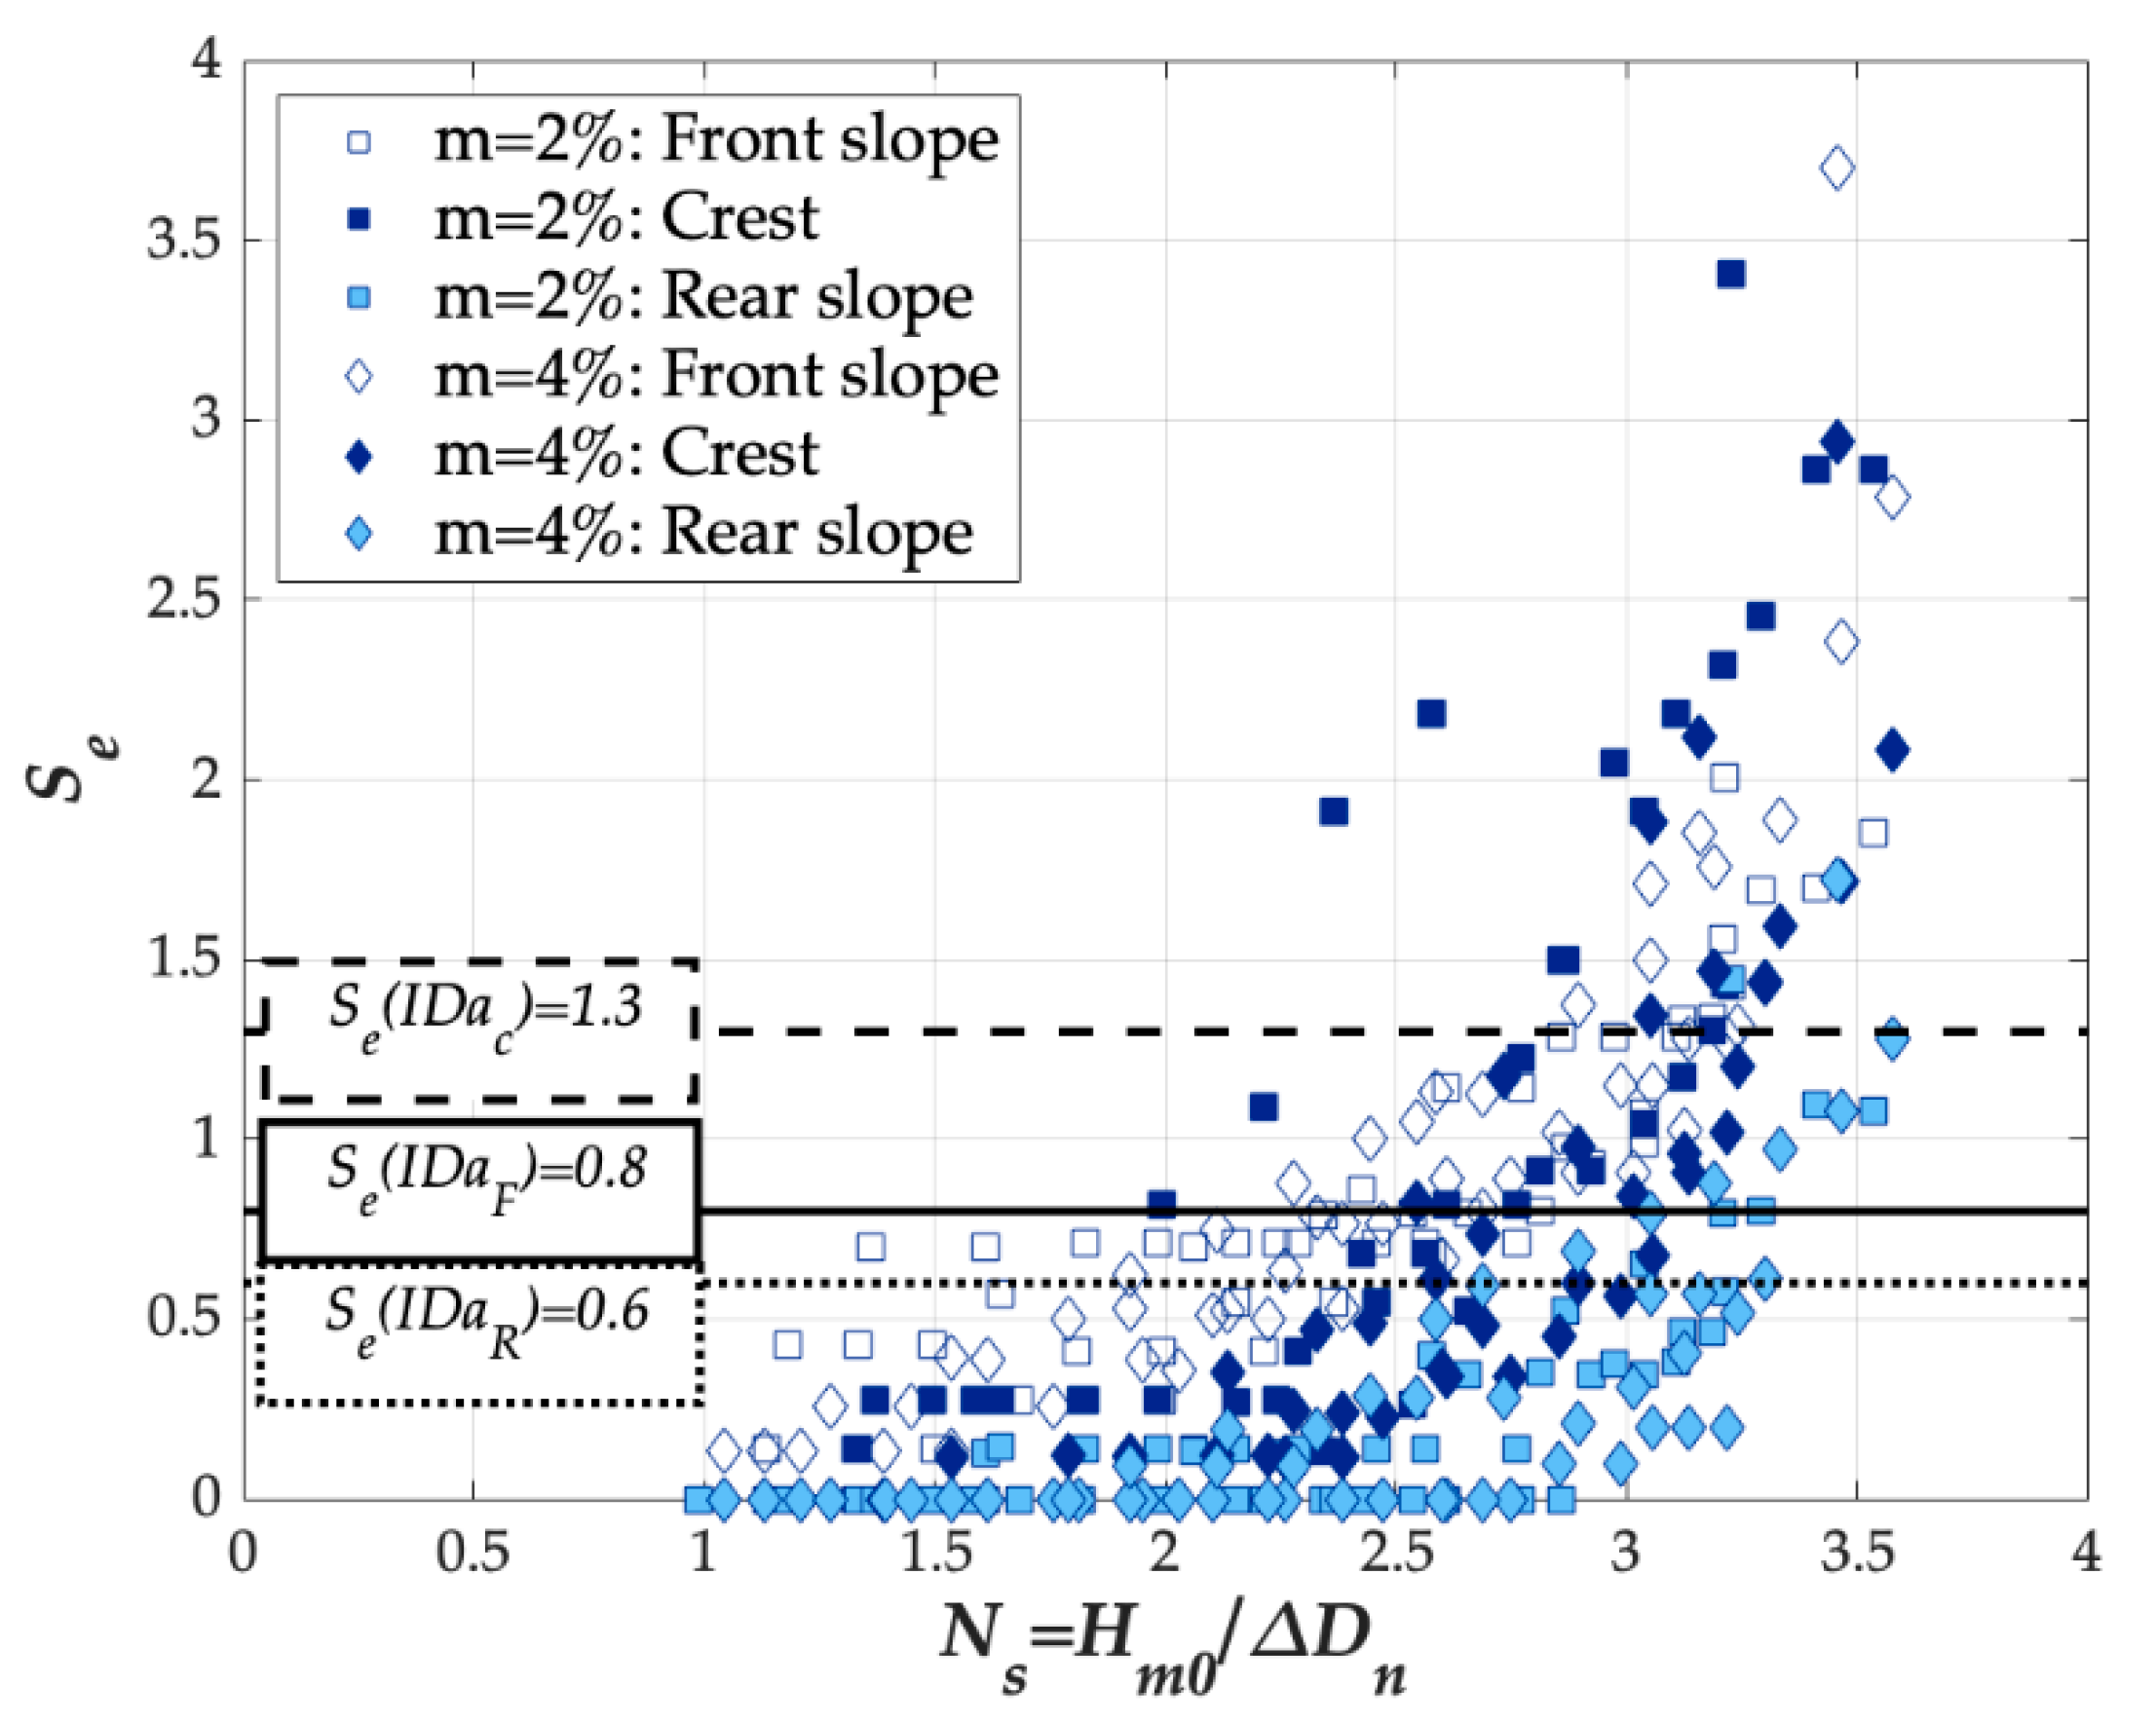
Qualitative levels of armor damage to the rock-2L and cube-2L models were established according to [13,14]. Recommendations given by [15] were applied to determine the qualitative levels of armor damage to the Cubipod®-1L model. IDa and IDe were considered in this study for front slope (F), crest (C) and rear slope (R). Figure 6 presents an example of the experimental results obtained for the cube-2L model.
5. Stability Formulas for Overtopped Mound Breakwaters
In this section, the armor damage to overtopped mound breakwaters is described, and hydraulic stability formulas are derived based on the experimental results from the previous section. Results for m = 2% and 4% were considered as a single population, since no significant differences in the distribution of Se were observed [7].
In the following sections, hydraulic stability formulas are fitted for the different sections of the armor (front slope, crest and rear slope) of each tested armor layer (rock-2L, cube-2L and Cubipod®-1L). For further analysis, only values Se > 0.05 are considered. As mentioned in Section 2.2, Herrera et al. [4] obtained a 6-power relationship between Hm0 and Se; this may indicate that the 5-power suggested for non-breaking wave conditions may not be the best relationship in depth-limited breaking wave conditions. Thus, Equation (14) is assumed to describe armor damage, similar to [4].
where K1 and K2 are empirical coefficients to be calibrated, and Ns = Hm0/ΔDn is the stability number calculated with Hm0 given by the SwanOne model at a distance of 3hs from the toe of the model, following the recommendations by [4,29].
5.1. Rock-Armored Model
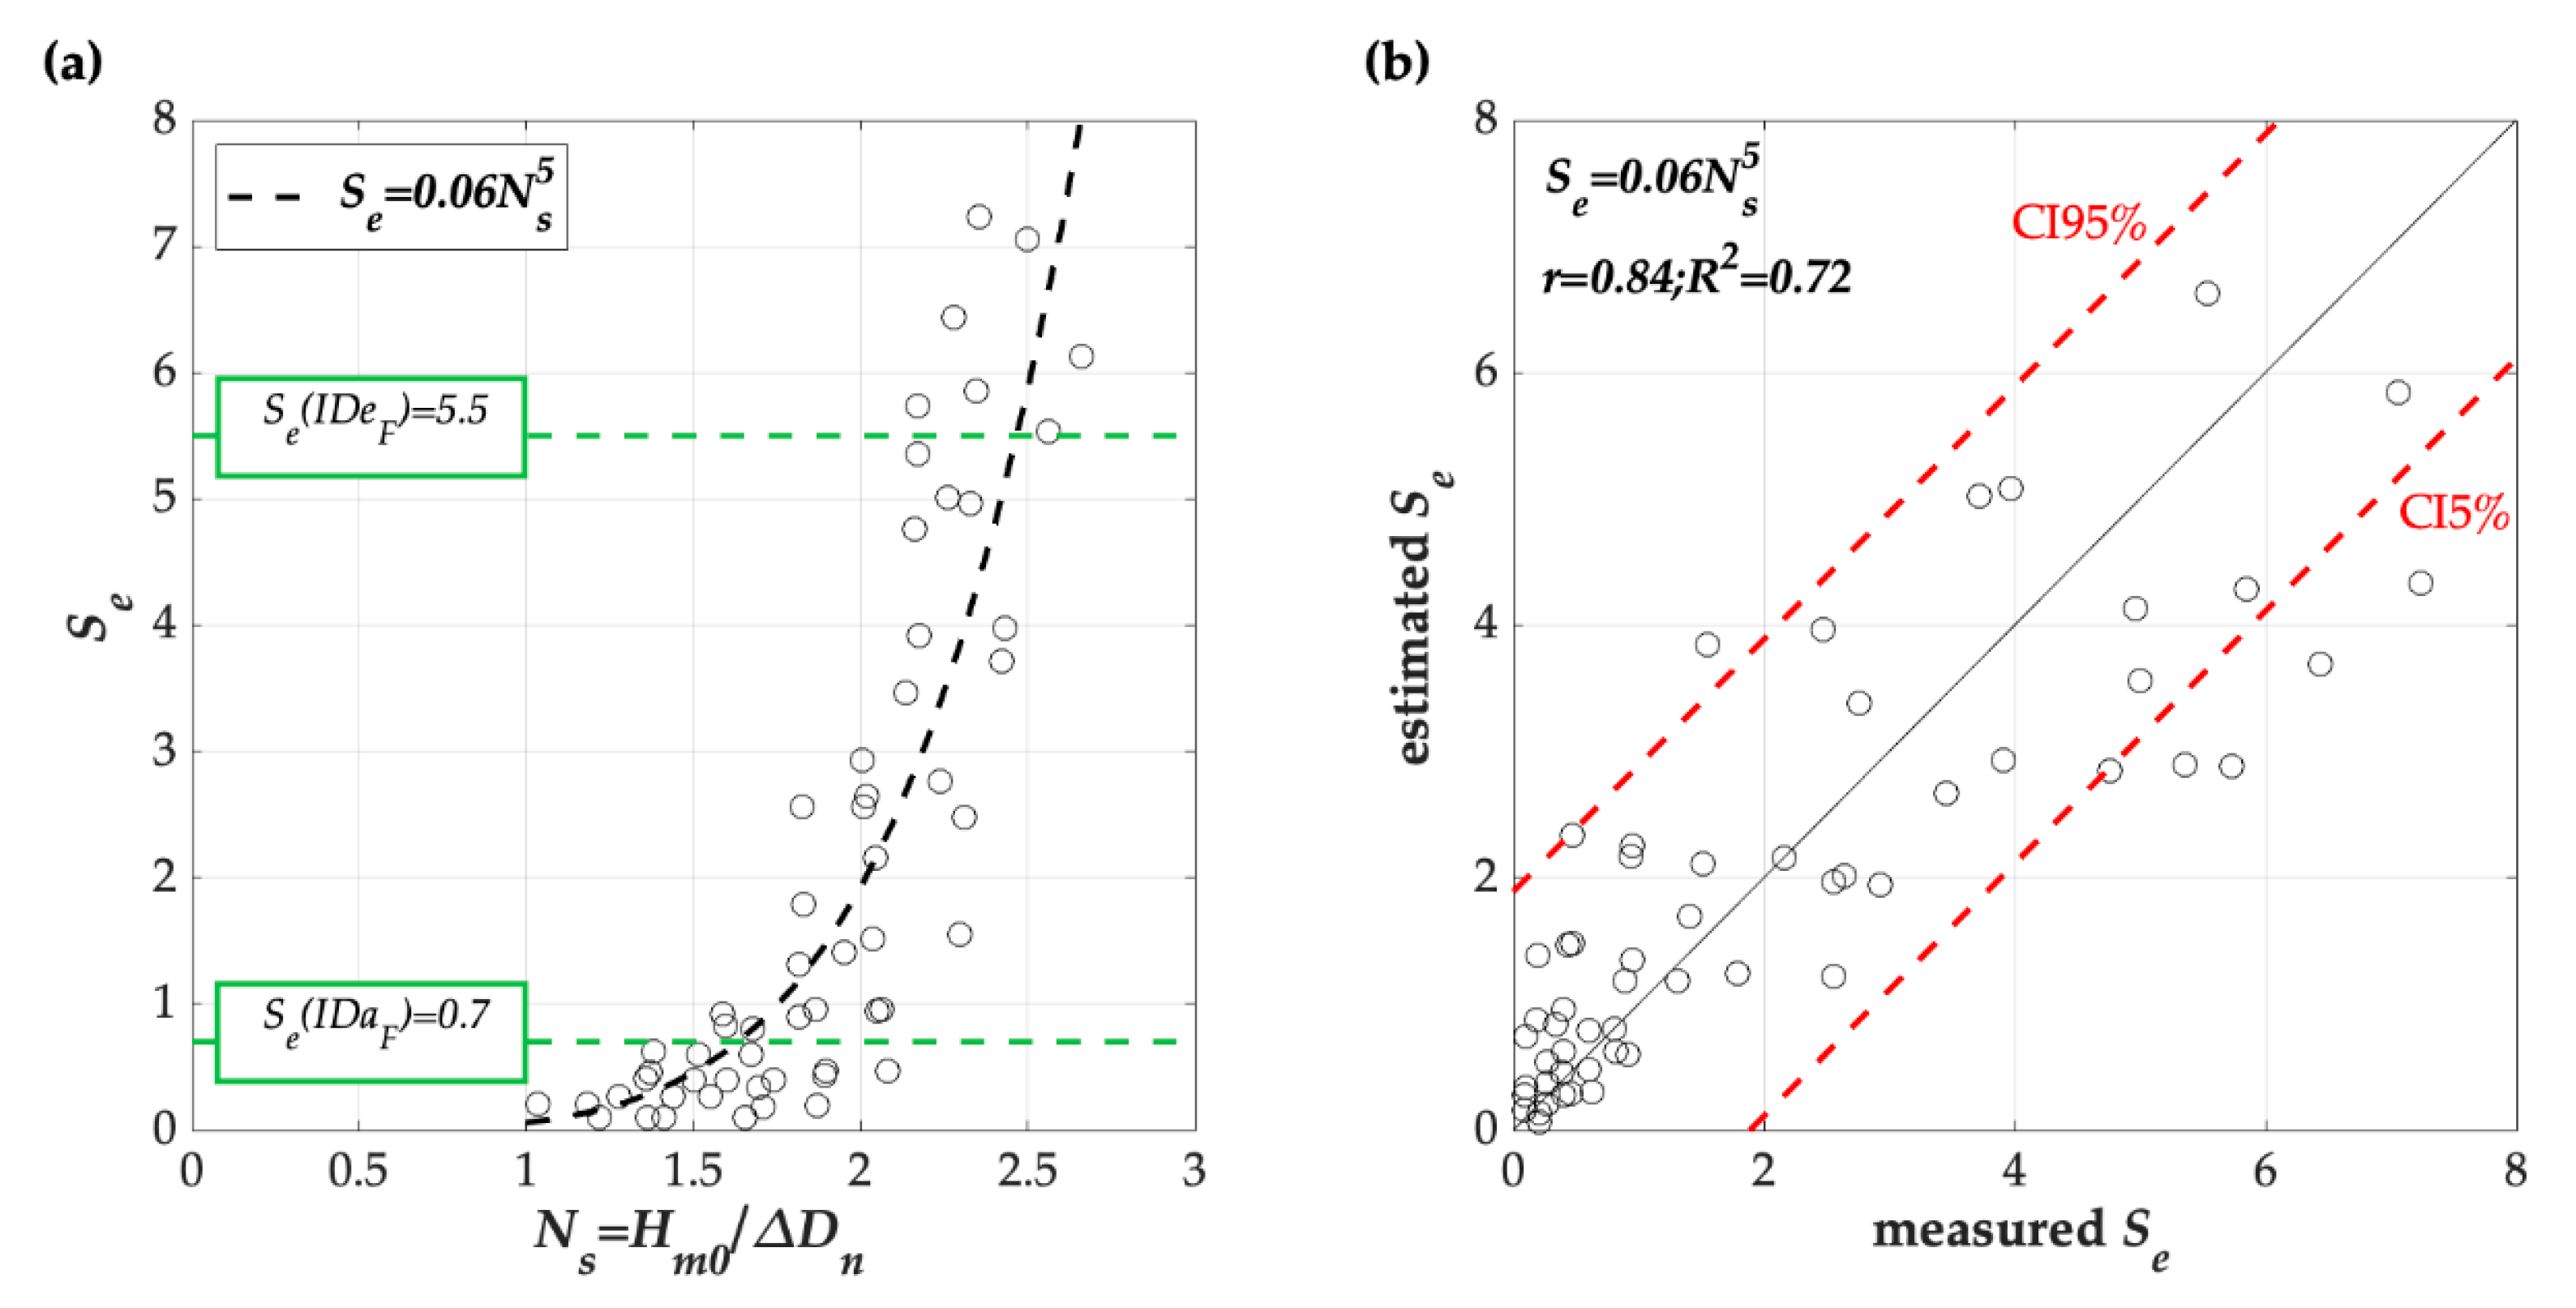
The failure of the front slope of the rock-armored model was achieved before noticeable overtopping discharges took place (Q = q/(gHm03)0.5 < 4 × 10⁻⁴, where q is the mean wave overtopping discharge and g is the gravity acceleration), so the armor damage appeared mainly on the front slope. Thus, only results for the front slope are used to calibrate Equation (14) in this section; the best fit was obtained for K1 = 0.06 and K2 = 5 with R2 = 0.72. Figure 7a shows the fit of Equation (14) with K1 = 0.06 and K2 = 5 to the experimental data, as well as the IDa and IDe levels. Figure 7b compares the measured and estimated Se using Equation (14) with K1 = 0.06 and K2 = 5; the 90% confidence interval (CI) is also given.
Equation (14) with K1 = 0.06 and K2 = 5 is valid within the ranges 1.0 ≤ Hm0/ΔDn ≤ 2.7 and 1.9 ≤ Rc/ΔDn ≤ 2.8. Based on this fitting, Ns (IDa) = 1.6 and Ns (IDe) = 2.5. The 90% confidence interval of Equation (14) shown in Figure 7b was obtained assuming a Gaussian error distribution and it is given by
where var(ε) is the variance of the error.
5.2. Cube-Armored Model
The front slope of the cube-armored model was more stable than that of the rock-armored model, so higher overtopping discharges were reached during the tests (Q < 9 × 10⁻³). Therefore, the armor damage to the front slope, crest and rear side are described in this section.
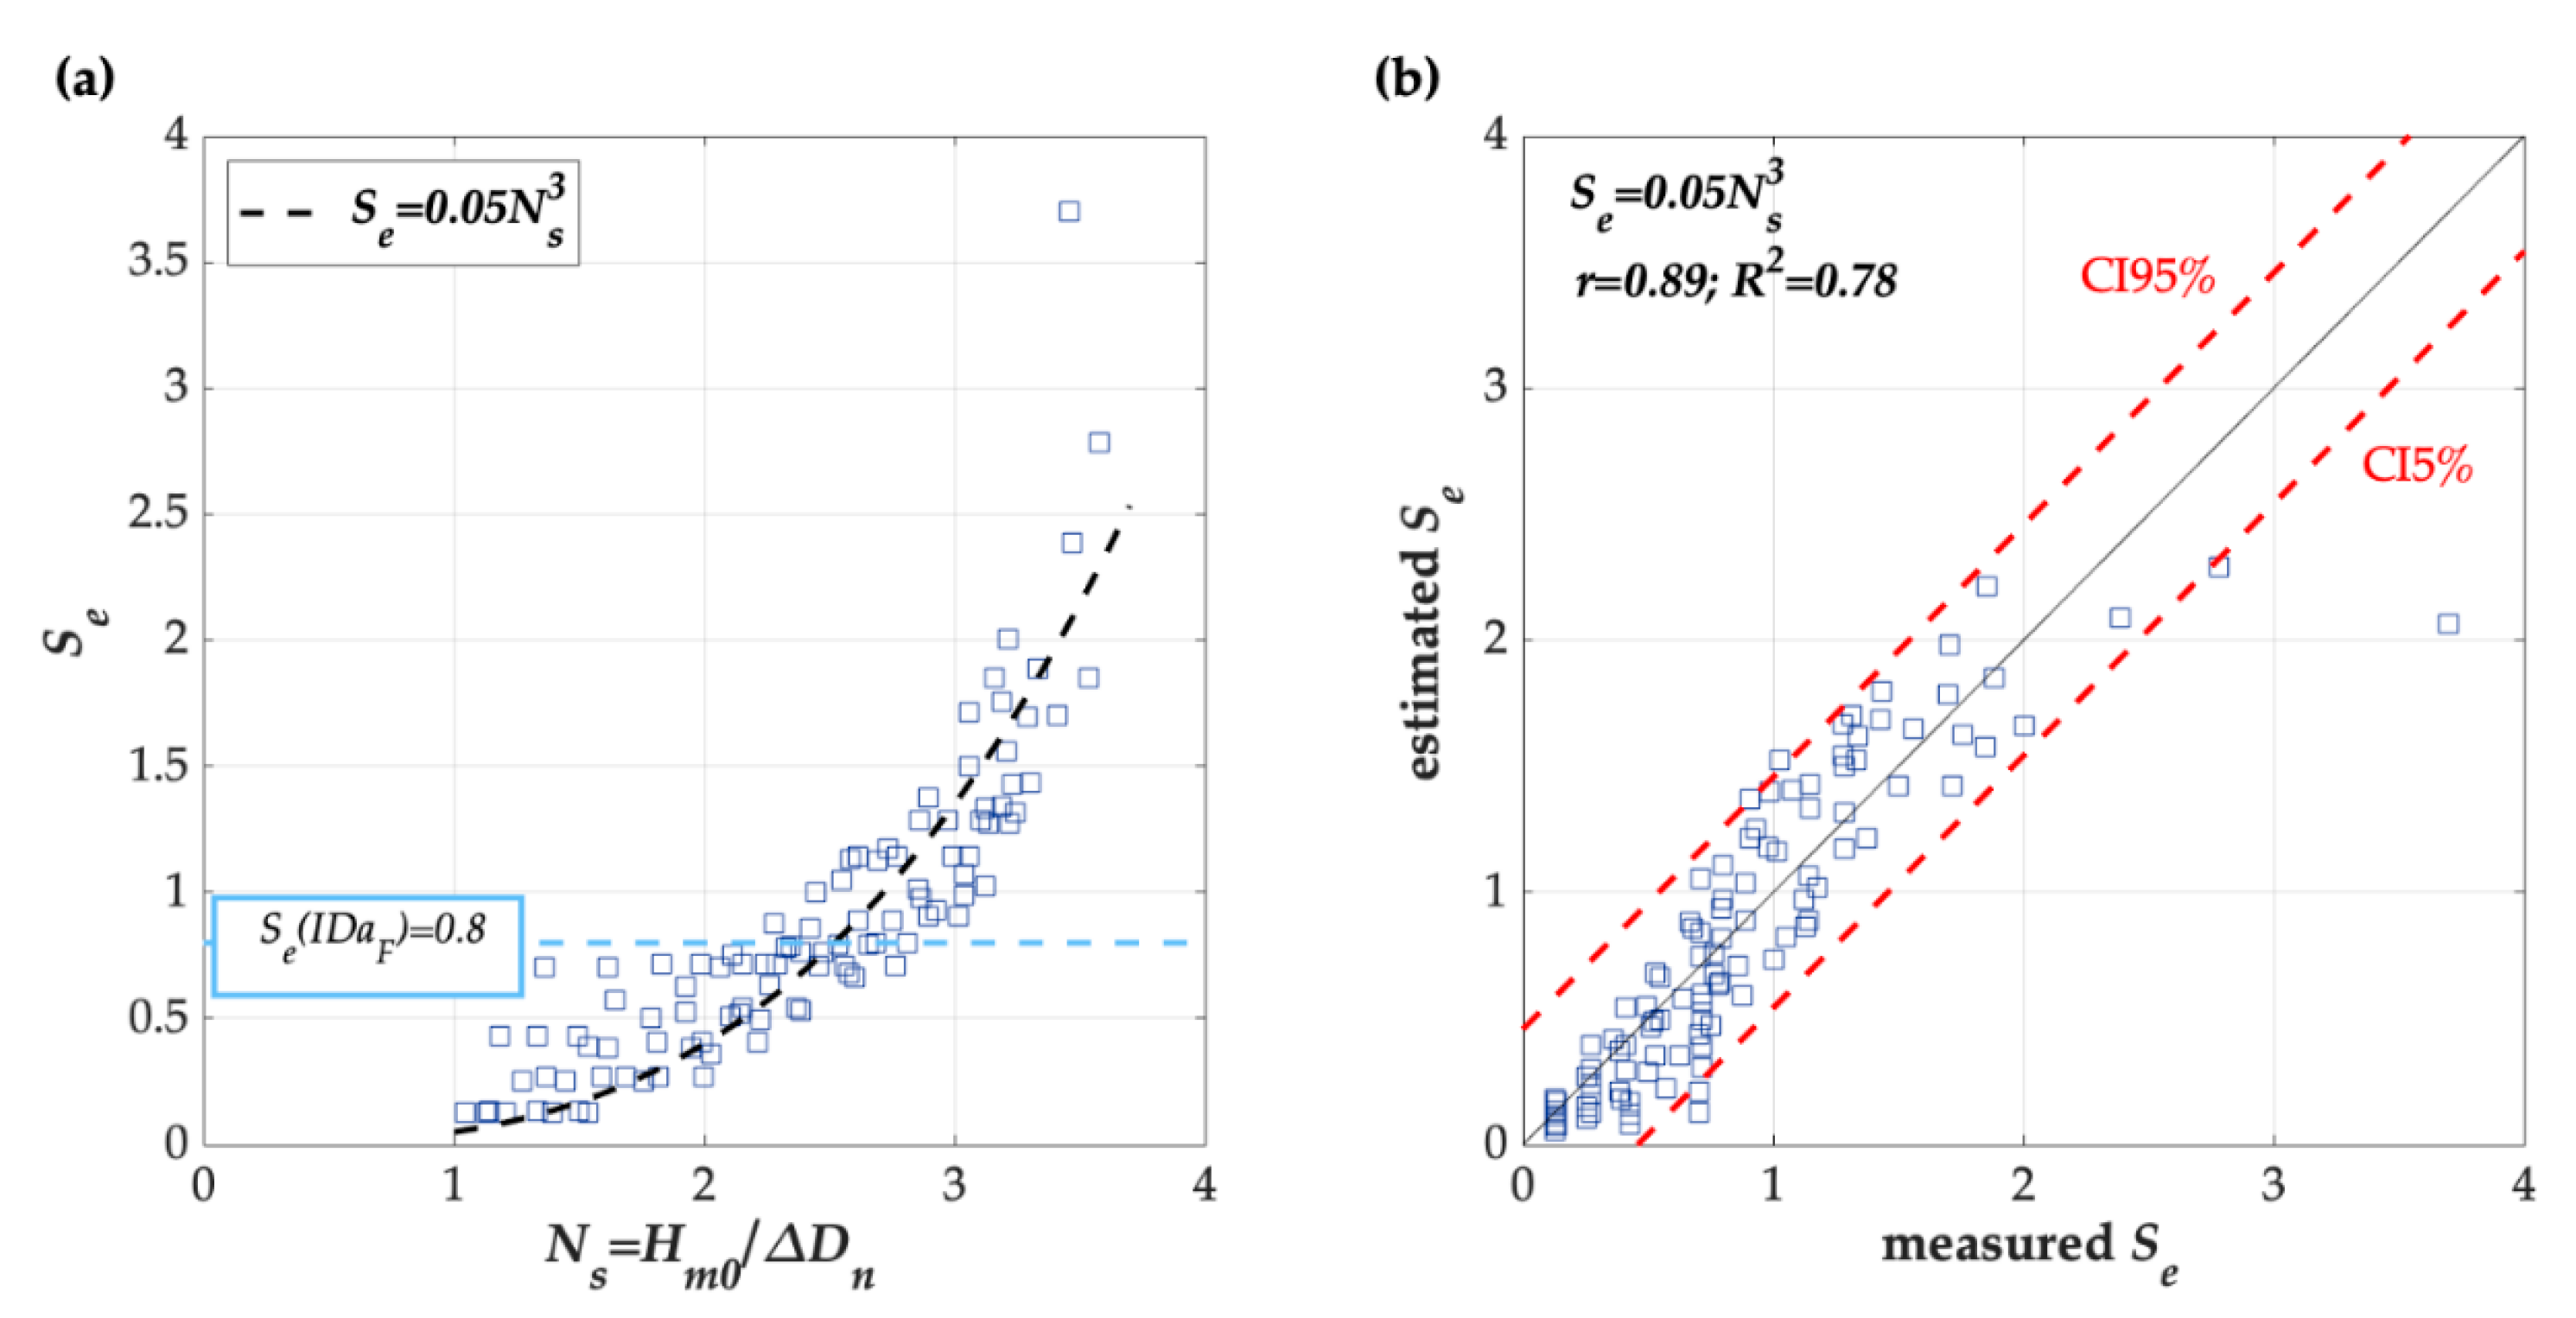
Equation (14) was calibrated for the front slope, crest and rear side using the experimental data in Section 3. The best fit of Equation (14) for the front slope was obtained with K1 = 0.05 and K2 = 3 with a goodness-of-fit of R2 = 0.78. Figure 8a presents the fit of Equation (14) with K1 = 0.05 and K2 = 3 to the experimental data together with the IDa level. Figure 8b compares the measured Se with the estimations provided by Equation (14) with K1 = 0.05 and K2 = 3, as well as the 90% confidence interval.
The empirical coefficients K1 = 0.05 and K2 = 3 for Equation (14) were calibrated within the ranges 1.0 ≤ Hm0/ΔDn ≤ 3.6 and 1.2 ≤ Rc/ΔDn ≤ 3.2. Based on this calibration, Ns (IDa) = 2.5. IDe level was reached in just one test with Se = 3.7, which corresponds to Ns (IDe) = 4.3 when applying Equation (14), but it is beyond of the experimental ranges of the fitted formula. The 90% confidence interval of Equation (14) shown in Figure 8b is calculated, assuming a Gaussian error distribution, as
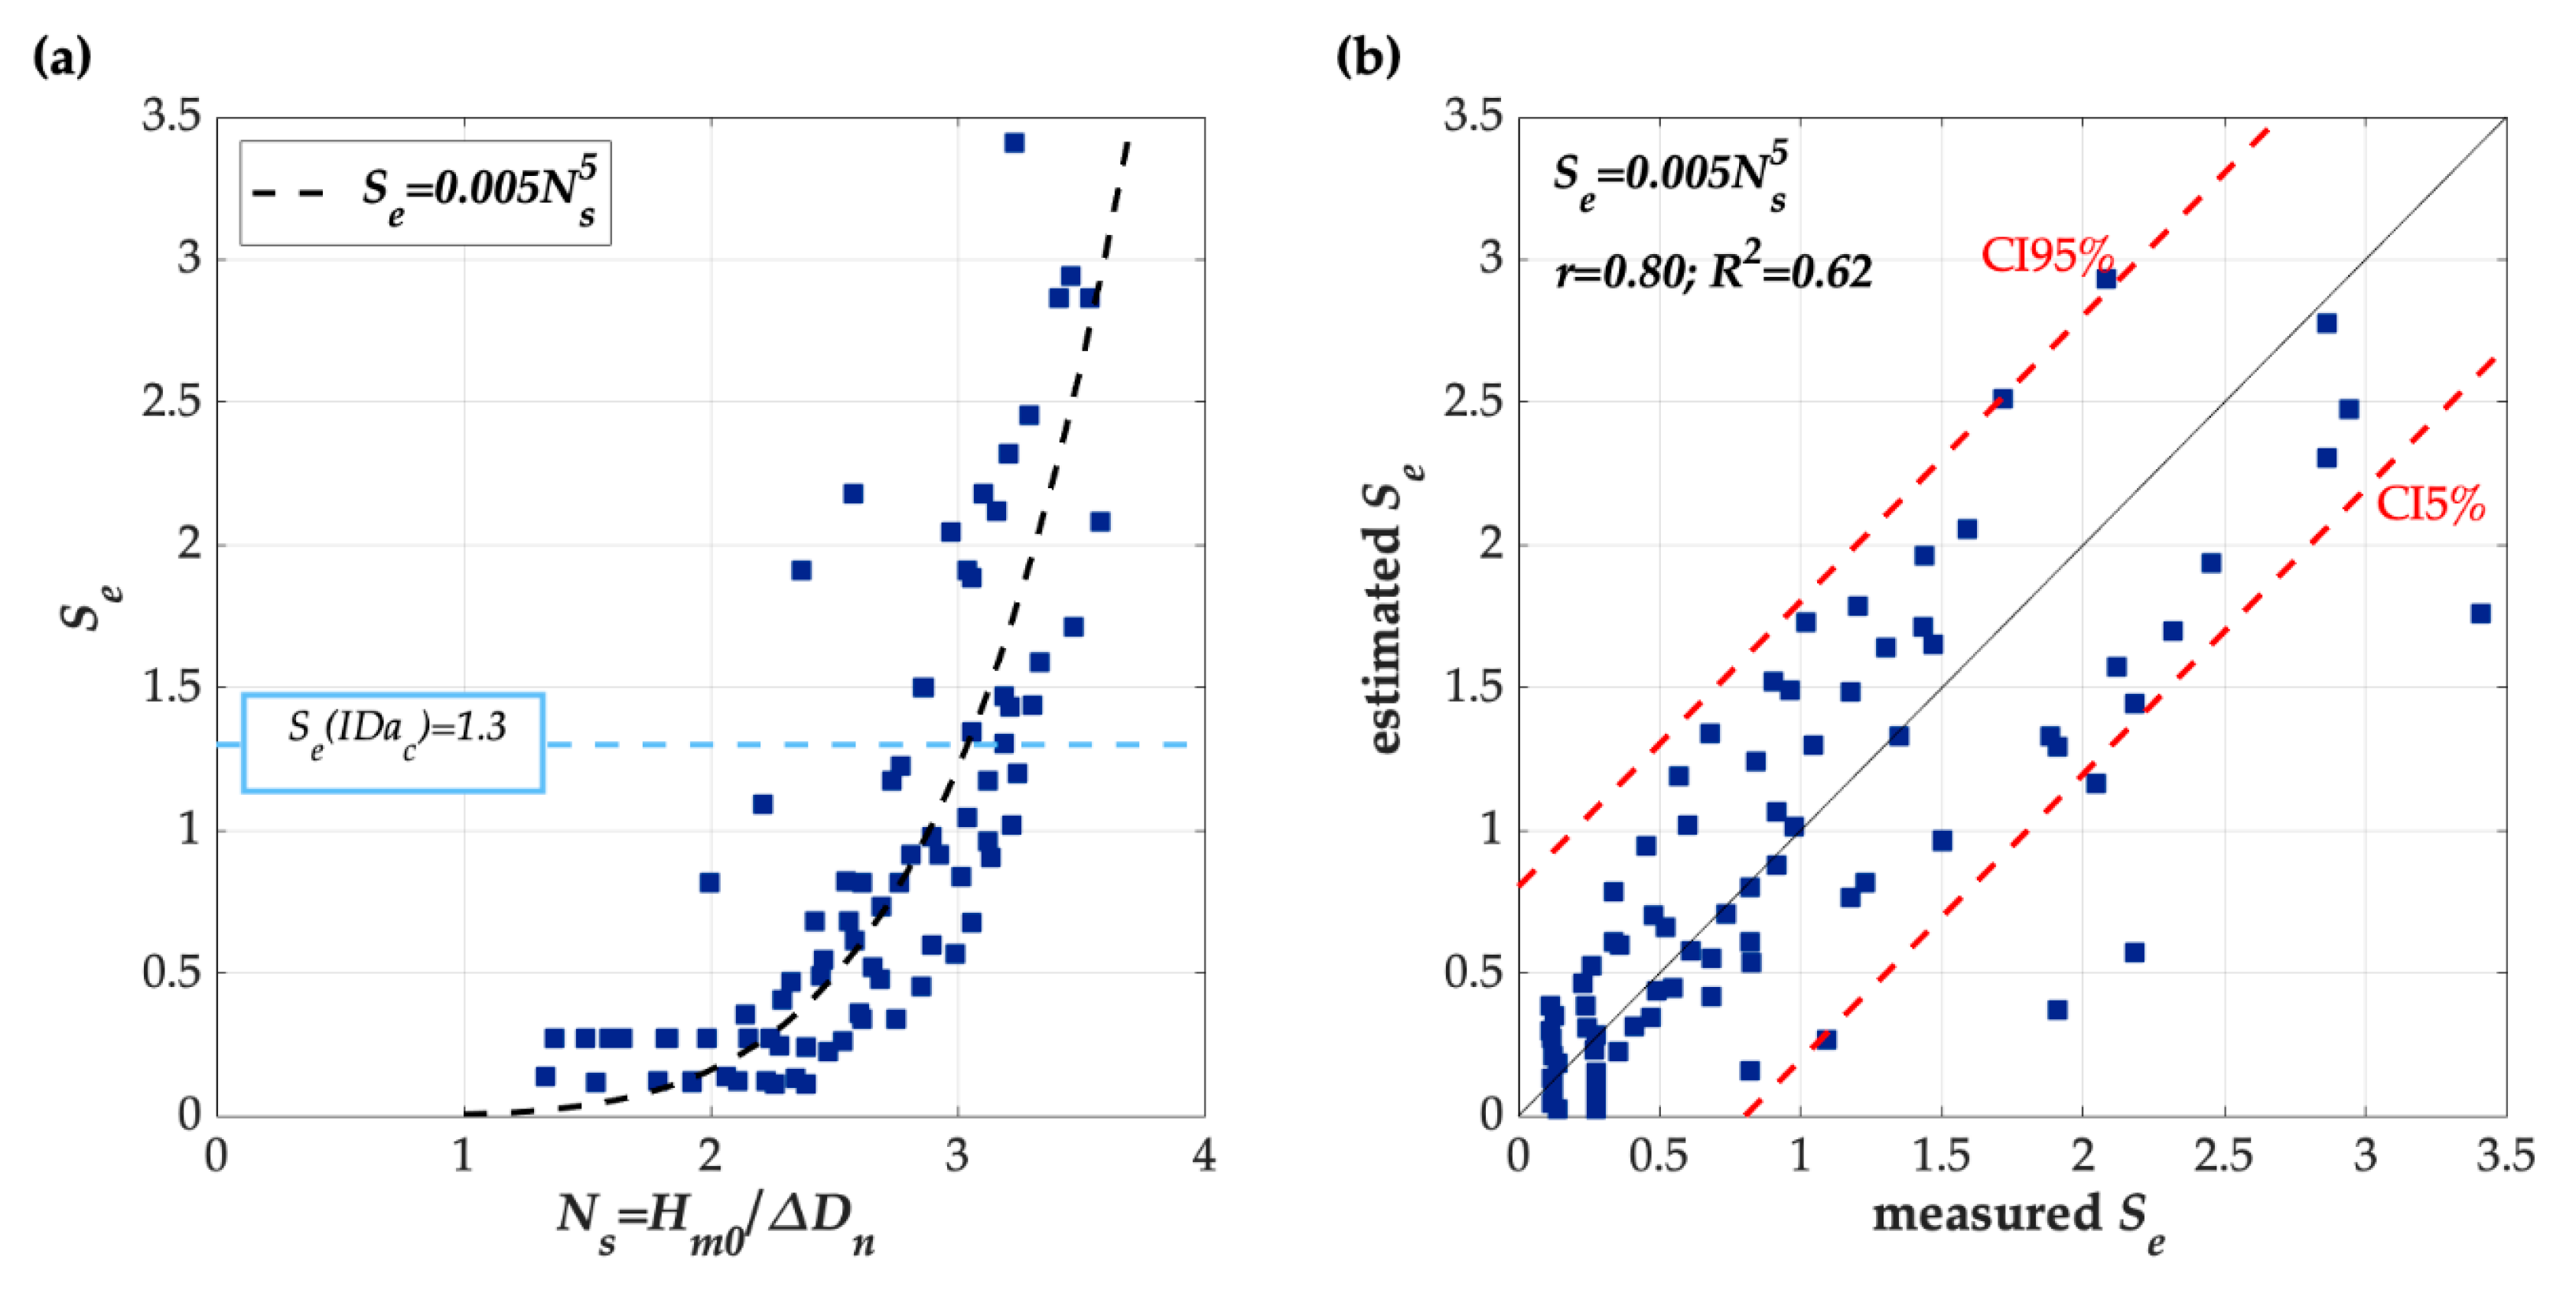
As mentioned above, the crest and rear side of the cube-armored model were damaged due to the significant overtopping discharges. Equation (14) was then fitted for the armored crest; the best results were obtained with K1 = 0.005 and K2 = 5 with R2 = 0.62. In Figure 9a, the performance of Equation (14) when using K1 = 0.005 and K2 = 5 to estimate the damage to the armored crest is presented together with IDa level. Figure 9b compares the measured Se with the estimations given by Equation (14) with K1 = 0.005 and K2 = 5, as well as the 90% confidence interval.
The values of K1 = 0.005 and K2 = 5 for Equation (14) are valid within the ranges 1.2 ≤ Hm0/ΔDn ≤ 2.7 and 1.1 ≤ Rc/ΔDn ≤ 3.6. Based on this formula, Ns (IDa) = 3.0. Similar to the front slope, one test presented IDe level with Se = 3.4. If Equation (14) with K1 = 0.005 and K2 = 5 is applied, Ns (IDe) = 3.7 is obtained. It should be noted that it is beyond the experimental ranges of the fitted formula. Assuming a Gaussian error distribution, the 90% confidence interval of Equation (14) shown in Figure 9b is obtained as
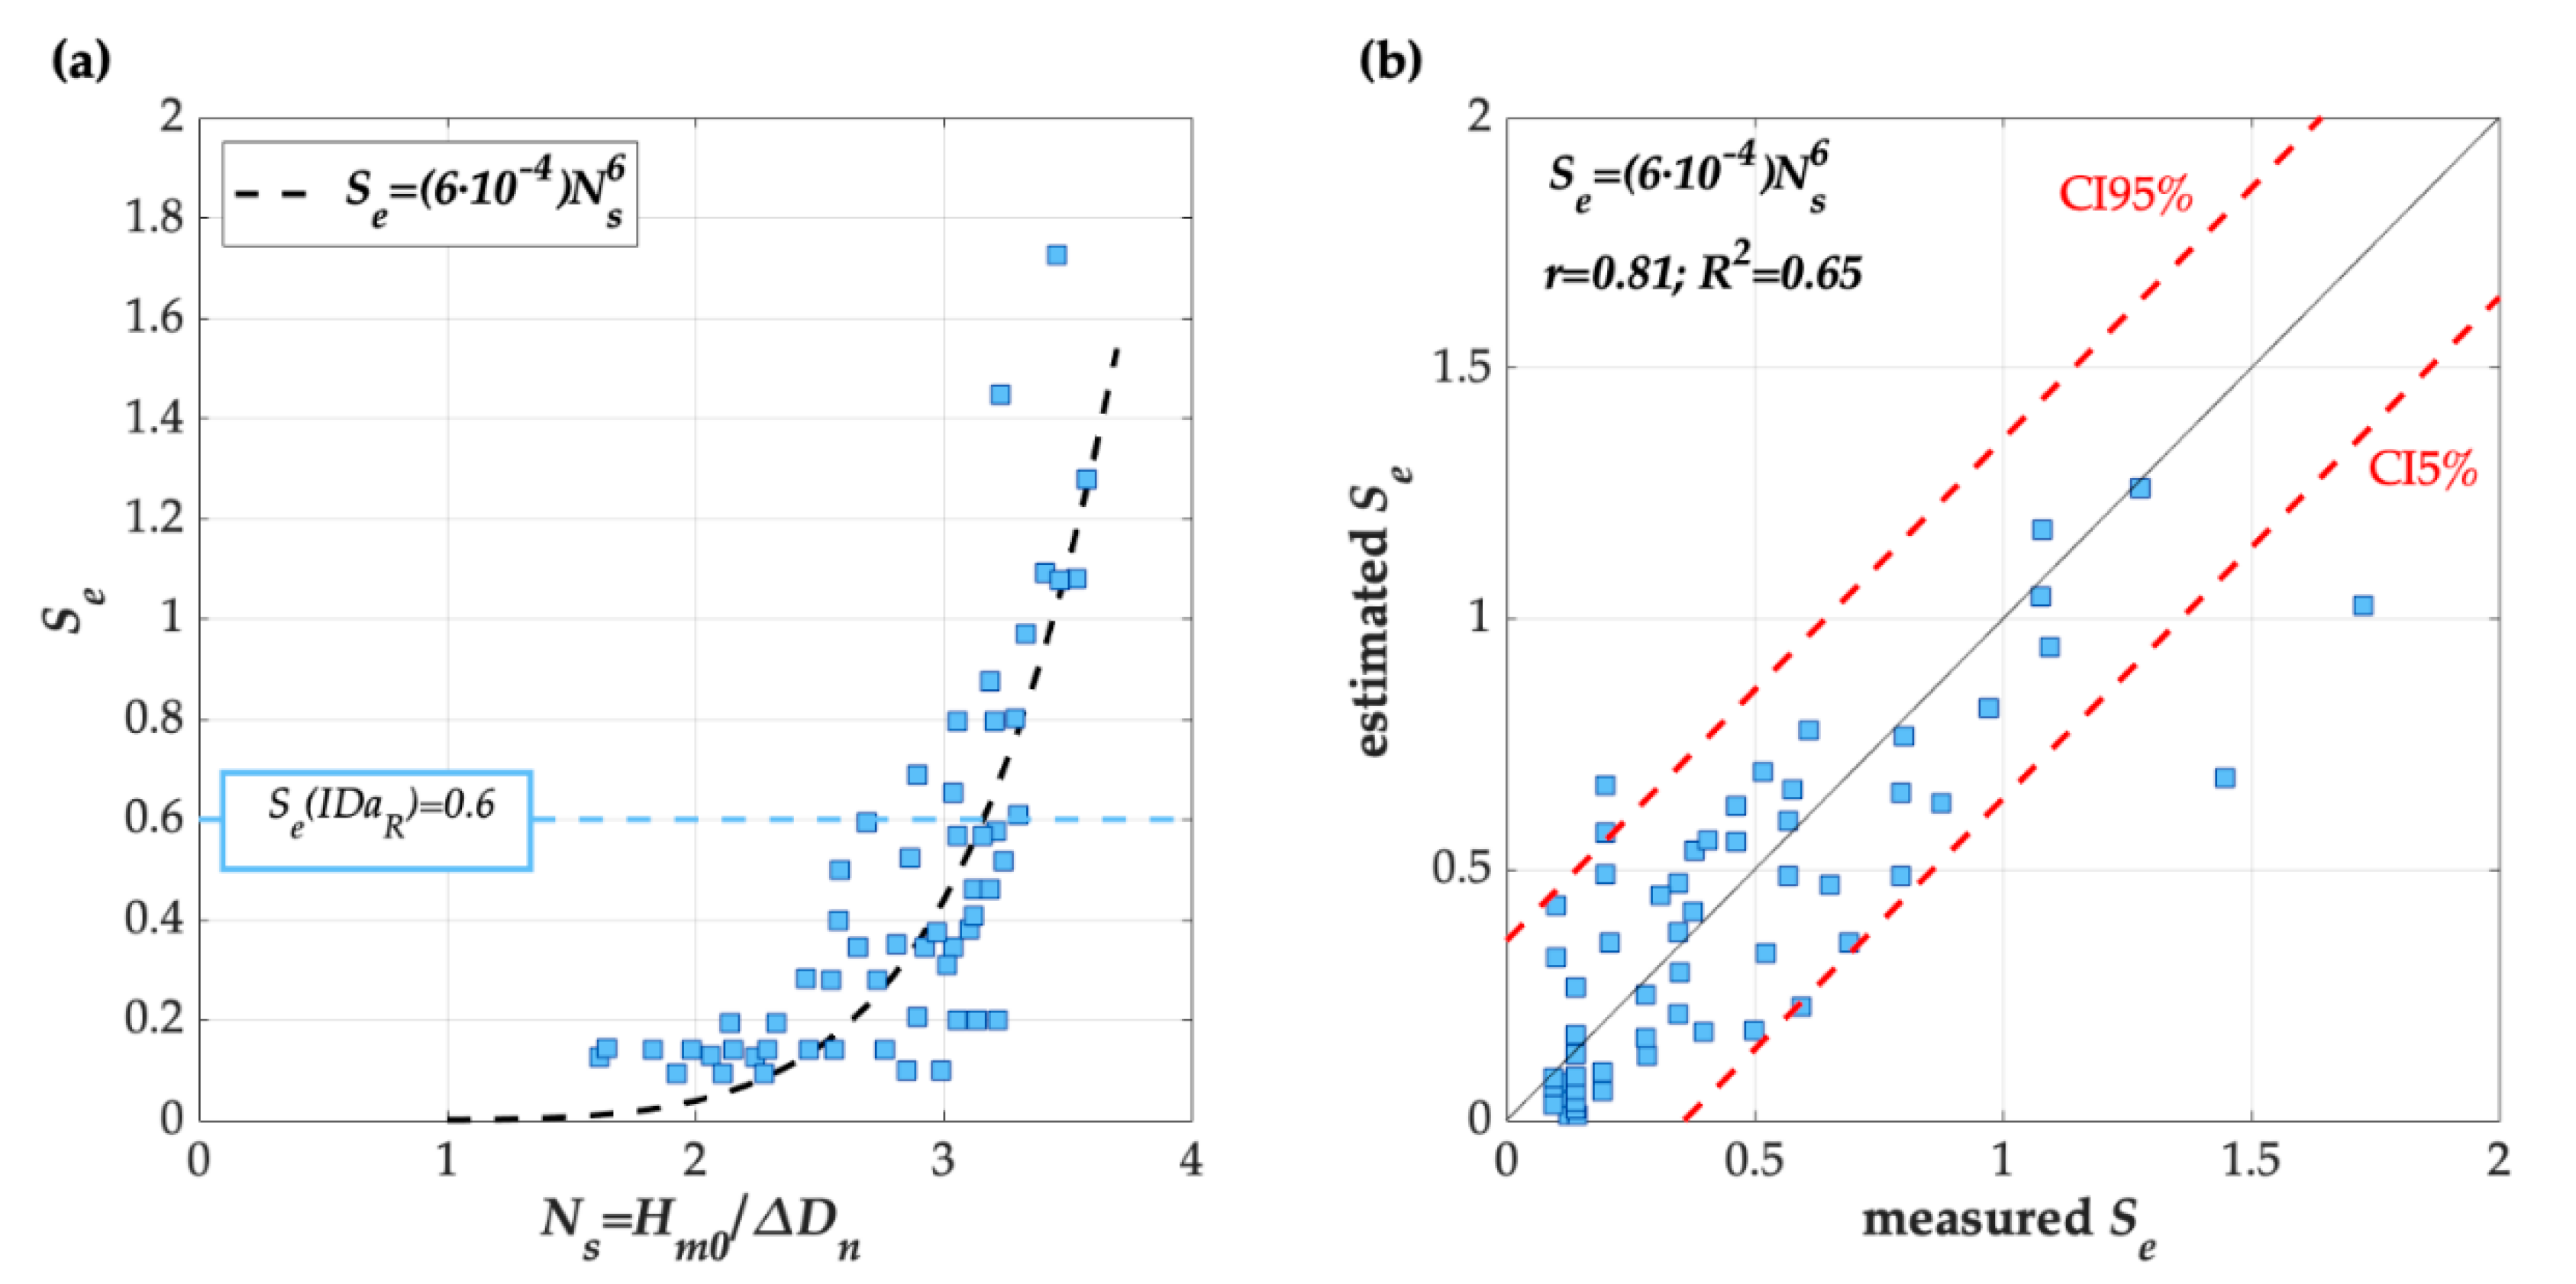
Regarding the rear side, the best fit for Equation (14) was obtained with K1 = 6 × 10⁻⁴ and K2 = 6 with a goodness-of-fit of R2 = 0.65. In Figure 10a, the fit of Equation (14) is shown when using K1 = 6 × 10⁻⁴ and K2 = 6 with the experimental data together with IDa level. Figure 10b compares the measured Se and the estimated Se when applying Equation (14) with K1 = 6 × ;10−4 and K2 = 6, as well as the 90% confidence interval.
K1 = 6 × 10⁻⁴ and K2 = 6 are applicable within the ranges 1.6 ≤ Hm0/ΔDn ≤ 3.6 and 1.1 ≤ Rc/ΔDn ≤ 3.2. If the derived relationship is applied, Se (IDa) = 0.6 leads to Ns (IDa) = 3.2. The damage level IDe was not achieved in any test. The 90% confidence interval of Equation (14) shown in Figure 10b is determined assuming a Gaussian error distribution as
5.3. Cubipod®-Armored Model
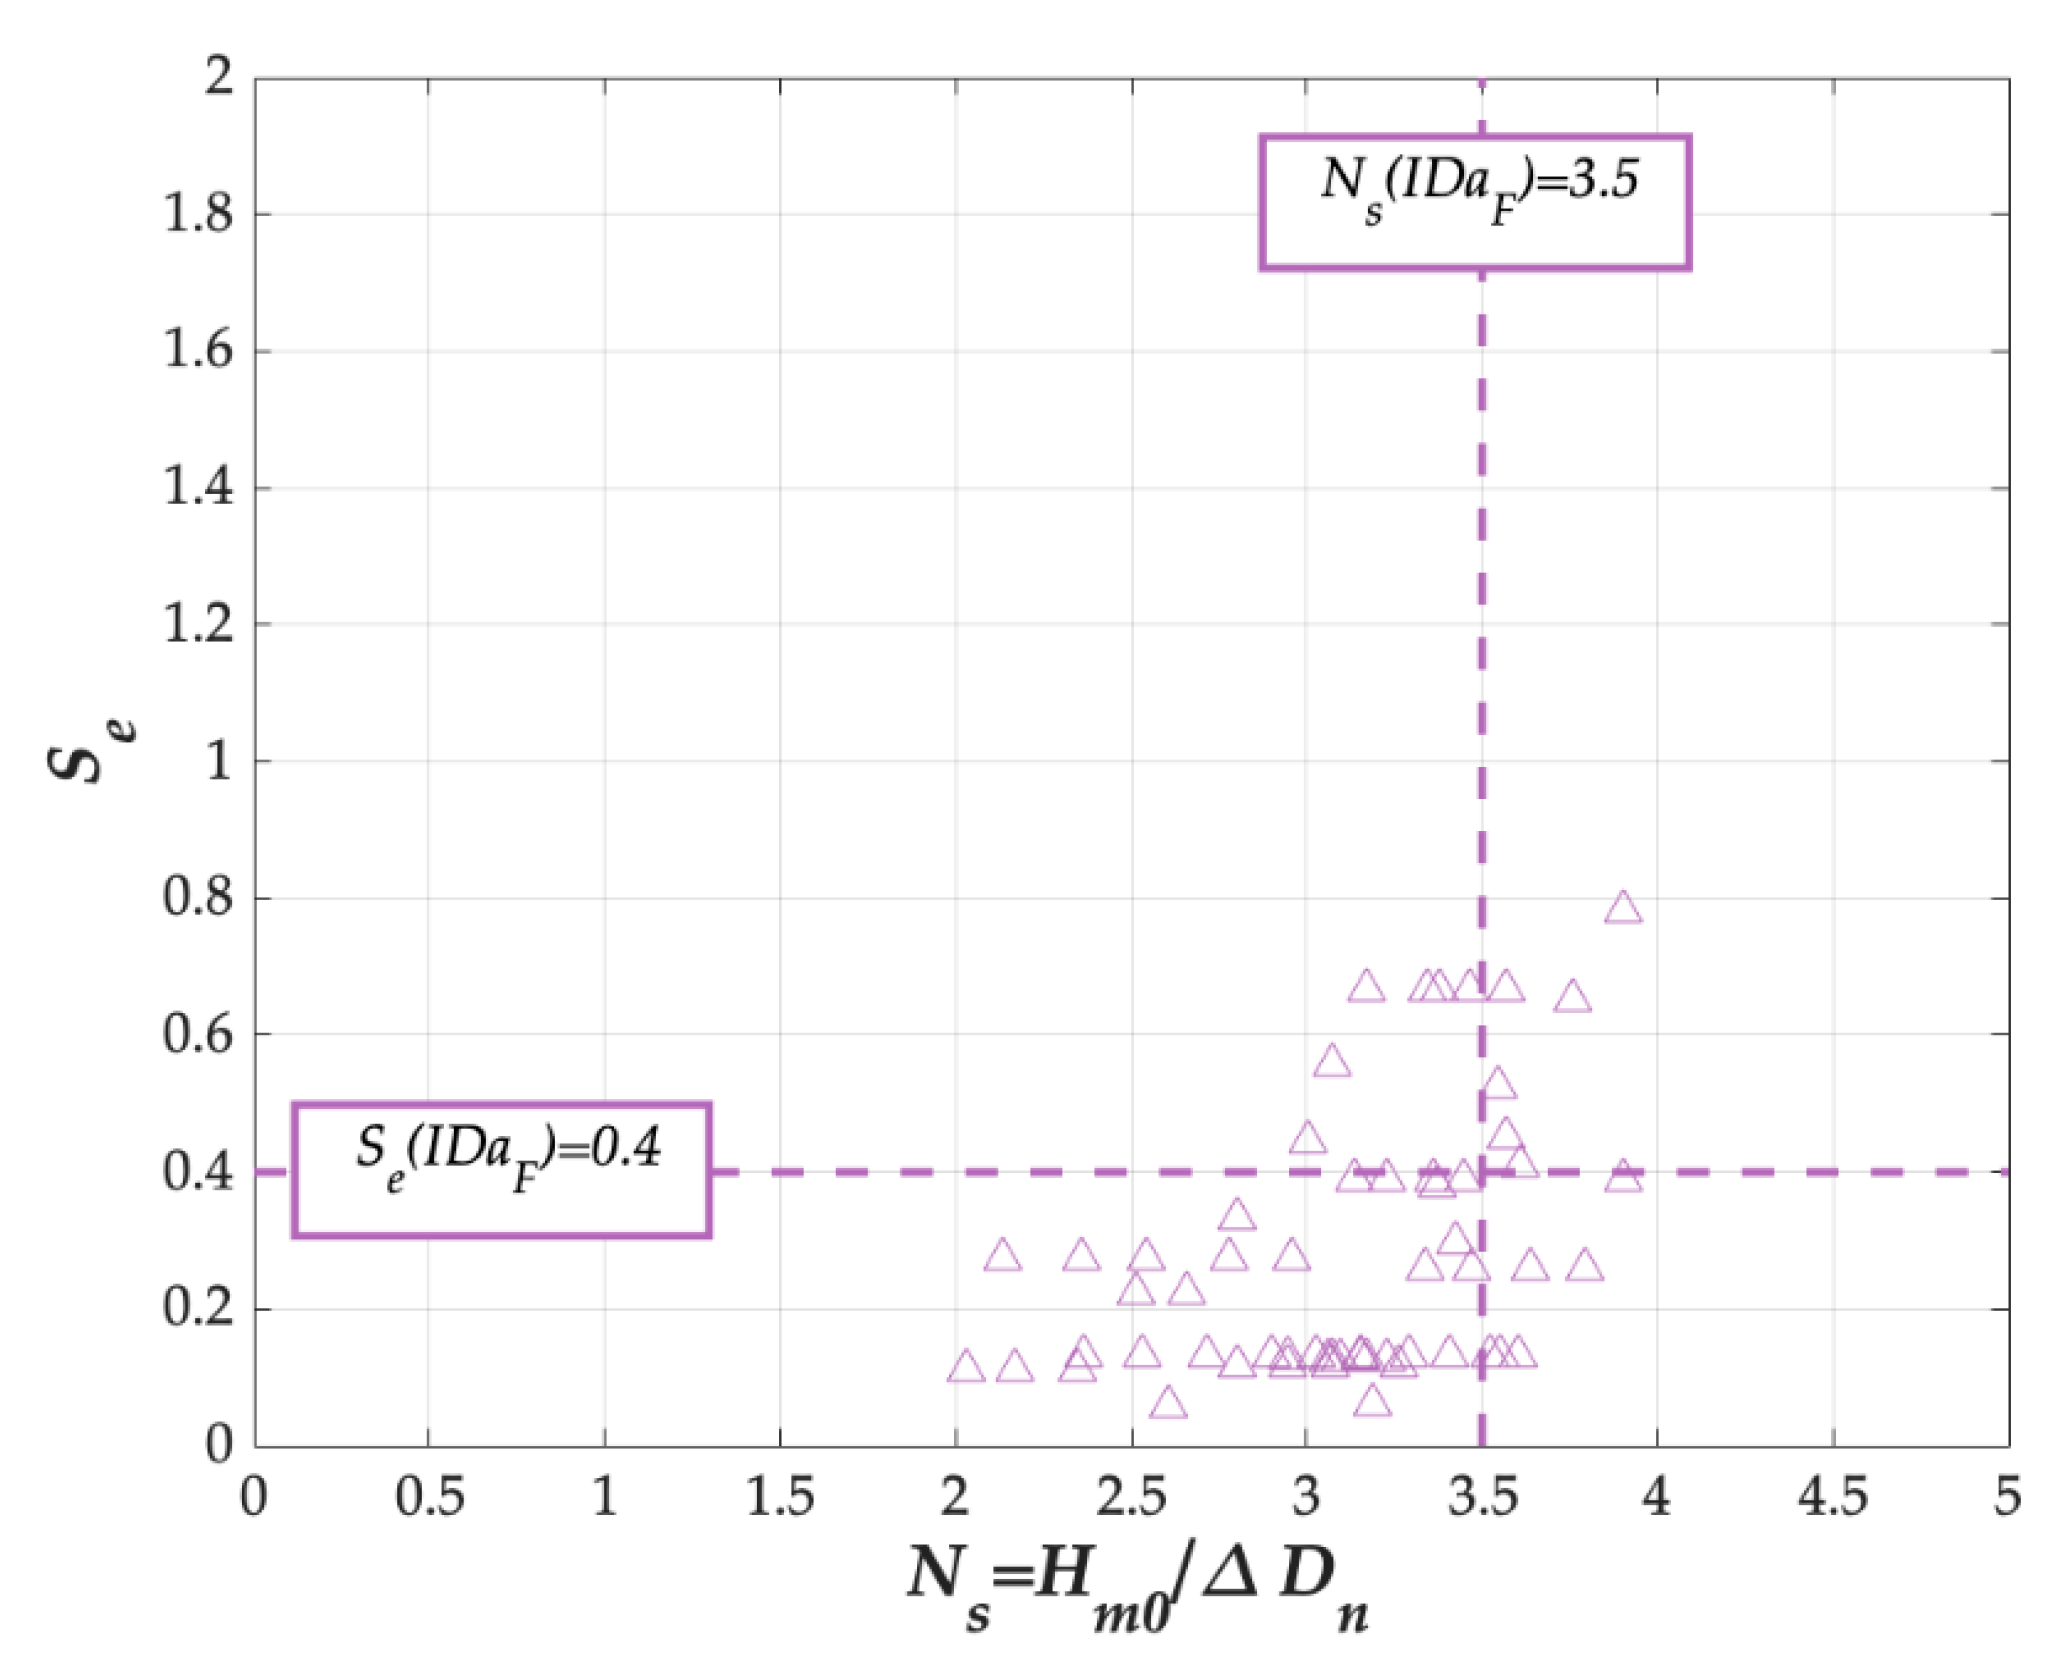
The Cubipod®-1L armor had a higher hydraulic stability than did the rock-2L and cube-2L armors. Therefore, high overtopping discharges were reached during the tests (Q < 9 × 10⁻³), similar to the tests conducted with cube-2L. However, since no damage appeared on the rear slope, only the armor damage to the front slope and crest is described in this section. It should be noted that very low levels of damage were reached during these tests (Se < 1), so it was not possible to calibrate Equation (14) properly. Figure 11 provides the data of the armor damage to the front slope of the Cubipod®-1L model, as well as the IDa level. Se (IDa) = 0.4 corresponds approximately to Ns (IDa) = 3.5, obtained as the average value of the observed Ns (IDa). The damage level IDe was not observed in any test. These results are valid within the ranges 2.0 ≤ Hm0/ΔDn ≤ 3.9 and 1.5 ≤ Rc/ΔDn ≤ 2.6.
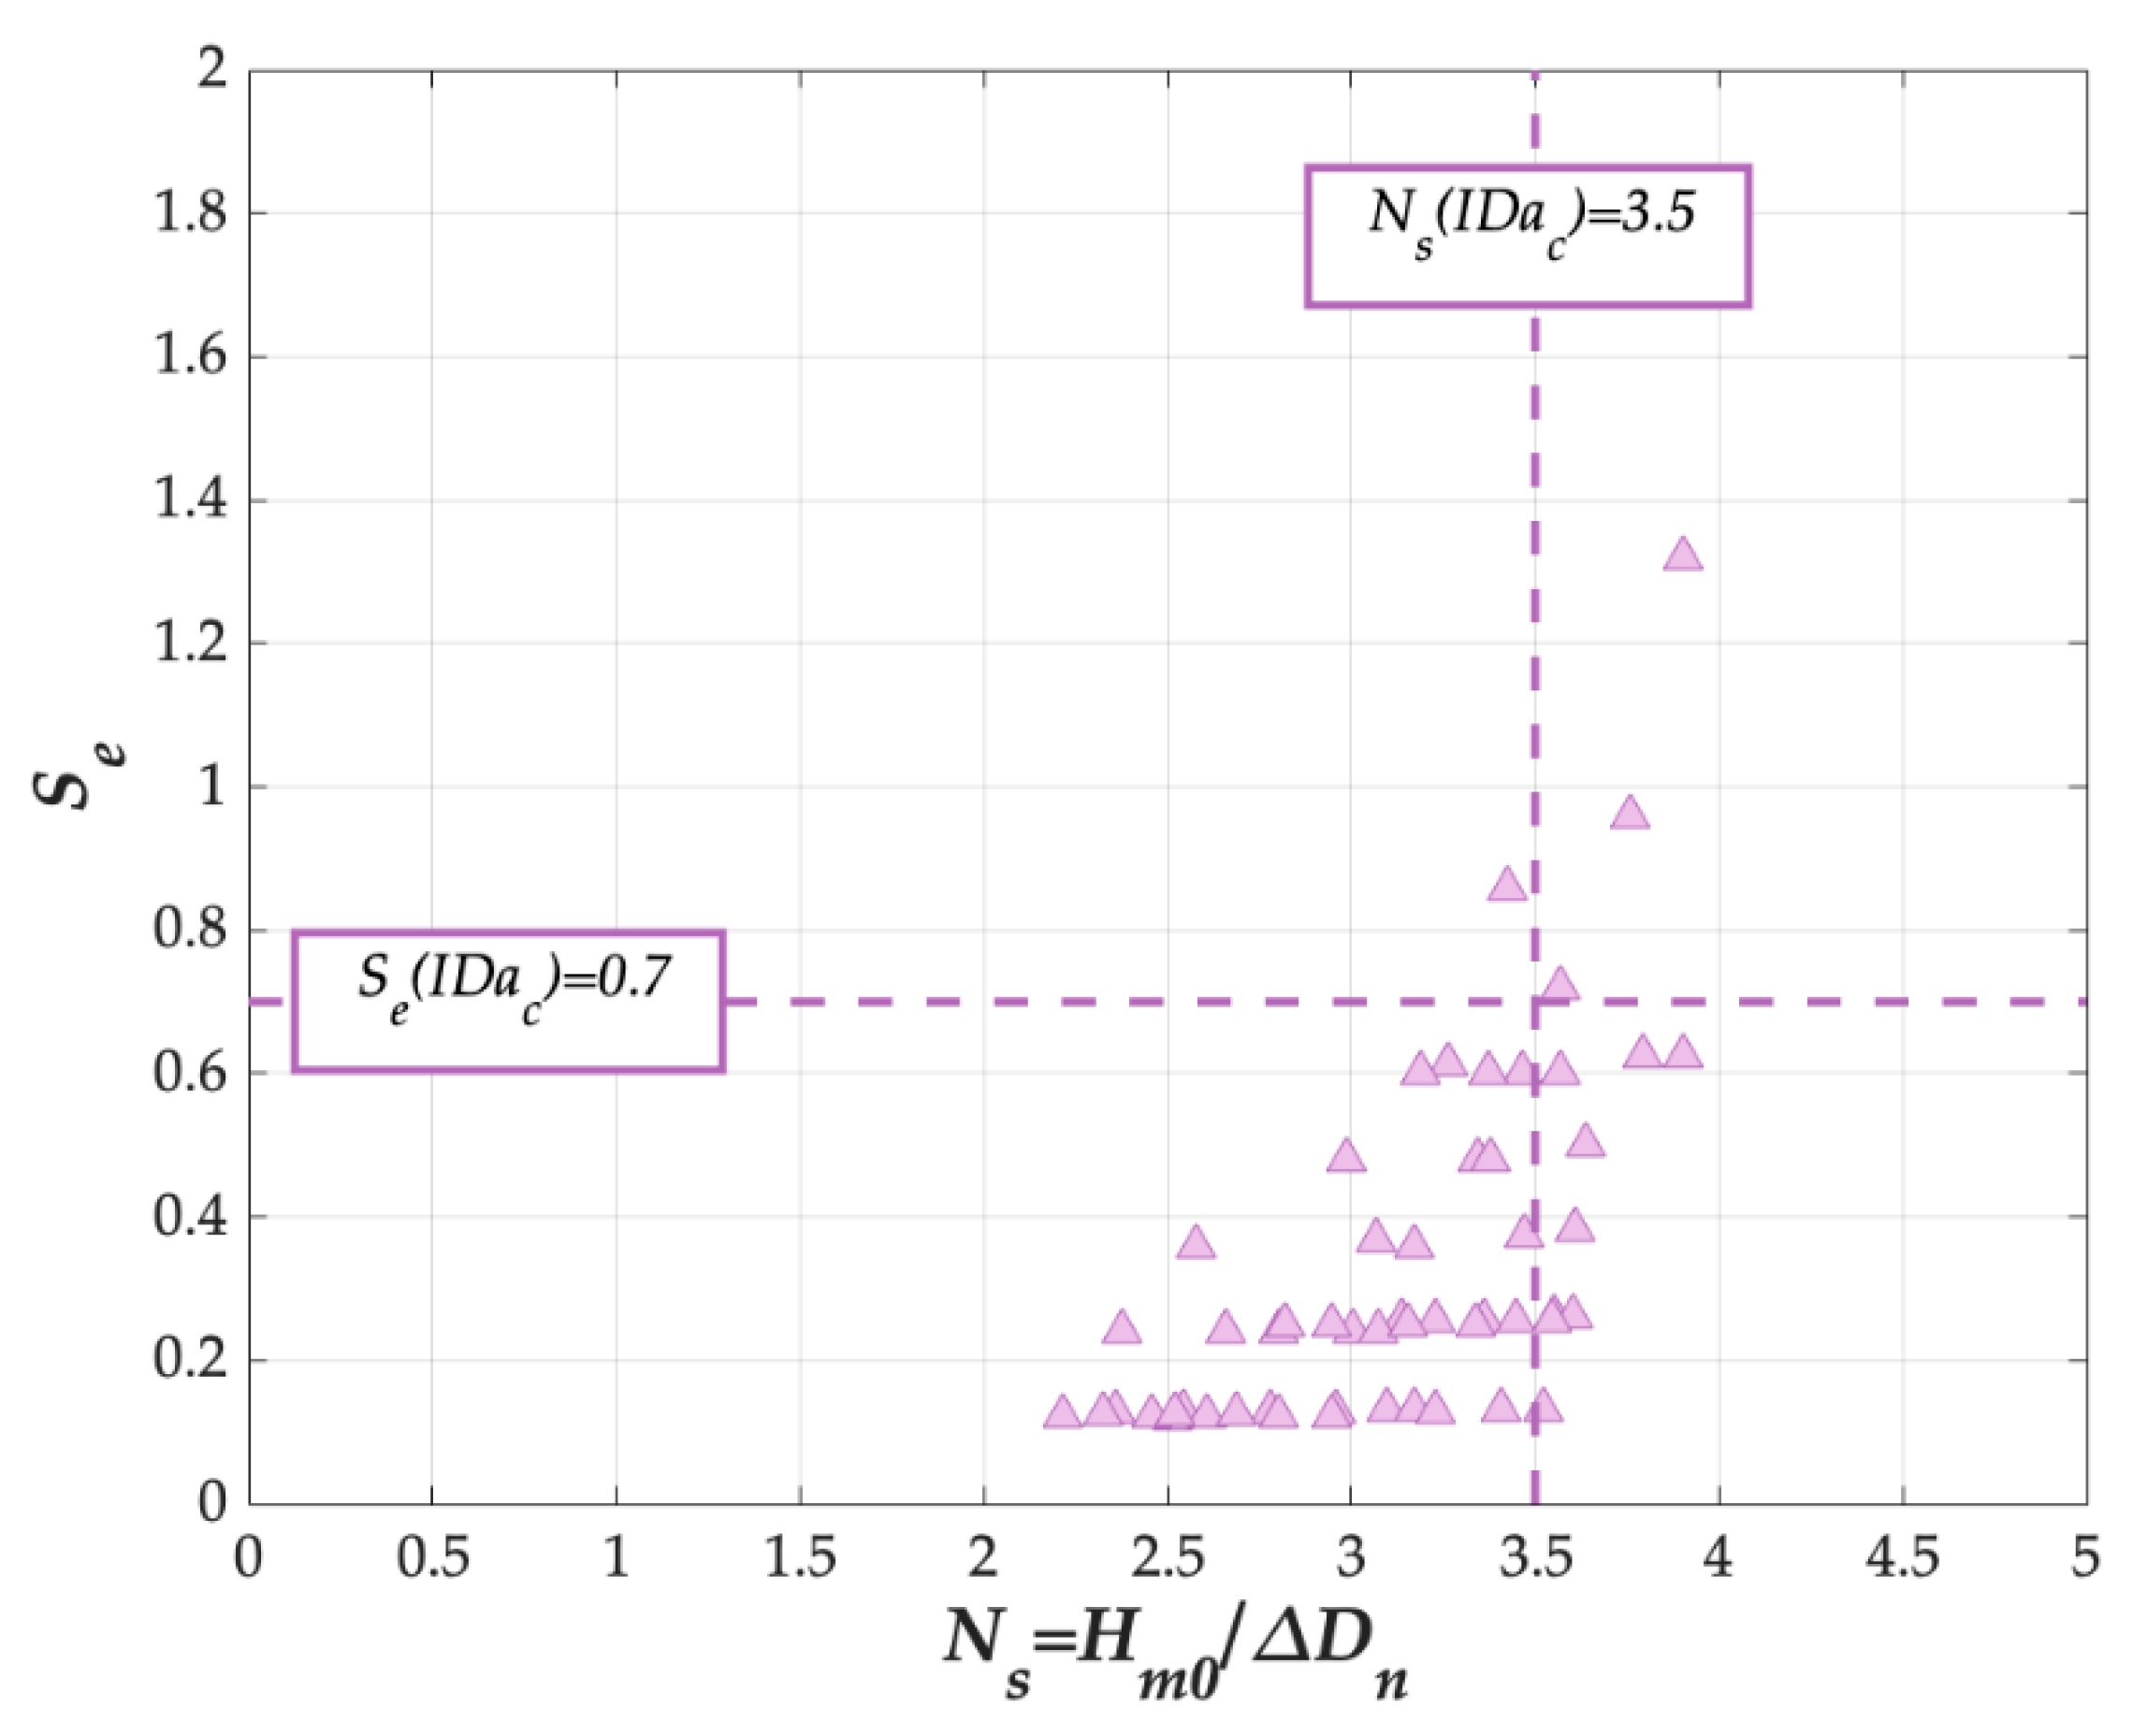
With regard to the crest, the low levels of armor damage in the experimental data (0.05 < Se < 1.5) did not allow Equation (14) to be calibrated properly, as was the case of the front slope. Se (IDa) = 0.7 corresponds approximately to Ns (IDa) = 3.5; Ns (IDa) = 3.5 was obtained as the average value of the observed Ns (IDa). The damage level IDe was not reached in any test. Figure 12 presents the data of armor damage to the crest of the Cubipod®-1L model, as well as the IDa level. These results are valid within the ranges 2.2 ≤ Hm0/ΔDn ≤ 3.9 and 1.5 ≤ Rc/ΔDn ≤ 2.6.
5.4. Influence of the Armor Unit and the Armor Sector
In the previous sections, the hydraulic stability of overtopped mound breakwaters with rock-2L, cube-2L and Cubipod®-1L armors was described. Here, the armor damage to the different armor layers and armor sections is compared. Table 4 summarizes the results of the previous sections.
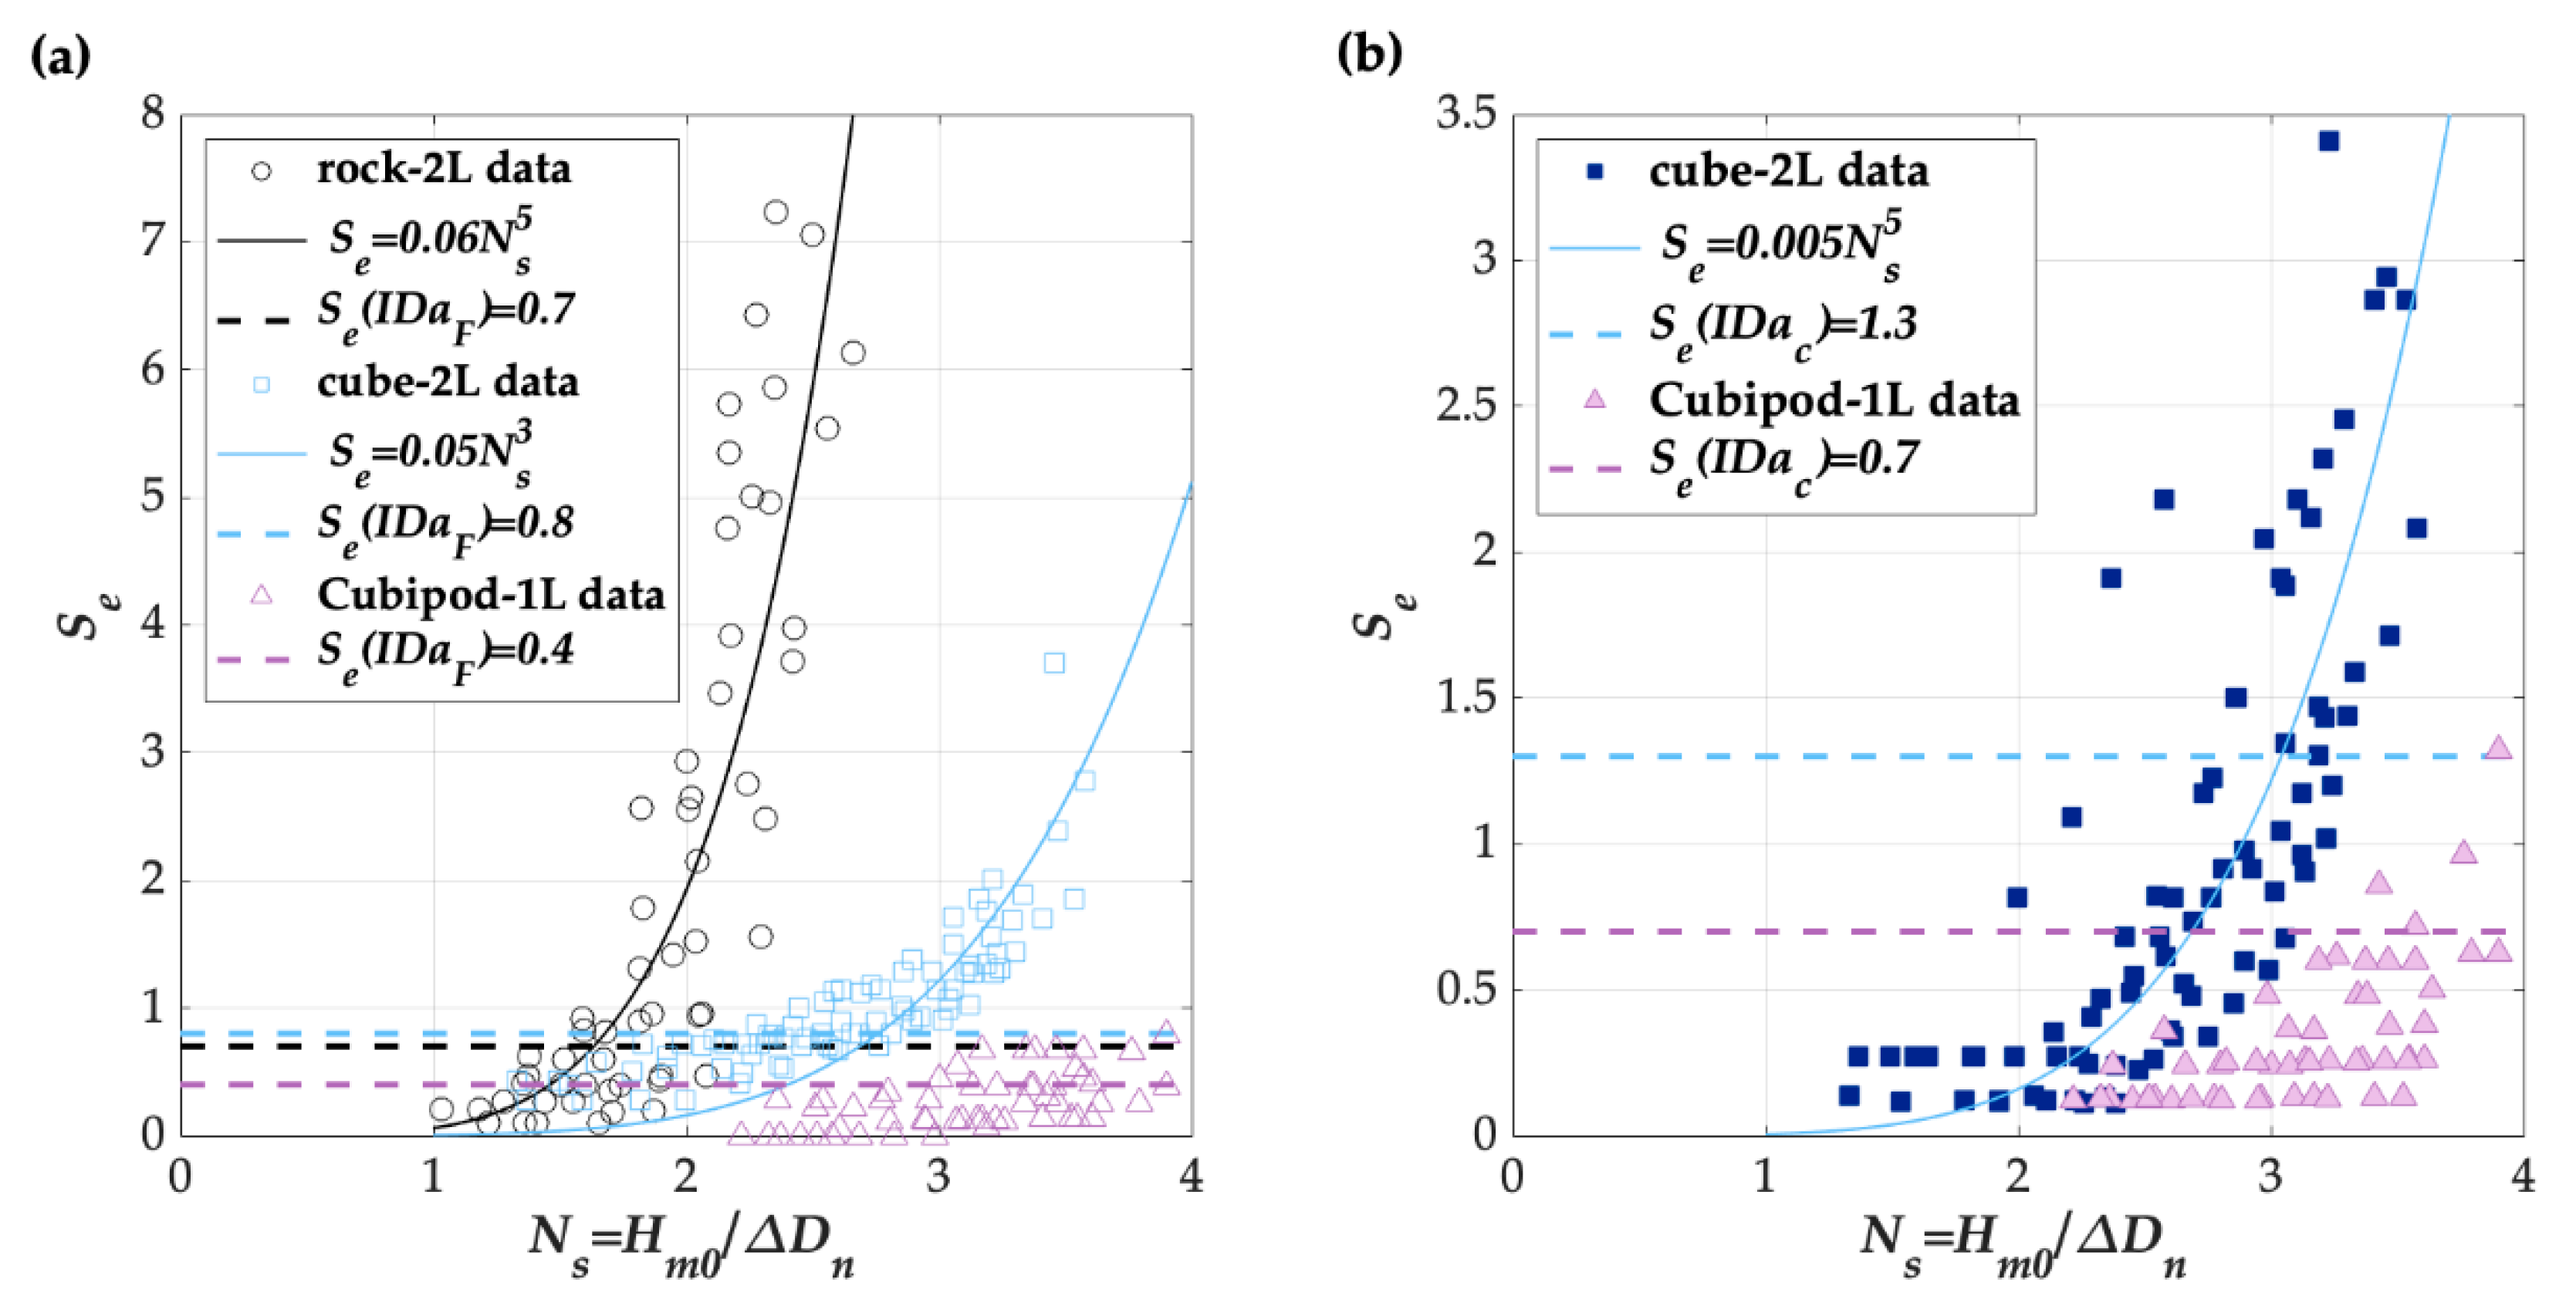
First, the different results from the three tested armor layers are discussed. Although similar ΔDn were tested for the different armor units, significant differences can be observed in their hydraulic stability, as shown in Table 4. It can be concluded that Cubipod®-1L was much more stable than cube-2L and rock-2L. Figure 13 compares the armor damage data and the fitted stability curves for the three tested armor layers.
In Figure 13, the formulas derived in the previous sections are also compared; formulas for cube-2L were much steeper than observations for Cubipod®-1L for both the front armor and crest. As [12] observed, single-layer Cubipod® armors are much more stable than conventional double-layer cube ones.
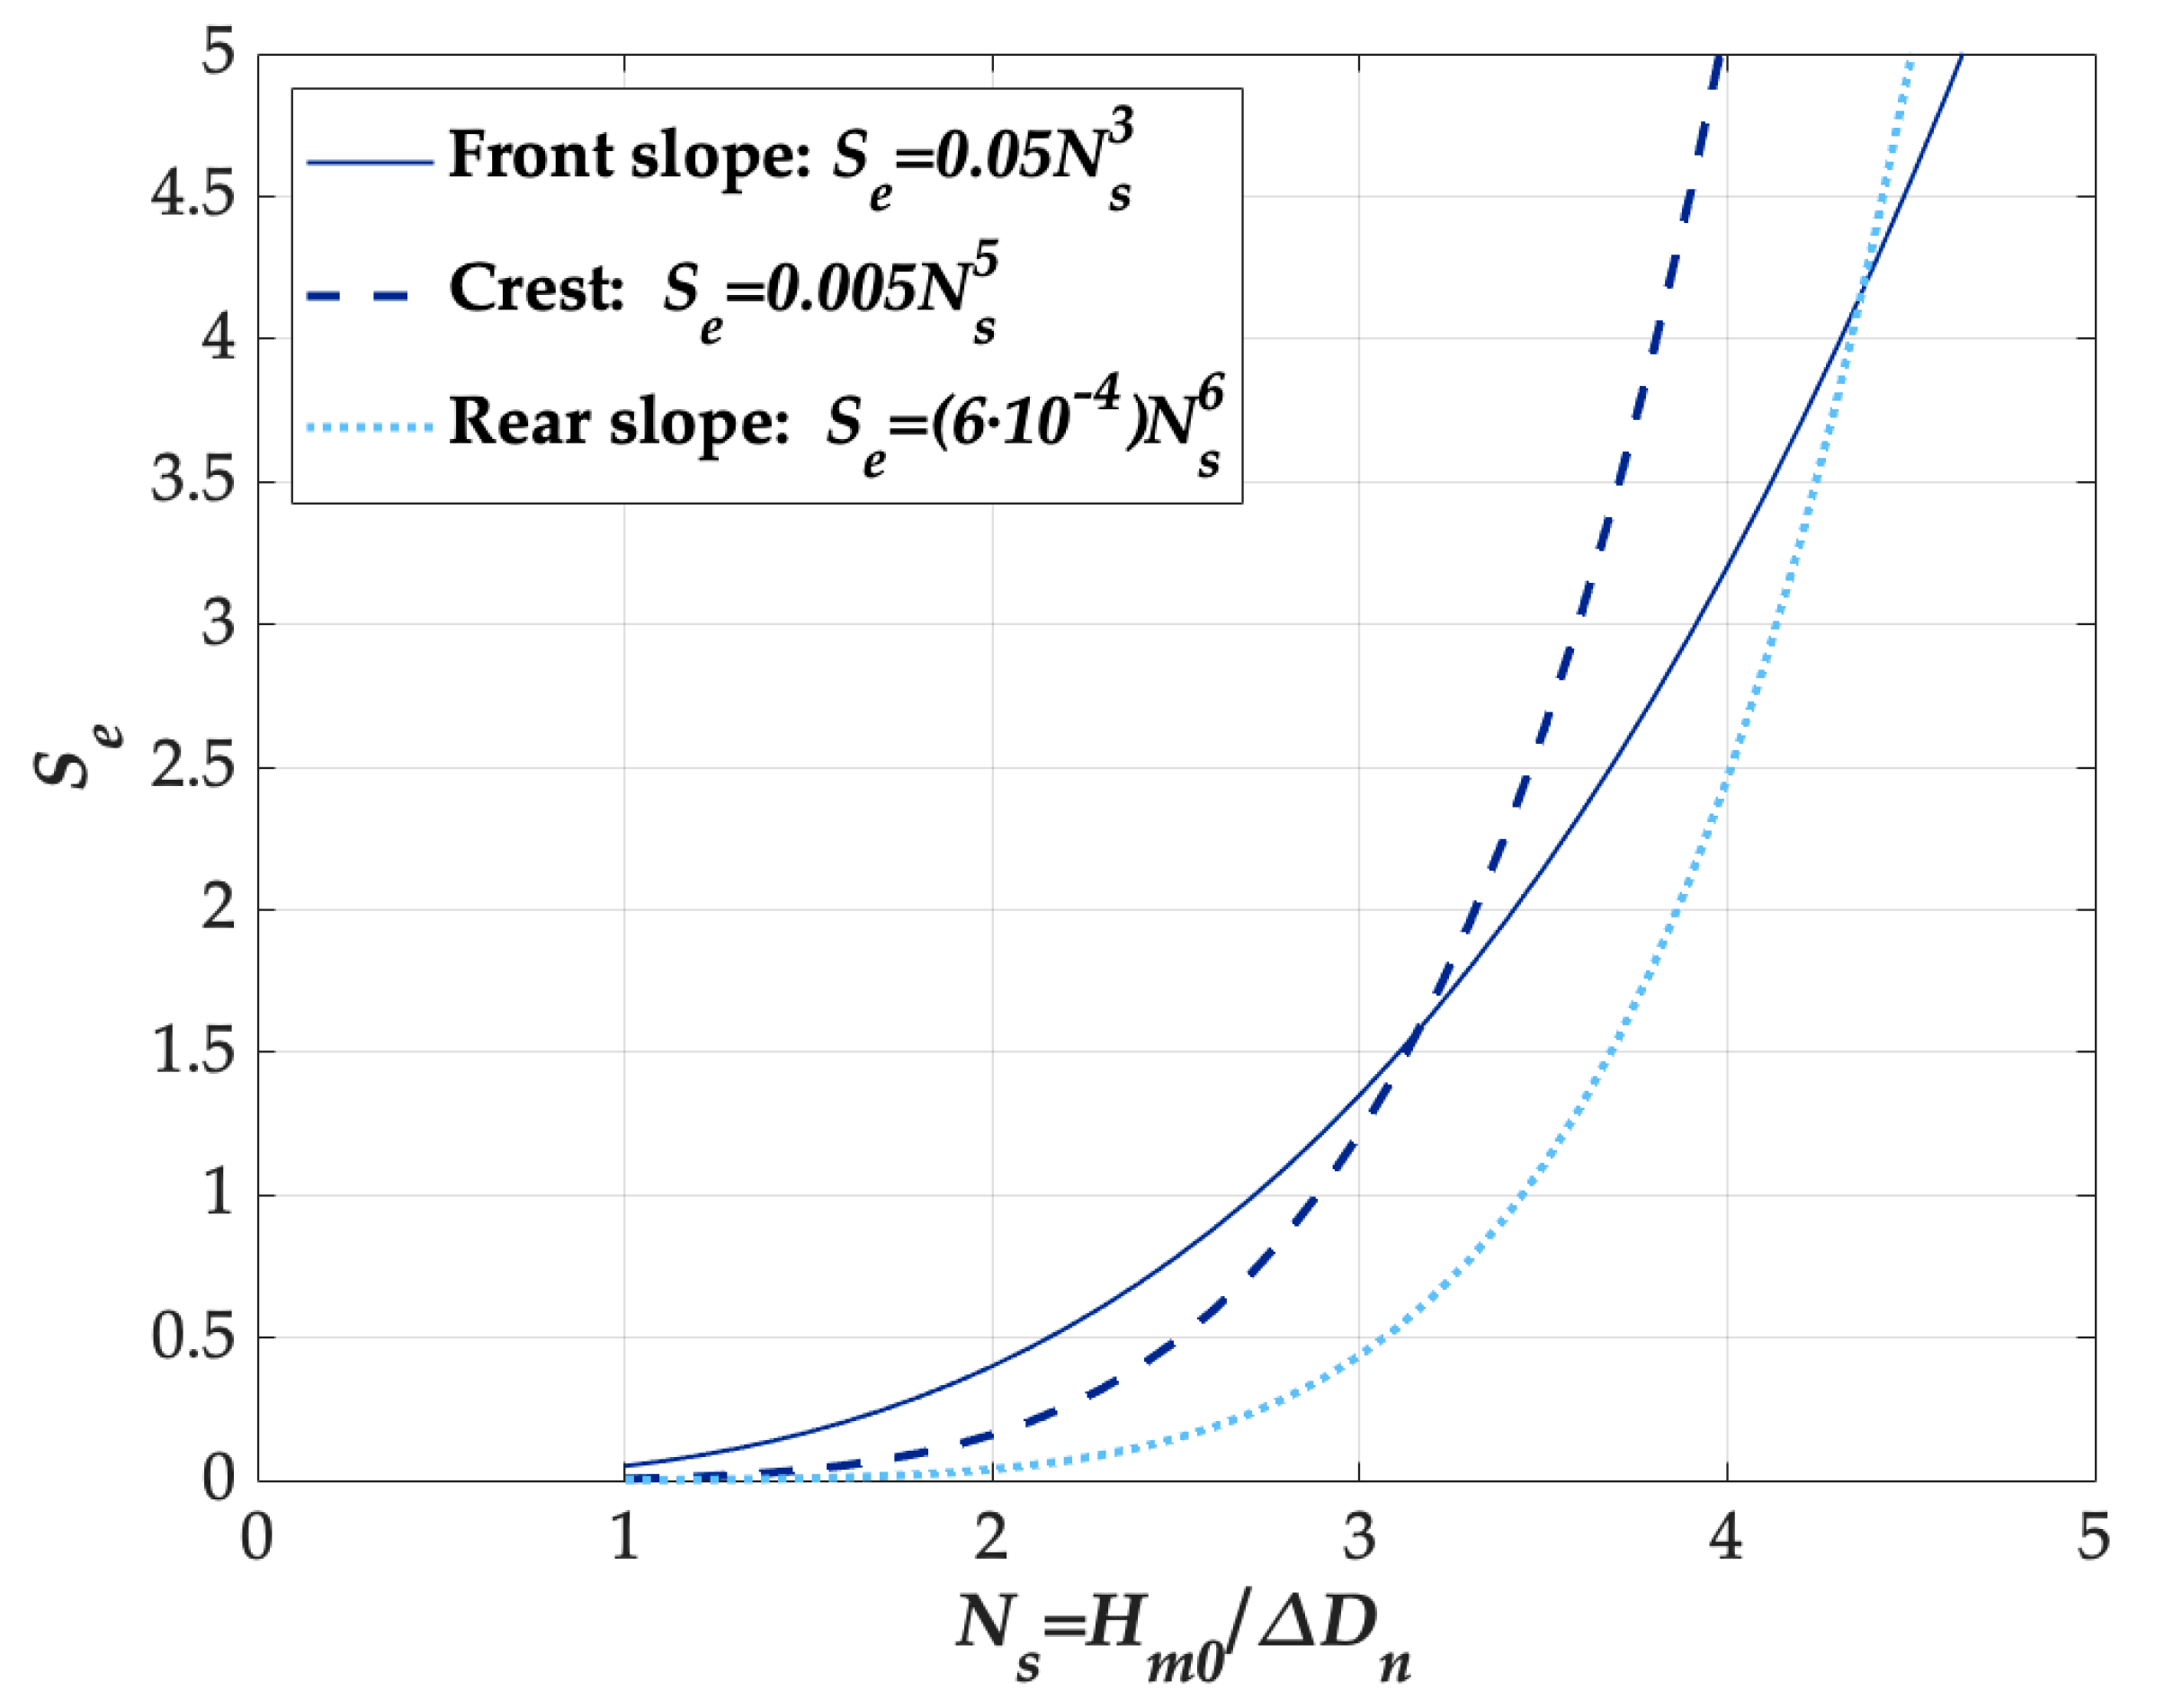
In order to evaluate the differences observed in the armor sections, cube-2L results are further analyzed. Figure 14 presents the formulas developed in this study for the front slope, crest and rear slope of cube-2L.
In Figure 14, armor damage is seen to appear first on the front slope. As Hm0 increases, armor damage starts on the crest and, later, on the rear slope. Therefore, higher Hm0 are required to begin the erosive process of the armor on the crest and rear slope. However, the damage curves are steeper for the crest and rear slope (higher power, K2, in Equation (14)); the damage evolves faster on the crest and rear slope than on the front slope.
5.5. Comparison with Non-Overtopped Structures
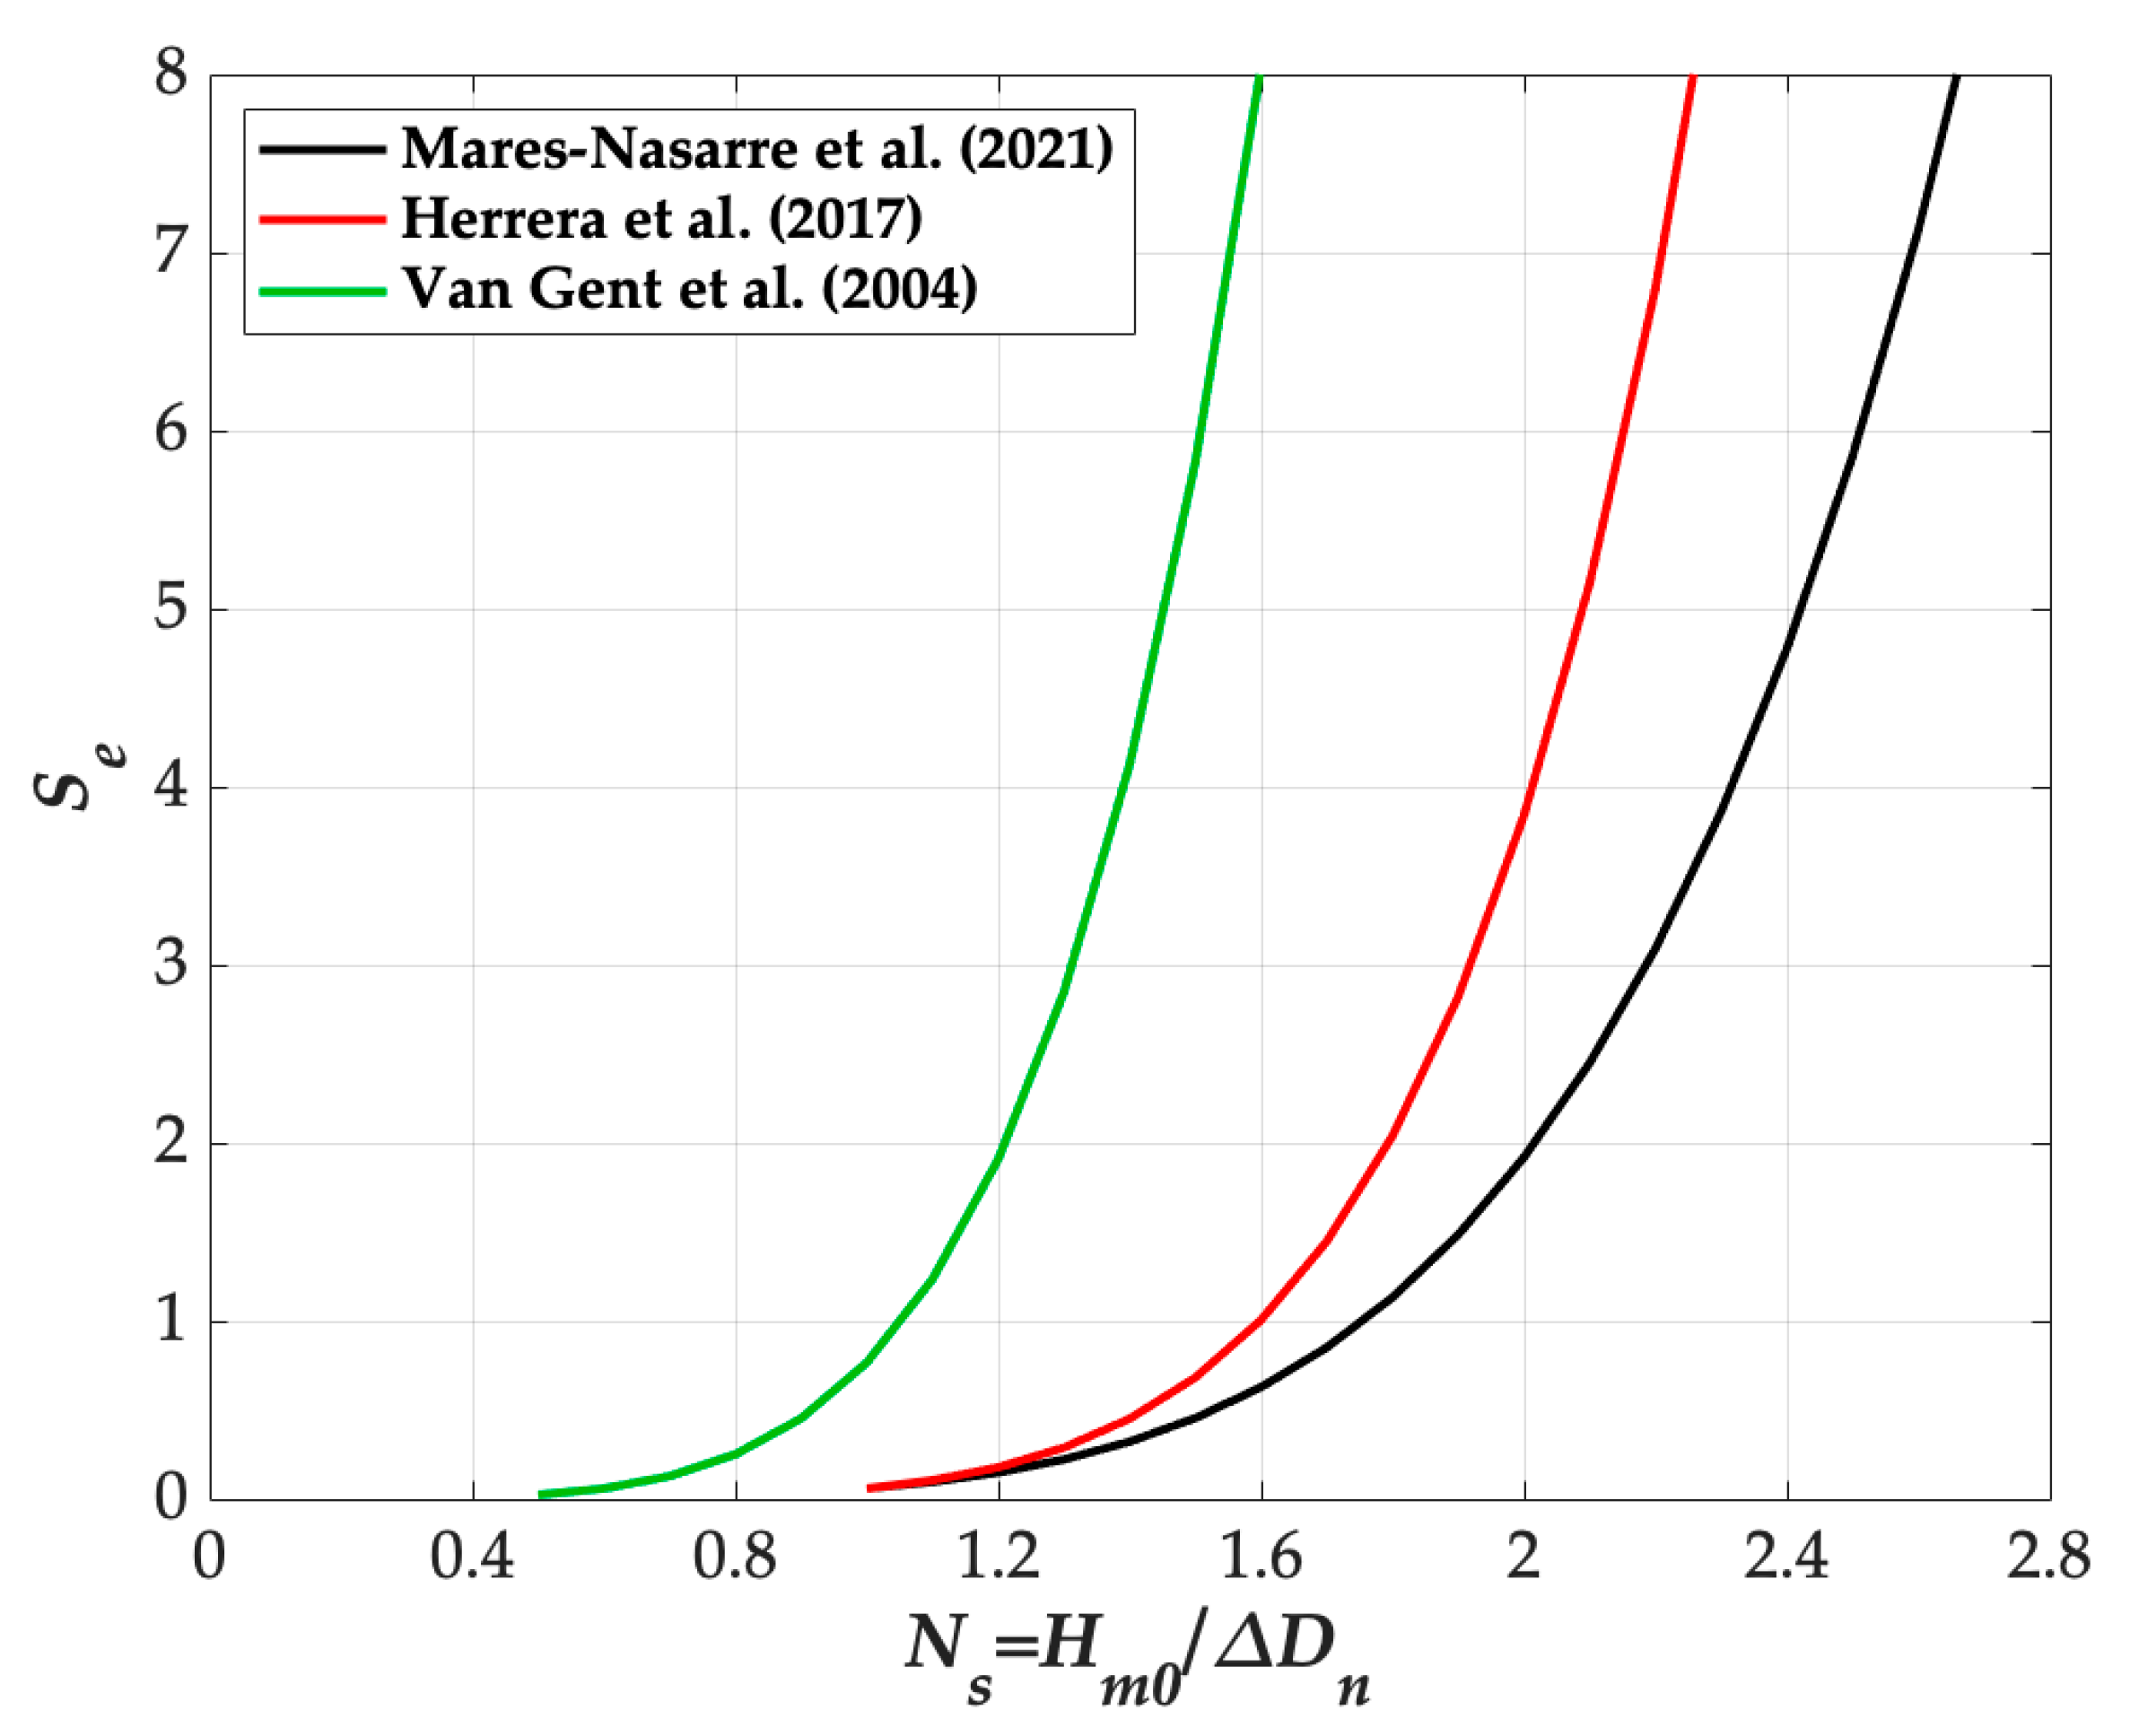
After analyzing the experimental results of armor damage in this study, a comparison between the new formulas derived here and formulas in the literature is performed. First, Equations (5) and (6) given by [3,4], respectively, for non-overtopped rubble mound breakwaters in breaking conditions are compared to Equation (14) with K1 = 0.06 and K2 = 5 for the front slope of overtopped rubble mound breakwaters. Equation (5) given by [3] can be rewritten for the data in this study as
Figure 15 compares Equation (14) with K1 = 0.06 and K2 = 5 and Equations (5) and (6) developed by [3,4], respectively. It should be noted that for rock armors, HeP failure mode is not dominant, so S ≈ Se [4]. Note that different experimental set-ups were used in the compared studies, as shown in Section 2.
In Figure 15, it is shown how the front slope of overtopped mound breakwaters is much more stable than that of non-overtopped structures; a much gentler trend is observed in the hydraulic stability curve of overtopped mound breakwaters. In overtopped structures, as Hm0 increases, overtopping becomes more frequent and a relevant part of the wave energy is dissipated by the overtopping phenomenon, as well as through the crest and rear slope. Less energy is supported by the front slope, making it more stable than structures with null overtopping.
Significant differences can be also observed between Equation (5) given by [3] and Equation (6) developed by [4]. Higher levels of armor damage are predicted by [3] for the same Ns, as previously observed in [4]. This may be due to the differences in the measurement procedure; Van Gent et al. [3] used a surface profiler while [4] applied the Virtual Net method. In addition, the formula by [3] was developed for a single sea state whereas the formula by [4] considered cumulative damage in a succession of sea states as done in the tests for the present study.
Finally, Equation (8) given by [21] for non-overtopped single-layer Cubipod® armors in depth-limited breaking wave conditions is compared to the experimental data for the single-layer Cubipod® model. A minimum nominal diameter Dn,min = 3.70 cm was provided by Equation (8) for the worst case in this study (m = 4% and hs = 0.25 cm). Dn,min = 3.70 cm < Dn = 3.79 cm agrees with the high hydraulic stability observed during the tests, although Equation (8) was developed on gentler bottom slopes (0 ≤ m ≤ 2%).
6. Conclusions
The hydraulic stability of the armor layer of mound breakwaters has been the subject of much study over the years, since this is the main failure mode of this type of coastal structure. Most studies were conducted in non-overtopped and nonbreaking wave conditions, although overtopped mound breakwaters in depth-limited breaking wave conditions are common and increasingly relevant in the current context of climate change and sea level rise.
In this study, 2D physical tests reported in [7] are examined in order to describe the armor damage to overtopped mound breakwaters in breaking wave conditions with armor slope H/V = 3/2 and three different armors: double-layer rock (rock-2L), double-layer randomly-place cube (cube-2L) and single-layer Cubipod® (Cubipod®-1L).
Hydraulic stability formulas were developed assessing the exponent of the power relationship between the design wave height and the armor damage, following recommendations by [4,9]. Thus, Equation (14) was fitted for each armor section and each armor unit obtaining coefficients in Table 4; Ns for Initiation of Damage (IDa) level is also presented.
Cubipod®-1L models were much more stable than those built with rock-2L and cube-2L, although similar ΔDn were tested. Mound breakwater models with cube-2L were also more stable than those considering rock-2L armors. The front slope of overtopped mound breakwaters was much more stable than that of non-overtopped mound breakwaters, since part of the wave energy was dissipated through the crest and rear slope.
In addition, it is worth noting that armor damage started on the front slope for low values of Hm0. As Hm0 was increased, damage reached the crest and, later, the rear slope. However, once the erosive process started, damage evolved faster on the crest and rear slope. Therefore, as Hm0 increases for the same Rc, more wave energy is dissipated through the armored crest and rear slope, making them a critical part on the armor design.
Author Contributions
Conceptualization, P.M.-N.; methodology, P.M.-N. and G.A.; formal analysis, P.M.-N. and G.A.; investigation, P.M.-N., G.A., M.E.G.-M. and J.R.M.; writing—original draft preparation, P.M.-N.; writing—review and editing, G.A., M.E.G.-M. and J.R.M.; funding acquisition, M.E.G.-M. and J.R.M. All authors have read and agreed to the published version of the manuscript.
Funding
The authors acknowledge the financial support from the Agencia Estatal de Investigación and Fondo Europeo de Desarrollo Regional (FEDER) under grant RTI2018-101073-B-I00.
Acknowledgments
The authors acknowledge the financial support from the Agencia Estatal de Investigación and Fondo Europeo de Desarrollo Regional (FEDER) under grant RTI2018-101073-B-I00. The authors thank Debra Westall for revising the manuscript.
Conflicts of Interest
The authors declare no conflict of interest.
References
- Hudson, R.Y. Laboratory Investigation of Rubble-Mound Breakwaters. J. Waterw. Harb. Div. 1959, 85, 93–121. [Google Scholar] [CrossRef]
- Van der Meer, J.W. Rock Slopes and Gravel Beaches under Wave Attack. Ph.D. Thesis, Thecnical University of Delft, Delft, The Netherlands, 1988. [Google Scholar]
- Van Gent, M.R.A.; Smale, A.J.; Kuiper, C. Stability of Rock Slopes with Shallow Foreshores. In Proceedings of the Coastal Structures 2003, Portland, OR, USA, 26–30 August 2003; pp. 100–112. [Google Scholar]
- Herrera, M.P.; Gómez-Martín, M.E.; Medina, J.R. Hydraulic stability of rock armors in breaking wave conditions. Coast. Eng. 2017, 127, 55–67. [Google Scholar] [CrossRef]
- Mares-Nasarre, P.; Molines, J.; Gómez-Martín, M.E.; Medina, J.R. Explicit Neural Network-derived formula for overtopping flow on mound breakwaters in depth-limited breaking wave conditions. Coast. Eng. 2021, 164, 103810. [Google Scholar] [CrossRef]
- Vidal, C.; Losada, M.A.; Medina, R.; Mansard, E.P.D.; Gomez-Pina, G. A Universal Analysis for the Stability of Both Low-Crested and Submerged Breakwaters. In Proceedings of the 23rd International Conference on Coastal Engineering, Venice, Italy, 4–9 October 1993; American Society of Civil Engineers: New York, NY, USA, 1993; pp. 1679–1692. [Google Scholar]
- Argente, G. Estudio de la Estabilidad Hidráulica de Diques en Talud Rebasables Protegidos Con Mantos de Escollera, Cubos y Cubípodos. Ph.D. Thesis, Universitat Politècnica de València, Valencia, Spain, 2019. (In Spanish). [Google Scholar]
- Medina, J.R.; Hudspeth, R.T.; Fassardi, C. Breakwater Armor Damage due to Wave Groups. J. Waterw. Port Coastal Ocean Eng. 1994, 120, 179–198. [Google Scholar] [CrossRef]
- Etemad-Shahidi, A.; Bali, M.; Van Gent, M.R.A. On the stability of rock armored rubble mound structures. Coast. Eng. 2020, 158, 103655. [Google Scholar] [CrossRef]
- Vidal, C.; Medina, R.; Lomónaco, P. Wave height parameter for damage description of rubble-mound breakwaters. Coast. Eng. 2006, 53, 711–722. [Google Scholar] [CrossRef]
- Gómez-Martín, M.E.; Medina, J.R. Damage progression on cube armored breakwaters. In Proceedings of the 30th International Conference on Coastal Engineering, Diego, CA, USA, 3–8 September 2006; World Scientific Publishing Company: Singapore, 2006; pp. 5229–5240. [Google Scholar]
- Gómez-Martín, M.E.; Medina, J.R. Heterogeneous Packing and Hydraulic Stability of Cube and Cubipod Armor Units. J. Waterw. Port Coast. Ocean Eng. 2014, 140, 100–108. [Google Scholar] [CrossRef]
- Losada, M.A.; Desire, J.M.; Alejo, L.M. Stability of Blocks as Breakwater Armor Units. J. Struct. Eng. 1986, 112, 2392–2401. [Google Scholar] [CrossRef]
- Vidal, C.; Losada, M.A.; Medina, R. Stability of Mound Breakwater’s Head and Trunk. J. Waterw. Port Coastal Ocean Eng. 1991, 117, 570–587. [Google Scholar] [CrossRef]
- Gómez-Martín, M.E. Análisis de la Evolución de Averías en el Manto Principal de Diques en talud Formado por Escolleras, Cubos y Cubípodos. Ph.D. Thesis, Universitat Politècnica de València, Valencia, Spain, 2015. (In Spanish). [Google Scholar]
- USACE Shore Protection Manual; U.S. Army Coastal Engineering Research Center U.S. Army Engineer Waterways Experiment Station: Vicksburg, MA, USA, 1975.
- USACE Shore Protection Manual; U.S. Army Coastal Engineering Research Center, U.S. Army Engineer Waterways Experiment Station: Vicksburg, MA, USA, 1984.
- Thompson, D.M.; Shuttler, R.M. Riprap Design for Wind Wave Attack. A Laboratory Study in Random Waves; Report EX 707; Hydraulic Research: Wallingford, UK, 1975. [Google Scholar]
- Smith, G.; Wallast, I.; Van Gent, M.R.A. Rock slope stability with shallow foreshores. In Proceedings of the 28th International Conference on Coastal Engineering, Cardiff, UK, 7–12 July 2002; World Scientific Publishing Company: Singapore, 2003; pp. 1524–1536. [Google Scholar]
- Prevot, G.; Boucher, O.; Luck, M.; Benoit, M. Stability of rubble mound breakwaters in shallow water and surf zone: An experimental study. Coast. Eng. 2012, 1, 85. [Google Scholar] [CrossRef]
- Gómez-Martín, M.E.; Herrera, M.P.; Gonzalez-Escriva, J.; Medina, J.R. Cubipod® Armor Design in Depth-Limited Regular Wave-Breaking Conditions. J. Mar. Sci. Eng. 2018, 6, 150. [Google Scholar] [CrossRef] [Green Version]
- Van der Meer, J.W.; Daemen, I.F.R. Stability and Wave Transmission at Low-Crested Rubble-Mound Structures. J. Waterw. Port Coast. Ocean Eng. 1994, 120, 1–19. [Google Scholar] [CrossRef]
- Van der Meer, J.W.; Pilarczyk, K.W. Stability of Low-Crested and Reef Breakwaters. In Proceedings of the 22nd International Conference on Coastal Engineering, Delft, The Netherlands, 2–6 July 1990; American Society of Civil Engineers: New York, NY, USA, 1991; pp. 1375–1388. [Google Scholar]
- Burger, G. Stability of Low-Crested Breakwaters. Final Proceedings 1995; EU research Project Rubble Mound Breakwaters Failure Modes, MAST 2 Contrast MAS2-CT92-0042; Delft Hydraulics Report H1878/H2415. 2006. Available online: http://www.vandermeerconsulting.nl/downloads/stability_e/1996_vandermeer_tutuarima.pdf (accessed on 31 August 2021).
- Van der Meer, J.W. Stability of cubes, tetrapods and accropode. In Design of Breakwaters; Thomas Telford Publishing: London, UK, 1988; pp. 71–80. [Google Scholar]
- Vidal, C.; López, F.; Losada Rodríguez, Í. Stability analysis of low crested and submerged rubble mound breakwaters: Relationship between flow characteristics and measured damage and stability formulae for low crested and submerged breakwaters. In Proceedings of the Proc. Coastal Structures 2007, Venice, Italy, 2–4 July 2007; World Scientific Publishing Company: Singapore, 2009; pp. 939–950. [Google Scholar]
- Van der Linde, J.P. Stability of Single Layer Armour Units on Low-Crested Structures. Master’s Thesis, Delft University of Technology, Delft, The Nertherlands, 2010. [Google Scholar]
- Muttray, M.; ten Oever, E.; Reedijk, B. Stability of Low Crested and Submerged Breakwaters with Single Layer Armouring. J. Shipp. Ocean Eng. 2012, 2, 140–152. [Google Scholar]
- Argente, G.; Gómez-Martín, M.E.; Medina, J.R. Hydraulic stability of the armor layer of overtopped breakwaters. J. Mar. Sci. Eng. 2018, 6, 143. [Google Scholar] [CrossRef] [Green Version]
- Mansard, E.P.D.; Funke, E.R. The Measurement of Incident and Reflected Spectra Using a Least squares Method. In Proceedings of the 17th International Conference on Coastal Engineering, Sydney, Australia, 23–28 March 1980; ASCE: Reston, VA, USA, 1980; pp. 154–172. [Google Scholar]
- Mares-Nasarre, P.; Gómez-Martín, M.E.; Medina, J.R. Influence of mild bottom slopes on the overtopping flow over mound breakwaters under depth-limited breaking wave conditions. J. Mar. Sci. Eng. 2020, 8, 3. [Google Scholar] [CrossRef] [Green Version]
- Mares-Nasarre, P.; Molines, J.; Gómez-Martín, M.E.; Medina, J.R. Individual wave overtopping volumes on mound breakwaters in breaking wave conditions and gentle sea bottoms. Coast. Eng. 2020, 159, 103703. [Google Scholar] [CrossRef]
- Figueres, M.; Medina, J.R. Estimating incident and reflected waves using a fully nonlinear wave model. In Proceedings of the 29th International Conference on Coastal Engineering, Lisboa, Portugal, 19–24 September 2004; pp. 594–603. [Google Scholar]
- Verhagen, H.J.; van Vledder, G.; Arab, S.E. A practical method for design of coastal structures in shallow water. In Proceedings of the 31st International Conference on Coastal Engineering, Hamburg, Germany, 31 August–5 September 2008; World Scientific Publishing Company: Singapore, 2008; pp. 2912–2922. [Google Scholar]
- Battjes, J.A.; Groenendijk, H.W. Wave height distributions on shallow foreshores. Coast. Eng. 2000, 40, 161–182. [Google Scholar] [CrossRef]
Figure 1.
Longitudinal cross-sections of the configurations at the LPC-UPV wave flume.

Figure 2.
Cross-section of the tested mound breakwater model. Dimensions in m.

Figure 3.
Location of the cameras and experimental set up for cube-armored model.

Figure 4.
The measured spectral wave height without a structure (total waves) compared to the incident spectral wave height estimated by the SwanOne model: (a) in the wave generation zone, and (b) in the model zone.
Figure 4.
The measured spectral wave height without a structure (total waves) compared to the incident spectral wave height estimated by the SwanOne model: (a) in the wave generation zone, and (b) in the model zone.

Figure 5.
Application of the Virtual Net method on the front slope of rock-armored model.

Figure 6.
Armor damage data for cube-2L model and Initiation of Damage level for front slope (IDaF), crest (IDac) and rear slope (IDaR).
Figure 6.
Armor damage data for cube-2L model and Initiation of Damage level for front slope (IDaF), crest (IDac) and rear slope (IDaR).

Figure 7.
Performance of Equation (14) with K1 = 0.06 and K2 = 5 to estimate armor damage of the front slope of the rock-armored model: (a) Fitting to the measured data, IDa and IDe levels, and (b) measured against estimated Se.
Figure 7.
Performance of Equation (14) with K1 = 0.06 and K2 = 5 to estimate armor damage of the front slope of the rock-armored model: (a) Fitting to the measured data, IDa and IDe levels, and (b) measured against estimated Se.

Figure 8.
Performance of Equation (14) with K1 = 0.05 and K2 = 3 to estimate armor damage of the front slope of the cube-armored model: (a) Fitting to the measured data and IDa level, and (b) measured against estimated Se.
Figure 8.
Performance of Equation (14) with K1 = 0.05 and K2 = 3 to estimate armor damage of the front slope of the cube-armored model: (a) Fitting to the measured data and IDa level, and (b) measured against estimated Se.

Figure 9.
Performance of Equation (14) with K1 = 0.005 and K2 = 5 to estimate armor damage of the crest of the cube-armored model: (a) Fitting to the measured data and IDa level, and (b) measured against estimated Se.
Figure 9.
Performance of Equation (14) with K1 = 0.005 and K2 = 5 to estimate armor damage of the crest of the cube-armored model: (a) Fitting to the measured data and IDa level, and (b) measured against estimated Se.

Figure 10.
Performance of Equation (14) with K1 = 6 × 10⁻⁴ and K2 = 6 to estimate armor damage to the rear slope of the cube-armored model: (a) Fitting to the measured data and IDa level, and (b) measured against estimated Se.
Figure 10.
Performance of Equation (14) with K1 = 6 × 10⁻⁴ and K2 = 6 to estimate armor damage to the rear slope of the cube-armored model: (a) Fitting to the measured data and IDa level, and (b) measured against estimated Se.

Figure 11.
Armor damage to the front slope of the Cubipod®-armored model and IDa level.

Figure 12.
Armor damage to the crest of the Cubipod®-armored model and IDa level.

Figure 13.
Comparison of the damage curves of the three armor units: (a) front slope, and (b) crest.
Figure 13.
Comparison of the damage curves of the three armor units: (a) front slope, and (b) crest.

Figure 14.
Comparison of the damage curves of the three armor sections for cube-2L.

Figure 15.
Comparison between Equation (14) with K1 = 0.06 and K2 = 5 and Equations (5) and (6) proposed by [3,4], respectively.


| Armor | Sector | C1 | C2 |
|---|---|---|---|
| Rock-2L | Front slope | 0.633 | −0.056 |
| Cube-2L | Front slope | 0.137 | 0.621 |
| Cube-2L | Crest | 0.240 | 0.362 |
| Cube-2L | Rear slope | 0.255 | 0.113 |
Table 2.
Characteristics of the materials used during the physical tests.
| Material | M or M50 (g) | ρ or ρr (g/cm3) | Dn or Dn50 (cm) |
|---|---|---|---|
| Rock (armor) | 86.77 | 2.68 | 3.18 |
| Cube | 141.51 | 2.27 | 3.97 |
| Cubipod® | 121.06 | 2.22 | 3.79 |
| Rock (filter) | 15.40 | 2.73 | 1.78 |
| Rock (core) | 0.68 | 2.72 | 0.68 |
Table 3.
Structure and wave characteristics of the physical tests.
| m | Armor | B [m] | #Tests | hs [m] | Rc [m] | Hm0 [m] | Tp [s] |
|---|---|---|---|---|---|---|---|
| 2% | Rock-2L | 0.26 | 15 | 0.20 | 0.15 | 0.06–0.12 | 1.0–2.2 |
| 15 | 0.25 | 0.10 | 0.06–0.13 | 1.0–2.2 | |||
| cube-2L | 0.27 | 30 | 0.25 | 0.11 | 0.05–0.16 | 1.0–2.7 | |
| 24 | 0.30 | 0.06 | 0.06–0.18 | 1.0–2.2 | |||
| Cubipod®-1L | 0.24 | 30 | 0.20 | 0.12 | 0.06–0.15 | 1.0–2.7 | |
| 30 | 0.25 | 0.07 | 0.06–0.17 | 1.0–2.7 | |||
| 4% | rock-2L | 0.26 | 20 | 0.20 | 0.15 | 0.05–0.14 | 1.0–2.4 |
| 18 | 0.25 | 0.10 | 0.06–0.13 | 1.0–2.2 | |||
| cube-2L | 0.27 | 30 | 0.20 | 0.16 | 0.05–0.17 | 1.1–2.4 | |
| 30 | 0.25 | 0.11 | 0.06–0.18 | 1.0–2.7 | |||
| Cubipod®-1L | 0.24 | 28 | 0.20 | 0.12 | 0.06–0.17 | 1.0–2.4 | |
| 30 | 0.25 | 0.07 | 0.06–0.18 | 1.0–2.7 |
Table 4.
Summary of the results of the analysis of the armor damage to overtopped mound breakwaters.
Table 4.
Summary of the results of the analysis of the armor damage to overtopped mound breakwaters.
| Armor Layer | ∆Dn (cm) | Front Slope | Crest | Rear Side | ||||||
|---|---|---|---|---|---|---|---|---|---|---|
| K1 | K2 | Ns (IDa) | K1 | K2 | Ns (IDa) | K1 | K2 | Ns (IDa) | ||
| rock-2L | 5.34 | 0.06 | 5 | 1.6 | - | - | - | - | - | - |
| cube-2L | 5.04 | 0.05 | 3 | 2.5 | 0.005 | 5 | 3.0 | 6 × 10⁻⁴ | 6 | 3.2 |
| Cubipod®-1L | 4.62 | - | - | 3.5 | - | - | 3.5 | - | - | - |
Publisher’s Note: MDPI stays neutral with regard to jurisdictional claims in published maps and institutional affiliations. |
© 2021 by the authors. Licensee MDPI, Basel, Switzerland. This article is an open access article distributed under the terms and conditions of the Creative Commons Attribution (CC BY) license (https://creativecommons.org/licenses/by/4.0/).
Share and Cite
MDPI and ACS Style
Mares-Nasarre, P.; Argente, G.; Gómez-Martín, M.E.; Medina, J.R. Armor Damage of Overtopped Mound Breakwaters in Depth-Limited Breaking Wave Conditions. J. Mar. Sci. Eng. 2021, 9, 952. https://doi.org/10.3390/jmse9090952
AMA Style
Mares-Nasarre P, Argente G, Gómez-Martín ME, Medina JR. Armor Damage of Overtopped Mound Breakwaters in Depth-Limited Breaking Wave Conditions. Journal of Marine Science and Engineering. 2021; 9(9):952. https://doi.org/10.3390/jmse9090952
Chicago/Turabian StyleMares-Nasarre, Patricia, Gloria Argente, M. Esther Gómez-Martín, and Josep R. Medina. 2021. "Armor Damage of Overtopped Mound Breakwaters in Depth-Limited Breaking Wave Conditions" Journal of Marine Science and Engineering 9, no. 9: 952. https://doi.org/10.3390/jmse9090952
Note that from the first issue of 2016, this journal uses article numbers instead of page numbers. See further details here.