
Marine Dual-Fuel Engines Power Smart Management by Hybrid Turbocharging Systems


1
Department of Industrial Engineering (DII), School of Polytechnic and Basic Sciences, University of Naples “Federico II”, 80125 Naples, Italy
2
Department of Mechanical, Energy, Management and Transportation Engineering (DIME), Polytechnic School University of Genoa, 16145 Genoa, Italy
*
Author to whom correspondence should be addressed.
J. Mar. Sci. Eng. 2021, 9(6), 663; https://doi.org/10.3390/jmse9060663
Submission received: 15 May 2021
/
Revised: 7 June 2021
/
Accepted: 11 June 2021
/
Published: 15 June 2021
(This article belongs to the Special Issue Smart Control of Ship Propulsion System)
Abstract
:The performance of a marine dual-fuel engine, equipped with an innovative hybrid turbocharger producing electric power to satisfy part of the ship’s electric load, is presented by a simulation comparison with the traditional turbocharging technology. The two distinct fuel types, combined with the hybrid turbocharger, involve a substantial change in the engine control modes, resulting in more flexible and efficient power management. Therefore, the investigation requires a numerical analysis depending on the engine load variation, in both fuelling modes, to highlight different behaviours. In detail, a dual-fuel engine simulation model is validated for a particular application in order to perform a complete comparison, reported in tabular and graphical form, between the two examined turbocharging solutions. The simulation analysis is presented in terms of the engine working data and overall energy conversion efficiency.
1. Introduction
Due to the need to mitigate the harmful impact deriving from marine engines powered by fossil fuels, the regulations implemented over the years by the International Maritime Organisation (IMO) have set a challenging horizon, which requires new solutions to minimise the environmental footprint of the maritime sector [1]. In particular, IMO rules are increasingly restrictive about the ship’s polluting emissions of nitrogen and sulphur oxides (IMO Tier II and III, and ECA world areas [2]), while the energy efficiency design index (EEDI) has become mandatory for carbon dioxide [3,4]. This framework needs new measures to improve the energy conversion efficiency of propulsion engines and diesel–electric generators.
Currently, marine diesel engines have an efficiency of close to 50% but can be globally more efficient when combined with waste heat recovery (WHR) from their exhaust gas [5,6,7,8,9,10]. WHR steam plants allow achieving an overall efficiency improvement of 3 ÷ 5%, which corresponds to about the same percentage of carbon dioxide emission reduction. A further improvement in the ship’s energy efficiency can be achieved by installing WHR systems for dual-fuel (DF) marine engines [11,12,13]. It should be noted that natural gas (NG), in comparison with the traditional heavy fuel oil (HFO), reduces significantly emissions from the engine, as well as being 1 ÷ 2% more efficient at medium-high engine loads [14].
Mitsubishi Heavy Industries has recently developed an alternative method of exploitation regarding the engine’s exhaust gas thermal power, based on the hybrid turbocharger (HTC) technology [15,16]. The compressor turbine’s shaft line of the engine turbocharger integrates the high-speed electric motor/generator (EM/G). Thus, when the EM/G operates as an electric generator, it produces electricity to satisfy part of the ship’s electric load, reducing the diesel generators’ electric power, with a positive effect on fuel consumption and emissions. As far as the authors know, it is the only important application currently existing in the ship propulsion field. On the contrary, Formula One cars have been using HTC since 2014, and there are good application prospects for hybrid electric passenger cars [17,18] and fuel cell vehicles [19]. Scientific studies on marine applications are also rather limited: the study in [20] considers the HTC use for high-speed diesel engines aboard fast naval combatants, while in [21], the authors compare the simulation of a four-stroke DF marine engine equipped with its original turbocharger (TC) and, alternatively, with the HTC. The comparison between the two turbochargers demonstrated the validity of the HTC solution to increase the overall efficiency of the energy conversion system in the NG fuel mode. Obviously, this innovative turbocharging configuration requires controlling some important operational data, paying due attention especially to the different combustion control methods for the two fuel modes. Therefore, this second article extends the analysis of the two turbocharging solutions (TC and HTC) at different loads and speeds of the engine, including the HFO mode, for optimal management of the engine power in all its possible operating conditions. The main idea would be to provide, by numerical simulation, a series of operational data in the widest possible working range of the engine, for the evaluation of new smart ship propulsion solutions to complement the existing applications or studies [22,23,24]. In fact, the proposed innovation combines the advantages of thermal energy recovery with a new concept of hybrid power generation, differentiating itself from the traditional meaning of hybrid propulsive applications [22,25,26,27,28]. To this end, simulation results, concerning a MAN 51-60 DF 12V marine engine (Germany), are discussed after a brief description of a DF engine’s working principles and numerical modelling.
2. Materials and Methods
2.1. DF Engines
A marine DF engine is substantially derived from a compression-ignition (CI) engine by adding the capability to operate as a positive-ignition (PI) engine burning a gaseous fuel. The two working modes are completely different. In the diesel mode, the fuel is injected into the cylinder in a liquid phase and it ignites by compression; the air–fuel ratio (AFR) varies with the load. In NG mode, the fuel is injected and mixed with the air before the inlet valve and the ignition occurs as in a spark-ignition engine. In DF engines, the spark plug is replaced by a small liquid fuel injection, whose combustion is promoted by compression. The natural gas, depending on methane contents, has good resistance to autoignition, particularly when the mixture is lean; therefore, the engine compression ratio can be as high as in CI engines. The pilot fuel flame behaves as multiple sources of high-temperature points that move in the combustion chamber and fire up gaseous mixture burning. The value of air–fuel ratio (AFR), to avoid knocking and to achieve a stable combustion, varies between 1.7 and 2.1, depending on brake mean effective pressure (b.m.e.p.) and methane number; hence, in NG mode, a more refined and precise AFR regulation is required, mainly during transients. The airflow towards the cylinders can be controlled by acting on the pressure in the air inlet manifold; a fuel controller determines the right amount of gaseous fuel to be injected according to the value of the air receiver pressure, which becomes the main parameter to manage the NG-powered engine load. The turbocharger system must be designed to supply the proper airflow to the engine at the different loads, and this requires accurate control of the energy transferred from the exhaust gas to the charge air. Due to the increased efficiency of current turbochargers for marine engines, at higher loads, only a part of the exhaust flow is needed to guarantee a stable operation of the compressor and to avoid a dangerous increase of the boost pressure. A waste gate valve (WGV) on the exhaust line can control the boost pressure, bypassing the turbine and therefore reducing the energy to the compressor. The WGV system can be overcome by a variable geometry turbine that allows the pressure in the exhaust to be controlled manifold. In fact, the turbine cross-sectional area variation corresponds to a change in the turbine aspect ratio (AR) and, consequently, in the turbine performance map. There are different technical solutions to obtain such AR variation, including variable nozzle turbine, variable volute turbine, variable sliding ring turbine. In this study, a variable nozzle turbine area (VTNA) is considered. Although the peak efficiency of an AR variable turbine is lower than a corresponding fixed aspect ratio one, the overall turbocharger system efficiency is generally higher [29]. A further system to control pressure in the air inlet manifold is the adoption of a bleed valve (BV) at the intercooler outlet to discharge outside part of the airflow at the compressor outlet. Blowing off part of the air allows a faster and more precise control of the pressure in the air receiver, suitable for application requiring a constant set value of AFR during the transient. From the energetic point of view, blow-off operation, as in the case of WGV or VTNA, dissipates part of the compressor work without the possibility of further recovery.
2.2. Hybrid Turbochargers
Since the mid-1980s, the non-negligible energy content of the engine exhaust gases has been used to produce mechanical or electrical energy by means of auxiliary turbines [30]. More recently, taking advantage of the improved efficiency of marine turbochargers, a parallel configuration has also been adopted by deriving a portion of the exhaust gas flow (generally about 10%) to the auxiliary turbine. In this context, Mitsubishi Heavy Industries has developed an HTC, i.e., a turbocharging system, integrating an electric motor/generator (EM/G) [15]. The shaft of the turbogenerator is equipped with EM/G in a very compact installation so that a unique turbine drives the compressor and the electric motor. Installing an HTC gives the possibility to control the turbocharging system dynamics (i.e., turbocharger speed) and the compressor work to avoid BV use. Thus, the HTC generator mode can favourably convert the energy, otherwise dissipated by the blow-off process, into electric power. Alternatively, the HTC electrical machine can operate as a motor to support the compressor during transients at low loads, when the exhaust gas energy from the engine cylinders decreases considerably. Due to the very fast dynamics of electrical machines, this solution can improve greatly the overall system dynamics, particularly useful in gensets’ application, where sudden and large load variations can be common. Adding a VTNA gives the turbocharging system two degrees of freedom to optimise the working point for each load condition. The electric machine should be designed compactly enough to be mounted on the turbocharger shaft (usually on the compressor silencer side [15] or in the TC shaft [20]) and to withstand the very high rotational speeds (12 ÷ 20 krpm). In addition, the electrical design has to take into account the problems related to the high-frequency currents and magnetic flux variations. Finally, the HTC speed depends on the engine load condition; therefore, a bidirectional AC/AC converter is required to adapt current frequency and voltage to the ship’s electric power grid [21].
3. Simulation Case Study
The present analysis shows the behaviour of a marine DF engine in the TC/HTC alternative configurations, in both fuel modes. The examined engine is a four-stroke MAN 51-60 DF 12V [31], whose main characteristics are listed in Table 1 [21].
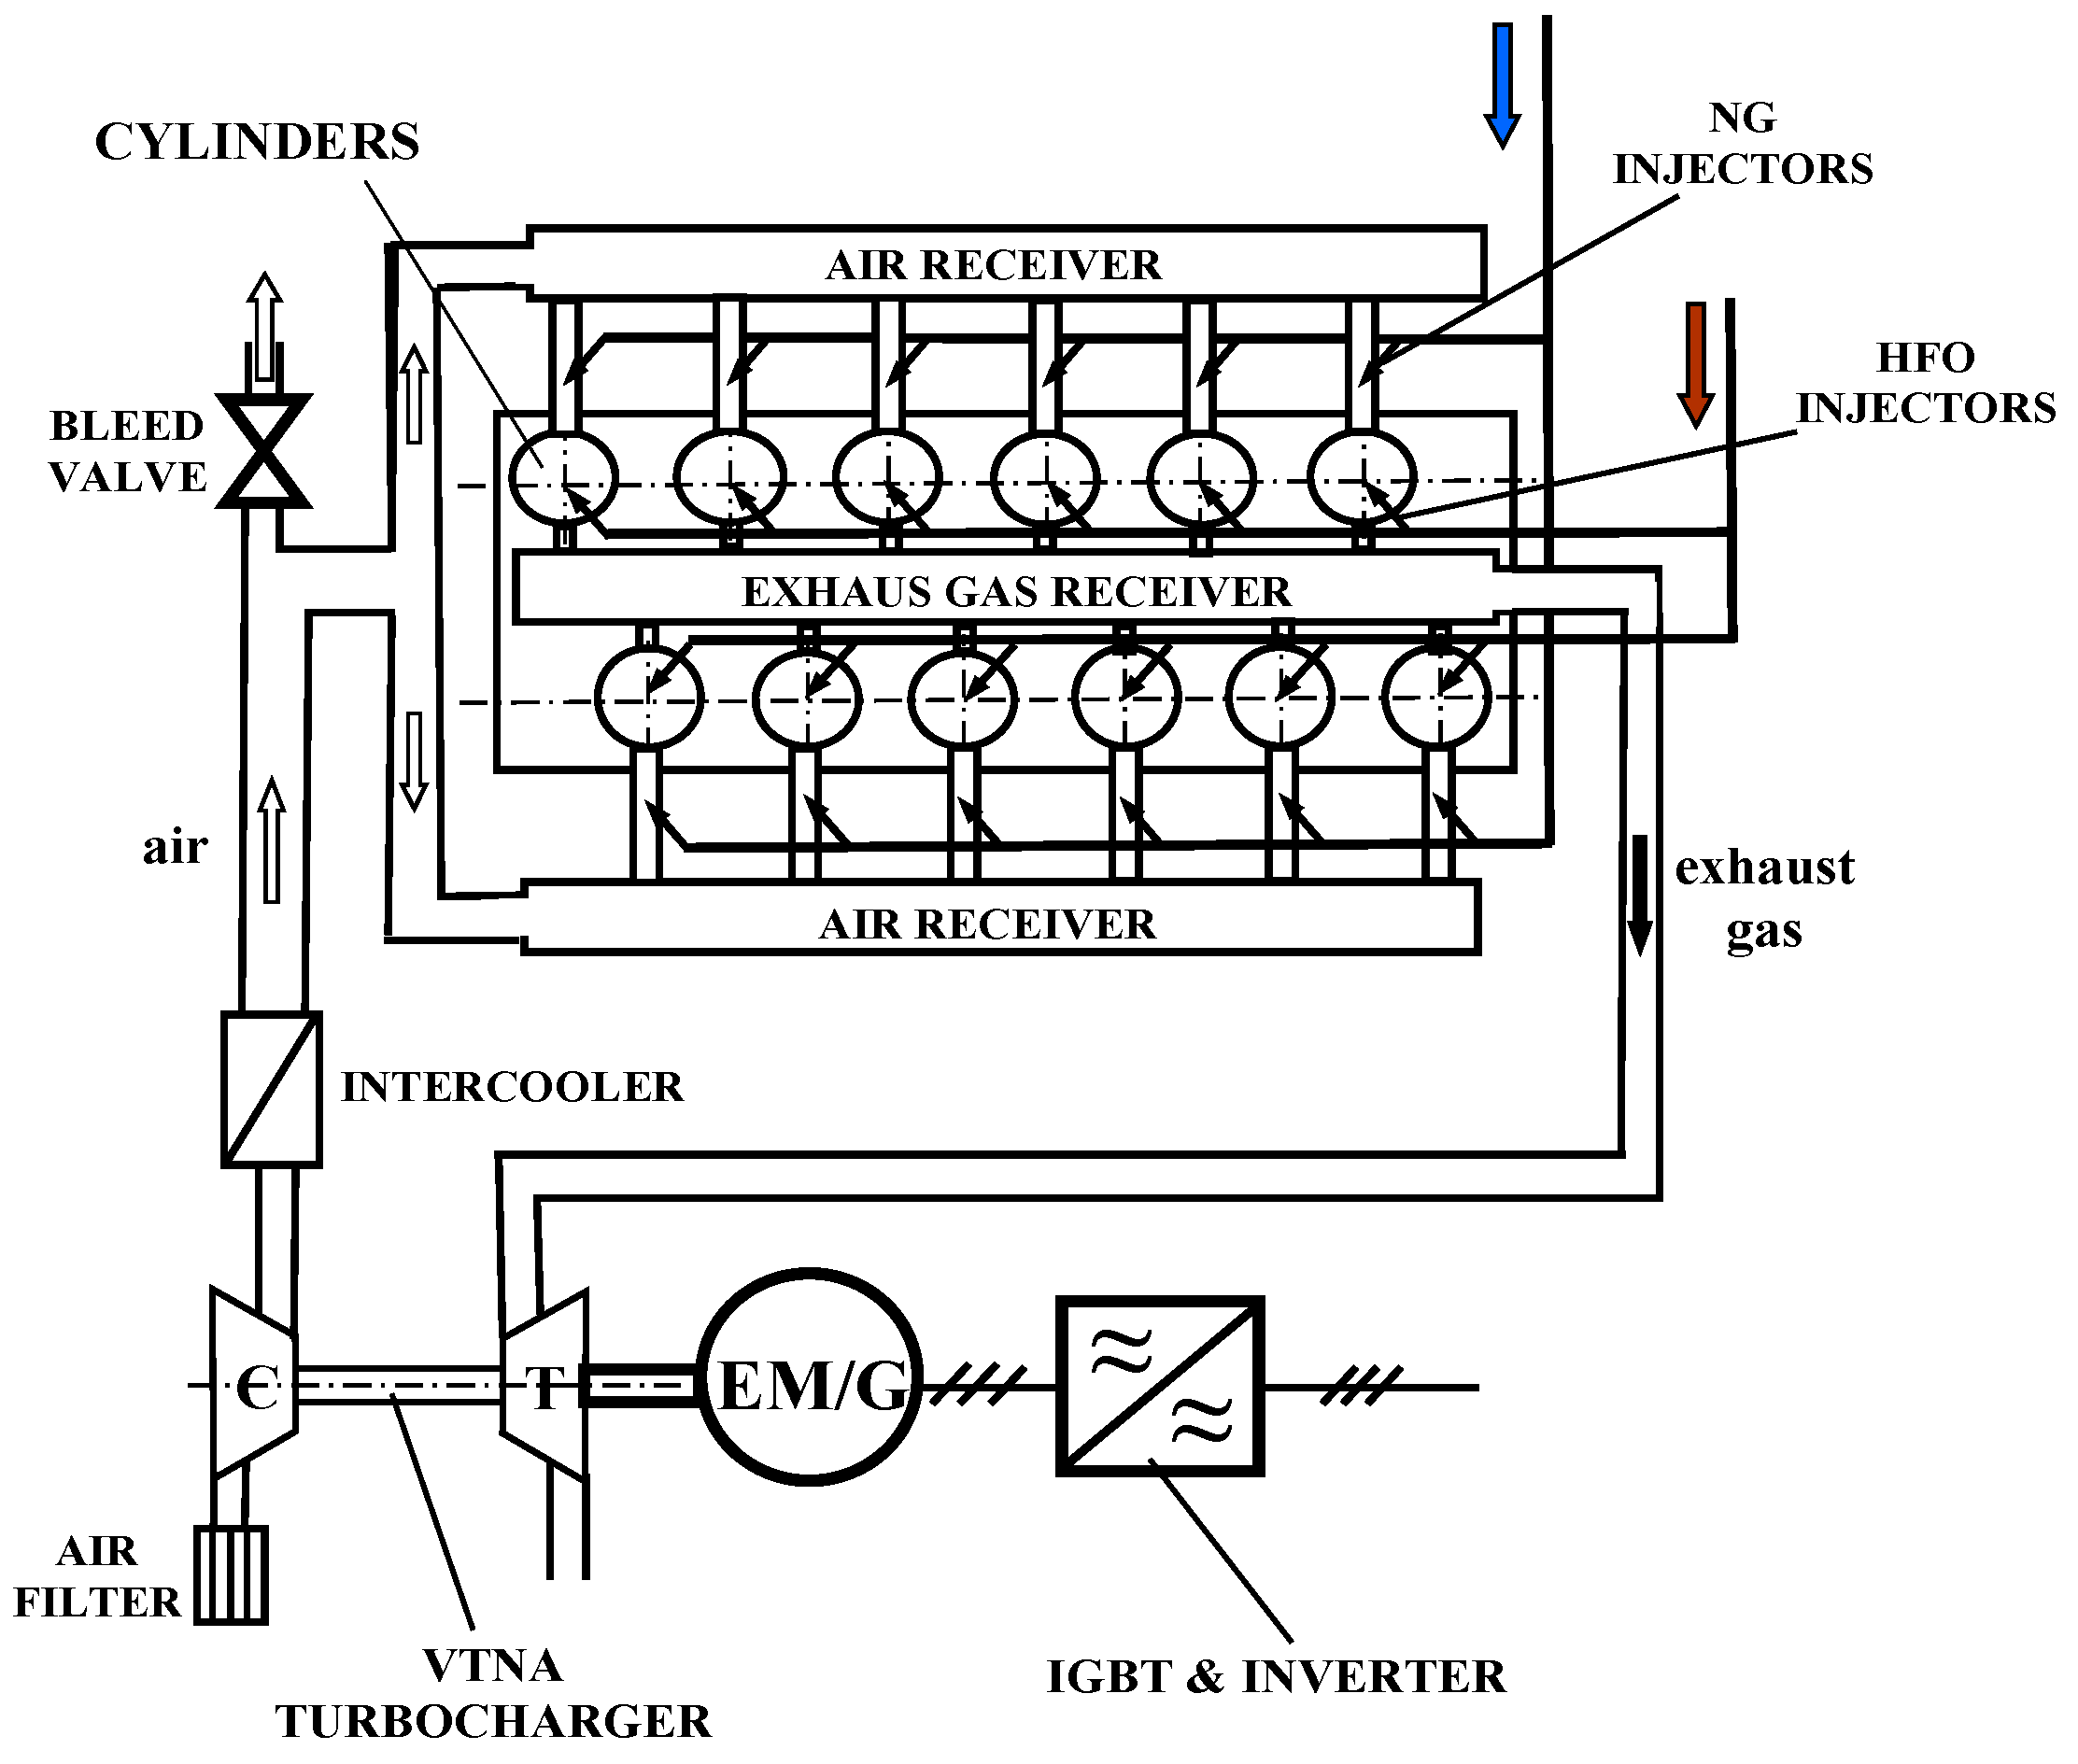
In the original version (i.e., TC equipment), the engine uses a BV to control the pressure in the air inlet manifold, determining the airflow rate to the cylinders. On the contrary, in the HTC configuration, illustrated in Figure 1, the BV is no longer essential for controlling the manifold air pressure, as previously stated. The compressor and turbine characteristics for the numerical modelling are assumed identical in the two different configurations.
3.1. Numerical Modelling
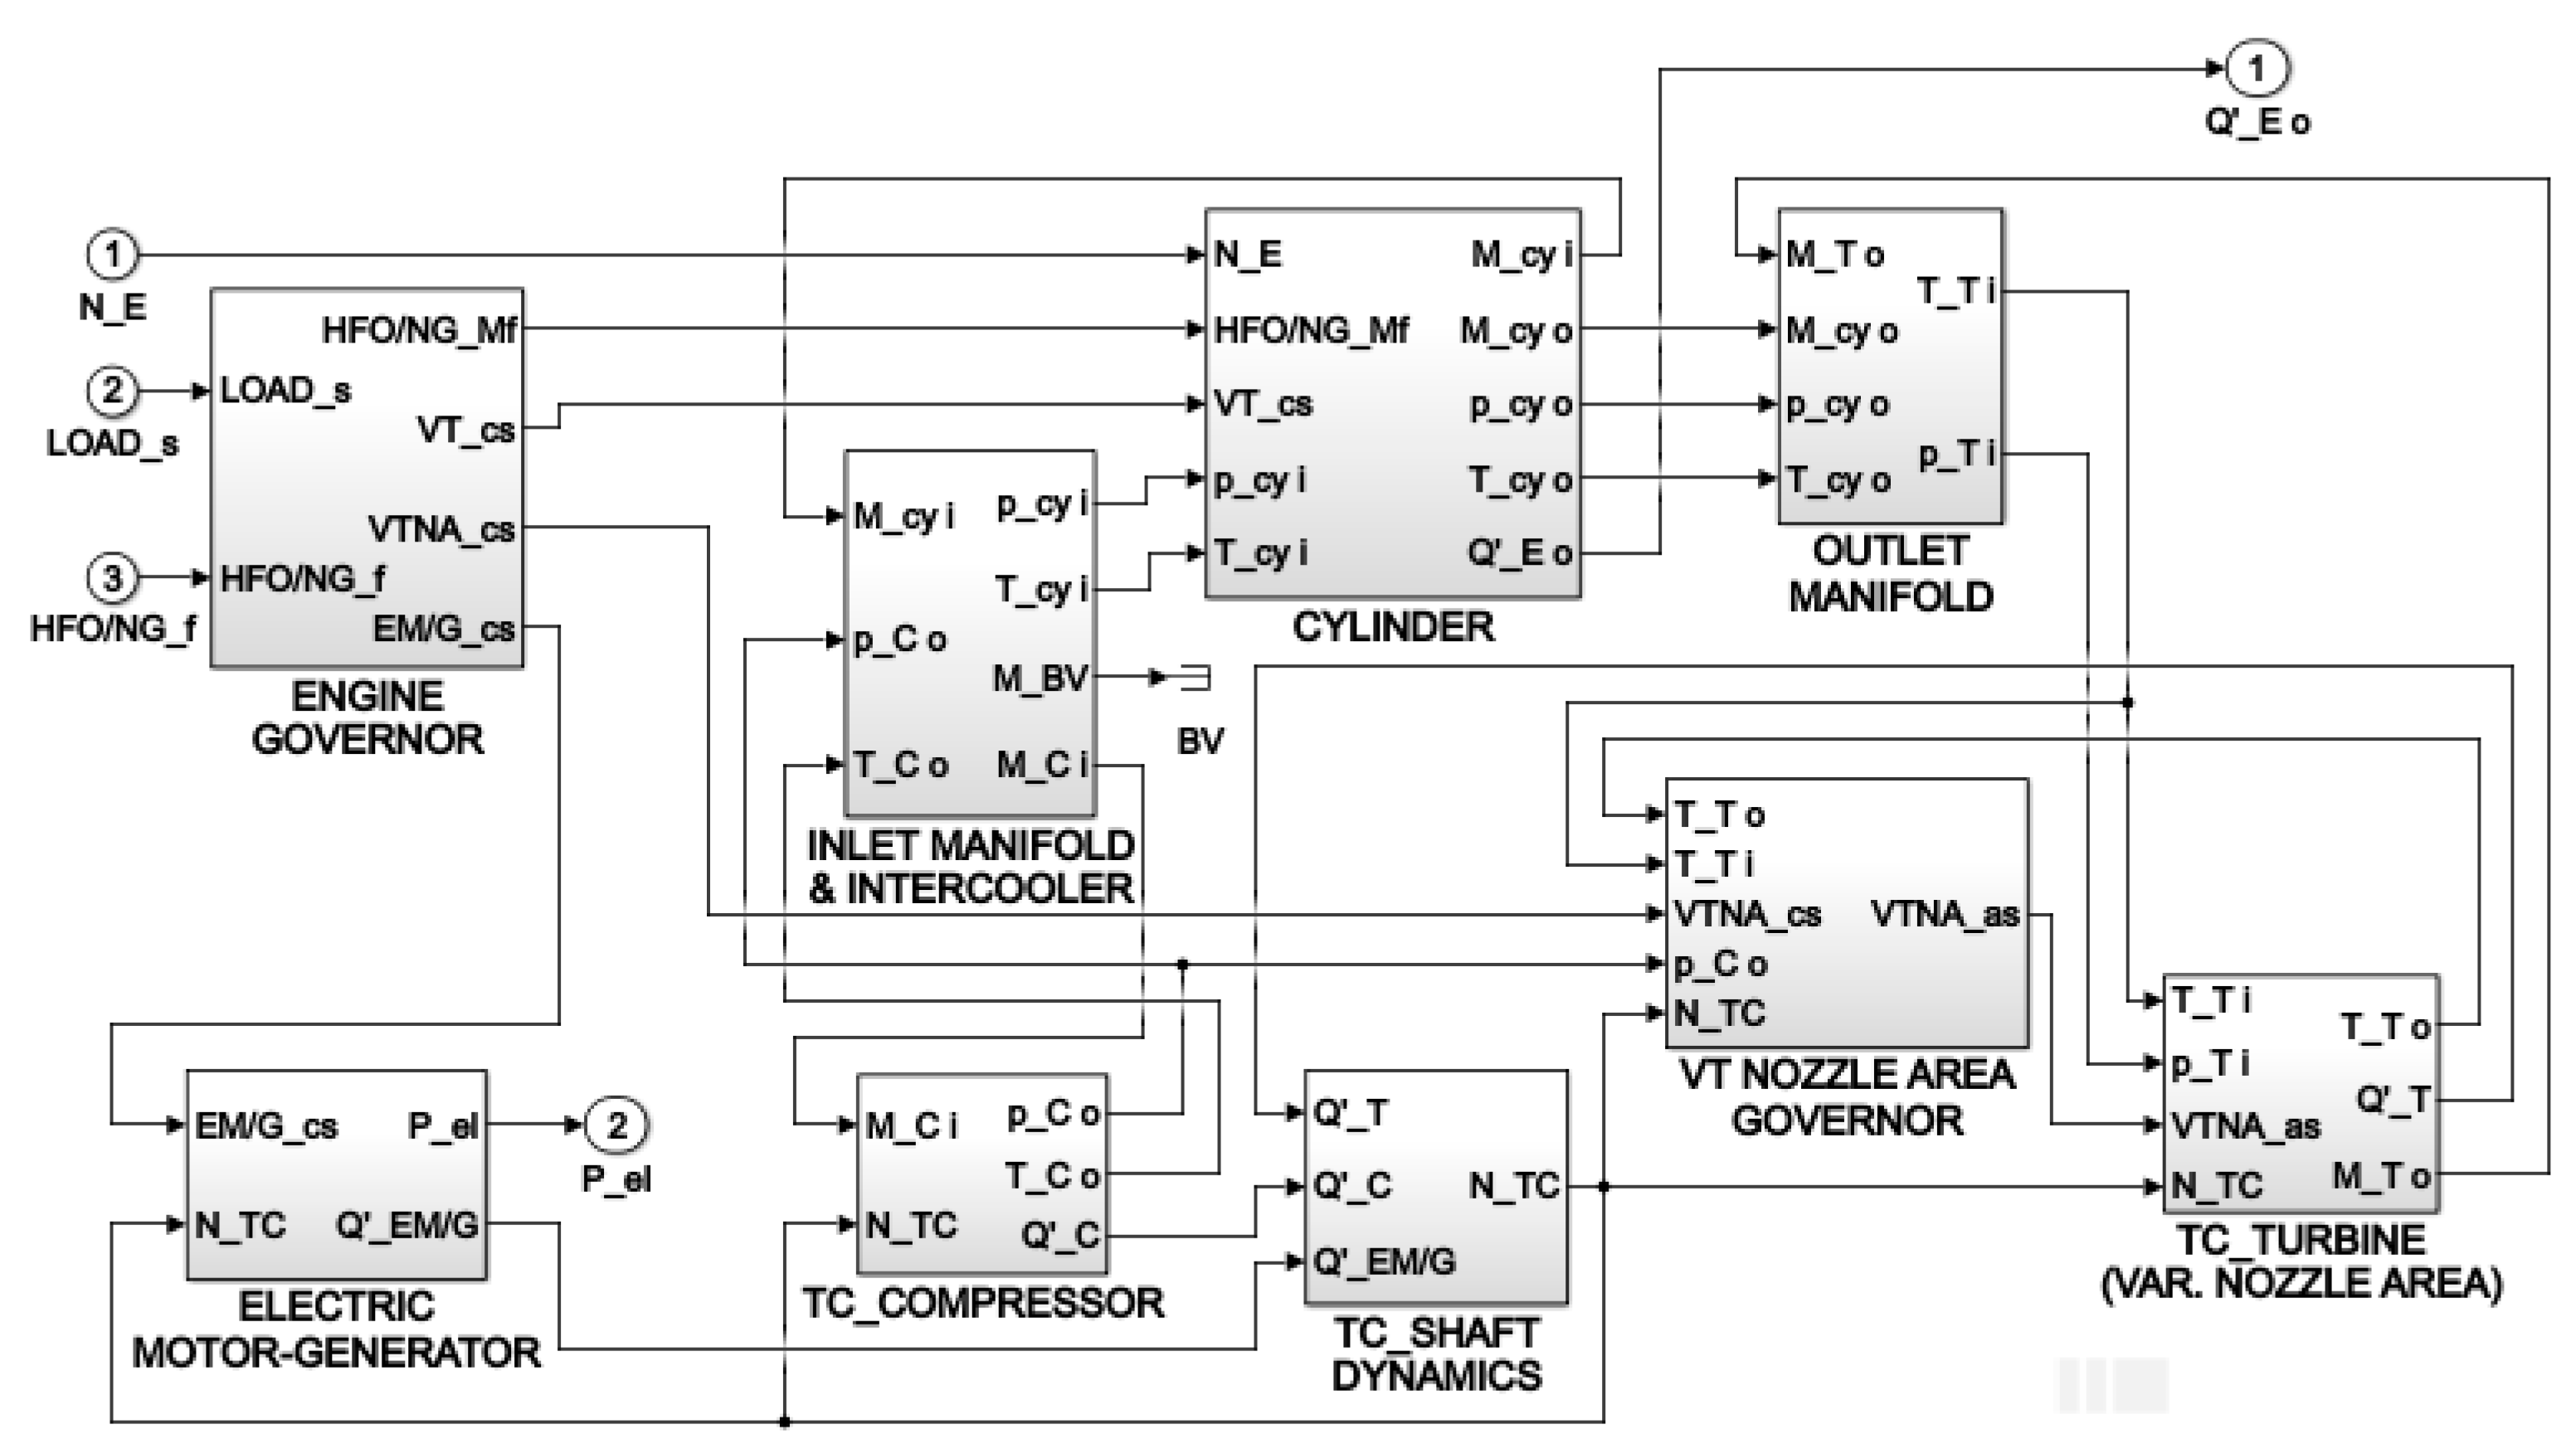
The HTC behaviour in the two possible operating modes is assessed through a complete thermodynamic simulation model of the engine, based on previous work [32]. Later, the authors updated the code by adding the HTC modelling [21] to show a performance comparison between the two different turbocharging systems, although limited to the NG fuel mode. As a next step, the present study aims to extend the comparison analysis to include the case of the HFO-powered engine in order to have a valid overview of the influence of the different working conditions and related combustion control methods on the behaviour of the engine in the two distinct turbocharging configurations. There is a large scientific literature on modelling of marine diesel engines, while simulation studies on DF engines are still limited. The models can be developed through specific programming languages [32,33] or commercial software [34,35], according to the different purposes [36,37,38,39]. The present DF engine simulator is arranged in a modular form, by using MATLAB-Simulink software. It is shown in Figure 2, where each engine module is represented [21].
The simulation follows a filling and emptying approach, in which each block provides features and performance of the pertinent engine components by means of algebraic, differential equations, and steady-state performance maps. The ideal gas equation is used to model the working fluid, while the specific internal energy and enthalpy are evaluated according to the temperature and fluid composition. The engine simulator requires the following main data: cylinders number and pertinent geometric characteristics; intake and exhaust valve data with opening/closing timing logics; compressor and turbine performance maps; VTNA variation; BV control details and ambient conditions.
As shown in Figure 2, the engine working conditions are represented by the rotational speed (N_E), the load signal (LOAD_s), and fuel type (HFO/NG_f). The actual engine cycle is calculated by the ‘cylinder’ module, in which the thermodynamic processes are modelled through a single zone approach, depending on the crank angle value. The cylinder inlet and exhaust mass flow rates through the poppet valves are given by the gas-dynamic equations adopted for the compressible fluid through a flow restriction (both subsonic and choked flow conditions are considered).
The combustion heat release fraction, depending on the crank angle and proportional to the fuel mass burned, is calculated through the double Wiebe equation, while the in-cylinder pressure variation is determined by integrating, at each crank angle step, the energy differential equation of a closed system.
However, the authors have already provided a broad explanation of the numerical model in [21,32]; therefore, this article prefers to delve into the main aspects of combustion control and power management, depending on the specific operating modes of the engine. The engine operates in the Miller cycle mode, being equipped with variable timing of the opening and closing phases of the intake valve. In this regard, different settings depend on fuel type (HFO or NG) and engine load, managed by the ‘engine governor’ module (Figure 2) giving the valves timing control signal (VT_cs) as output.
To optimise the engine performance under all operating conditions, the turbine of the turbocharger is characterised by a variable nozzle area (VTNA). This could represent a problem in the case of DF engines, because of the significant difference between the fuels’ lower heating value (42,700 kJ/kg for HFO, 49,000 kJ/kg for NG), the substantial difference in the combustion processes, and in the cylinder air–fuel ratios. For these reasons, the optimal turbocharger performance is different depending on the fuel used.
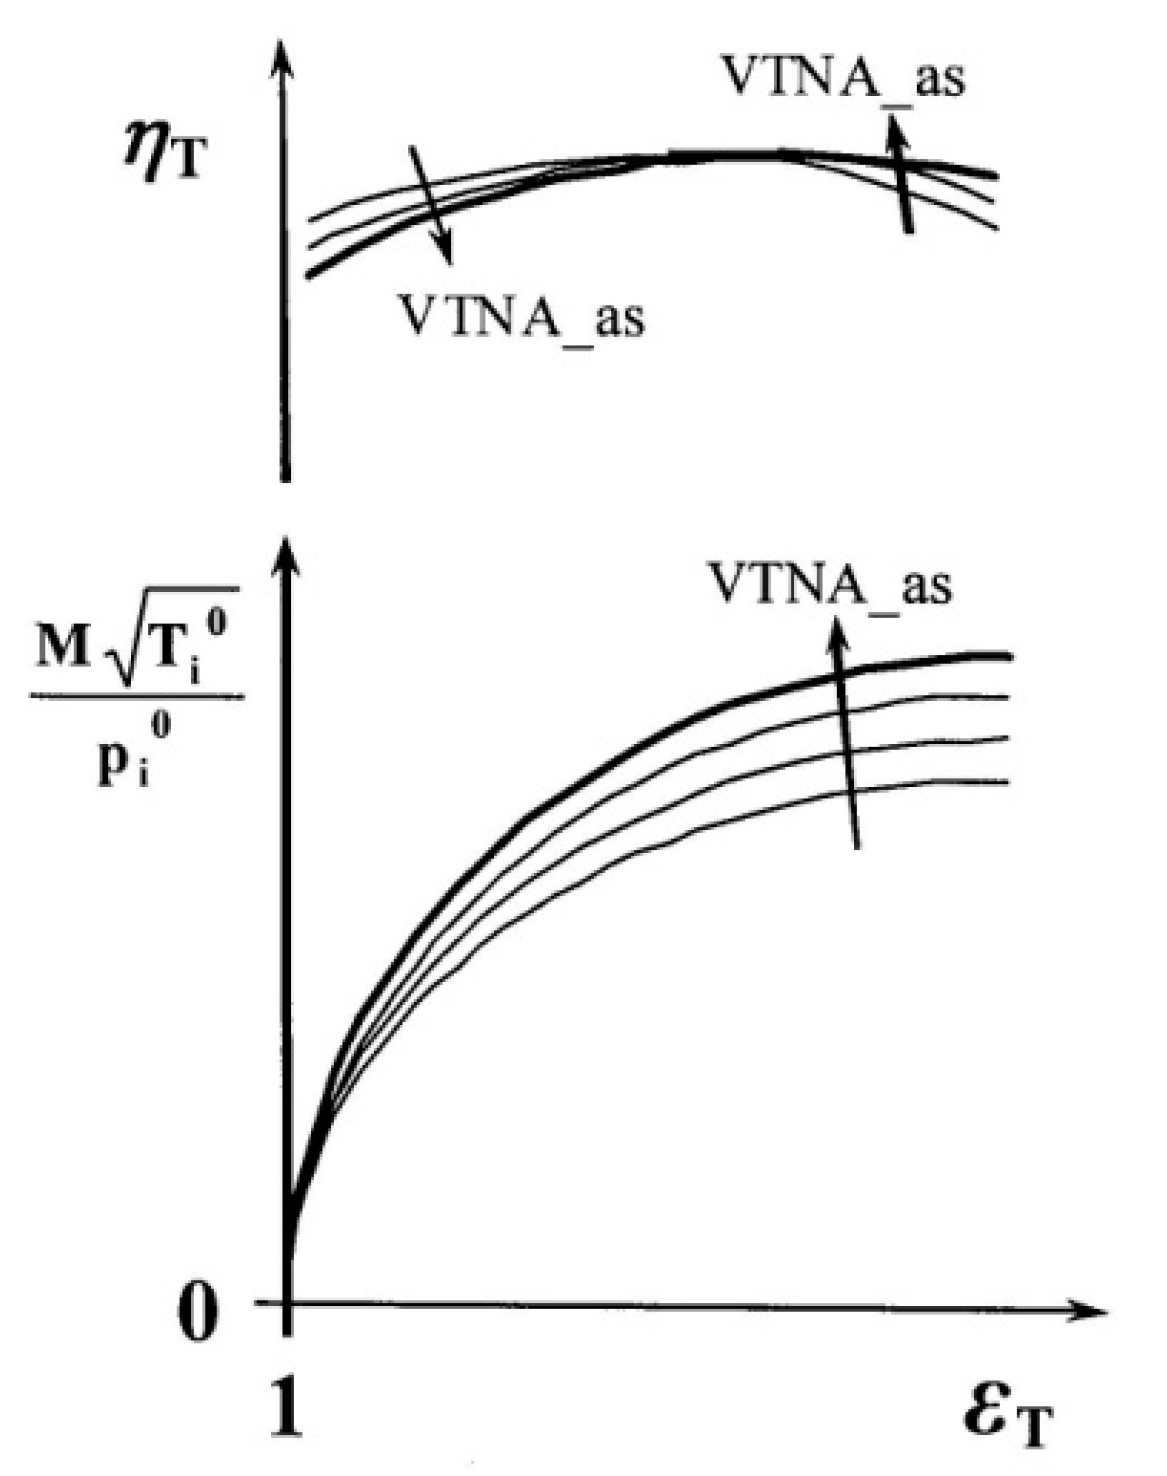
According to manufacturer indications [40], the VTNA is adopted only when using NG as fuel, while maximum turbine nozzle area is selected for the engine powered by HFO, under all operating conditions. Indeed, the exhaust gas flow rate is significantly higher over the entire operating range of the engine in HFO mode; therefore, the turbine in fully open condition can exploit all the exhaust thermal power. On the contrary, the gas mass flow rate is reduced by about 20% in NG mode [31], and therefore, it requires an appropriate adjustment of the turbine nozzle area, as the engine load decreases. The simulation of the VTNA turbine is based on the typical steady-state turbine performance maps [33]. As shown in Figure 3, reduced mass flow rate (M√Toi/poi) and efficiency (ηT) are functions of the expansion ratio. The VTNA is described by different curves, depending on the variable nozzle turbine actuator signal (VTNA_as), which is an output of the ‘VT nozzle area governor’ block in Figure 2. The influence of this parameter is evident in the generic turbine performance curves reported in Figure 3.
The TC turbine variable geometry nozzle ring is controlled, according to the logic indicated by the manufacturer [40], taking into account inlet and outlet turbine temperature (T_Ti and T_To), VTNA control signal (VTNA_cs) (depending in turn on the used fuel), compressor outlet pressure (p_Co), and turbocharger shaft speed (N_TC).
3.2. Engine Load Control
In the original version of the considered DF engine [31], equipped with a traditional TC, the engine load, proportional to the delivered torque, is controlled in different ways, depending on the fuel type used. When the engine is fuelled by HFO, the reference thermodynamic cycle is the diesel one; therefore, the classical approach of graduating the fuel mass injected into the cylinders is adopted. The engine load control considers also the BV opening, according to a logic depending on the engine speed and the fuel mass injected into the cylinders, as reported in [31]. In NG mode, the engine torque is controlled only by the BV, since the NG injection system keeps an almost constant value for the air–fuel ratio (about twice the stoichiometric value), in accordance with the Otto cycle. Similar to the HFO mode, an increase of the BV opening determines an engine torque decrease and vice versa. The amount of the bled air at the different operating points represents the capability of the control system to increase more or less quickly the boost pressure, depending on the manifold volume; when the BV is completely closed, there is the maximum increase in the inlet manifold pressure. In the engine simulator, the BV is modelled in the same way as a cylinder poppet valve [32]. On the contrary, in HTC engine configuration, the EM/G governor can vary its delivered electric power to control the turbocharger shaft speed [21], while the BV remains always closed. In fact, the HTC speed is obtained hrough he shaft dynamics equation as follows:
where ω is the HTC shaft angular speed, J the rotor inertia, Q′T, Q′C, and Q′EM/G, respectively, the torque of HTC turbine, compressor, and electric motor/generator. Equation (1) shows that the HTC speed can depend on the EM/G torque (Q’EM-G), which can be used to control the turbocharger speed in both fuelling modes. In addition, the electric power generated by the EM/G is available to satisfy part of the ship’s electric load. The engine dynamic performance can also be improved by allowing the electrical machine to operate as a motor during the load transients. In the Simulink model, the ‘engine governor’ block is able to manage the engine load in all the possible engine control configurations (use of BV or HTC EM/G) and working conditions (i.e., HFO or NG fuel, constant or variable speed load). In particular, in the HTC engine configuration, the ‘engine governor’ block is scheduled to maintain the same working conditions of cylinders and turbocharging turbine considered in the case of the original TC, corresponding at the same engine load and speed. This is possible through its output EM/G control signal (‘EM/G_cs’ in Figure 2), which controls the EM/G delivered electric power (‘P_el’, output of the ‘electric motor-generator’ block). The ‘P_el’ parameter has an influence on the Q′EM/G value, therefore on the HTC angular velocity (ω), according to Equation (1).
dω/dt = (1/J)∙(Q′T − Q′C − Q′EM/G)
4. Results and Discussion
In this section, the simulator results obtained for the TC engine configuration are compared with the engine data sheet [31], referred to as steady-state working conditions between 25% and 100% of the load, both at constant (514 rpm) and at variable speed.
Table 2 shows the results of this comparison as percentage errors, for both possible fuels (HFO or NG). The table (where Co and To represent the compressor and turbine outlet sections) shows good accuracy of the engine simulator results, particularly at medium-high engine loads, for both types of used fuels. No significant differences between constant and variable speed running conditions are detected.
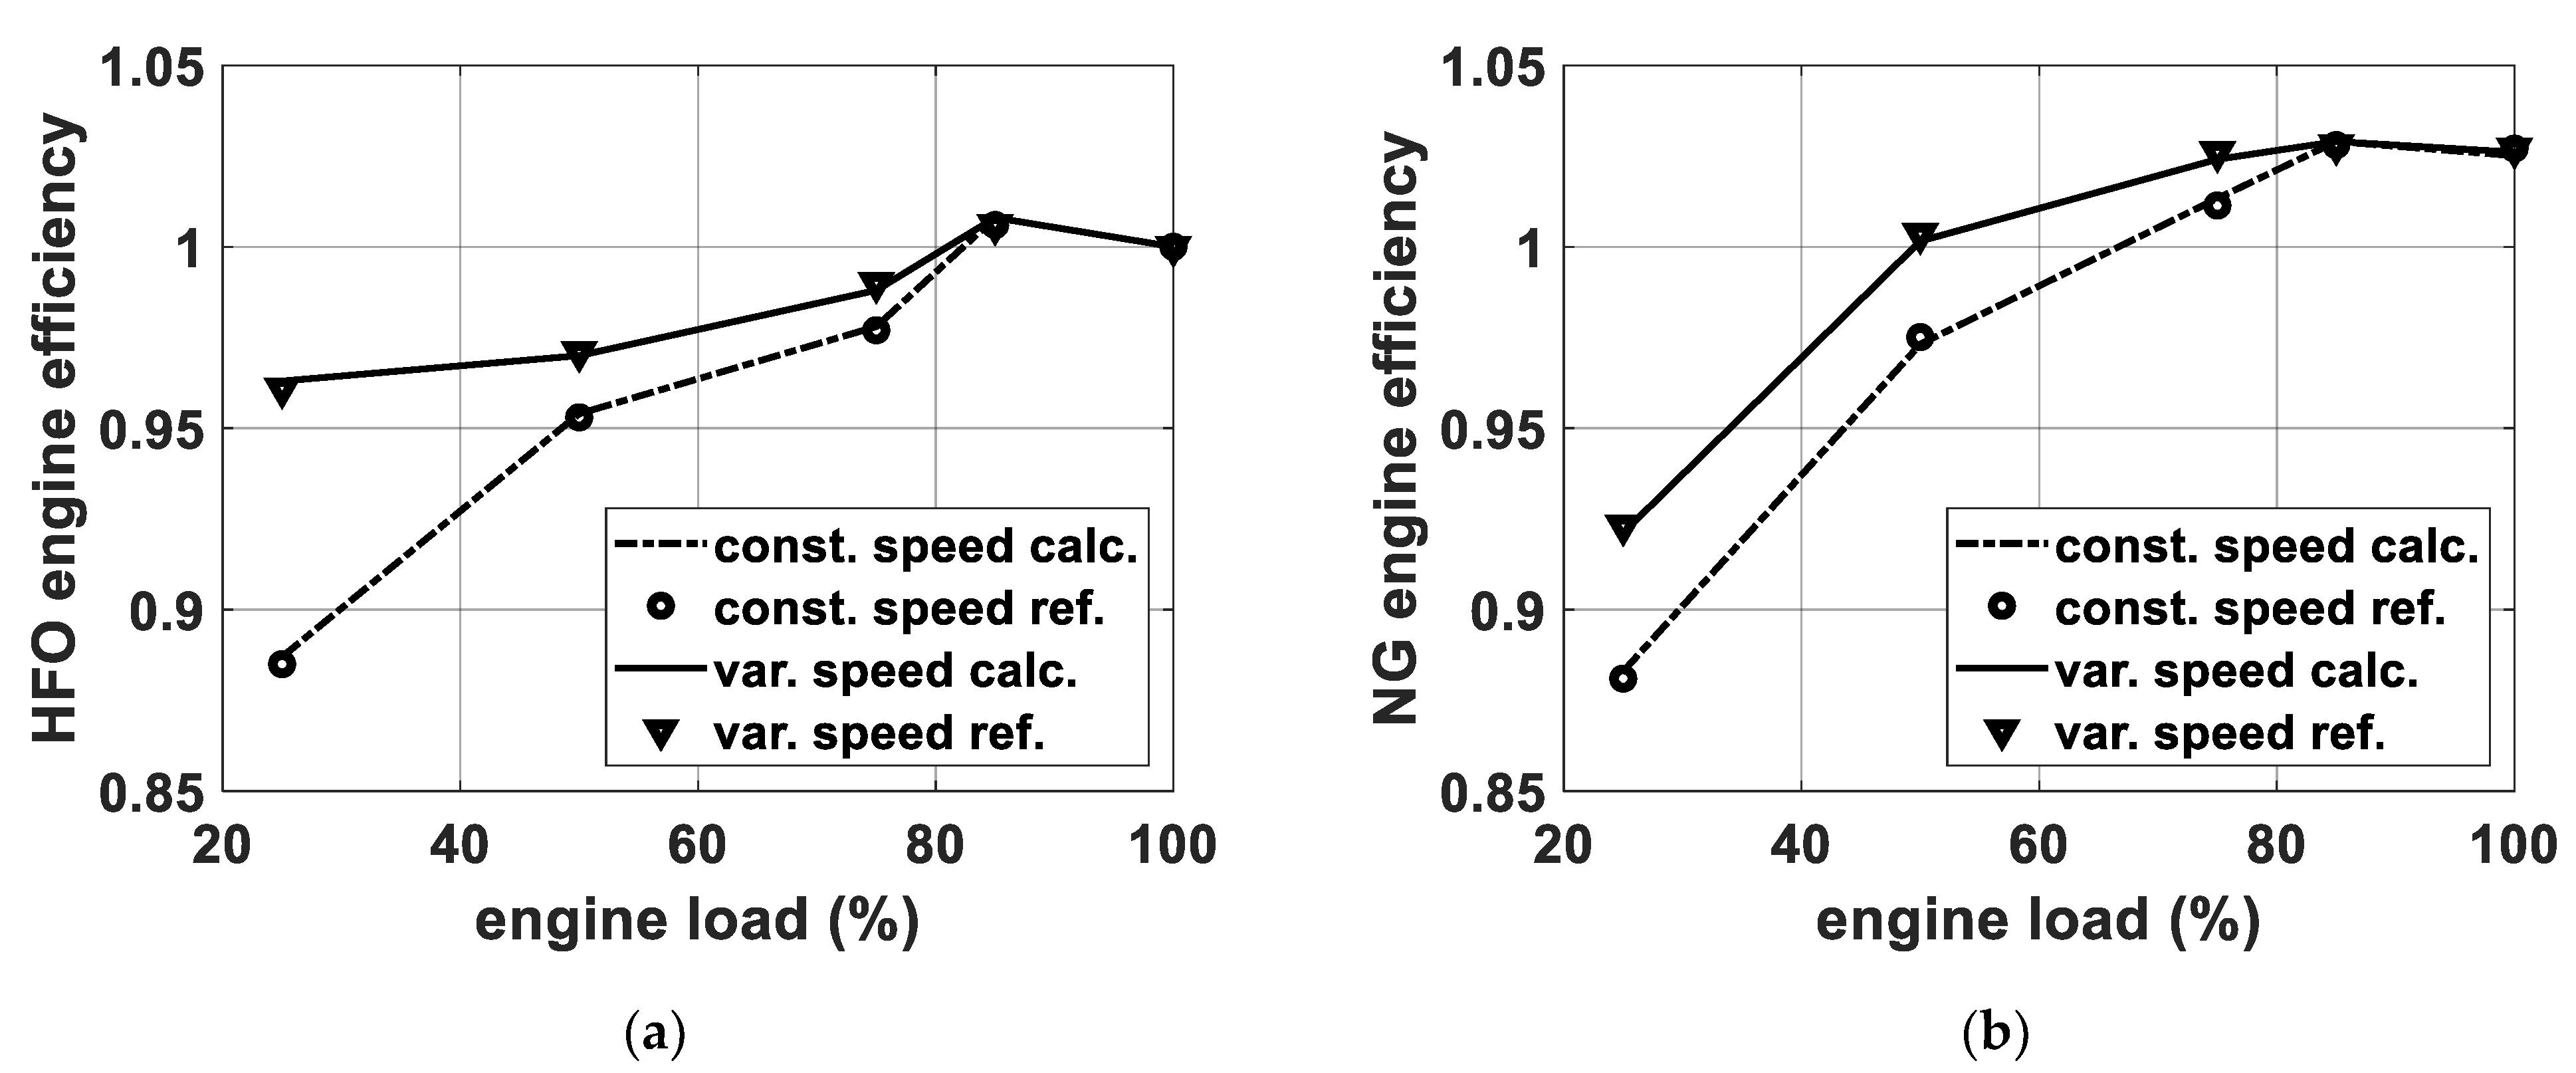
As regards the engine efficiency (ηE), the simulation results reported in Figure 4a (HFO-powered TC engine) and Figure 4b (NG-powered TC engine) depend on engine power, fuel mass flow rate, and fuel lower heating value. The data are normalised with respect to the TC engine configuration, working at the maximum continuous rating (MCR) of the HFO-powered engine. The figure shows for both fuel types a very good agreement between calculated and reference data, in every operating condition (constant/variable speed). The NG mode is more efficient than HFO at high engine loads; on the contrary, the engine efficiency is greater in HFO mode at very low loads and at variable speed.
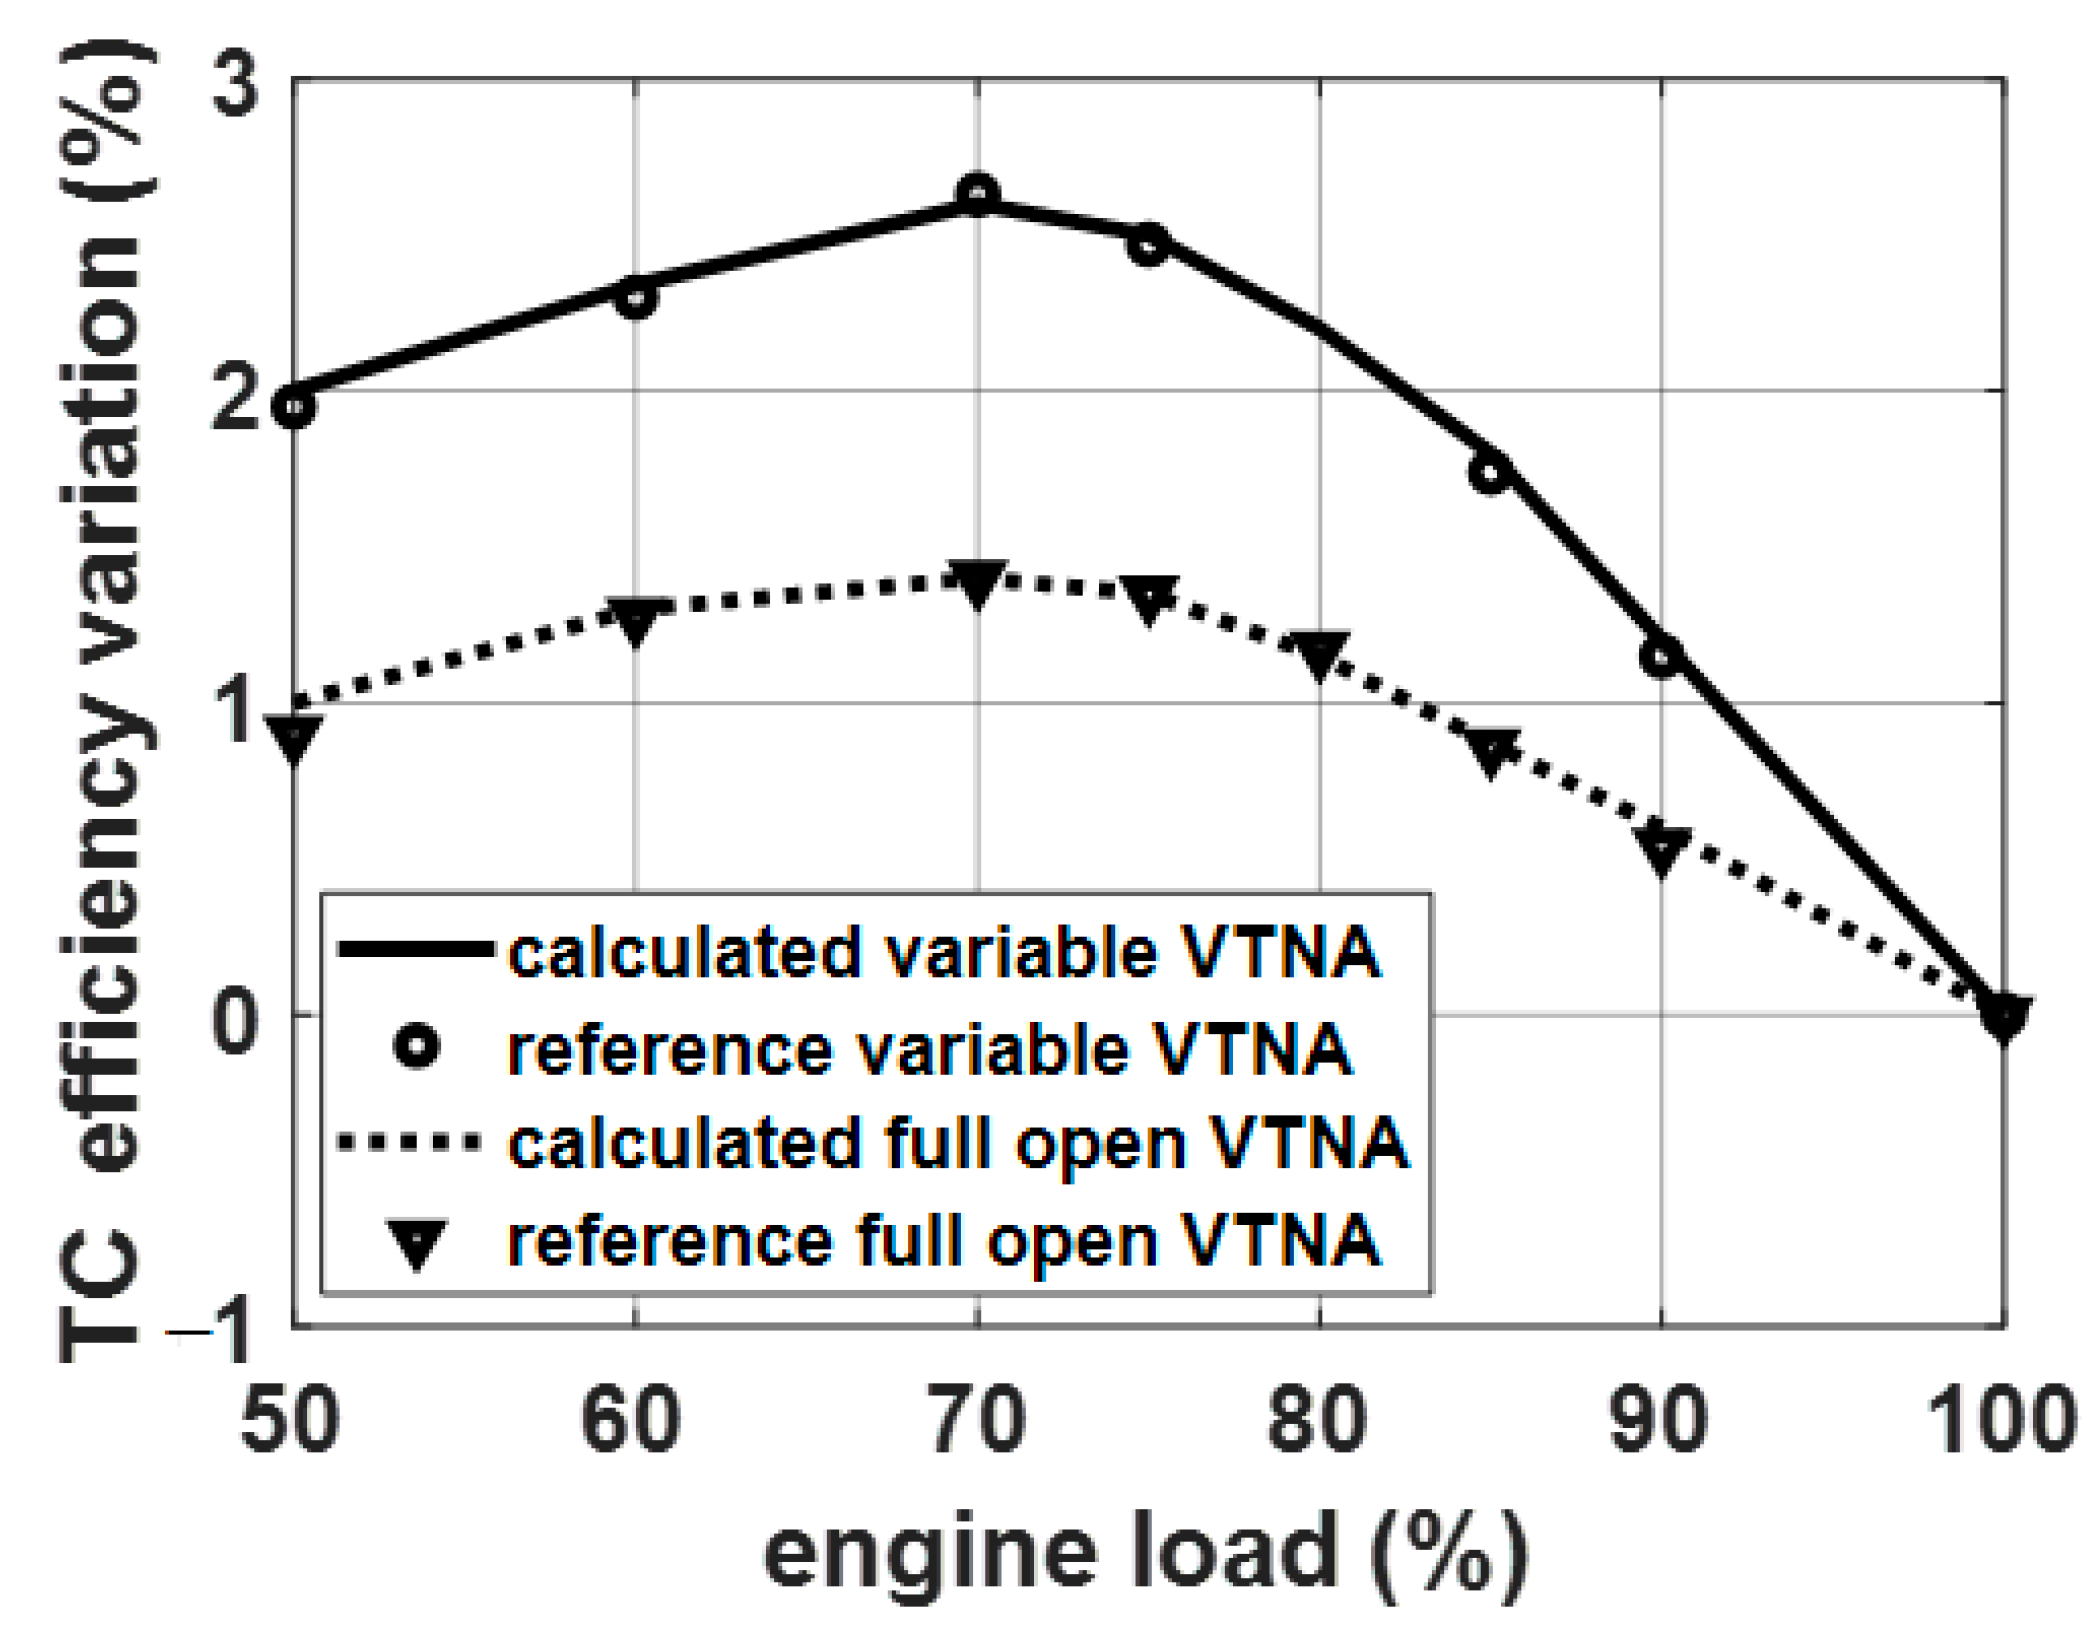
In order to investigate the influence of some important parameters on engine power management, the VTNA device performance is assessed in Figure 5. In addition to the good agreement between simulation and reference data [40], in both conditions of VTNA fully opened (HFO mode) and for different nozzle areas (i.e., variable VTNA, NG-powered engine), the best efficiency is provided at 70% of the engine load.
The good accuracy of the overall simulation results makes the simulator suitable for the examined case study.
4.1. Turbochargers’ Influence on Engine Performance
The simulation model is mainly used to show the engine performance differences due to the use of the HTC as an alternative to the original TC. The comparison is carried out in both HFO and NG modes, for different engine loads at constant and variable speed working points. In detail, Table 3 and Table 4 and refer to the engine loads equal to 100%, 85%, 75%, 50%, and 25% of MCR.
The electric power generated by the HTC is also reported in Table 3 as a percentage of the mechanical engine power (line 6) and shows the significant power rate recovered by the HTC, for both fuels, especially at high loads (i.e., 100% and 85%).
At the engine medium loads (i.e., 75% and 50%), the recovered power increases in gas mode, while it reduces progressively in the HFO-powered engine condition. At a very low engine load (25%), the EM/G power decreases but remains quite substantial in the case of NG fuel, while it drops considerably for HFO. The different values of the EM/G power between the two fuels are mainly due to the following:
- A greater NG lower heating value, compared to that of HFO (49,000 kJ/kg for NG; 42,700 kJ/kg for HFO);
- A substantial difference of the combustion processes;
- A different equivalence ratio in the cylinders (this last quantity is defined by dividing the AFR value by the stoichiometric ratio).
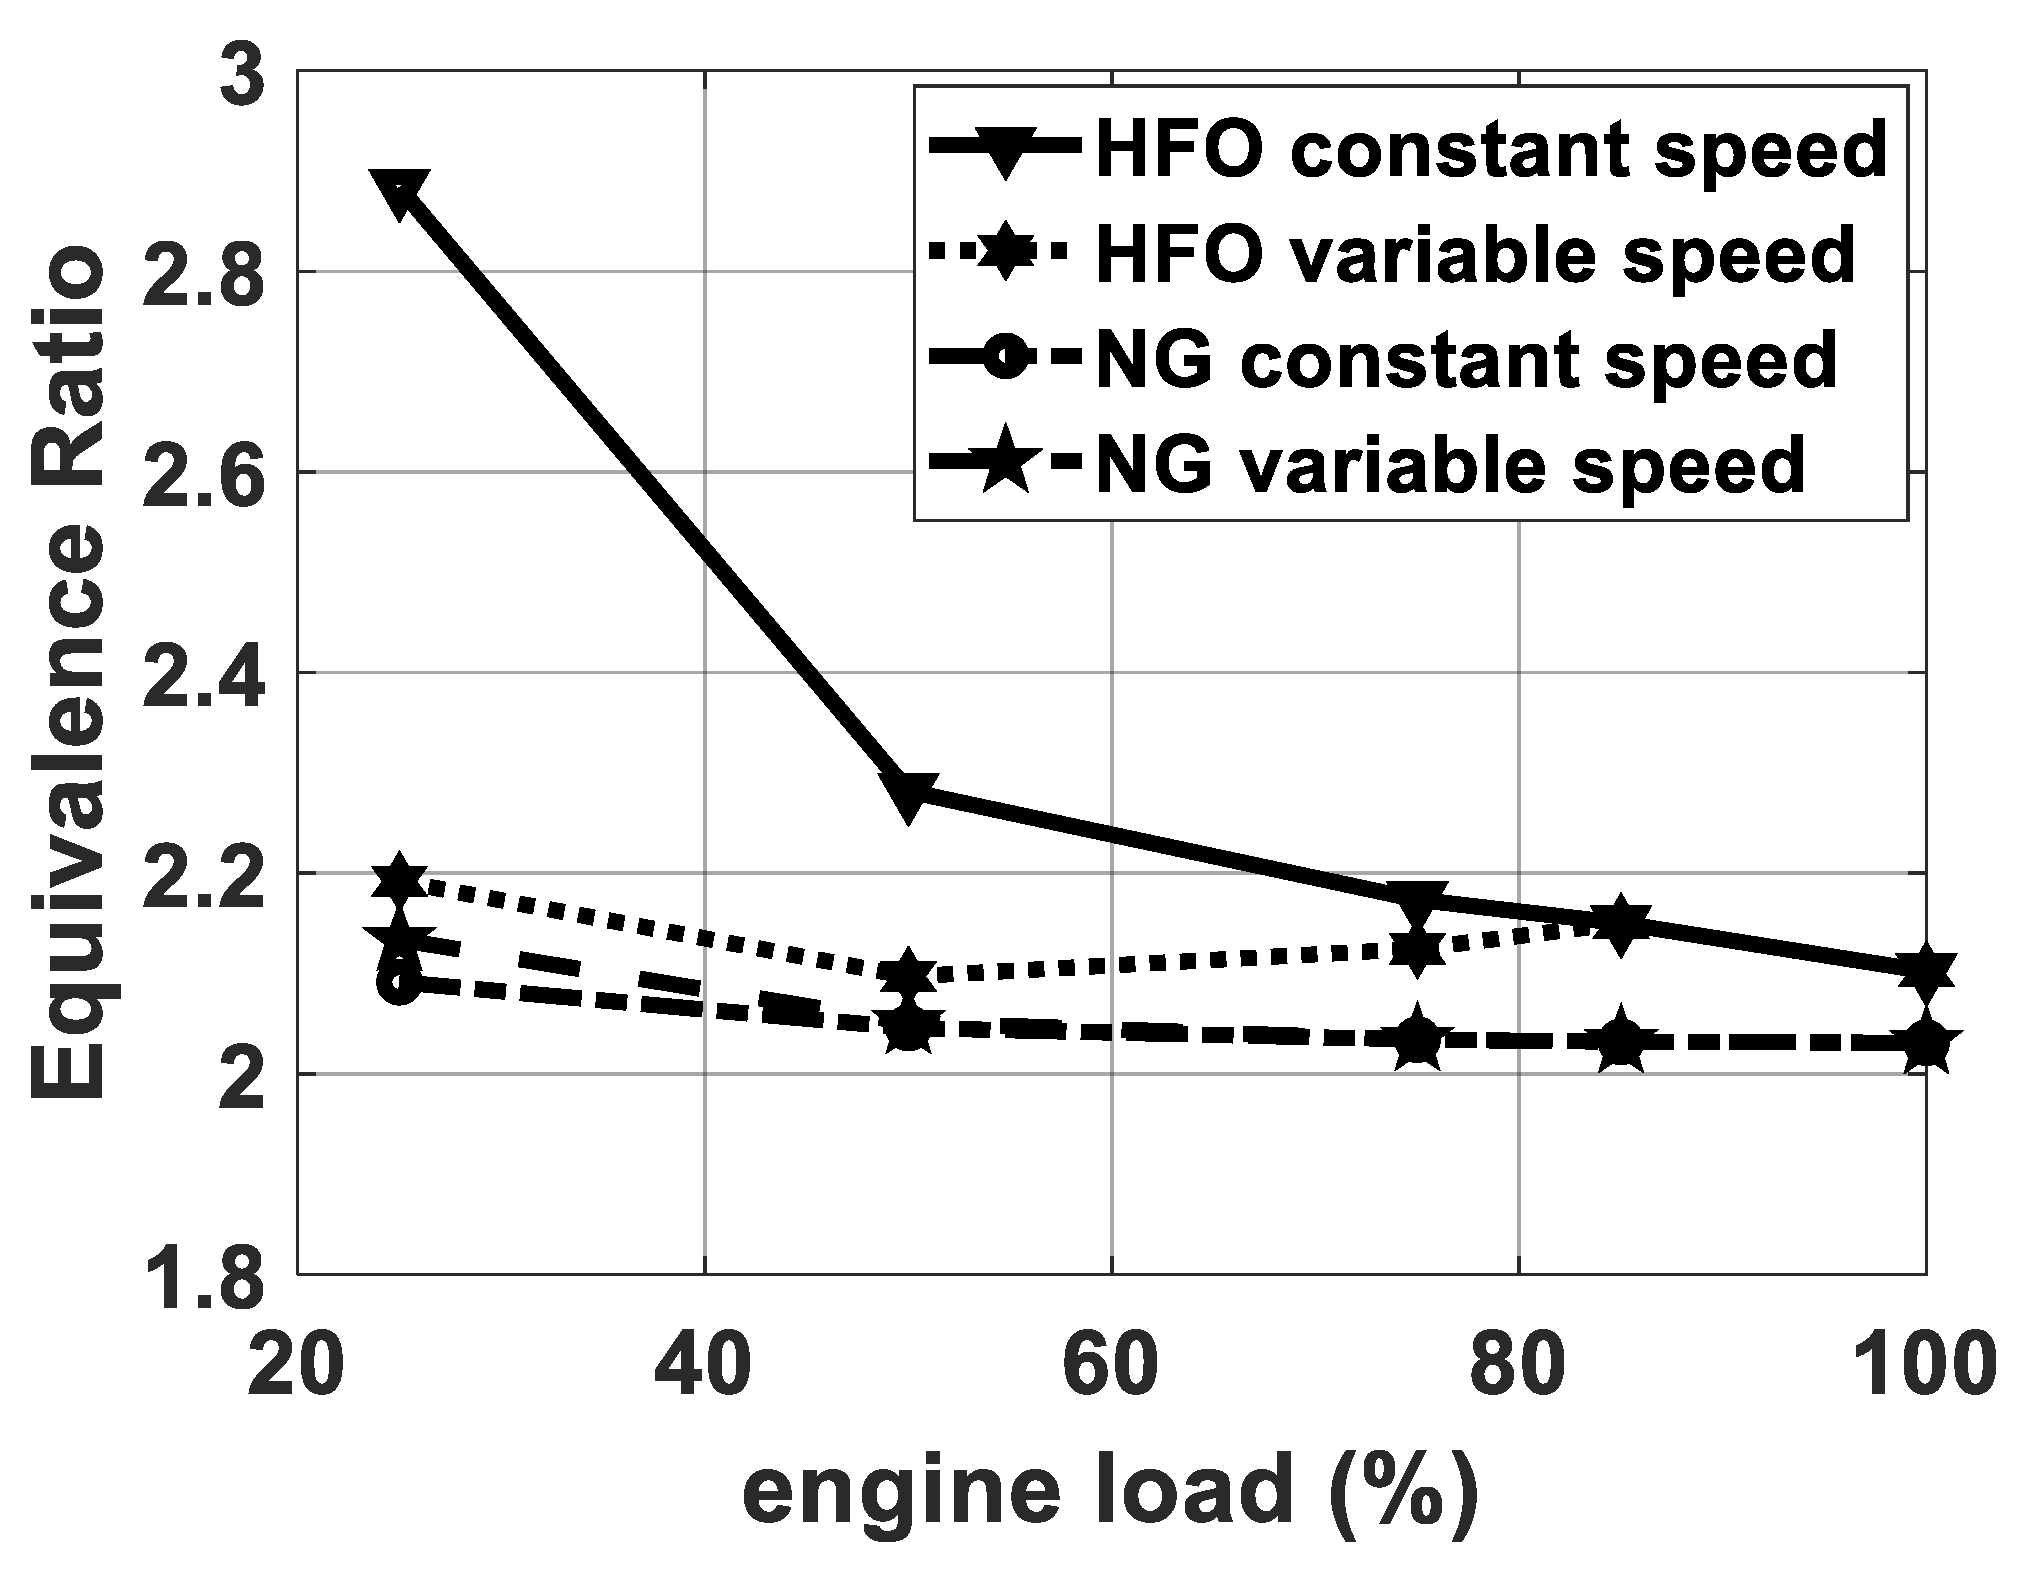
As regards the latter, Figure 6 reports the equivalence ratio values versus the engine load, at constant and variable speed conditions, for both fuels.
The equivalent ratio, in the case of constant engine speed and HFO mode, strongly decreases when the engine load increases, while it remains almost constant in the other operating conditions.
The quantities in Table 3, from line 7 to line 20, are shown in a form expressed through the following generic equation:
where x is the generic variable, and the subscripts HTC and BV indicate, respectively, the engine adopting the HTC and the conventional TC using BV. The HTC use, in comparison with the original TC, involves not negligible and sometimes high variations of the parameters, considered from lines 7 to 11 as the TC speed and the compressor behaviour. On the other hand, the cylinder and the turbine parameters (lines 12–20), as well as the engine indicated mean effective pressure (i.m.e.p.), show negligible variations in these parameters consequent to the HTC adoption. This is mainly due to the abovementioned ‘engine governor’ setting of the simulator. Table 4 reports the same simulation analysis, although referring to the engine working at variable speeds. A similar behaviour is noticed between the two engine speed conditions.
Δx% = (xHTC − xBV)∙100/xBV
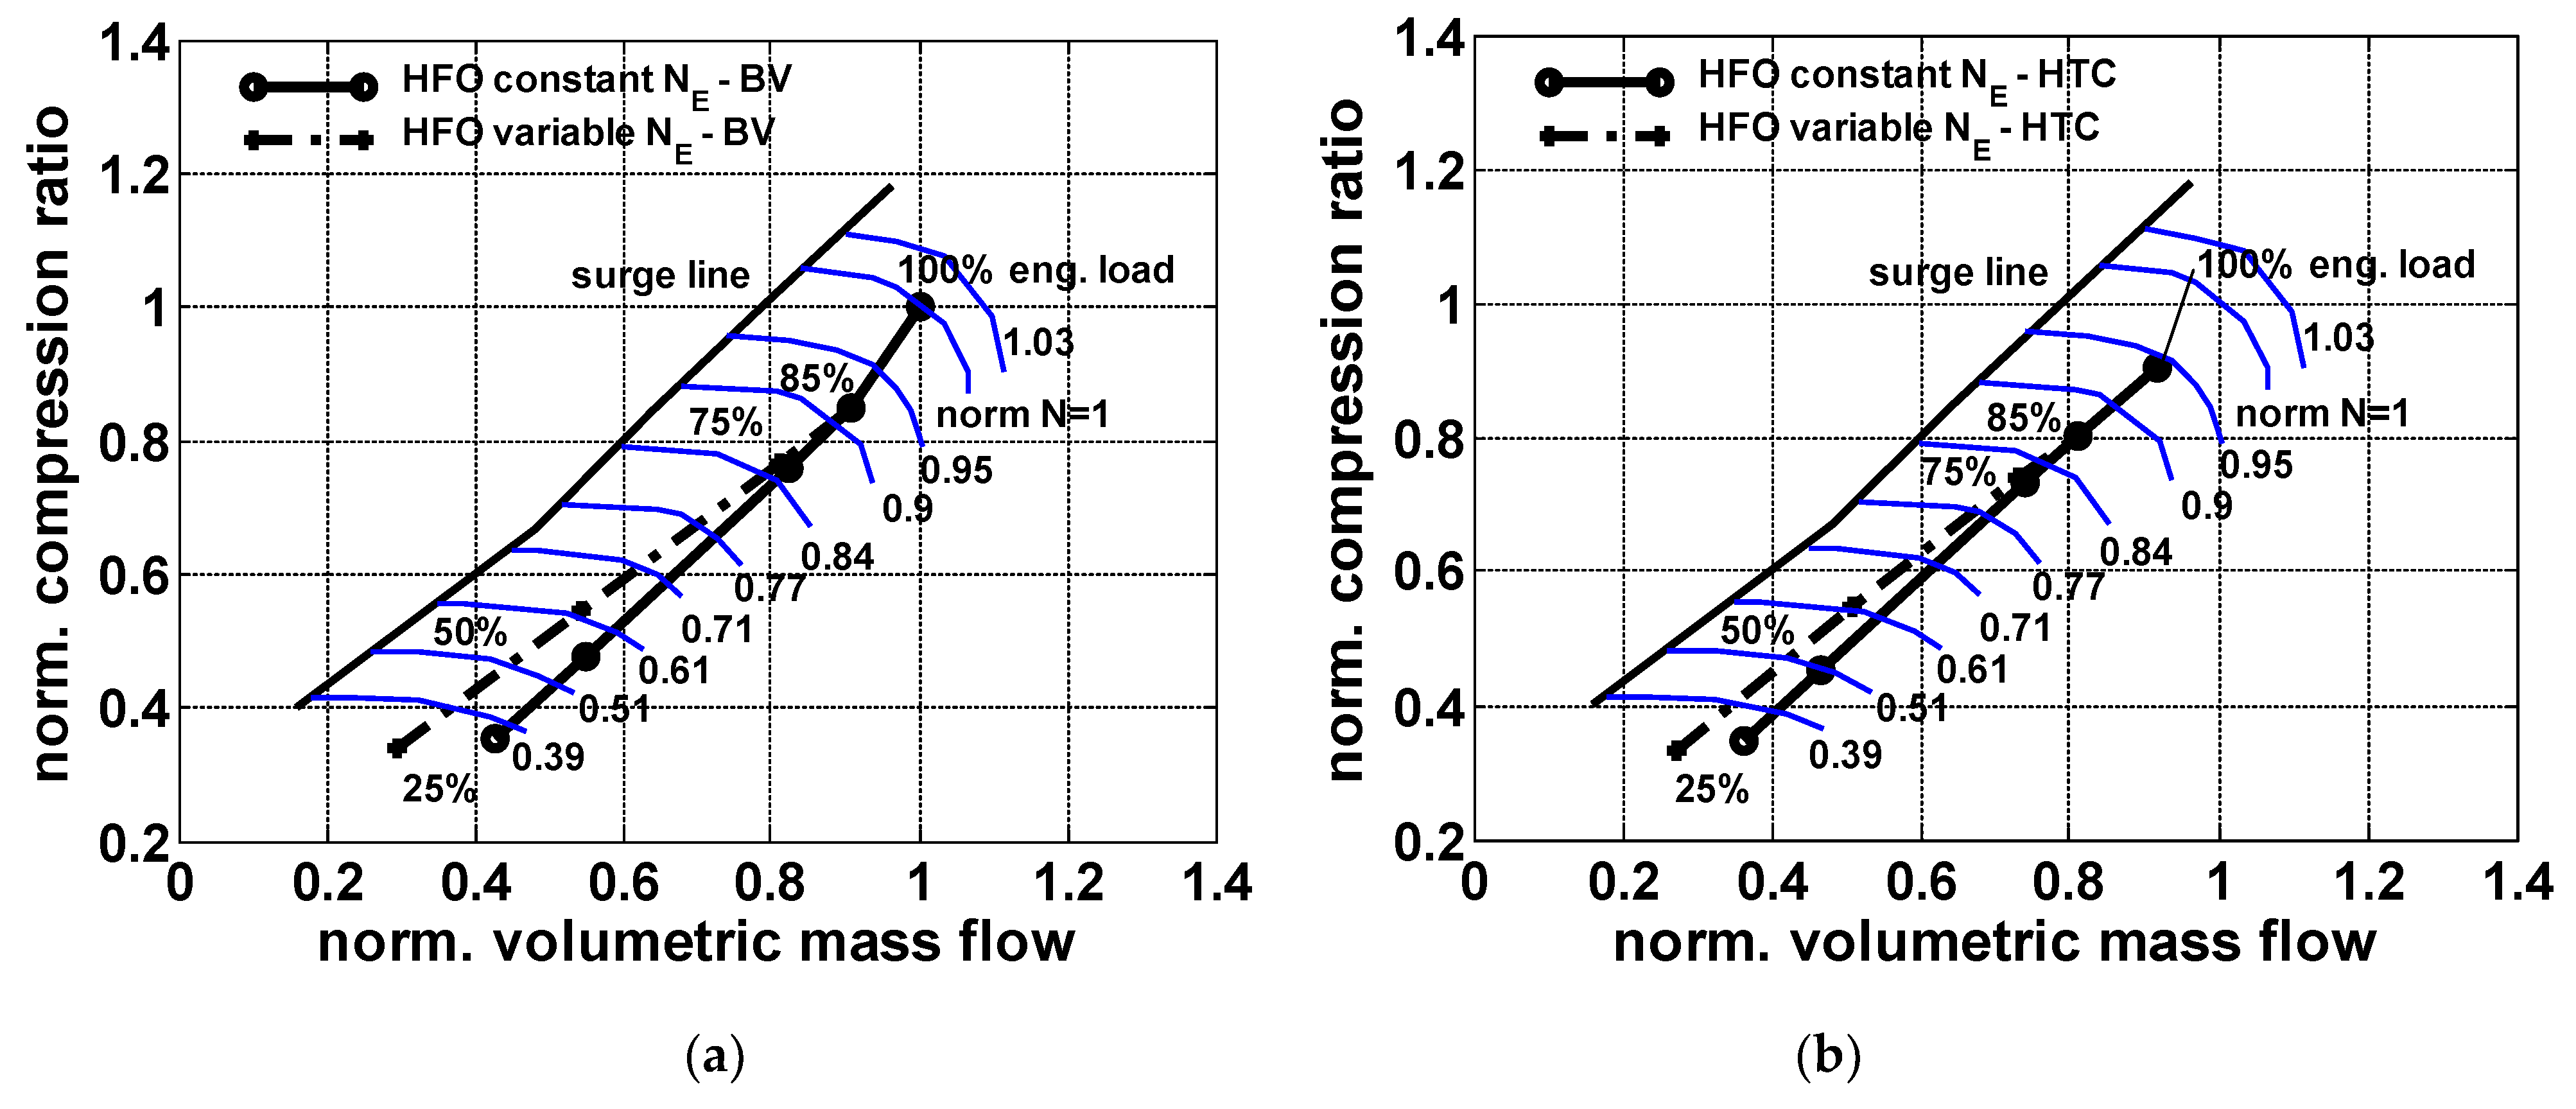
Figure 7 reports the compressor working points for the HFO-powered engine, according to a normalised representation.
In particular, Figure 7a, pertaining to the TC engine configuration, shows the working conditions in the compressor map, for different engine loads (100%, 85%, 75%, 50%, and 25% of the MCR power) at both constant and variable engine speed settings. The comparisons with Figure 7b, concerning the HTC compressor map, show a reduction in the compression ratio, volumetric mass flow, and TC speed in all the engine load conditions. The main reason for these differences is that the whole air mass flow rate is introduced into the HTC engine cylinders, while in the case of the original TC, a part of the airflow is discharged into the environment by the bleed valve (see Figure 1).
The compressor outlet pressure is higher in the TC application, while by using HTC (at the same engine power and speed), the conditions of the flow in the intake manifold (i.e., pressure, temperature) are about the same in the two cases. In fact, with the BV partially opened to control the TC engine, the air pressure in the intake manifold becomes lower than the compressor outlet pressure. This does not occur for the HTC, because in this case, the BV is always closed and the pressure in the intake manifold is practically equal to that of the turbocharger compressor outlet (except for a small pressure loss due to friction). In the engine simulation model, the BV effect on the inlet manifold flow conditions is assessed by the mass and energy dynamic equations [33].
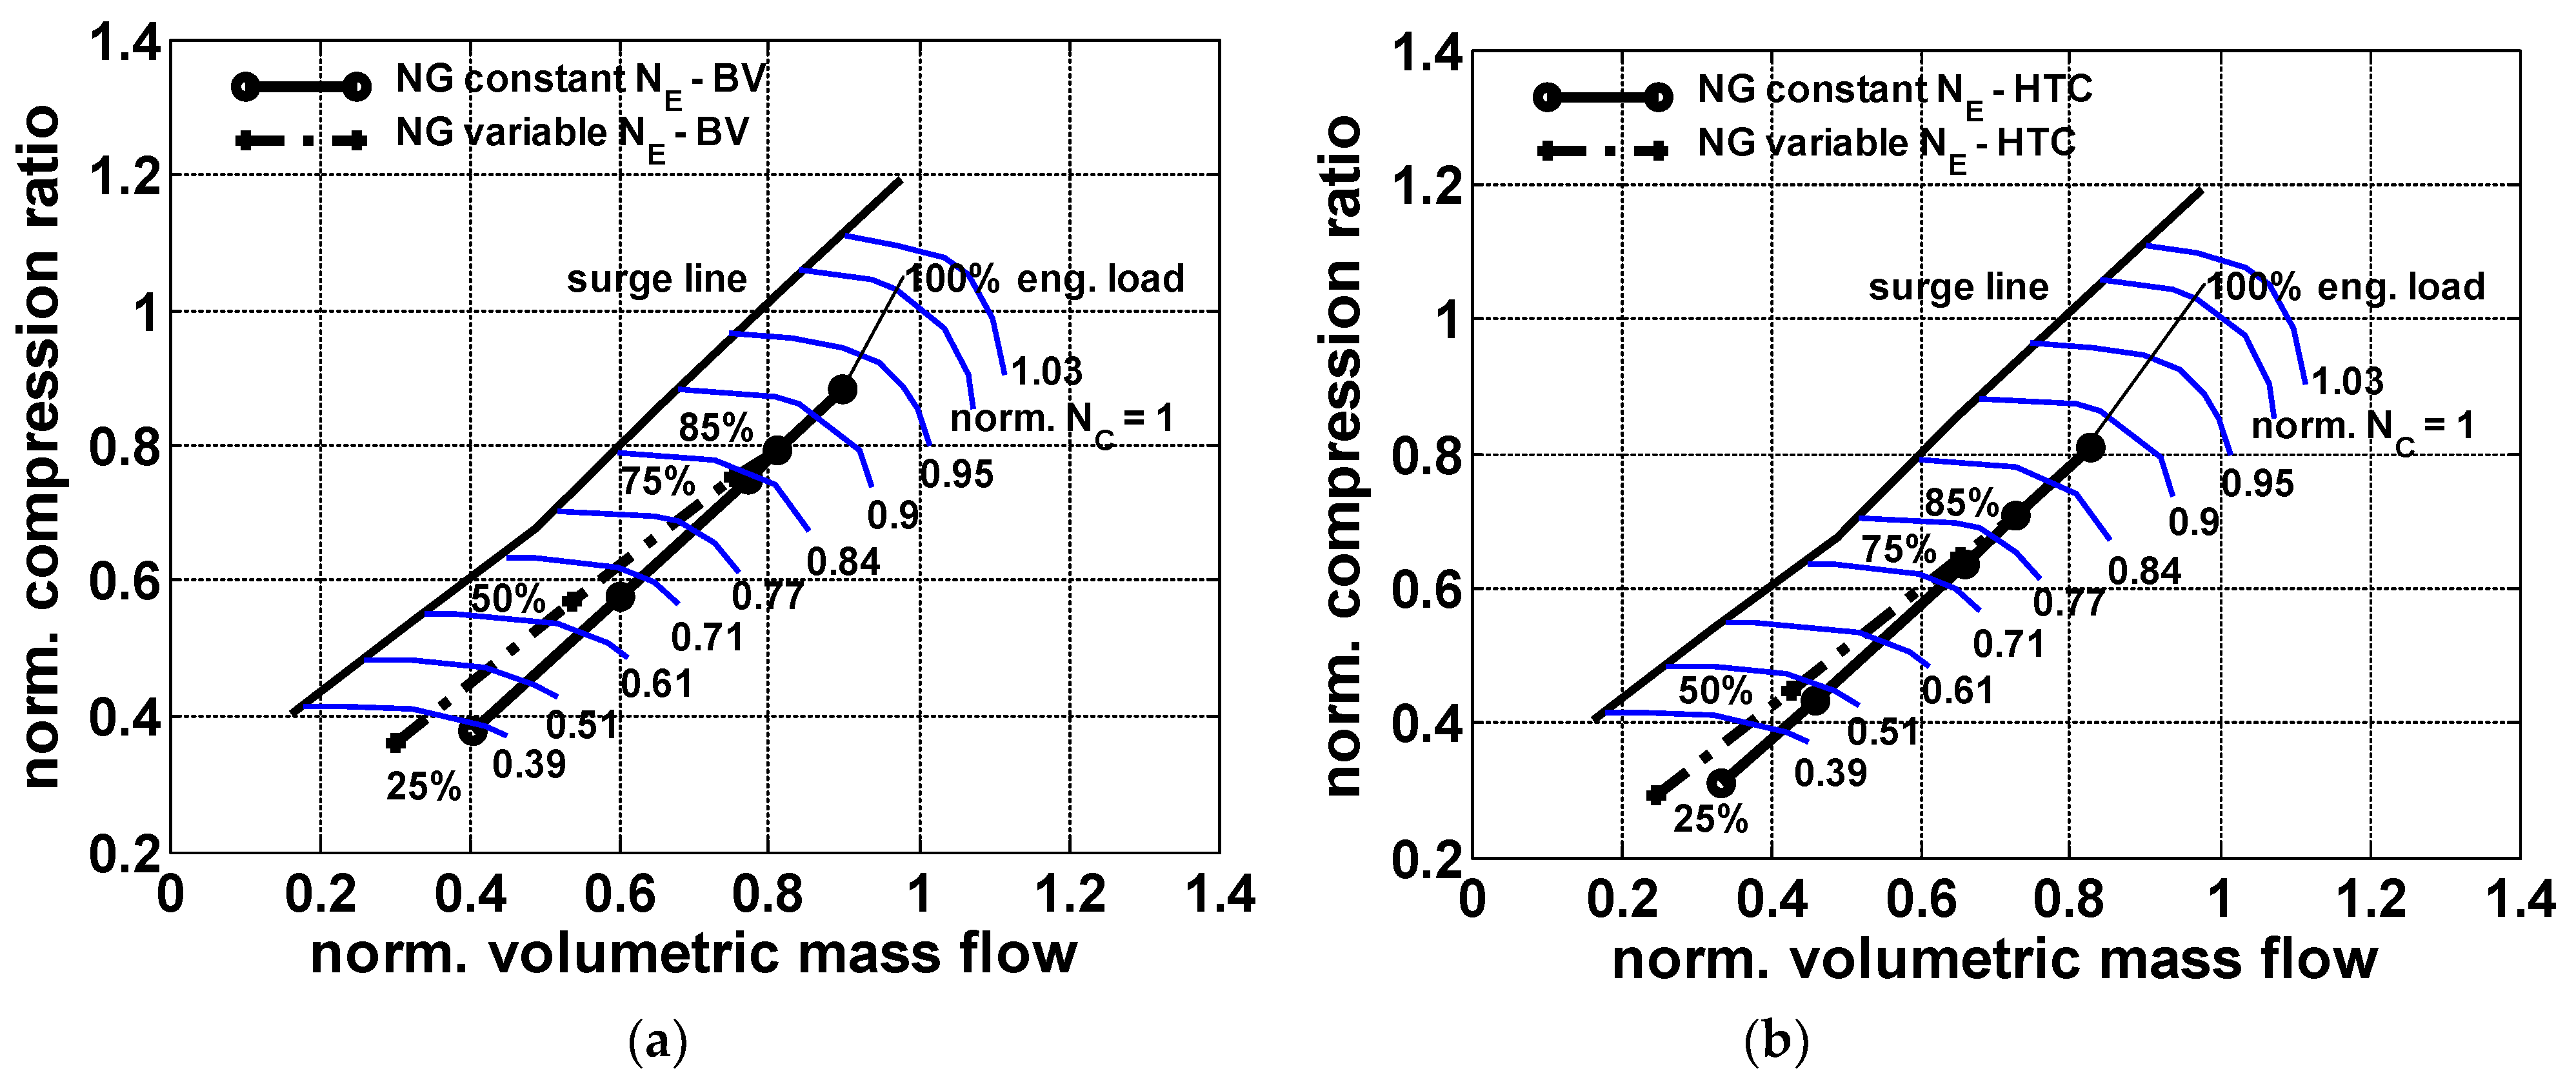
Figure 8a shows again the compressor working points corresponding to the same engine loads and speeds of Figure 7a but for the NG-powered TC engine. For every engine load condition, the comparison shows a reduction in the compression ratio, volumetric mass flow, and TC speed. This difference between the two fuels is mainly due to the same reasons regarding the power recovered by HTC. The comparison between Figure 8a,b, with the latter pertaining to the engine equipped with HTC, shows that similar to the HFO mode and for the same reasons, the HTC for the NG-powered engine also involves a reduction in the compressor compression ratio, volumetric mass flow, and TC speed.
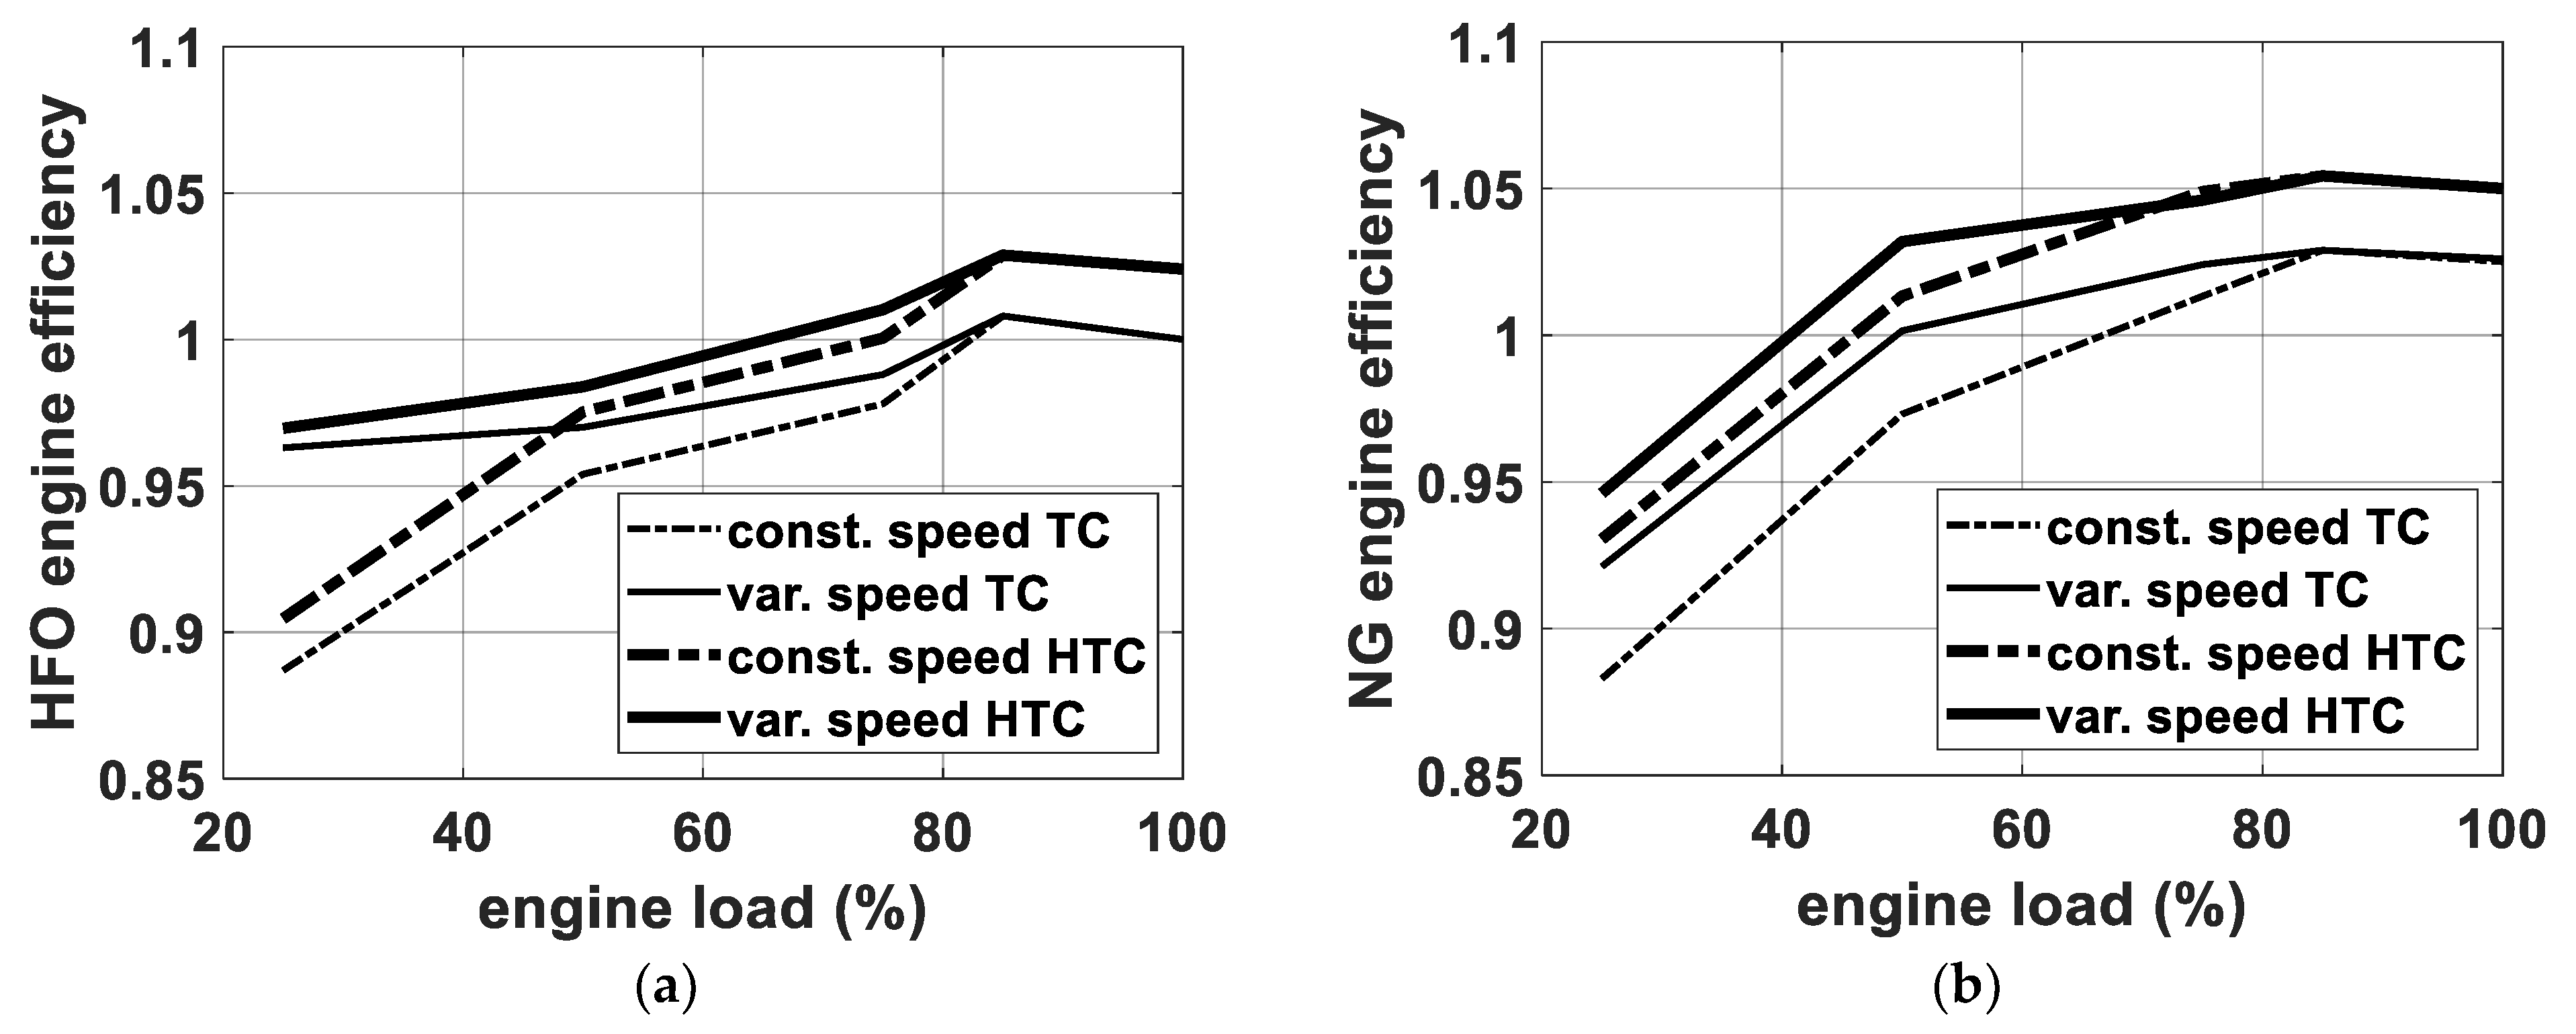
4.2. Turbochargers’ Influence on the Engine Overall Efficiency
Figure 9 reports the normalised engine efficiency versus engine load and working conditions (constant/variable speed) in HFO (Figure 9a) and NG (Figure 9b) engine modes.
The HTC engine efficiency is defined as:
where Pel EM/G is the electric power delivered by the electric motor/generator.
ηE HTC% = ((PE + Pel EM/G)∙100)/(Mf FLHV)
Both Figure 9a,b show that the use of the HTC increases the overall engine efficiency by about 2.5% at high loads (85–100% of the MCR power), in both constant and variable engine speed conditions.
For the HFO-powered engine, Figure 9a shows also that the difference between the efficiency of the HTC engine and TC engine remains about constant; a slight reduction is mainly observed at minimum load (25% of the MCR power) when the engine is running at a constant speed. The reduction in the efficiency difference between TC and HTC is more evident at the variable speed condition, especially at 25% of the engine load; this is due to the strong reduction in the HTC EM/G electric power produced at the low loads, as reported in line 5 of Table 4.
Figure 9b, relating to the NG engine mode, shows the efficiency advantage already observed for all engine loads (25 ÷ 100% of the MCR power), with an increase of up to about 3% at 50% engine load, at variable speed. At constant speed (dash and dot lines in Figure 9b), the efficiency advantage of the HTC engine increases progressively as the engine load decreases, to almost 5% at 25% of the engine load.
This different behaviour of the engine powered by HFO or NG is due to several factors as the VTNA turbocharger for the NG-powered engine (see Figure 5), the different combustion modes, and reference thermodynamic cycles of the two fuels (i.e., Diesel cycle for HFO, Otto for NG). Moreover, the two fuels require different cylinder equivalence ratio values, depending on the engine load (see Figure 6).
5. Conclusions
The present simulation analysis aims to investigate the behaviour of a marine DF engine for distinct turbocharging configurations and fuel modes. The particular engine load control, due to the use of an innovative hybrid turbocharger, combined with a proper combustion control method (depending on whether gas or diesel oil is used), can lead to significant advantages in the system’s overall efficiency and hence should be considered for better power management in ships. To this end, an engine simulator has allowed testing control devices and performance for the examined application. The comparative analysis of the simulation results represents the main purpose of the work, as the shown numerical tables and graphs collect useful information for efficient use of the innovative hybrid system. In this regard, although the HTC use, in comparison with the traditional turbocharger, leads to significant variations of the compressor operating conditions, no relevant changes in the engine hot components (cylinder and TC turbine), and consequently, in the efficiency of the thermodynamic cycle, are present. Again, the mass flow rate of the exhaust gases and their temperature downstream of the turbocharging turbine do not depend on the type of turbocharger used (original TC or HTC). This last aspect could be important because, for example, the turbocharger configuration would not affect the possible installation of WHR steam plants to improve the ship’s energy efficiency further.
Finally, with a view to the development of adequate smart control strategies, it is useful to notice a more significant increase in the overall efficiency of the NG-powered HTC engine, especially at low and medium loads.
Author Contributions
Conceptualization, M.A., U.C., F.B. and L.M.; methodology, M.A., U.C., F.B. and L.M.; software, U.C.; validation, U.C.; investigation, M.A., U.C., F.B. and L.M.; writing—original draft preparation, M.A. and U.C.; writing—review and editing, M.A., F.B. and L.M.; supervision, M.A. All authors have read and agreed to the published version of the manuscript.
Funding
This research received no external funding.
Institutional Review Board Statement
Not applicable.
Informed Consent Statement
Not applicable.
Data Availability Statement
Not applicable.
Acknowledgments
The authors are grateful to MAN Diesel & Turbo and Andrea Rossetto by Ranieri Tonissi S.p.A. Genova (Italy) for their precious cooperation.
Conflicts of Interest
The authors declare no conflict of interest.
Nomenclature
| AFR | Air–fuel ratio |
| AR | Aspect ratio |
| b.m.e.p. | Brake mean effective pressure |
| BV | Bleed valve |
| CI | Compression ignition |
| DF | Dual fuel |
| ECA | Emission control areas |
| EEDI | Energy efficiency design index |
| EM/G | Electric motor/generator |
| FLHV | Fuel lower heating value |
| HFO | Heavy fuel oil |
| HTC | Hybrid turbocharger |
| i.m.e.p | Indicated mean effective pressure |
| IMO | International maritime organisation |
| J | Rotor inertia |
| m or M | Mass |
| MCR | Engine Maximum Continuous Rating |
| NG | Natural gas |
| P | Power |
| PI | Positive ignition |
| Q′ | Torque |
| s.f.c. | Specific fuel consumption |
| T | Temperature |
| TC | Turbocharger |
| V | Volume |
| VTNA | Variable turbine nozzle area |
| WGV | Waste gate valve |
| WHR | Waste heat recovery |
| x | Generic variable |
| xb | Fuel mass burned fraction |
| η | Efficiency |
| ω | Angular speed |
| Subscripts | |
| a | Ambient |
| b | Burned |
| BV | Bleed valve |
| C | Compressor |
| E | Engine |
| el | Electric |
| EM/G | Electric motor/generator |
| f | Fuel |
| HTC | Hybrid turbocharger |
| i | Inlet |
| o | Outlet |
| T | Turbine |
| TC | Turbocharger |
| Symbols | |
| EM/G_cs | Electric motor/generator control signal |
| HFO/NG_f | Engine fuel type |
| HFO/NG_Mf | Cylinder fuel mass flow rate |
| LOAD_s | Engine load signal |
| M_BV | Bleed valve mass flow rate |
| M_C i | Compressor inlet mass flow rate |
| M_cy | Cylinder inlet mass flow rate |
| M_cy o | Cylinder outlet mass flow rate |
| M_T o | Turbocharger turbine outlet mass flow rate |
| N_E | Engine speed |
| N_TC | Turbocharger speed |
| p_C o | Compressor outlet pressure |
| p_cy i | Cylinder inlet pressure |
| p_T i | Turbocharger turbine inlet pressure |
| P_el | Electric motor/generator electric power |
| Q′_C | Turbocharger compressor torque |
| Q′_E o | Engine torque |
| Q′_EM/G | Electric motor/generator torque |
| Q′_T | Turbocharger turbine torque |
| T_C o | Compressor outlet temperature |
| T_cy i | Cylinder inlet temperature |
| T_cy o | Cylinder outlet temperature |
| T_T i | Turbocharger turbine inlet temperature |
| T_T o | Turbocharger turbine outlet temperature |
| VT_c | Cylinder valves timing control signal |
| VTNA_as | Turbocharger variable turbine nozzle area actuator signal |
| VTNA_cs | Turbocharger variable turbine nozzle area control signal |
References
- Fan, A.; Wang, J.; He, Y.; Perčić, M.; Vladimir, N.; Yang, L. Decarbonising inland ship power system: Alternative solution and assessment method. Energy 2021, 226, 120266. [Google Scholar] [CrossRef]
- Marine Environment Protection Committee (MEPC). 66th Session, 31 March to 4 April 2014. Available online: https://www.imo.org/en/MediaCentre/MeetingSummaries/Pages/MEPC66.aspx (accessed on 15 June 2021).
- MEPC (Marine Environment Protection Committee). Guidelines to the Method of Calculation of the Attained Energy Efficiency Design Index (EEDI) for New Ships; Resolution, MECP 212 (63/23), ANNEX 8; MEPC: Abingdon, UK, 2012. [Google Scholar]
- IMO. Energy Efficiency Ship Operation, Module 2—Ship Energy Efficiency Regulation and Related Guidelines; IMO: London, UK, 2016. [Google Scholar]
- Ioannidis, J. Waste heat recovery from Diesel engines. In Proceedings of the 3rd International Congress of International Maritime Association of the East Mediterranean (IMAEM), Athens, Greece, 28 May–1 June 1984. [Google Scholar]
- Ito, K.; Akagi, S. An optimal planning method for a marine heat and power generation plant by considering its operational problem. Energy Res. 2007, 10, 75–85. [Google Scholar] [CrossRef]
- Theotokatos, G.; Livanos, G.A. Exhaust gas waste heat recovery in marine propulsion plants. In Proceedings of the 14th Conference on International Maritime Association of Mediterranean (IMAM), Genova, Italy, 13–16 September 2011. [Google Scholar]
- Byung, C.C.; Young, M.K. Thermodynamic analysis of a dual loop heat recovery system with trilateral cycle applied to exhaust gases of internal combustion engine for propulsion of the 6800 TEU container ship. Energy 2013, 58, 404–416. [Google Scholar]
- Altosole, M.; Benvenuto, G.; Campora, U.; Laviola, M.; Trucco, A. Waste heat recovery from marine gas turbines and diesel engines. Energies 2017, 10, 718. [Google Scholar] [CrossRef] [Green Version]
- Barone, G.; Buonomano, A.; Forzano, C.; Palombo, A.; Vicidomini, M. Sustainable energy design of cruise ships through dynamic simulations: Multi-objective optimization for waste heat recovery. Energy Convers. Manag. 2020, 221, 113166. [Google Scholar] [CrossRef]
- Livanos, G.A.; Theotokatos, G.; Patagonis, D.N. Techno-economical investigation of alternative propulsion plant for ferries and roro ships. Energy Convers. Manag. 2014, 79, 640–651. [Google Scholar] [CrossRef] [Green Version]
- Altosole, M.; Campora, U.; Donnarumma, S.; Zaccone, R. Simulation techniques for design and control of a waste heat recovery system in marine natural gas propulsion applications. J. Mar. Sci. Eng. 2019, 7, 397. [Google Scholar] [CrossRef] [Green Version]
- Altosole, M.; Benvenuto, G.; Zaccone, R.; Campora, U. Comparison of saturated and superheated steam plants for waste-heat recovery of dual-fuel marine engines. Energies 2020, 13, 985. [Google Scholar] [CrossRef] [Green Version]
- Altosole, M.; Benvenuto, G.; Campora, U.; Laviola, M.; Zaccone, R. Simulation and performance comparison between diesel and natural gas engines for marine applications. J. Eng. Marit. Environ. 2017, 231, 690–704. [Google Scholar] [CrossRef]
- Yoshihisa, O.; Keiichi, S.; Yukio, Y. Application of a large hybrid turbocharger for marine electric-power generation. Mitsubishi Heavy Ind. Tech. Rev. 2012, 49, 29. [Google Scholar]
- Keiichi, S.; Yoshihisa, O.; Yukio, Y.; Musashi, S. Energy Savings Through Electric-Assist Turbocharger for Marine Diesel Engines. Mitsubishi Heavy Ind. Tech. Rev. 2015, 52, 36–41. [Google Scholar]
- Alshammari, M.; Alshammari, F.; Pesyridis, A. Electric Boosting and Energy Recovery Systems for Engine Downsizing. Energies 2019, 12, 4636. [Google Scholar] [CrossRef] [Green Version]
- Dong, H.; Zhao, Z.; Fu, J.; Liu, J.; Li, J.; Liang, K.; Zhou, Q. Experiment and simulation investigation on energy management of a gasoline vehicle and hybrid turbocharger optimization based on equivalent consumption minimization strategy. Energy Convers. Manag. 2020, 226, 113518. [Google Scholar] [CrossRef]
- Metz, D.; Werner, J.; Münz, S.; Becker, M. Charging system for fuel cell applications. MTZ Worldw. 2013, 74, 40–43. [Google Scholar] [CrossRef]
- Rusman, J.D. Charge air configurations for propulsion diesel engines aboard fast naval combatants. In Proceedings of the 14th International Naval Engineering Conference & Exhibition (INEC), Glasgow, UK, 2–4 October 2018. [Google Scholar]
- Altosole, M.; Benvenuto, G.; Campora, U.; Silvestro, F.; Terlizzi, G. Efficiency improvement of a natural gas marine engine using a hybrid turbocharger. Energies 2018, 11, 1924. [Google Scholar] [CrossRef] [Green Version]
- Geertsma, R.D.; Negenborn, R.R.; Visser, K.; Hopman, J.J. Design and control of hybrid power and propulsion systems for smart ships: A review of developments. Appl. Energy 2017, 194, 30–54. [Google Scholar] [CrossRef]
- Coppola, T.; Micoli, L.; Turco, M. State of the art of high temperature fuel cells in maritime applications. In Proceedings of the International Symposium on Power Electronics, Electrical Drives, Automation and Motion, Sorrento, Italy, 24–26 June 2020; pp. 430–435. [Google Scholar]
- Sapra, H.; Stam, J.; Reurings, J.; van Biert, L.; van Sluijs, W.; de Vos, P.; Visser, K.; Vellayani, A.P.; Hopman, H. Integration of solid oxide fuel cell and internal combustion engine for maritime applications. Appl. Energy 2021, 281, 115854. [Google Scholar] [CrossRef]
- Geertsma, R.D.; Negenborn, R.R.; Visser, K.; Hopman, J.J. Parallel Control for Hybrid Propulsion of Multifunction Ships. IFAC-Pap. Line 2017, 50, 2296–2303. [Google Scholar] [CrossRef]
- Capasso, C.; Veneri, O.; Notti, E.; Sala, A.; Figari, M.; Martelli, M. Preliminary design of the hybrid propulsion architecture for the research vessel “G. Dallaporta”. In Proceedings of the International Conference on Electrical Systems for Aircraft, Railway, Ship Propulsion and Road Vehicles & International Transportation Electrification Conference, Toulouse, France, 2–4 November 2016. [Google Scholar]
- Altosole, M.; Campora, U.; Vigna, V. Energy efficiency analysis of a flexible marine hybrid propulsion system. In Proceedings of the International Symposium on Power Electronics, Electrical Drives, Automation and Motion, Sorrento, Italy, 24–26 June 2020; pp. 436–441. [Google Scholar]
- Mauro, F.; Ghigliossi, E.; Bucci, V.; Marinó, A. Design of hybrid-electric megayachts: The impact of operative profile and smart berthing infrastructures. J. Mar. Sci. Eng. 2021, 9, 186. [Google Scholar] [CrossRef]
- Feneley, A.J.; Pesiridis, A.; Andwari, A.M. Variable Geometry Turbocharger Technologies for Exhaust Energy Recovery and boosting-A Review. Renew. Sustain. Energy Rev. 2017, 71, 959–975. [Google Scholar] [CrossRef]
- Woodyard, D. Pounder’s Marine Diesel Engines and Gas, 9th ed.; Elsevier Ltd.: Oxford, UK, 2009. [Google Scholar]
- MAN 51/60 DF IMO TIER II/IMO TIER III Marine Project Guide; MAN: Munich, Germany, 2015.
- Benvenuto, G.; Campora, U.; Laviola, M.; Terlizzi, G. Simulation model of a dual-fuel four stroke engine for low emission ship propulsion applications. Int. Rev. Mech. Eng. 2017, 11, 817–882. [Google Scholar] [CrossRef]
- Benvenuto, G.; Campora, U.; Carrera, G.; Casoli, P. A two-zone Diesel engine model for the simulation of marine propulsion plant transients. In Proceedings of the MARIND 98, Second International Conference on Marine Industry, Varna, Bulgaria, 28 September–2 October 1998. [Google Scholar]
- Theotokatos, G.; Stoumpos, S.; Lazakis, I.; Livanos, G. Numerical study of a marine dual-fuel four-stroke engine. Marit. Technol. Eng. 3 2016, 2, 777–786. [Google Scholar]
- Tadros, M.; Ventura, M.; Guedes Soares, C. Data driven in-cylinder pressure diagram based optimization procedure. J. Mar. Sci. Eng. 2020, 8, 294. [Google Scholar] [CrossRef] [Green Version]
- Mrzljak, V.; Medica, V.; Bukovac, O. Quasi-dimensional diesel engine model with direct calculation of cylinder temperature and pressure. Technical Gazette 2017, 24, 681–686. [Google Scholar]
- Altosole, M.; Campora, U.; Figari, M.; Laviola, M.; Martelli, M. A diesel engine modelling approach for ship propulsion real-time simulators. J. Mar. Sci. Eng. 2019, 7, 138. [Google Scholar] [CrossRef] [Green Version]
- Tavakoli, S.; Saettone, S.; Steen, S.; Andersen, P.; Schramm, J.; Pedersen, E. Modeling and analysis of performance and emissions of marine lean-burn natural gas engine propulsion in waves. Appl. Energy 2020, 279, 115904. [Google Scholar] [CrossRef]
- Tadros, M.; Ventura, M.; Guedes Soares, C. Simulation of the performance of marine genset based on double-wiebe function. Sustainable Development and Innovations in Marine Technologies. In Proceedings of the 18th International Congress of the International Maritime Association of the Mediterranean, IMAM, Varna, Bulgaria, 9–11 September 2019; pp. 292–299. [Google Scholar]
- MAN. VTA—Variable Turbine Area. MAN Diesel & Turbo Report; MAN: Munich, Germany, 2010. [Google Scholar]
Figure 1.
Engine equipment scheme in HTC configuration.

Figure 2.
HTC engine simulator in Simulink environment [21].
Figure 2.
HTC engine simulator in Simulink environment [21].

Figure 3.
Typical VTNA turbine performance map.

Figure 4.
Comparison between calculated and reference efficiencies (normalised with respect to the HFO-powered TC engine) in diesel fuel mode (a) or gas mode (b).
Figure 4.
Comparison between calculated and reference efficiencies (normalised with respect to the HFO-powered TC engine) in diesel fuel mode (a) or gas mode (b).

Figure 5.
VTNA turbocharger efficiency comparison between simulation and reference data.

Figure 6.
Cylinder equivalence ratio for different fuel types and engine speed conditions.

Figure 7.
Working points in the compressor map for the HFO-powered engine, with original TC (a) and HTC (b), at constant and variable engine speeds NE.
Figure 7.
Working points in the compressor map for the HFO-powered engine, with original TC (a) and HTC (b), at constant and variable engine speeds NE.

Figure 8.
Working points in the compressor map for the NG-powered engine, equipped with original TC (a) and HTC (b), at constant and variable engine speeds NE.
Figure 8.
Working points in the compressor map for the NG-powered engine, equipped with original TC (a) and HTC (b), at constant and variable engine speeds NE.

Figure 9.
Normalised efficiency of the engine powered by HFO (a) and NG (b) for TC/HTC engine conditions (constant/variable speed).
Figure 9.
Normalised efficiency of the engine powered by HFO (a) and NG (b) for TC/HTC engine conditions (constant/variable speed).


Table 1.
Engine dimensions and design data [21].
Table 1.
Engine dimensions and design data [21].
| MAN 51-60 DF 12V | HFO/NG |
|---|---|
| engine length (mm) | 10,254 |
| height (mm) | 5517 |
| width (mm) | 4713 |
| dry weight (t) | 189 |
| cylinders number | 12V |
| bore (mm) | 510 |
| stroke (mm) | 600 |
| fuel type | HFO/NG |
| brake power (kW) | 12,000 |
| speed (rpm) | 514 |
| b.m.e.p. (bar) | 19.1 |
| s.f.c. (g/kWh) | 189/157 |
| charge air pressure (barg) | 4.29/3.77 |
Table 2.
Errors (%) comparison between reference data and simulation.
| Delivered Engine Power | Results at Constant Engine Speed (514 rpm): Without Brackets | |||||||||
|---|---|---|---|---|---|---|---|---|---|---|
| Results at Variable Engine Speed: In Brackets [ ] | ||||||||||
| % (rpm) | s.f.c | Co Air Mass Flow | Charge Air pr. | Co Temp. | To Temp. | |||||
| HFO | NG | HFO | NG | HFO | NG | HFO | NG | HFO | NG | |
| 100 (514 rpm) | 0.21 | 0.49 | 0.06 | 0.32 | 0.12 | −0.23 | 1.37 | 0.46 | 0.00 | 1.05 |
| [0.17] | [0.36] | [−0.11] | [0.21] | [0.08] | [0.07] | [−0.56] | [0.18] | [−0.32] | [0.82] | |
| 85 (514 rpm) | −0.79 | −0.57 | −2.18 | 0.78 | −0.48 | 1.02 | −1.03 | 0.01 | 1.23 | 1.36 |
| [−0.65] | [−0.46] | [1.82] | [0.85] | [−0.36] | [0.74] | [1.08] | [0.02] | [1.15] | [0.93] | |
| 75 (501 rpm) | 0.29 | −0.45 | −0.97 | −1.52 | −1.97 | 2.21 | −1.23 | 0.00 | 0.87 | 1.39 |
| [−0.31] | [−0.48] | [−0.45] | [−1.08] | [−2.04] | [1.51] | [1.74] | [0.02] | [−1.06] | [1.78] | |
| 50 (442 rpm) | −0.19 | 0.24 | 0.31 | −0.65 | −1.21 | 1.52 | −1.42 | 1.38 | −2.11 | 2.42 |
| [0.43] | (0.71] | [−0.19] | [−1.02] | [−0.84] | [1.03] | [1.05] | [1.53] | [−1.73] | [1.67] | |
| 25 (402 rpm) | −1.01 | −0.34 | _ | _ | _ | _ | _ | _ | _ | _ |
| [−0.67] | [−0.43] | |||||||||
Table 3.
TC and HTC comparison for different fuels and engine working points at constant speed.
| Line | Engine Parameters | Engine Loads and Fuel Type | |||||||||
|---|---|---|---|---|---|---|---|---|---|---|---|
| 1 | Engine power (%) | 100 | 85 | 75 | 50 | 25 | |||||
| 2 | Engine power (kW) | 12,000 | 10,260 | 9000 | 6000 | 3000 | |||||
| 3 | Engine speed (rpm) | 514 | 514 | 514 | 514 | 514 | |||||
| 4 | Fuel type | HFO | NG | HFO | NG | HFO | NG | HFO | NG | HFO | NG |
| 5 | EM/G electric power (kW) | 526 | 498 | 426 | 551 | 320 | 671 | 203 | 562 | 87 | 351 |
| 6 | EM/G electric power (%) | 4.38 | 4.15 | 4.15 | 5.37 | 3.55 | 7.45 | 3.38 | 9.37 | 2.91 | 11.70 |
| 7 | Turbocharger speed (Δ%) | −5.29 | −4.86 | −5.81 | −7.51 | −4.88 | −10.97 | −11.31 | −28.41 | −10.52 | −23.68 |
| 8 | Air compression ratio (Δ%) | −9.73 | −7.70 | −5.72 | −10.95 | −3.64 | −15.15 | −5.34 | −24.79 | −1.37 | −17.69 |
| 9 | Compressor temperature (Δ%) | −3.26 | −3.85 | −2.84 | −4.44 | −2.09 | −5.46 | −3.13 | −6.52 | −1.43 | −6.89 |
| 10 | Compressor air flow rate (Δ%) | −8.19 | −7.70 | −10.53 | −10.31 | −10.03 | −14.47 | −15.23 | −22.70 | −14.68 | −16.95 |
| 11 | Compressor efficiency (Δ%) | 2.09 | −0.12 | 1.65 | 0.65 | 1.86 | 1.60 | 1.21 | 0.97 | 2.68 | 1.06 |
| 12 | Cylinder air flow rate (Δ%) | 0.06 | 0.01 | −0.18 | −0.01 | −0.31 | 0.01 | 0.03 | 0.01 | 0.08 | 0.01 |
| 13 | Cylinder air temperature (Δ%) | −0.29 | −0.51 | −0.25 | −0.68 | −0.23 | −0.61 | −0.06 | −0.29 | −0.07 | −0.79 |
| 14 | Cylinder exhaust gas flow (Δ%) | 0.06 | 0.01 | −0.18 | 0.02 | −0.32 | 0.01 | 0.04 | 0.02 | 0.08 | 0.02 |
| 15 | Turbine expansion ratio (Δ%) | −0.03 | 0.22 | −0.51 | 1.17 | −0.24 | 0.58 | −0.17 | 2.62 | −0.15 | 5.42 |
| 16 | Turbine inlet pressure (Δ%) | −0.03 | 0.21 | −0.18 | 0.39 | −0.28 | 0.61 | −0.22 | 0.25 | 0.07 | 0.32 |
| 17 | Turbine inlet temperature (Δ%) | −0.11 | −0.12 | 0.10 | −0.17 | 0.18 | −0.34 | −0.07 | −0.21 | −0.06 | −0.58 |
| 18 | Turbine outlet temperature (Δ%) | −0.10 | −0.11 | 0.13 | −0.14 | −0.21 | −0.27 | −0.01 | −0.10 | −0.05 | −0.24 |
| 19 | Turbine efficiency (Δ%) | 0.00 | 0.00 | 0.00 | 0.01 | 0.01 | 0.01 | −0.01 | −0.01 | −0.01 | 0.01 |
| 20 | Engine i.m.e.p. (Δ%) | 0.02 | −0.02 | −0.01 | −0.02 | −0.01 | −0.03 | 0.03 | −0.01 | 0.00 | −0.02 |
Table 4.
TC and HTC comparison for different fuels and engine working points at variable speeds.
| Line | Engine Parameters | Engine Loads and Fuel Type | |||||||||
|---|---|---|---|---|---|---|---|---|---|---|---|
| 1 | Engine power (%) | 100 | 85 | 75 | 50 | 25 | |||||
| 2 | Engine power (kW) | 12,000 | 10,260 | 9000 | 6000 | 3000 | |||||
| 3 | Engine speed (rpm) | 514 | 514 | 501 | 462 | 402 | |||||
| 4 | Fuel type | HFO | NG | HFO | NG | HFO | NG | HFO | NG | HFO | NG |
| 5 | EM/G electric power (kW) | 526 | 498 | 426 | 551 | 293 | 571 | 98 | 576 | 27 | 226 |
| 6 | EM/G electric power (%) | 4.38 | 4.15 | 4.15 | 5.37 | 3.25 | 6.34 | 1.63 | 9.60 | 0.90 | 7.53 |
| 7 | Turbocharger speed (Δ%) | −5.29 | −4.86 | −5.81 | −7.51 | −3.59 | −11.85 | −22.21 | −29.12 | −17.15 | −21.36 |
| 8 | Air compression ratio (Δ%) | −9.73 | −8.19 | −5.72 | −10.95 | −3.84 | −14.11 | −3.17 | −21.69 | −1.15 | −18.68 |
| 9 | Compressor temperature (Δ%) | −3.26 | −3.85 | −2.84 | −4.44 | −1.92 | −5.46 | −1.23 | −6.52 | −0.61 | −6.89 |
| 10 | Compressor airflow rate (Δ%) | −8.19 | −7.70 | −10.53 | −10.31 | −7.41 | −13.27 | −7.34 | −20.66 | −6.89 | −17.95 |
| 11 | Compressor efficiency (Δ%) | 2.09 | 0.12 | 1.65 | 0.65 | 2.21 | 1.71 | 2.44 | 1.29 | 1.09 | 2.02 |
| 12 | Cylinder airflow rate (Δ%) | 0.06 | 0.01 | −0.18 | 0.02 | 0.24 | 0.01 | −019 | −0.01 | −0.23 | 0.01 |
| 13 | Cylinder air temperature (Δ%) | −0.29 | −0.55 | −0.25 | −0.63 | −0.19 | −0.59 | −0.14 | −0.43 | −0.02 | −0.66 |
| 14 | Cylinder exhaust gas flow (Δ%) | 0.06 | 0.01 | −0.18 | −0.01 | 0.23 | 0.01 | −0.20 | −0.01 | −0.23 | 0.02 |
| 15 | Turbine expansion ratio (Δ%) | −0.03 | 0.21 | −0.51 | 1.18 | −0.49 | 0.58 | −0.22 | 2.43 | 0.00 | 3.29 |
| 16 | Turbine inlet pressure (Δ%) | −0.03 | 0.22 | −0.18 | 0.16 | −0.04 | 0.53 | −0.17 | 0.34 | −0.08 | 0.27 |
| 17 | Turbine inlet temperature (Δ%) | −0.11 | −0.14 | 0.10 | −0.16 | −0.23 | −0.39 | 0.08 | −0.26 | 0.12 | −0.45 |
| 18 | Turbine outlet temperature (Δ%) | −0.10 | −0.11 | 0.13 | −0.14 | −0.19 | 0.26 | 0.11 | 0.15 | 0−09 | −0.33 |
| 19 | Turbine efficiency (Δ%) | 0.00 | 0.00 | 0.00 | −0.01 | 0.00 | 0.00 | 0.01 | 0.01 | −0.01 | 0.01 |
| 20 | Engine i.m.e.p. (Δ%) | 0.02 | −0.01 | −0.01 | −0.03 | −0.04 | −0.01 | −0.02 | −0.02 | −0.03 | −0.02 |
Publisher’s Note: MDPI stays neutral with regard to jurisdictional claims in published maps and institutional affiliations. |
© 2021 by the authors. Licensee MDPI, Basel, Switzerland. This article is an open access article distributed under the terms and conditions of the Creative Commons Attribution (CC BY) license (https://creativecommons.org/licenses/by/4.0/).
Share and Cite
MDPI and ACS Style
Altosole, M.; Balsamo, F.; Campora, U.; Mocerino, L. Marine Dual-Fuel Engines Power Smart Management by Hybrid Turbocharging Systems. J. Mar. Sci. Eng. 2021, 9, 663. https://doi.org/10.3390/jmse9060663
AMA Style
Altosole M, Balsamo F, Campora U, Mocerino L. Marine Dual-Fuel Engines Power Smart Management by Hybrid Turbocharging Systems. Journal of Marine Science and Engineering. 2021; 9(6):663. https://doi.org/10.3390/jmse9060663
Chicago/Turabian StyleAltosole, Marco, Flavio Balsamo, Ugo Campora, and Luigia Mocerino. 2021. "Marine Dual-Fuel Engines Power Smart Management by Hybrid Turbocharging Systems" Journal of Marine Science and Engineering 9, no. 6: 663. https://doi.org/10.3390/jmse9060663
Note that from the first issue of 2016, this journal uses article numbers instead of page numbers. See further details here.