Article

Diversity of Epiphytic Bacterial Communities Associated with Adriatic Fucacean Species Phycosphere

1
Ruđer Bošković Institute, Ulica Giordana Paliage 5, 52210 Rovinj, Croatia
2
Ministry of Economy and Sustainable Development, Ulica gradaVukovara 220, 10 000 Zagreb, Croatia
3
Faculty of Natural Sciences, Juraj Dobrila University of Pula, Zagrebačka 30, 52 100 Pula, Croatia
*
Author to whom correspondence should be addressed.
J. Mar. Sci. Eng. 2020, 8(12), 967; https://doi.org/10.3390/jmse8120967
Submission received: 19 October 2020 / Revised: 16 November 2020 / Accepted: 20 November 2020 / Published: 26 November 2020
(This article belongs to the Special Issue Biocomplexity and Microbial Diversity in a Marine System)

Abstract

:
The aim of the study was to explore the relationship between membrane-regulating functional lipids of three fucacean species and their associated epiphytic bacterial communities. The analyzed algae Treptacantha barbata, Carpodesmia crinita and Cystoseira compressa, formerly classified under the Cystoseira genus, are indigenous to the Adriatic Sea. The thalli of sampled Fucales species were divided into perennial and annual parts. T. barbata and C. crinita show high contents of mono- and polyunsaturated fatty acids but, however, show a clear distinction between branches, cauloids and apical parts. Along with the highest unsaturation degree (4.32), the C. crinita branches and apical parts demonstrated high proportion of both C18 and C20 polyunsaturated fatty acids, with eicosapentaenoic (C20:5 n-3) and arachidonic (C20:4 n-6) fatty acids up to 5.46% and 13.82%, respectively. The highest proportion of saturated fatty acids was found in thalli of C. compressa, particularly on cauloids and old branches (≥90%). The similarity profile routine analysis of fatty acids and microbial community structure has shown clear separation of the cauloids and apical parts from the branches of C. crinita and T. barbata. Based on the nonmetric multidimensional scaling analysis several representatives of the Gammaproteobacteria class, identified as Vibrionales (Vibrio), Cellvibrionales and Xanthomonadales, which contributed strongly to the separation of T. barbata apical parts and branches, C. compressa receptacles and C. crinita branches from the T. barbata cauloids and C. crinita apical parts and cauloids. The highest richness in polyunsaturated fatty acids, in particular C18:3(n-3), C20:4(n-6) and C20:5(n-3), was observed on branches, accompanied by a distinctive epiphytic microbial structure dominated by numerous representatives with potentially beneficial biological activity. The results showed a strong relationship between fatty acid profiles of the analyzed species and phycosphere community structure, underlining the host physiological condition in shaping the biological interactions and maintaining a healthy microbiome, as well as compiling the ecophysiological and molecular research in order to better assess the resilience of the ecosystem.

1. Introduction

Brown macroalgae play a major ecological role in sustaining complex food webs and maintaining high biodiversity in the Adriatic Sea [1]. Many of the species are protected under various EU conventions and directives, and although dominant on coastal rocky substrates of the Adriatic, studies on their ecology are rare. Differences are noticed in the tolerance of diverse fucacean species to pollution, attributing different resilience mechanisms to the brown algae. Because of the low recovering capacity, fucacean species are considered good indicators of decreases in water quality, and of overall threats to biodiversity, such as: habitat degradation, pollution, eutrophication and climate change [2,3].
Macroalgae interact with the surrounding environment through their surface, which is colonized by epiphytic bacteria. These bacteria are characterized by abilities of fast colonization, quick metabolic response to algal exudates and adaptation to environmental variations. One major role of the bacterial epiphytic community on macroalgae surfaces is the regulation of further colonization by macrofoulers. Previous studies have demonstrated that epiphytic bacteria on marine algae, in particular Fucales [4,5], differ significantly from bacterial communities on abiotic surfaces and in the surrounding water [6] and that the anti-fouling activity of secondary metabolites in macroalgae and their biofilms are species specific [7]. These findings support the hypothesis that the brown algae use biochemical defense mechanisms in control the fouling processes through the selection of beneficial bacteria in the biofilm, however, there is still very little knowledge about the diversity, degree of host specificity, functional role or the molecular mechanisms of host–microbe interactions in marine systems. A massive decline of fucacean “Cystoseira” forests in the Mediterranean Sea has been noticed following eutrophycation dynamics, with a very diverse species-specific recovery capacity [2,8,9]. Among the fucacean species analyzed in the Adriatic, the highest quantitative and qualitative richness of epifloral as well as epifaunal species is harbored by Cystoseira barbata, contrary to Cystoseira crinita (later renamed to Treptacantha barbata and Carpodesmia crinita, respectively) and Cystoseira compressa [10]. In addition to the species ecology and the vegetative cycling that significantly influence species resilience to the climate and anthropogenic stress and recovery, positive species interactions in the phycosphere can act as a first defense barrier against temperature rises, pH declines or pathogenicity [11,12].
Molecular mechanisms of biofilm formation and biofouling on macroalgae are mediated by chemical compounds originating from the macroalgal extracellular matrix (proteins, glycoproteins, nucleic acids, polysaccharides, lipids [13]). Most of the bioactive compounds obtained from red and brown marine macroalgae (>1500), known as defensive metabolites against the settlement of barnacles and diatoms [14], belong to the alkaloid and terpenoid subclasses of lipids. Fatty acids, as the membrane constitutive molecules responsible for the control of the desired membrane fluidity, play a key role in physiological adaptations to altered environmental conditions. In line with that, the polyunsaturated fatty acids (PUFAs) are believed to play an important regulatory role in macroalgal defense [15,16,17] and are expected to be negatively affected by climate change [18]. The initial recognition of the pathogen in the phycosphere and immune signaling pathways that involve PUFAs and oxylipins (e.g., stress hormones methyl-jasmonate, arachidonic acid, linolenic acid and prostaglandins) [18] can also be compromised by temperature pressure. Since Cystoseira compressa and Treptacantha barbata are known for richness of PUFAs [19], we hypothesize that PUFAs play a key role in the control of phycosphere colonization and can serve as bioindicators of fucacean response to the disturbance in microbial biofilms and an early sign of pathogenic process development.
Little is known about how the microbial community structure of macroalgal holobionts is affected by its hosts’ physiological conditions, and in particular by the structural lipid composition. In this study, the lipid composition and microbial phycosphere diversity of Treptacantha barbata, Carpodesmia crinita and Cystoseira compressa were explored. The aim of the study was to explore the relationship between the membrane-regulating functional lipids of the fucacean species and their associated epiphytic bacterial communities. The epiphytic microflora of Adriatic indigenous algae was tentatively associated with their biochemical richness. The obtained results significantly upgrade the existing datasets on microbial biodiversity of the fucacean phycosphere and our knowledge about its relationship with the membrane-regulating functional lipids involved in biochemical defense mechanisms.

2. Materials and Methods

2.1. Biological Sampling

Three fucacean species (Fucales, Heterokontophyta): Treptacantha barbata, Carpodesmia crinita and Cystoseira compressa, were sampled from April to May in coastal waters of Croatia in the northern Adriatic Sea. Within each site, five thalli for each of the three species were randomly chosen and detached from substrata by a hammer and chisel. Algae were washed with filtered (0.2 µm polycarbonate filter membranes (PC), Whatman, Germany) and autoclaved seawater (FSW). Rinsed thalli were collected into the sterile polyethylene bags and transported to the lab in cooling boxes. In the laboratory, each sample was carefully sorted and cleaned of epiphytes, small invertebrates and sand particles. Thalli of sampled fucacean species were divided into perennial parts (cauloid, apical parts) and annual parts (branches, receptacles). Material for lipid analyses was dried, weighed, ground and stored at −80 °C before analysis. Ten grams of fresh material for epiphytic bacterial DNA analysis was placed into 100 mL of FSW with the addition of 10 mM EDTA and processed as described by Burke et al. [20].

2.2. Lipid Content and Fatty Acid Composition of Fucales

A quantity of 2 g of dry Fucales material (in triplicates) was ground and extracted. Lipids were extracted by ultrasonication with dichloromethane (DCM): methanol (MeOH) (2:1). The residue was reextracted two to three times with DCM/MeOH (2:1). Combined extracts were filtered and mixed with DCM and deH2O for phase separation. The DCM phases were purified by adding NaCl into solution and then evaporated to dryness using rotary evaporation at 30 °C [21] and the total lipid content was determined gravimetrically.
For fatty acid methyl esters (FAMEs), determination lipid extracts were saponified following the addition of 1.2 M NaOH in 50% aqueous methanol solution. The tubes were placed in a boiling water bath for 30 min. After cooling, the saponificate was acidified with 6 M HCl (pH-2), and 12% BF3 in methanol was added and heated for 10 min in a boiling water bath. After cooling, FAMEs were extracted in DCM and analyzed by gas-liquid chromatography (GC/MS) on a 6890N Network GC System (Wilmington, DE, USA) equipped with a 5973 Network Mass Selective Detector (Wilmington, DE, USA) with a capillary column (30 m × 0.25 mm × 0.25 μm; cross linked 5% phenyl-methyl-polysiloxane) and ultra-high purity helium as the carrier gas. The GC/MS settings were as follows: programmed column temperature 145 °C by 4 °C/min up to 270 °C and constant column pressure 2.17 kPa. Retention times, peak areas and mass spectra were recorded on ChemStation (Palo Alto, CA, USA) software. FAMEs in algae samples were identified by mass spectral data and a family plot of equivalent chain length (ECL) data for GC standards for the GC column used. Fatty acid methyl ester mix C18-C20, C4-C24, bacterial fatty acid (BAME) mix, polyunsaturated fatty acid standards (PUFA1 and PUFA3; Supelco, Bellefonte, PA, USA), cod liver oil and various individual pure standards of fatty acid methyl esters (Sigma, Steinheim, Germany) were used.

2.3. Bacterial Identification and Phycosphere Community Structure Determination

Extraction of microbial community DNA from detached biofilm material was performed with the Powerfilm DNA Extraction Kit (MoBio, USA) following the manufacturer’s instructions. The DNA was dissolved in Tris-EDTA (TE) buffer and stored at −20 °C for later analysis. The integrity of the DNA was assessed by electrophoresis in 1% agarose gels and viewed with a UV transilluminator. The concentration and purity of the DNA were determined by measuring absorbance at a 260/280 nm ratio using a NanoDrop. The DNA was later used as a template for PCR.
For the phycosphere microbial community genome determination, the bacterial V3-V4 16S rRNA region was amplified using bacterial primers S-D-Bact-0341-b-S-17 (5′-CCTACGGGNGGCWGCAG-3′) and S-D-Bact-0785-a-A-21 (5′-GACTACHVGGGTA TCTAATCC-3′) [22] in four parallel reactions. Each 25 μL PCR reaction contained: 1× DreamTaq Green PCR Master Mix (ThermoFisher Scientific, USA), 0.5 μM of forward and reverse primers and 10 ng of DNA template. The PCR amplification conditions were: 5 min initial denaturation at 95 °C, 30 cycles of 40 s denaturation at 95 °C, 2 min annealing at 55 °C and 1 min elongation at 72 °C, finalized by 10 min at 72 °C. After pooling of the replicate reactions, PCR products were purified using Wizard SV Gel and PCR Clean-Up System (Promega, Madison, WI, USA) and sent for sequencing on the Illumina MiSeq platform (2 × 250 bp paired end) at IMGM Laboratories (Martinsried, Bavaria, Germany).
The forward and reverse sequences contained in fastq files were assembled using the Mothur command make.contigs and split into sample-specific fasta files using the Mothur command split.groups [23]. Multifasta files were processed by 131 the SILVAngs 1.3 pipeline (https://www.arb-silva.de/ngs) [24] as described in Ionescu et al. (2012) [25]. Briefly, sequences were aligned against the SILVA SSU rRNA SEED using the SILVA Incremental Aligner (SINA). Sequences shorter than 50 aligned nucleotides, with more than 2% ambiguities or 2% homopolymers, were removed. Putative contaminations and artefacts and reads with a low alignment quality (50 alignment identity, 40 alignment score reported by SINA) were excluded from downstream analysis. Identical sequences were identified (dereplication) and the unique sequences were clustered (operational taxonomic units (OTUs)) at 97% sequence identity using cd-hit-est (version 3.1.2; http://www.bioinformatics.org/cd-hit) [26] running in accurate mode and ignoring overhangs. The representative OTU sequence was classified against the SILVA SSU Ref dataset (release 123.1; http://www.arb-silva.de) using blastn (version 2.2.30+; http://blast.ncbi.nlm.nih.gov/Blast.cgi) with standard settings [27].

2.4. Statistical Analysis

The similarity profile routine (SIMPROF) analysis combined with Bray–Curtis similarity analysis was used to determine differences among the samples and groups at the p < 0.05 significance level. The SIMPROF was run over both FAME and bacterial community data. Nonmetric multidimensional scaling (nMDS) was used to determine differences in the fucacean phycosphere on the basis of the microbial community structure, and to assess the contribution of relevant FAME biomarkers to the variance among the thalli parts of three fucacean species from the northern Adriatic. The nMDS analyses were based on correlation matrices constructed using FA profiles and relevant ratios and bacterial OTU abundance (> 50 sequences) involving normalization of all variables due to their different scales. Biomarker lipids used in nMDS were the proportion of mono- and polyunsaturated fatty acids (MUFAs, PUFAs), ratio between n-6 and n-3 PUFAs, unsaturation index (UND) and bacterial FA. All statistical analyses were performed using the software Primer 7 (PRIMER-E Ltd, Devon, UK).

3. Results

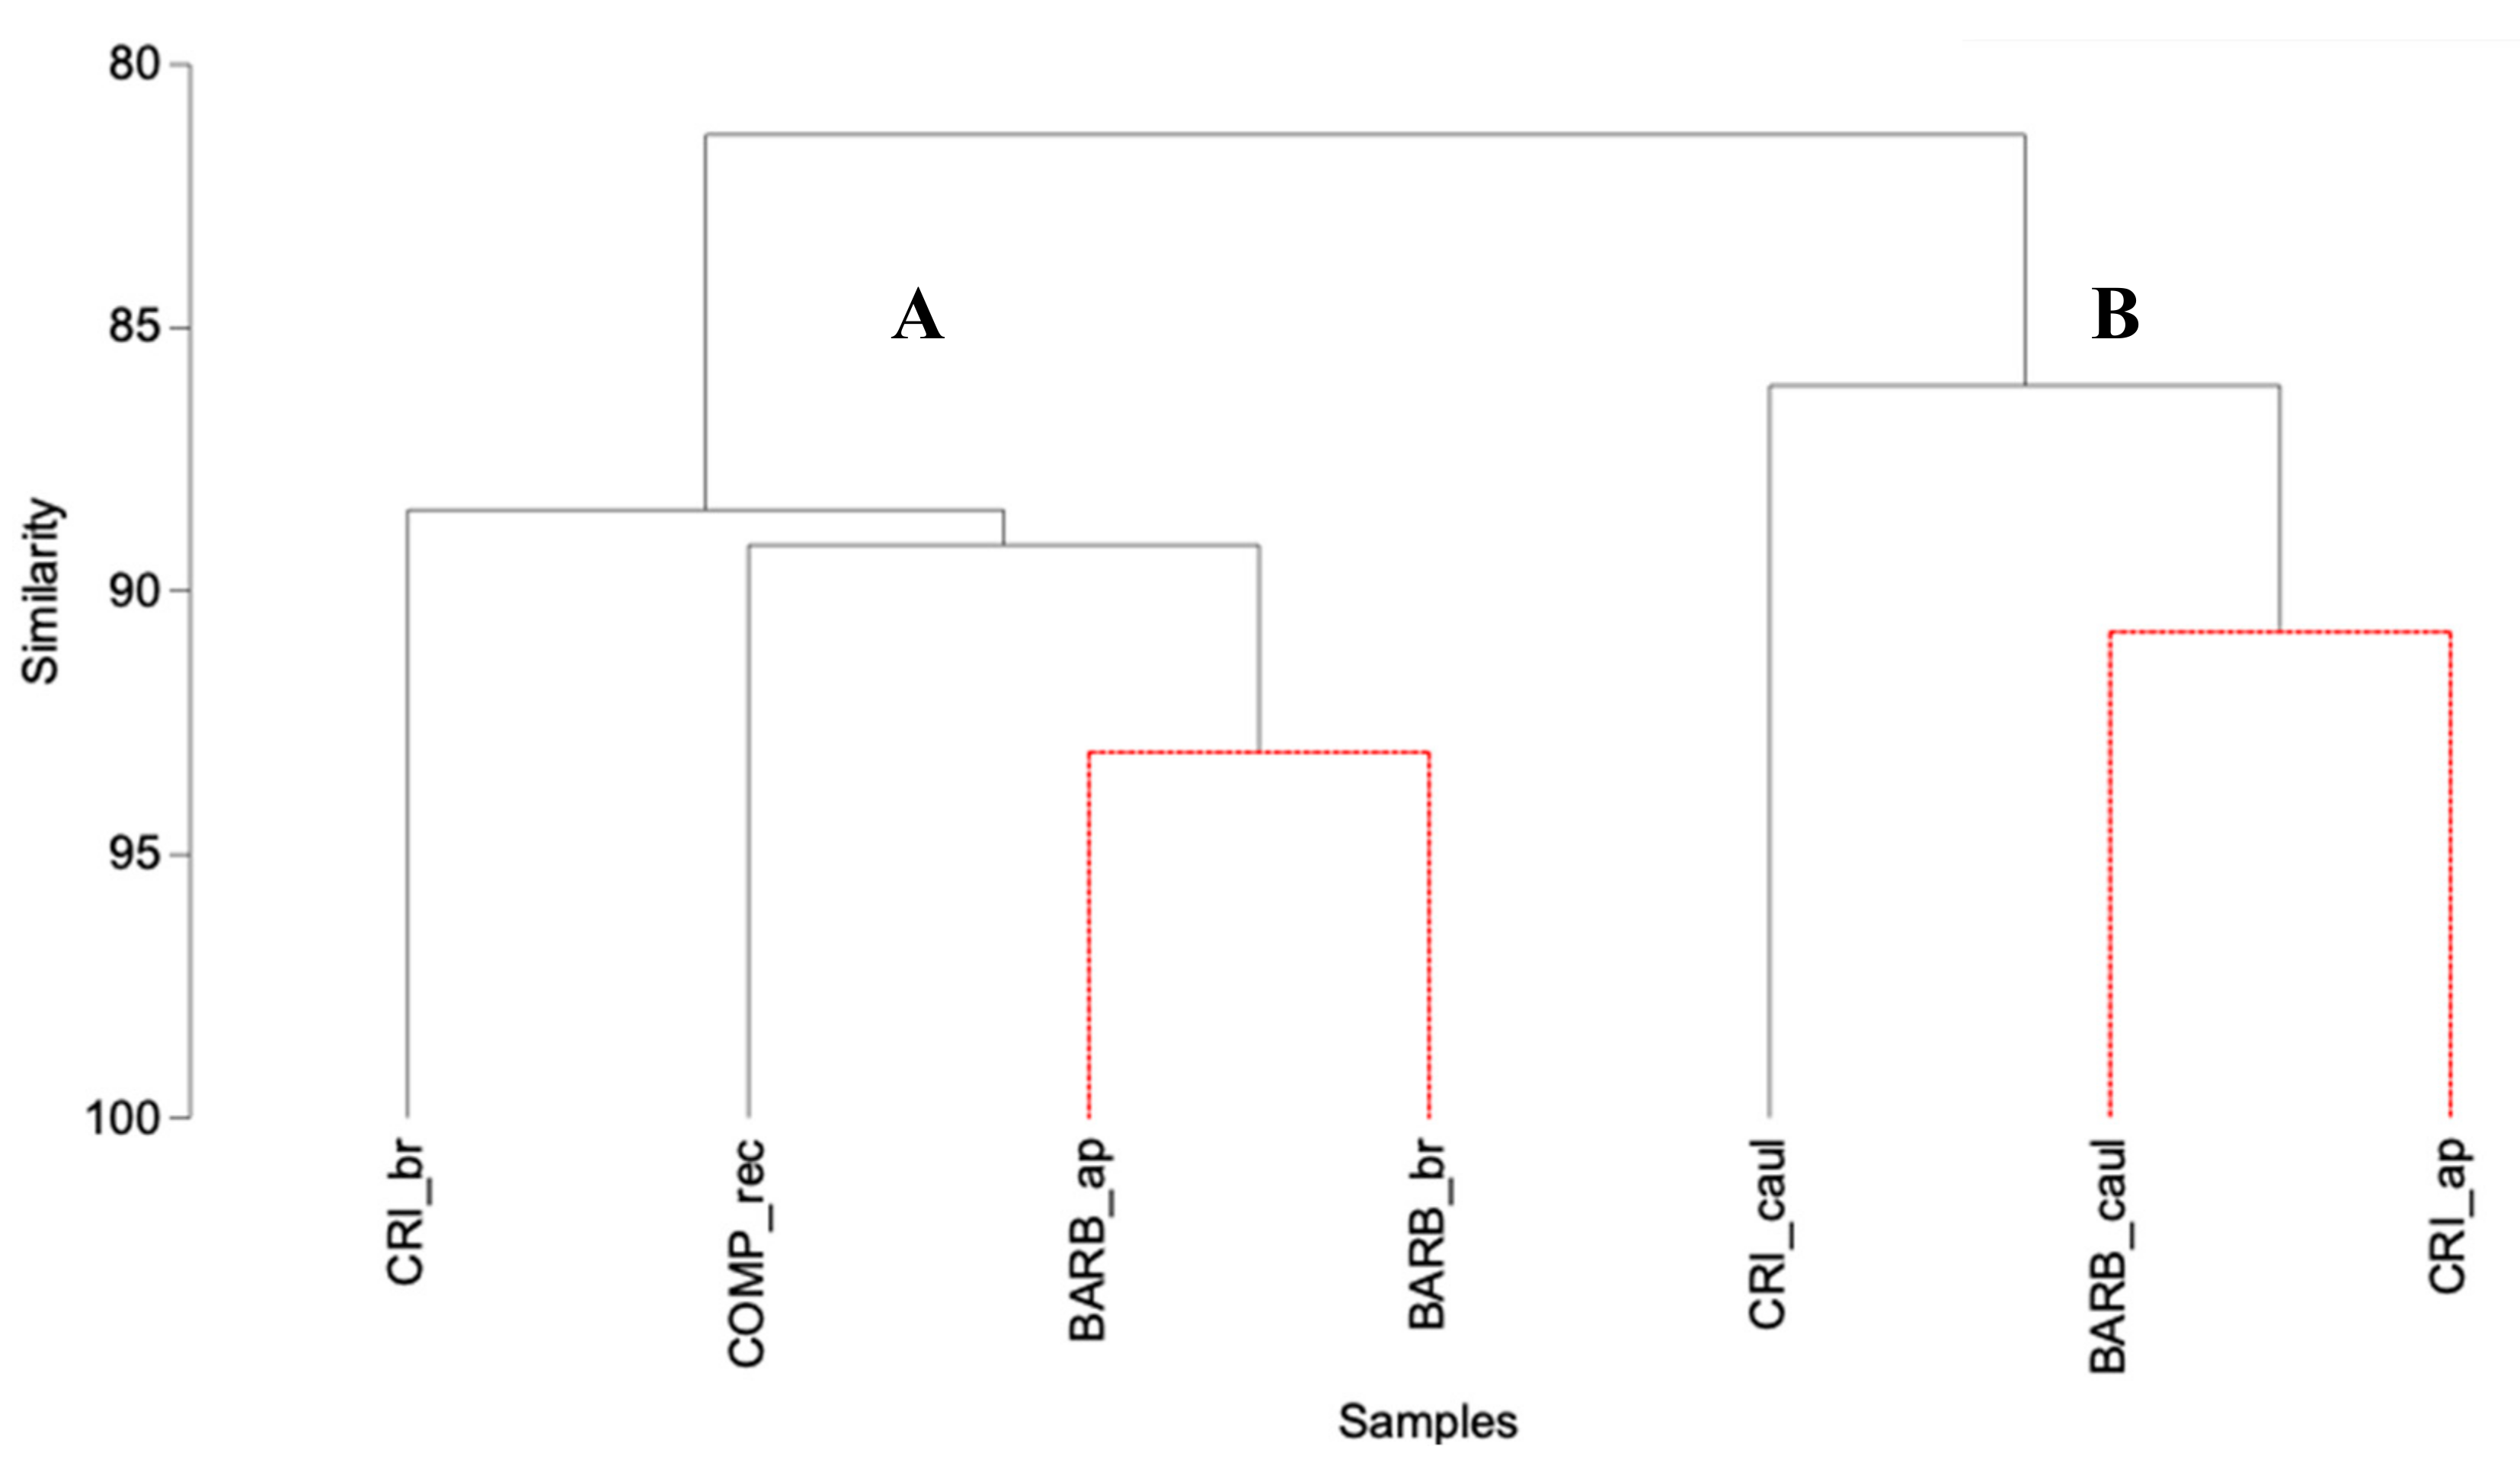
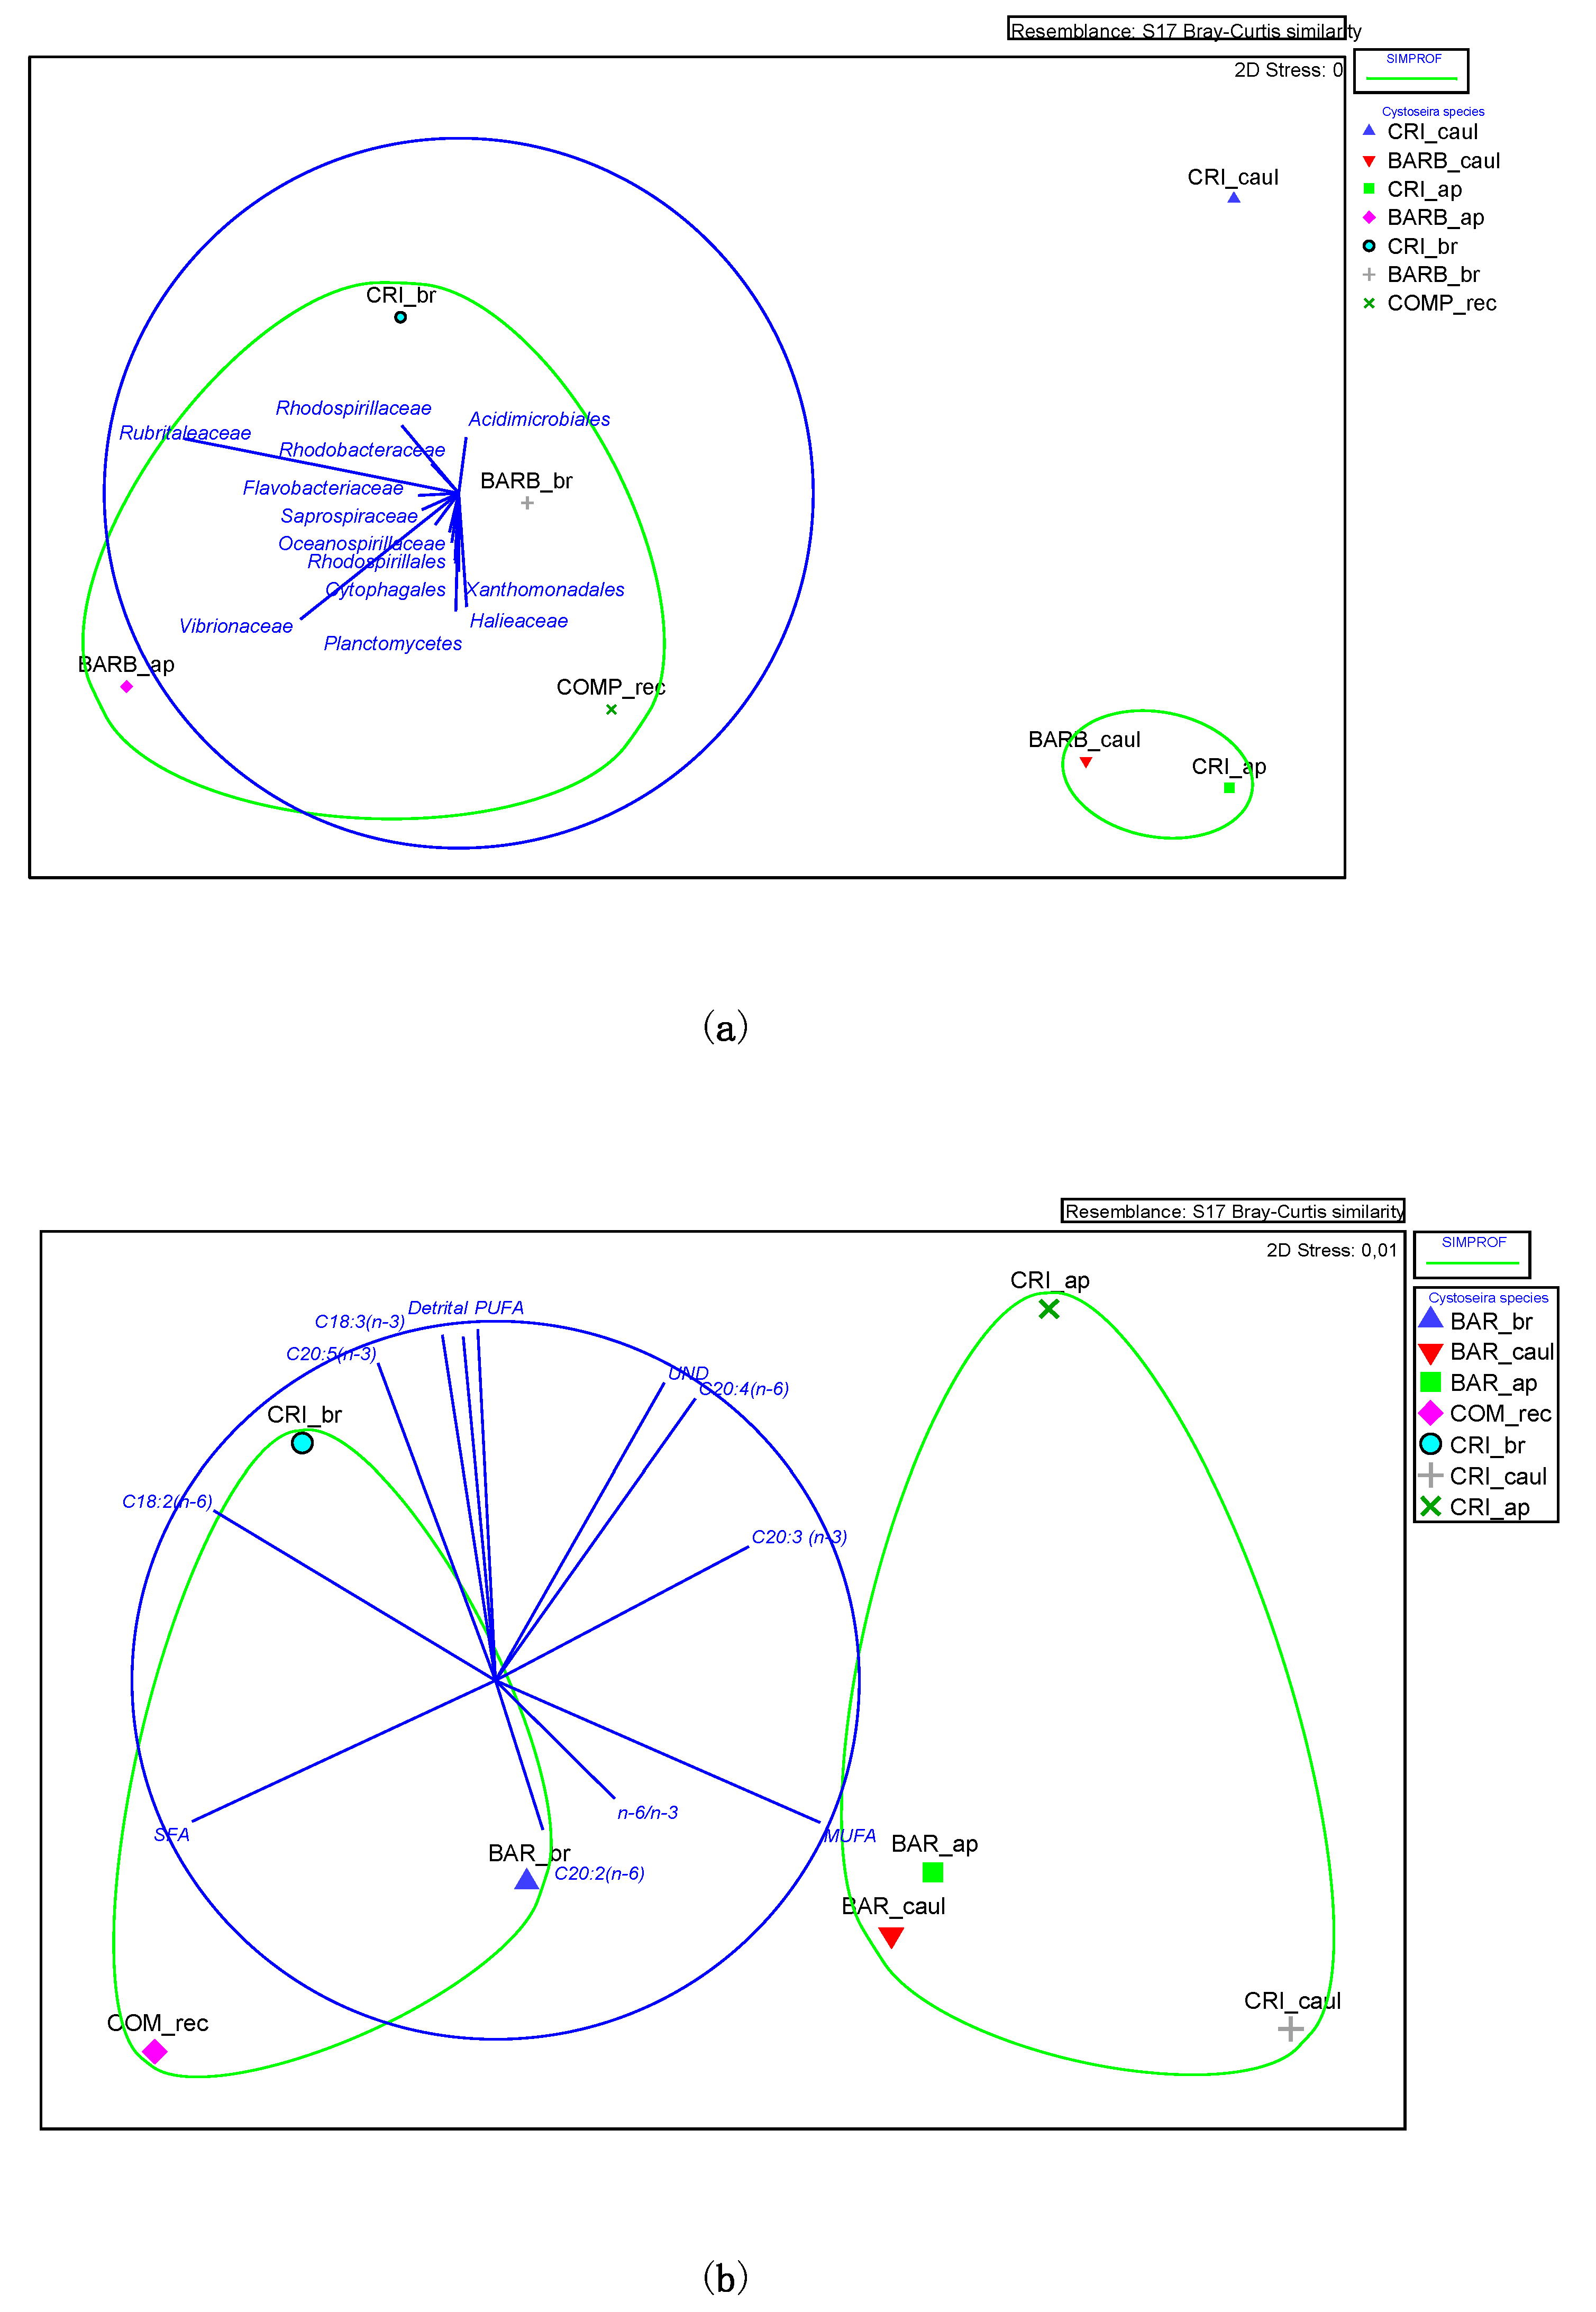
3.1. Lipid Composition and Fatty Acid Profile of the Fucales Thalli

The FAME profiles of three Fucales species divided into perennial and annual thalli parts are presented in Table 1, Table 2 and Table 3. The results revealed profiles containing C14–C24 fatty acids, corresponding to the data reported by other authors for brown algae [28,29]. The fatty acid composition of T. barbata and C. crinita was dominated by C16:0, C18:1 and C20:4 fatty acids, whereas the C. compressa profile was dominated by C14:0, C16:0 and C18:0. Both T. barbata and C. crinita showed high contents of mono- and polyunsaturated FAs but showed a clear distinction between branches, cauloids and apical parts. The highest saturation among T. barbata and C. crinita was noticed in branches, reaching 50.58% and 52.37%, respectively. Both cauloids and apical parts of T. barbata and C. crinita harbor higher proportions of MUFAs and PUFAs, with a consequently very high unsaturation index (UND), reaching a maximum of 4.32 in C. crinita apical parts. Along with the highest unsaturation degree, the C. crinita branches and apical parts demonstrated high proportions of both C18 and C20 PUFAs, with docosapentaenoic (EPA, C20:5 n-3) and arachidonic (ARA, C20:4 n-6) fatty acid up to 5.46% and 13.82%, respectively. The highest proportion of saturated fatty acids (SFAs) was found in thalli of C. compressa, particularly in cauloids and old branches (≥90%). The profiles of C. compressa were dominated by C14:0, C16:0 and C18:0. Higher saturation was observed in the cauloids, along with the highest proportion of bacterial fatty acids (2.82), whereas the highest unsaturation was observed on the receptacles (1.67), along with the lowest proportion of bacterial FAs (1.40). The proportions of bacterial fatty acids were small in most of the samples (1.30–1.81), however, C. crinita branches and apical parts and C. compressa cauloids demonstrated a bacterial FA proportion > 2.3.
The SIMPROF analysis of the FAME profiles revealed three significantly different (p < 0.05) groups of samples (A, B and C). Two groups, B branches of C. crinita and T. barbata and receptacles of C. compressa and C cauloids and apical parts of C. crinita and T. barbata shared 75% similarity at the group level (Figure 1). Group A (cauloids and branches of C. compressa) showed the most distinctive FAME profile, sharing 42% similarity with groups B and C. Group A represents the old thallus of C. compressa, divided into cauloids and old branches. Group B, comprising the branches and receptacles of all three species, represents the new part of the thallus that grows fresh every year. The old parts of thalli enabling C. crinita and T. barbata perennial growth for decades, are clustered in group C (cauloids and apical parts).

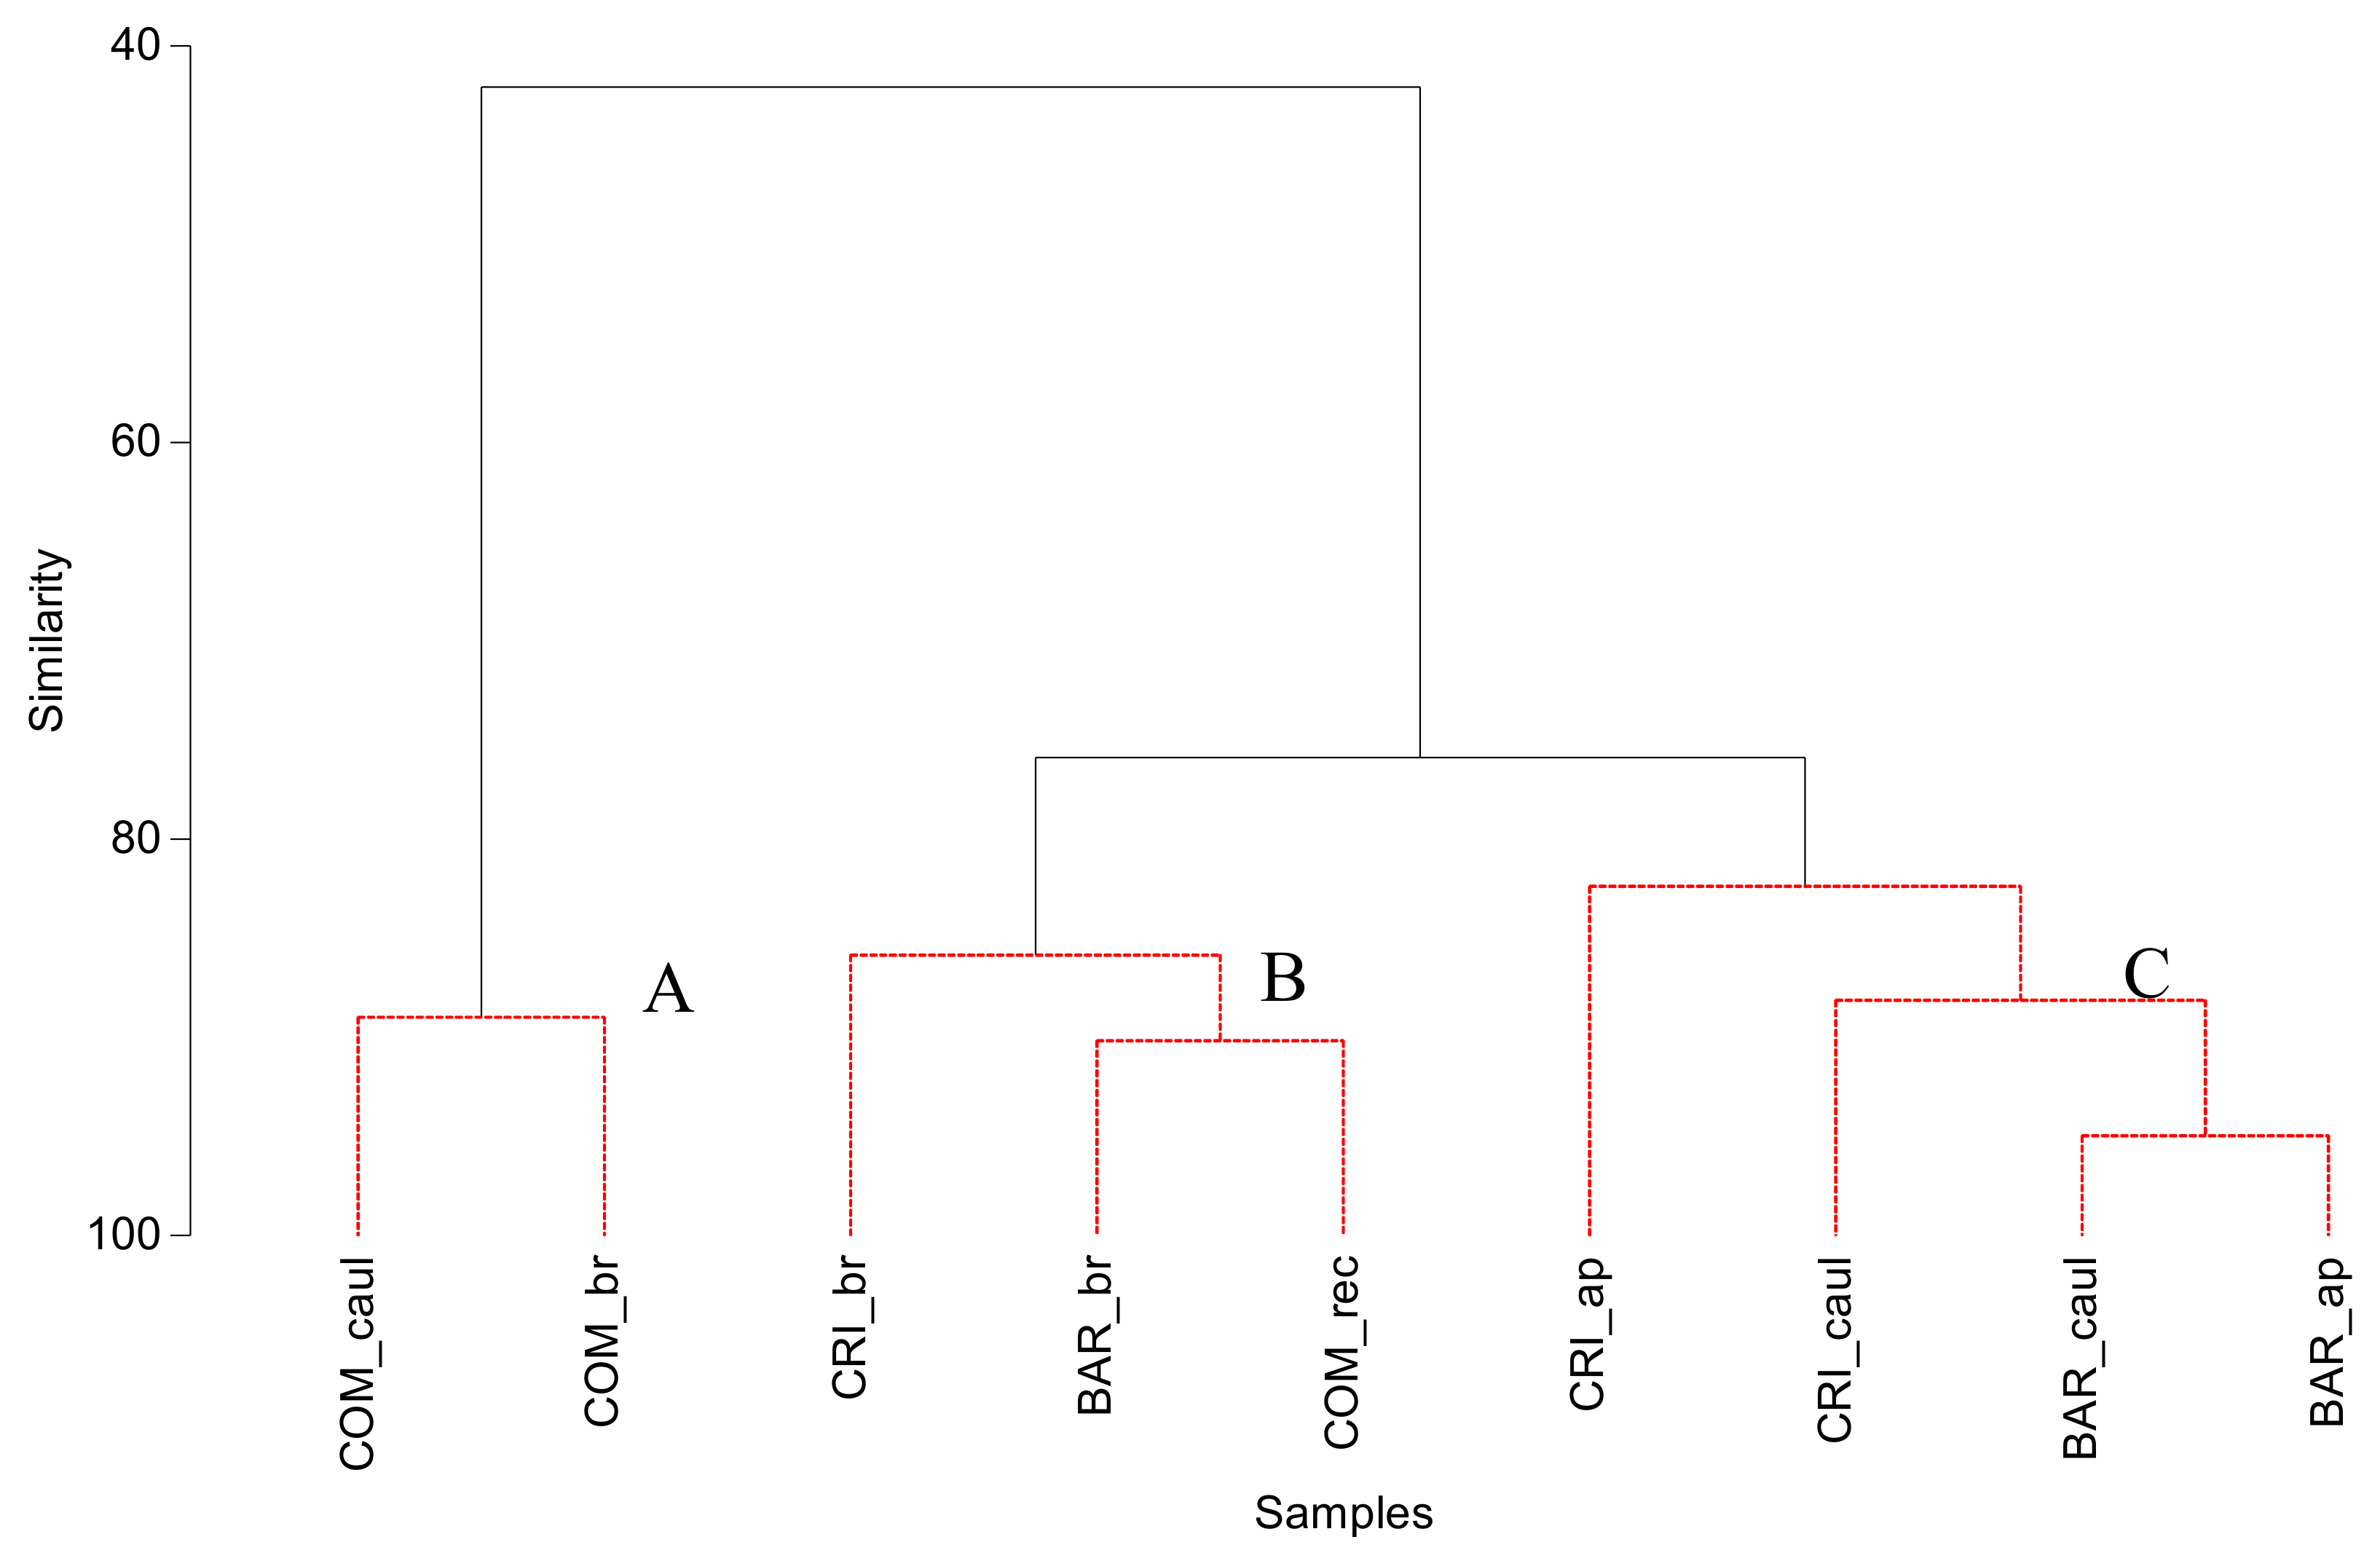
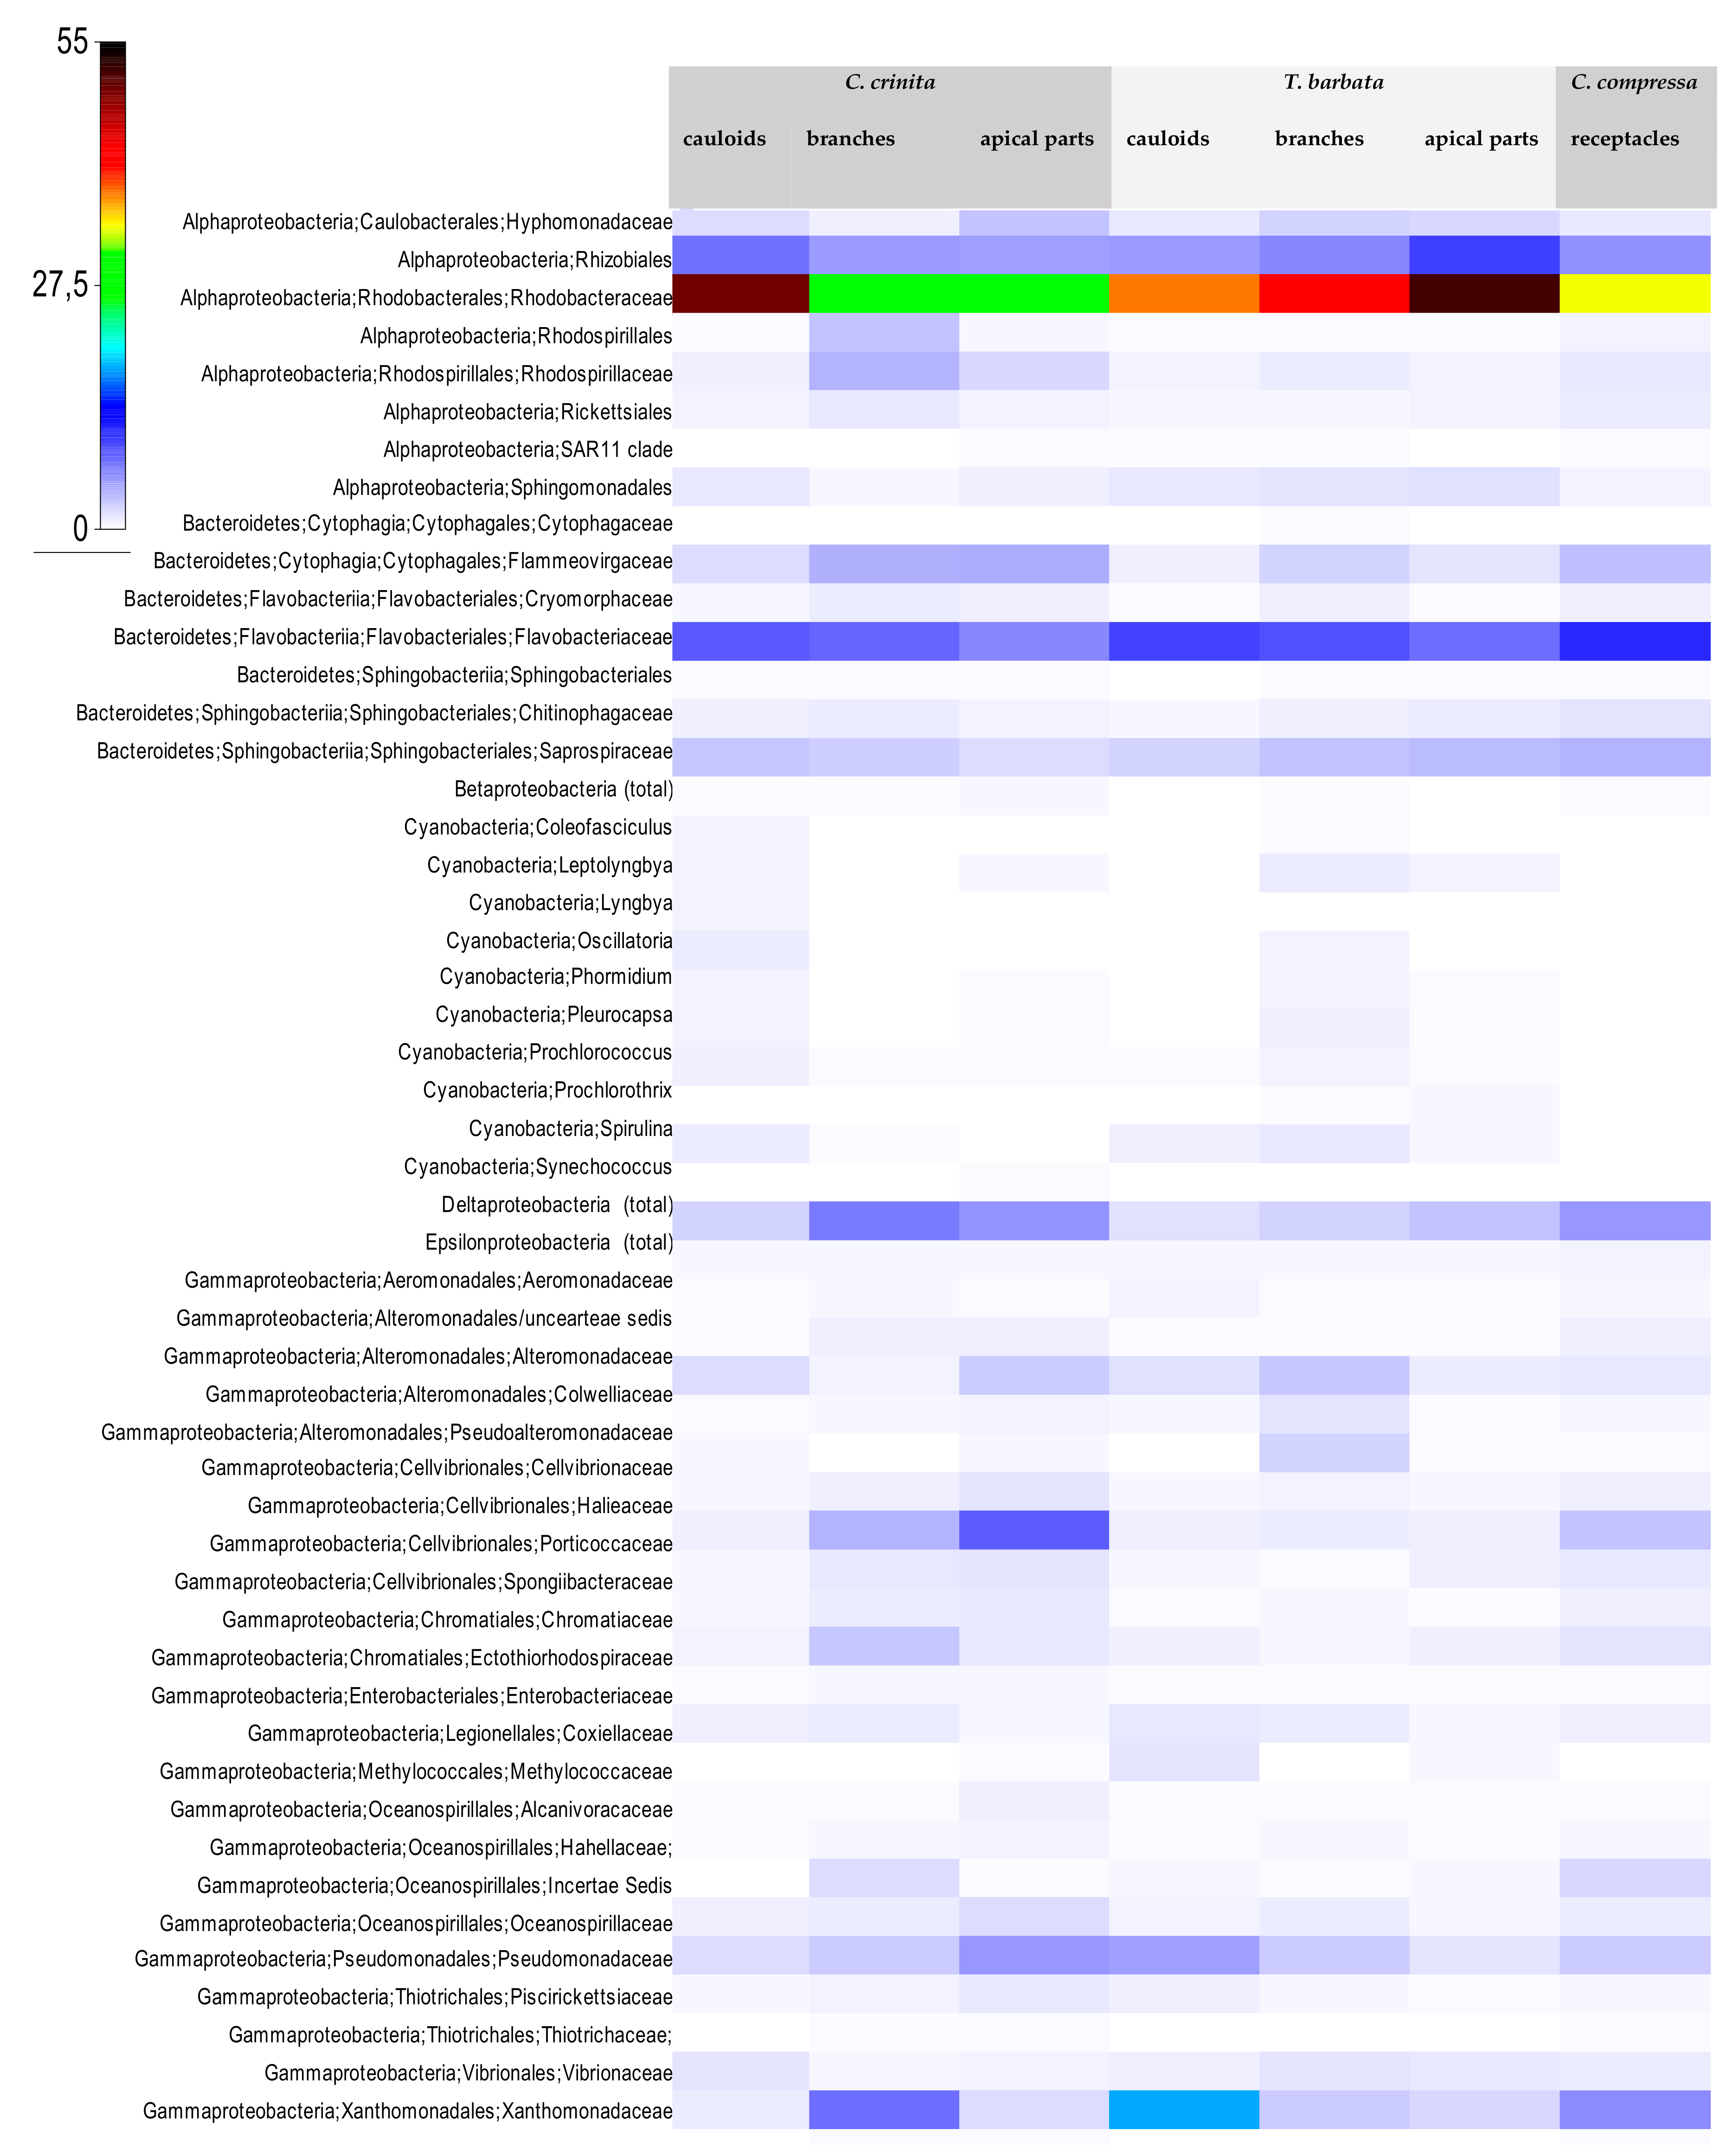
3.2. Bacterial Community Structure of the Fucacean Phycosphere

Phylogenetic analysis of the bacterial community was performed on the selected thalli harboring high biochemical richness of mono- and polyunsaturated fatty acids. Contrary to C. crinita and T. barbata (Table 3 and Figure 1), cauloids and branches of C. compressa had FAME profiles with > 90% saturated FAs, and therefore were excluded from the analysis of the phycosphere microbial structure and multidimensional comparison of biomarker FAs and epiphytic communities. Phylogenetic classification of T. barbata (cauloids, branches and apical parts), C. crinita (cauloids, branches and apical parts) and C. compressa (receptacles) revealed 48 bacterial phyla distributed across the samples.
Overall, 1406 OTUs were identified across all the samples based on the SILVA rRNA gene database at the cut-off level of 97%. Among all analyzed samples, T. barbata cauloids harbored the highest number of unique OTUs (923), while the lowest number of OTUs was recorded in C. crinita cauloids (664). The branches of both T. barbata and C. crinita showed a similar number of OTUs (886 and 897, respectively), whereas C. compressa receptacles, along with the aerocysts, harbored a higher number of OTUs (916) than the apical parts of T. barbata and C. crinita (764 and 838, respectively). The distribution of the bacterial classes in the phycosphere is presented in the shade plot (Figure 2). The three most dominant classes of heterotrophic bacteria in the biofilm of all samples were Alphaproteobacteria (27.80–46.12%), Gammaproteobacteria (10.71–29.93%) and Bacteroidetes (9.88–15.46%). Other major phyla, including Cyanobacteria (1.53–22.44%), Planctomycetes (0.77–6.58%), Verrucomicrobia (0.90–2.76%) and Actinobacteria (0.13–0.90%), were also identified among all samples.
The relative abundance of bacterial classes or families is presented in Figure 2. The highest abundances are observed for Alphaproteobacteria, in particular in C. crinita cauloids and T. barbata apical parts. Dominant representatives among Alphaproteobacteria were Hyphomonadaceae, Rhodobacteraceae, Rhizobiales, Rhodospirilaceae and Rickettsiales, followed by small proportions of the SAR11 clade, Sphingomonadales and Rhodospirilales. A substantial number of the Cytophaga–Flavobacter–Bacteroidetes cluster is recorded in all samples. Among Gammaproteobacteria, the most taxonomically numerous group, abundant representatives were Vibrionaceae, Ocenospirilaceae, Halieaceae, Pseudoaltermonodaceae, Thiotrichaceae and Alteromonadaceae.
The SIMPROF analysis was performed over taxa to determine the community structure resemblance between the samples (Figure 3). The cluster analysis revealed two groups distinct at the 82% level.
Based on the whole bacterial community structure, the highest resemblance was found among apical parts and branches of T. barbata, receptacles of C. compressa and branches of C. crinita (group A) with 88% similarity at the group level. The second group (B) showed resemblance between the C. crinita and T. barbata cauloids and C. crinita apical parts.
To determine the relevance of bacterial taxa predominantly contributing to the difference among the groups and relative impact of the FA biomarkers on community structure, nonmetric multidimensional scaling analysis (nMDS) was performed (Figure 4). The result from the microbial community data (Figure 4a) revealed that the relative abundance of 13 dominant microbial taxa and/or families is closely linked to the two clearly separated groups. The taxonomic distribution of bacterial communities is distinct for each group (Figure 2). In correspondence to the SIMPROF analysis, one group in the nMDS plot comprises communities from the branches of C crinita and T. barbata and receptacles of C. compressa, as well as apical parts of T. barbata. This group is clearly distinct from the T. barbata cauloids and C. crinita apical parts and cauloids. The factors significantly contributing to the difference are dominant representatives of Alphaproteobacteria belonging to the classes Rhodospirillaceae and Rhodobacteriaceae. Representatives of the Gammaproteobacteria class, identified as Vibrionaceae (most dominant species: Vibrio), contributed strongly to the separation of T. barbata apical parts, whereas C. compressa receptacles were characterized and separated by the abundance of Planctomycetes, Xantomonadales and Halieaceae.
The nMDS analysis based on a Bray–Curtis dissimilarity matrix revealed significant (p < 0.05) differences between branches and receptacles, on one side, and cauloids and apical parts, on the other side, at the level of biomarker fatty acids (Figure 4b). The similarity between branches and receptacles is determined by the relative proportions of C18 and C20 PUFAs, SFAs, MUFAs and detrital fatty acids, and the n-6/n-3 ratio (Table 1). Apical parts and cauloids were significantly (p < 0.05) distinctive from branches, and showed separation due to the fatty acid markers C20:4(n-6) and C20:3(n-3) PUFAs. The PUFA dominance was pronounced in C. crinita apical parts, with a shift towards monounsaturated fatty acids present in C. crinita and T. barbata cauloids and apical parts. Based on unsaturated chemical bond proportions and ratios, as well as detrital FAs as physiological indicators, most of the cases were grouped according to a similar pattern as well as by epiphytic microbial communities (Figure 4a).

4. Discussion

It is well known that macroalgae harbor diverse epiphytic microflora that play a significant role in their morphological development and defense mechanisms [30]. In the past few decades, seaweed-associated epiphytic bacterial communities have been significantly explored using culture-dependent studies and community fingerprinting techniques, however, such studies are rare in the Adriatic. Rocky intertidal areas of the northern Adriatic, a habitat of high trophic and morphological heterogeneity, has recently experienced a decline in seaweed populations, in particular, fucacean species in the eastern Adriatic coastal zone [2]. Plausible explanations given by Duarte et al. [18] relate lipid biochemistry and physiological limitations to the ability of macroalgae to adapt to the changing stress conditions and to withstand biotic interactions, such as grazing pressure and microbial colonization. To our knowledge, this is the first study applying next generation sequencing to reveal the relationship between phycosphere prokaryotic community structure and lipid composition specificity of fucacean species from the northern Adriatic in order to address the potential role of microbial community colonization of the phycosphere in bioactive responses to anthropogenic and climate stress.
One of the well-known biochemical specificities of brown algae is their richness in polyunsaturated fatty acids [31], generally declining with an increase in the habitat temperature. Our findings revealed that fatty acid saturation is not only related to the temperature conditions during growth, but also depends on the functional role of the particular vegetative part of the algal thallus. While the slow growing species Treptacantha barbata and Carpodesmia crinita demonstrated high unsaturation in all the thalli parts (>49% unsaturated FAs), the old thallus of Cystoseira compressa is characterized by a very low unsaturation index and elevated proportion of bacterial fatty acids compared to the same thalli parts of the former. The FAME distinction found between C. compressa cauloids/branches and receptacles is in accordance with species morphology, being significantly different from T. barbata and C. crinita species. Due to the morphological characteristics of this species and its related ecophysiological features, the highest biochemical richness of the lipid profile is linked to the receptacles. In addition to the high richness in PUFAs (>25%), the phycosphere of Carpodesmia crinita branches and apical parts offers favorable environmental conditions for bacterial growth, derived from the bacterial FA > 2.3 [32]. Branches of C. crinita and T. barbata clustered statistically very close based on both biochemical and microbial community analysis. Sharing similar FA markers and similar phycosphere bacteria structure indicates their functional relationship. The colonization of C. crinita and its differentiation from Treptacantha barbata is mostly derived from the abundant presence of Alphaproteobacteria in phycosphere, in particular of the Rhodobacteraceae family, known as key players in biogeochemical cycling in marine environments [33]. They are also known as pioneers of biofilm formation in marine environments [34]. The good physiological condition of the sampled C. crinita and richness of the FA profile indicate a mutualistic/symbiotic relationship between the alga and its phycosphere-associated microbiota. Carpodesmia crinita and Treptacantha barbata apical parts and cauloids showed the highest similarity with respect to the bacterial community structure, corresponding to their similar propagation dynamics and ecology. The same samples clustered closest according to the FAME proportions as well, indicating relatedness of the physiological condition to the epiphytic bacterial community composition. The clear separation of branches and receptacles as old perennial parts of thallus, from the cauloids and apical parts as part of the thallus that is young and renewed every year, indicates the strong relationship between the physiological status of the thallus and the epiphytic bacterial structure of the phycosphere. The branches are characterized by elevated proportions of EPA, ARA and C18:3n-3 and C18:2, suggesting their role in bacterial colonization of the phycosphere.
In all three species of studied algae, we found some bacterial families known for representatives associated with different functions in algae ecophysiology: Alteromonadaceae, Flavobacteriaceae, Rhodobacteraceae, Xanthomonadaceae (associated with antimicrobial activity), Vibrionaceae, Rhodospirillaceae and Saprospiraceae (associated with pathogenic activity) [35]. Richness in n-3 PUFAs, in particular C18:3(n-3) and C20:5(n-3) recorded in C. crinita and C. barbata branches, is related to a high diversity of Alphaproteobacteria and Bacteroidetes (family Flavobacteriacea). Polyunsaturated fatty acids, in particular n-3, derived from marine algae, are reported to have toxic activity against some phytoplankton species [36]. The increased abundance of Rhodobacteriaceae bacteria within the phycosphere potentially assists the digestion of extracellular polysaccharides released by algae and, at the same time, provides more efficient nutrient uptake through the remineralization of the organic matter in the surrounding water. Moreover, it is plausible that PUFAs originating from macroalgae, in particular in the most exposed young and fast-growing parts, participate in microbial quorum sensing (QS) in the phycosphere, directing the colonization towards Rhodobacteraceae and other n-acyl-homoserine-lactone (AHL)-producing or LuxR orphan QS bacteria [37]. Such a biochemical defense mechanism is very important against colonization by undesired toxic flagellates or diatoms, and can be useful in the mitigation of harmful algae from aquaculture, urban and recreational sites. However, Mancuso et al. [38] and some other authors [39,40] have recorded the increase in abundances in Rhodobacteriaceae representatives in bleached parts of some red and brown seaweed, suggesting the possibility of a negative impact in terms of climate change and of the recent records of Cystoseira habitat decline [2,41]. The pronounced effect on microbial community structure is revealed in the T. barbata apical parts and cauloids and C. compressa receptacles due to differences in the presence of Gammaproteobacteria belonging to the Vibrio genus, as well as Cytophagales and Cellvibrionales, along with monounsaturated fatty acids. There are conflicting reports as to whether the role of epiphytic Vibrio spp. in brown seaweed is beneficial or detrimental [30,42]. Although the overall physiological condition of the algae in our study derived from fatty acid profiling, as well as the personal in situ observation, indicate healthy maximum growth conditions at the moment of sampling, the potential detrimental role of the present Vibrio species cannot be excluded. This raises the importance of marine bacterial functional analyses in the biotechnological exploration of bioactive molecule production, such as AHLs, polysaccharide-degrading enzymes, antibiotics and their application in biofuel production [43], antibiotic resistance mitigation or protection against fouling.

5. Conclusions

The fucacean species studied, formerly classified as Cystoseira and recently renamed as C. crinita, T. barbata and C. compressa, represent the most complex and stable autotrophic communities of the shallow coastal fringe in the Eastern Mediterranean. As habitat-forming species, they play a key role in sustaining biodiversity and ecosystem functioning. The results showed a strong relationship between fatty acid profiles of the analyzed species and phycosphere community structure. The highest richness in polyunsaturated fatty acids, in particular C18:3(n-3), C20:4(n-6) and C20:5(n-3), was observed in branches of T. barbta and C. crinita, accompanied by a distinctive epiphytic microbial structure dominated by numerous representatives with potentially beneficial biological activity. In harsh environments and under stress conditions, such as the ones caused by climate change, the mutualistic relationships among the phycosphere community and the host are of great significance for the amelioration of physical stress. However, the bacteria identified as functionally important colonizers of the Adriatic fucacean species bear both beneficial and potentially detrimental characteristics. Therefore, this study underlines the importance of the host’s physiological condition in shaping the biological interactions and maintaining a healthy microbiome, as well as compiling the ecophysiological and molecular research in order to better assess the resilience of the ecosystem.

Author Contributions

Conceptualization, M.B.; methodology, M.B. and L.I.; validation, M.D.; laboratory experiments, K.M., E.P. (Emina Pustijanac) and E.P. (Ena Pritišanac); formal analyses, M.B.; writing—original draft preparation, M.B.; writing—review and editing, L.I., M.F., R.B., E.P. (Emina Pustijanac) and M.D. All authors have read and agreed to the published version of the manuscript.

Funding

This research was funded by Croatian Science Foundation projects: The responses of habitat-forming brown macroalgae of the genus Cystoseira on local and global stressors (grant no. IP-2019-04-6984), and Assessment of Adriatic Algae Potential in Cogeneration Production of 3rd Generation Biofuel (grant no. PKP-06-2016-9081) under the program of the Government of the Republic Croatia to encourage research and development activities in the area of climate change.

Acknowledgments

The support of the Environmental Protection and Energy Efficiency Fund and of the Ministry of Environment and Energetics of the Republic of Croatia is acknowledged. The authors also thank to dr. Lorena Perić and dr. Marino Korlević for the technical assistance in the field and lab work, and to the WICOS project (Implementation of Water-Quality Monitoring in the Western Istria Coastal Sea—Northern Adriatic, INTERREG IIIA) for creating the opportunity for new research ideas and team development.

Conflicts of Interest

The authors declare no conflict of interest. The funders had no role in the design of the study; in the collection, analyses, or interpretation of data; in the writing of the manuscript, or in the decision to publish the results.

References

  1. Mangialajo, L.; Gianni, F.; Airoldi, L.; Bartolini, F.; Francour, P.; Meinesz, A.; Thiabaut, T.; Ballesteros, E. Conservation and restoration of Cystoseira forests in the Mediteranean Sea: The role of marine protected areas. Rapp. Comm. Int. Mer. Medit. 2013, 40, 621. [Google Scholar]
  2. Iveša, L.; Đakovac, T.; Devescovi, M. Long–term fluctuations in Cystoseira population along the west Istrian Coast (Croatia) related to eutrophication patterns in the northern Adriatic Sea. Mar. Pollut. Bull. 2016, 106, 162–173. [Google Scholar] [CrossRef]
  3. Coll, M.; Piroddi, C.; Steenbeek, J.; Kaschner, K.; Lasram, F.B.R.; Aguzzi, J.; Ballesteros, E.; Bianchi, C.N.; Corbera, J.; Dailianis, T.; et al. The Biodiversity of the Mediterranean Sea: Estimates, Patterns, and Threats. PLoS ONE 2010, 5, e11842. [Google Scholar] [CrossRef] [Green Version]
  4. Nasrolahi, A.; Stratil, S.B.; Jacob, K.J.; Wahl, M. A protective coat of microorganisms on macroalgae: Inhibitory effects of bacterial biofilms and epibiotic microbial assemblages on barnacle attachment. FEMS Microbiol. Ecol. 2012, 81, 583–595. [Google Scholar] [CrossRef] [Green Version]
  5. Wahl, M.; Shahnaz, L.; Dobrestsov, S.; Saha, M.; Symanowski, F.; David, K.; Lachnit, T.; Vasel, M.; Weinberger, F. Ecology and antifouling resistance in the bladder wrack Fucusvesiculosus: Patters of micriofouling and antimicrobial protection. Mar. Ecol. Prog. Ser. 2010, 411, 33–48. [Google Scholar] [CrossRef]
  6. Lachnit, T.; Wahl, M.; Harder, T. Isolated thallus-associated compounds from the macroalgae Fucusvesiculosus mediate bacterial surface colonization in the field similar to that on the natural algae. Biofouling 2010, 26, 247–255. [Google Scholar] [CrossRef] [PubMed] [Green Version]
  7. Lachnit, T.; Meske, D.; Wahl, M.; Harder, T.; Schmitz, R. Epibacterial community patterns on marine macroalgae are host—Specific but temporally variable. Environ. Microbiol. 2011, 13, 655–665. [Google Scholar] [CrossRef] [PubMed]
  8. Iveša, L.; Lyons, D.M.; Devescovi, M. Assessment of the ecological status of north-eastern Adriatic coastal waters (Istria, Croatia) using macroalgal assemblages for the European Union Water Framework Directive. Aquat. Conserv. Mar. Freshw. Ecosyst. 2009, 19, 14–23. [Google Scholar] [CrossRef]
  9. Valdazo, J.; Ascenisión, V.R.; Espino, F.; Haroun, R.; Tuya, F. Massive decline of Cystoseiraabies—Marina forests in Gran Canaria Island (Canary Islands, eastern Atlantic). Sci. Mar. 2017, 81, 499–507. [Google Scholar] [CrossRef] [Green Version]
  10. Mačić, V.; Svirčev, Z. Macroepiphytes on Cystoseira species (Phaeophyceae) on the coast of Montenegro. Fresenius Environ. Bull. 2014, 23, 29–34. [Google Scholar]
  11. Egan, S.; Harder, T.; Burke, C.; Steinberg, P.; Kjelleberg, S.; Thomas, T. The seaweed holobiont: Understanding seaweed-bacteria interactions. FEMS Microbiol. Rev. 2013, 37, 462–476. [Google Scholar] [CrossRef] [PubMed] [Green Version]
  12. Huggett, M.J.; McMahon, K.; Bernasconi, R. Future warming and acidification result in multiple ecological impacts to a temperate coralline alga. Environ. Microbiol. 2018, 20, 2769–2782. [Google Scholar] [CrossRef] [PubMed] [Green Version]
  13. Dobretsov, S.; Teplitski, M.; Paul, V.J. Quorum sensing in the marine environment and its relationship to biofouling. Biofouling 2009, 25, 413–427. [Google Scholar] [CrossRef] [PubMed]
  14. Piazza, V.; Roussis, V.; Garaventa, F.; Greco, G.; Smyrniotopoulos, V.; Vagias, C.; Faimali, M. Terpenes from the red alga Sphaerococcuscoronopifolius inhibit the settlement of barnacles. Mar. Biotechnol. 2011, 13, 764–772. [Google Scholar] [CrossRef]
  15. Potin, P.; Bouarab, K.; Salaün, J.P.; Pohnert, G.; Kloareg, B. Biotic interations of marine algae. Curr. Opin. Plant. Biol. 2002, 5, 308–317. [Google Scholar] [CrossRef]
  16. Bouarab, K.; Adas, F.; Gaquerel, E.; Kloareg, B.; Salaün, J.P.; Potin, P. The innate immunity of a marine red alga involves oxylipins from both the eicosanoid and octadecanoid pathways. Plant Physiol. 2004, 135, 1838–1848. [Google Scholar] [CrossRef] [Green Version]
  17. Küpper, F.C.; Gaquerel, E.; Cosse, A.; Adas, F.; Peters, A.F.; Müller, D.G.; Kloareg, B.; Salaün, J.-P.; Potin, P. Free fatty acids and methyl jasmonate trigger defense reactions in Laminaria dignitata. Plant. Cell. Physiol. 2009, 50, 789–800. [Google Scholar] [CrossRef] [Green Version]
  18. Duarte, B.; Martins, I.; Rosa, R.; Matos, A.R.; Roleda, M.Y.; Reusch, T.B.H.; Engelen, A.H.; Serrao, E.A.; Pearson, G.A.; Marques, J.C.; et al. Climate change Impacts on Seagrass Meadows and Macroalgal Forests: An Integrative Perspective on Acclimation and Adaptation Potential. Front. Mar. Sci. 2018. [Google Scholar] [CrossRef] [Green Version]
  19. Vizetto-Duarte, C.; Pereira, H.; Bruno de Suosa, C.; Rauter, A.P.; Albericio, F.; Custódio, L.; Barreira, L.; Varela, J. Fatty acid profile of different species of algae of the Cystoseira genus: A nutraceutical perspective. Nat. Prod. Res. 2015, 29, 13. [Google Scholar] [CrossRef]
  20. Burke, C.; Kjelleberg, S.; Thomas, T. Selective Extraction of Bacterial DNA from the Surfaces of Macroalgae. Appl. Environ. Microbiol. 2008, 75, 252–256. [Google Scholar] [CrossRef] [Green Version]
  21. De Rosa, M.; Gambacorta, A. The lipids of archaebacteria. Prog. Lipid Res. 1988, 27, 153–175. [Google Scholar] [CrossRef]
  22. Klindworth, A.; Pruesse, E.; Schweer, T.; Peplies, J.; Quast, C.; Horn, M.; Glöckner, F., O. Evaluation of general 16S ribosomal RNA gene PCR primers for classical and next-generation sequencing-based diversity studies. Nucleic Acids Res. 2013, 41, 1–11. [Google Scholar] [CrossRef] [PubMed]
  23. Schloss, P.D.; Westcott, S.L.; Ryabin, T.; Hall, J.R.; Hartmann, M.; Hollister, E.B.; Lesniewski, R.A.; Oakley, B.B.; Parks, D.H.; Robinson, C.J.; et al. Introducing mothur: Open-Source, Platform-Independent, Community-Supported Software for Describing and Comparing Microbial Communities. Appl. Environ. Microbiol. 2009, 75, 7537–7541. [Google Scholar] [CrossRef] [PubMed] [Green Version]
  24. Quast, C.; Pruesse, E.; Yilmaz, P.; Gerken, J.; Schweer, T.; Yarza, P.; Peplies, J.; Glöckner, F.O. The SILVA ribosomal RNA gene database project: Improved data processing and web-based tools. Nucleic Acids Res. 2013, 41, 590–596. [Google Scholar] [CrossRef] [PubMed]
  25. Pruesse, E.; Peplies, J.; Glöckner, F.O. SINA: Accurate high-throughput multiple sequence alignment of ribosomal RNA genes. Bioinformatics 2012, 28, 1823–1829. [Google Scholar] [CrossRef]
  26. Li, W.; Godzik, A. Cd-hit: A fast program for clustering and comparing large sets of protein or nucleotide sequences. Bioinfomatics Appl. Note 2006, 22, 1658–1659. [Google Scholar] [CrossRef] [Green Version]
  27. Camacho, C.; Coulouris, G.; Avagyan, V.; Ma, N.; Papadopoulos, J.S.; Bealer, K.; Madden, T.L. BLAST+: Architecture and applications. BMC Bioinform. 2009, 10, 421. [Google Scholar] [CrossRef] [Green Version]
  28. Kumari, P.; Kumar, M.; Gupta, V.; Reddy, C.R.K.; Jha, B. Tropical marine macroalgae as potential sources of nutritionally important PUFAs. Food Chem. 2010, 120, 749–757. [Google Scholar] [CrossRef]
  29. Pereira, H.; Barreira, L.; Figueiredo, F.; Custodio, L.; Vizetto-Durte, C.; Polo, C.; Rešek, E.; Engelen, A.; Varela, J. Polyunsaturated Fatty Acids of Marine Macroalgae: Potential for Nutritional and Pharmaceutical Applications. Mar. Drugs 2012, 10, 1920. [Google Scholar] [CrossRef] [Green Version]
  30. Selvarajan, R.; Sibanda, T.; Venkatachalam, S.; Ogola, H.J.O.; Obieze, C.C.; Msagati, T.A. Distribution, Interaction and Functional Profiles of Epiphytic Bacterial Communities from the Rocky Intertidal Seaweeds, South Africa. Sci. Rep. 2019, 9, 1–13. [Google Scholar] [CrossRef]
  31. Silva, G.; Pereira, R.B.; Valentão, P.; Andrade, P.B.; Sousa, C. Distinct fatty acid profile of ten brown macroalgae. Rev. Bras. Farm. 2013, 23, 608–613. [Google Scholar] [CrossRef] [Green Version]
  32. White, D.C.; Bobbie, R.J.; Nickels, J.S.; Fazio, S.D.; Davis, W.M. Nonselective biochemical methods for the determination of fungal mass and community structure in estuarine detrital microflora. Bot. Mar. 1980, 23, 239–250. [Google Scholar]
  33. Simon, M.; Scheuner, C.; Meier-Kolthoff, J.P.; Brinkhoff, T.; Wagner-Döbler, I.; Ulbrich, M.; Klenk, H.-P.; Schomburg, D.; Petersen, J.; Göker, M. Phylogenomics of Rhodobacteraceae reveals evolutionary adaptation to marine and non-marine habitats. ISME J. 2017, 11, 1483–1499. [Google Scholar] [CrossRef] [PubMed]
  34. Elifantz, H.; Horn, G.; Ayon, M.; Cohen, Y.; Minz, D. Rhodobacteraceaeare the key members of the microbial community of the initial biofilm formed in Eastern Mediterranean coastal seawater. FEMS Microbiol. Ecol. 2013, 85, 348–357. [Google Scholar] [CrossRef] [Green Version]
  35. Alvarado, P.; Huang, Y.; Wang, J.; Garrido, I.; Leiva, S. Phylogeny and bioactivity of epiphytic Gram-positive bacteria isolated from three co-occurring antarctic macroalgae. Antonie van Leeuwenhoek 2018, 111, 1543–1555. [Google Scholar] [CrossRef]
  36. Alamsjah, M.A.; Hirao, S.; Ishibashi, F.; Oda, T.; Fujita, Y. Algicidal activity of polyunsaturated fatty acids derived from Ulva fasciata and U. pertusa (Ulvaceae, Chlorophyta) on phytoplankton. J. Appl. Phycol. 2008, 20, 713–720. [Google Scholar] [CrossRef]
  37. Raphael, L. Quorum Sensing in Marine Biofilms and Environments; Quorum Sensing; Academic Press: Cambridge, MA, USA, 2019; pp. 55–96. [Google Scholar]
  38. Mancuso, P.; D’Hondt, S.; Willems, A.; Airoldi, L.; De Clerck, O. Diversity and Temporal Dynamics of the Epiphytic Bacterial Communities Associated with the Canopy-Forming Seaweed Cystoseira compressa (Esper) Gerloff and Nizamuddin. Front. Microbiol. 2016, 7, 476. [Google Scholar] [CrossRef] [Green Version]
  39. Fernandes, N.; Steinberg, P.; Rusch, D.; Kjelleberg, S.; Thomas, T. Community Structure and Functional Gene Profile of Bacteria on Healthy and Diseased Thalli of the Red Seaweed Delisea pulchra. PLoS ONE 2012, 7, e50854. [Google Scholar] [CrossRef] [Green Version]
  40. Zozaya-Valdes, E.; Egan, S.; Thomas, T. A comprehensive analysis of the microbial communities of healthy and diseased marine macroalgae and the detection of known and potential bacterial pathogens. Front. Microbiol. 2015, 6, 146. [Google Scholar] [CrossRef] [Green Version]
  41. Bulleri, F.; Eriksson, B.K.; Queirós, A.; Airoldi, L.; Arenas, F.; Arvanitidis, C.; Bouma, T.J.; Crowe, T.P.; Davoult, D.; Guizien, K.; et al. Harnessing positive species interactions as a tool against climate-driven loss of coastal biodiversity. PLoS Biol. 2018, 16, e2006852. [Google Scholar] [CrossRef]
  42. Albakosh, M.A.; Naidoo, R.K.; Kirby, B.; Bauer, R. Identification of epiphytic bacterial communities associated with the brown alga Splachnidium rugosum. Environ. Boil. Fishes 2015, 28, 1891–1901. [Google Scholar] [CrossRef]
  43. Muñoz, C.; Hidalgo, C.; Zapata, M.; Jeison, D.; Riquelme, C.; Rivas, M. Use of Cellulolytic Marine Bacteria for Enzymatic Pretreatment in Microalgal Biogas Production. Appl. Environ. Microbiol. 2014, 80, 4199–4206. [Google Scholar] [CrossRef] [PubMed] [Green Version]
Figure 1. Dendrogram derived from hierarchical agglomerative clustering with group average linkage from Bray–Curtis similarities calculated from FAME proportions and ratios for each species and thallus parts averaged across replicates. Solid lines indicate significantly different samples and groups of samples (p < 0.05) and dashed lines indicate groups of samples for which the null hypothesis could not be rejected (p > 0.05), as identified by type 1 similarity profile routine (SIMPROF). C. crinita apical parts—CRI_ap, C. crinita branches—CRI_br, C. crinita cauloids—CRI_caul, T. barbata apical parts—BAR_ap, T. barbata branches—BAR_br, T. barbata cauloids—BAR_caul, C. compressa receptacles—COM_rec, C. compressa branches—COM_br, C. compressa cauloids—COM_caul. (Group A:COM_caul, COM_br; group B: CRI_br, Bar_br, COM_rec; Group C: BARB_ap, CRI_caul, BARB_caul, CRI_ap)
Jmse 08 00967 g001
Figure 2. Shade plot of the relative abundance of classes or families represented by > 50 operational taxonomic units (OTUs) per sample, in microbial phycosphere samples of C. crinita and T. barbata (cauloids, branches, apical parts) and C. compressa (receptacles).
Jmse 08 00967 g002
Figure 3. Dendrogram derived by hierarchical agglomerative clustering with the group average from Bray–Curtis similarities calculated from OTU data obtained by Illumina sequencing of the epiphytic bacterial community genome. Solid lines indicate significantly different samples and groups of samples (p < 0.05) and dashed lines indicate groups of samples for which the null hypothesis could not be rejected (p > 0.05), as identified by type 1 SIMPROF.(Group A:CRI_br, COM_rec, BARB_ap, BARB_br; Group B: CRI_caul, BARB_caul, CRI_ap)
Jmse 08 00967 g003
Figure 4. Nonmetric multidimensional scaling analysis using pairwise Bray–Curtis similarity values estimated from (a) OTU sequence abundance datasets and (b) fatty acid biomarkers. Group average similarity values of clusters with significant differences, indicated by CLUSTER analysis (p < 0.05 by the SIMPROF test), were overlaid on the nonmetric multidimensional scaling (nMDS) plot.
Jmse 08 00967 g004
Table 1. Total lipid content (mg/g d.w.) and fatty acid profiles (%) of Carpodesmia crinita cauloids, branches, apical parts and receptacles (SFA—sum of saturated fatty acids, MUFA—sum of monounsaturated fatty acids, PUFA—sum of polyunsaturated fatty acids, UND—unsaturation indeks, AV—average value, sd—standard deviation, d.w. – dry weight).
Carpodesmia crinita
Fatty Acid Methyl EsterCauloidBranchesApical Parts
AV± sdAV± sdAV± sd
C14:1------
C14:016.730.058.972.748.560.78
C15:0 iso0.110.170.320.070.340.12
C15:0 ante 0.10
C15:00.790.091.000.160.750.01
C16:15.031.103.630.283.030.31
C16:024.750.4235.909.2523.379.91
C17:0 iso--0.22-0.310.12
C17:0 ante--0.09-0.05-
C17:10.140.110.190.070.540.66
C17:00.380.130.470.070.530.21
C18:3(n-3)0.480.362.702.203.531.07
C18:2(n-6)0.740.566.629.532.201.29
C18:130.403.2314.0812.1322.584.95
C18:01.850.783.660.813.753.55
C20:4(n-6)8.381.468.513.9813.825.57
C20:5(n-3)2.000.605.463.635.392.17
C20:3(n-3)2.830.781.881.013.251.58
C20:2(n-6)0.660.290.450.040.740.11
C20:10.090.140.030.050.290.15
C20:01.381.281.010.480.950.39
C22:4(n-6)----0.09-
C22:6(n-3)--0.130.200.270.37
C22:4(n-3)0.09---0.100.09
C22:2(n-6)----0.10-
C22:10.320.49----
C22:00.220.280.640.220.540.33
SFA46.210.5252.3713.6639.1412.41
MUFA35.993.5917.9311.7426.444.45
PUFA15.184.0425.751.5229.499.67
Bacterial1.420.272.380.232.521.11
n-6/n-33.34-2.671.741.910.26
UND2.730.192.922.224.322.93
Total lipids (mg/g d.w.)11.602.0310.491.9010.223.20
Table 2. Total lipid content (mg/g d.w.) and fatty acid profiles (%) of Treptacantha barbata, branches, apical parts and receptacles
Treptacantha barbata
Fatty Acid Methyl EsterCauloidBranchesApical Parts
AV± sdAV± sdAV± sd
C14:1------
C14:09.442.496.980.688.801.70
C15:0 iso0.070.070.110.150.160.05
C15:0 ante0.020.03----
C15:00.750.290.760.210.540.13
C16:12.390.392.250.301.470.46
C16:032.0110.3539.821.9129.364.89
C17:0 iso0.140.13----
C17:0 ante0.030.03----
C17:10.190.100.590.490.350.18
C17:00.390.180.210.140.250.08
C18:3(n-3)0.720.481.610.221.190.79
C18:2(n-6)1.962.202.840.820.930.48
C18:125.2511.1122.752.6725.129.16
C18:02.211.071.600.361.050.29
C20:4(n-6)7.924.547.330.549.135.51
C20:5(n-3)1.531.533.451.011.791.19
C20:3(n-3)2.321.881.080.721.850.94
C20:2(n-6)0.690.350.670.170.670.28
C20:1----0.170.05
C20:00.750.240.820.280.650.34
C22:4(n-6)------
C22:6(n-3)------
C22:4(n-3)0.030.05----
C22:2(n-6)------
C22:1------
C22:00.430.140.290.190.190.06
SFA46.2311.0950.583.1841.007.52
MUFA27.8311.5725.592.6027.119.69
PUFA15.176.6016.980.9915.579.20
Bacterial1.590.441.670.491.300.26
n-6/n-32.210.192.060.752.470.37
UND2.041.191.740.192.371.35
Total lipids (mg/g d.w.)6.310.427.231.357.492.59
Table 3. Total lipid content (mg/g d.w.) and fatty acid profiles (%) of Cystoseira compressa branches, apical parts and receptacles
Cystoseira compressa
Fatty Acid Methyl EsterCauloidOld BranchesReceptacle
AV± sdAV± sdAV± sd
C14:1 0.280.410.250.38
C14:011.920.999.503.786.572.90
C15:0 iso 0.200.20
C15:0 ante
C15:01.581.060.900.200.590.05
C16:10.330.441.851.333.331.69
C16:065.816.6871.393.3548.4117.13
C17:0 iso
C17:0 ante
C17:1 0.110.110.560.45
C17:01.240.820.600.150.250.17
C18:3(n-3) 1.071.07
C18:2(n-6) 0.080.123.393.07
C18:10.170.223.081.3816.765.51
C18:016.263.664.621.882.700.86
C20:4(n-6) 5.854.73
C20:5(n-3) 2.821.64
C20:3(n-3) 1.751.82
C20:2(n-6) 0.810.53
C20:1 0.320.410.040.05
C20:01.440.961.790.021.610.87
C22:4(n-6)
C22:6(n-3)
C22:4(n-3) 0.050.07
C22:2(n-6)
C22:1 0.090.14
C22:01.200.800.960.130.630.20
SFA99.450.7389.95334.0060.7515.93
MUFA0.500.675.723.1620.935.43
PUFA 0.080.1215.7510.70
Bacterial2.821.881.810.431.400.63
n-6/n-3 2.250.69
UND0.010.010.070.041.671.24
Total lipids (mg/g d.w.)6.980.989.480.387.602.73
Publisher’s Note: MDPI stays neutral with regard to jurisdictional claims in published maps and institutional affiliations.

