Above and below: Military Aircraft Noise in Air and under Water at Whidbey Island, Washington

 ,
,  ,
,  , , and
Abstract
:1. Introduction
2. Methods
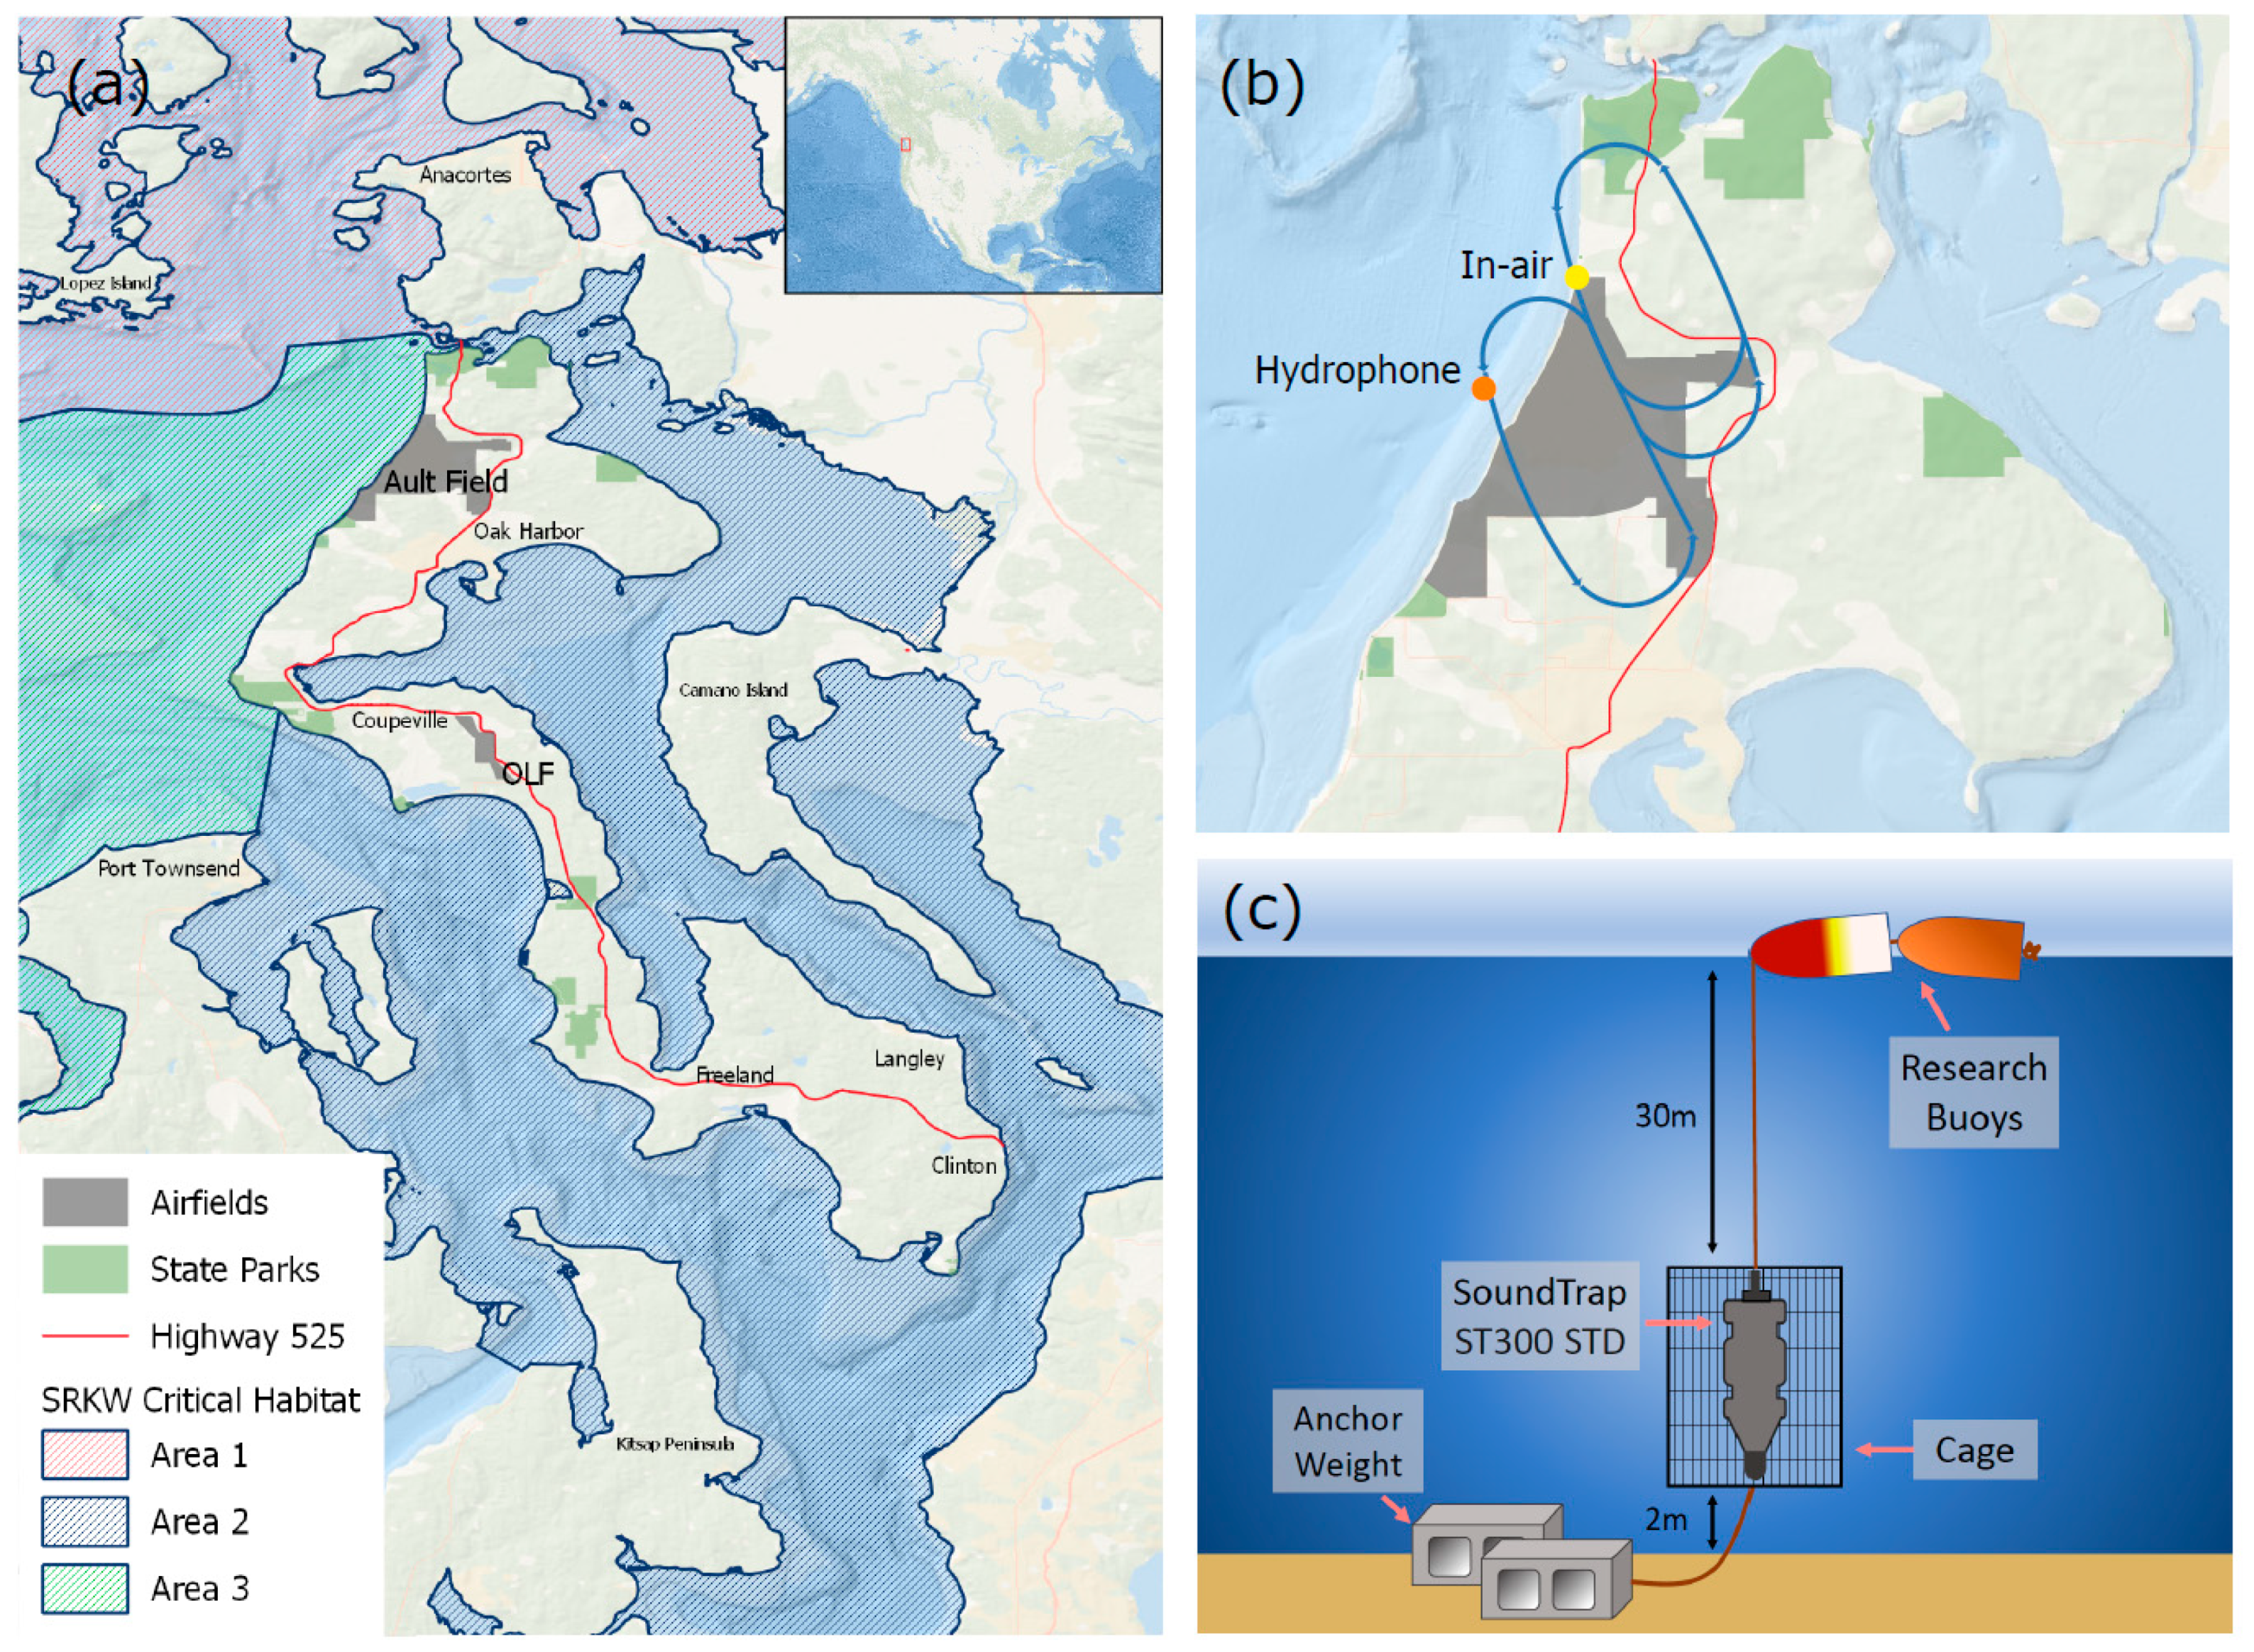
2.1. Study Area
2.2. In-Air Acoustic Data Collection
2.3. Underwater Acoustic Data Collection
2.4. Data Analysis
2.5. Comparison of Sound Levels and Flight Activity with Prior Studies
3. Results
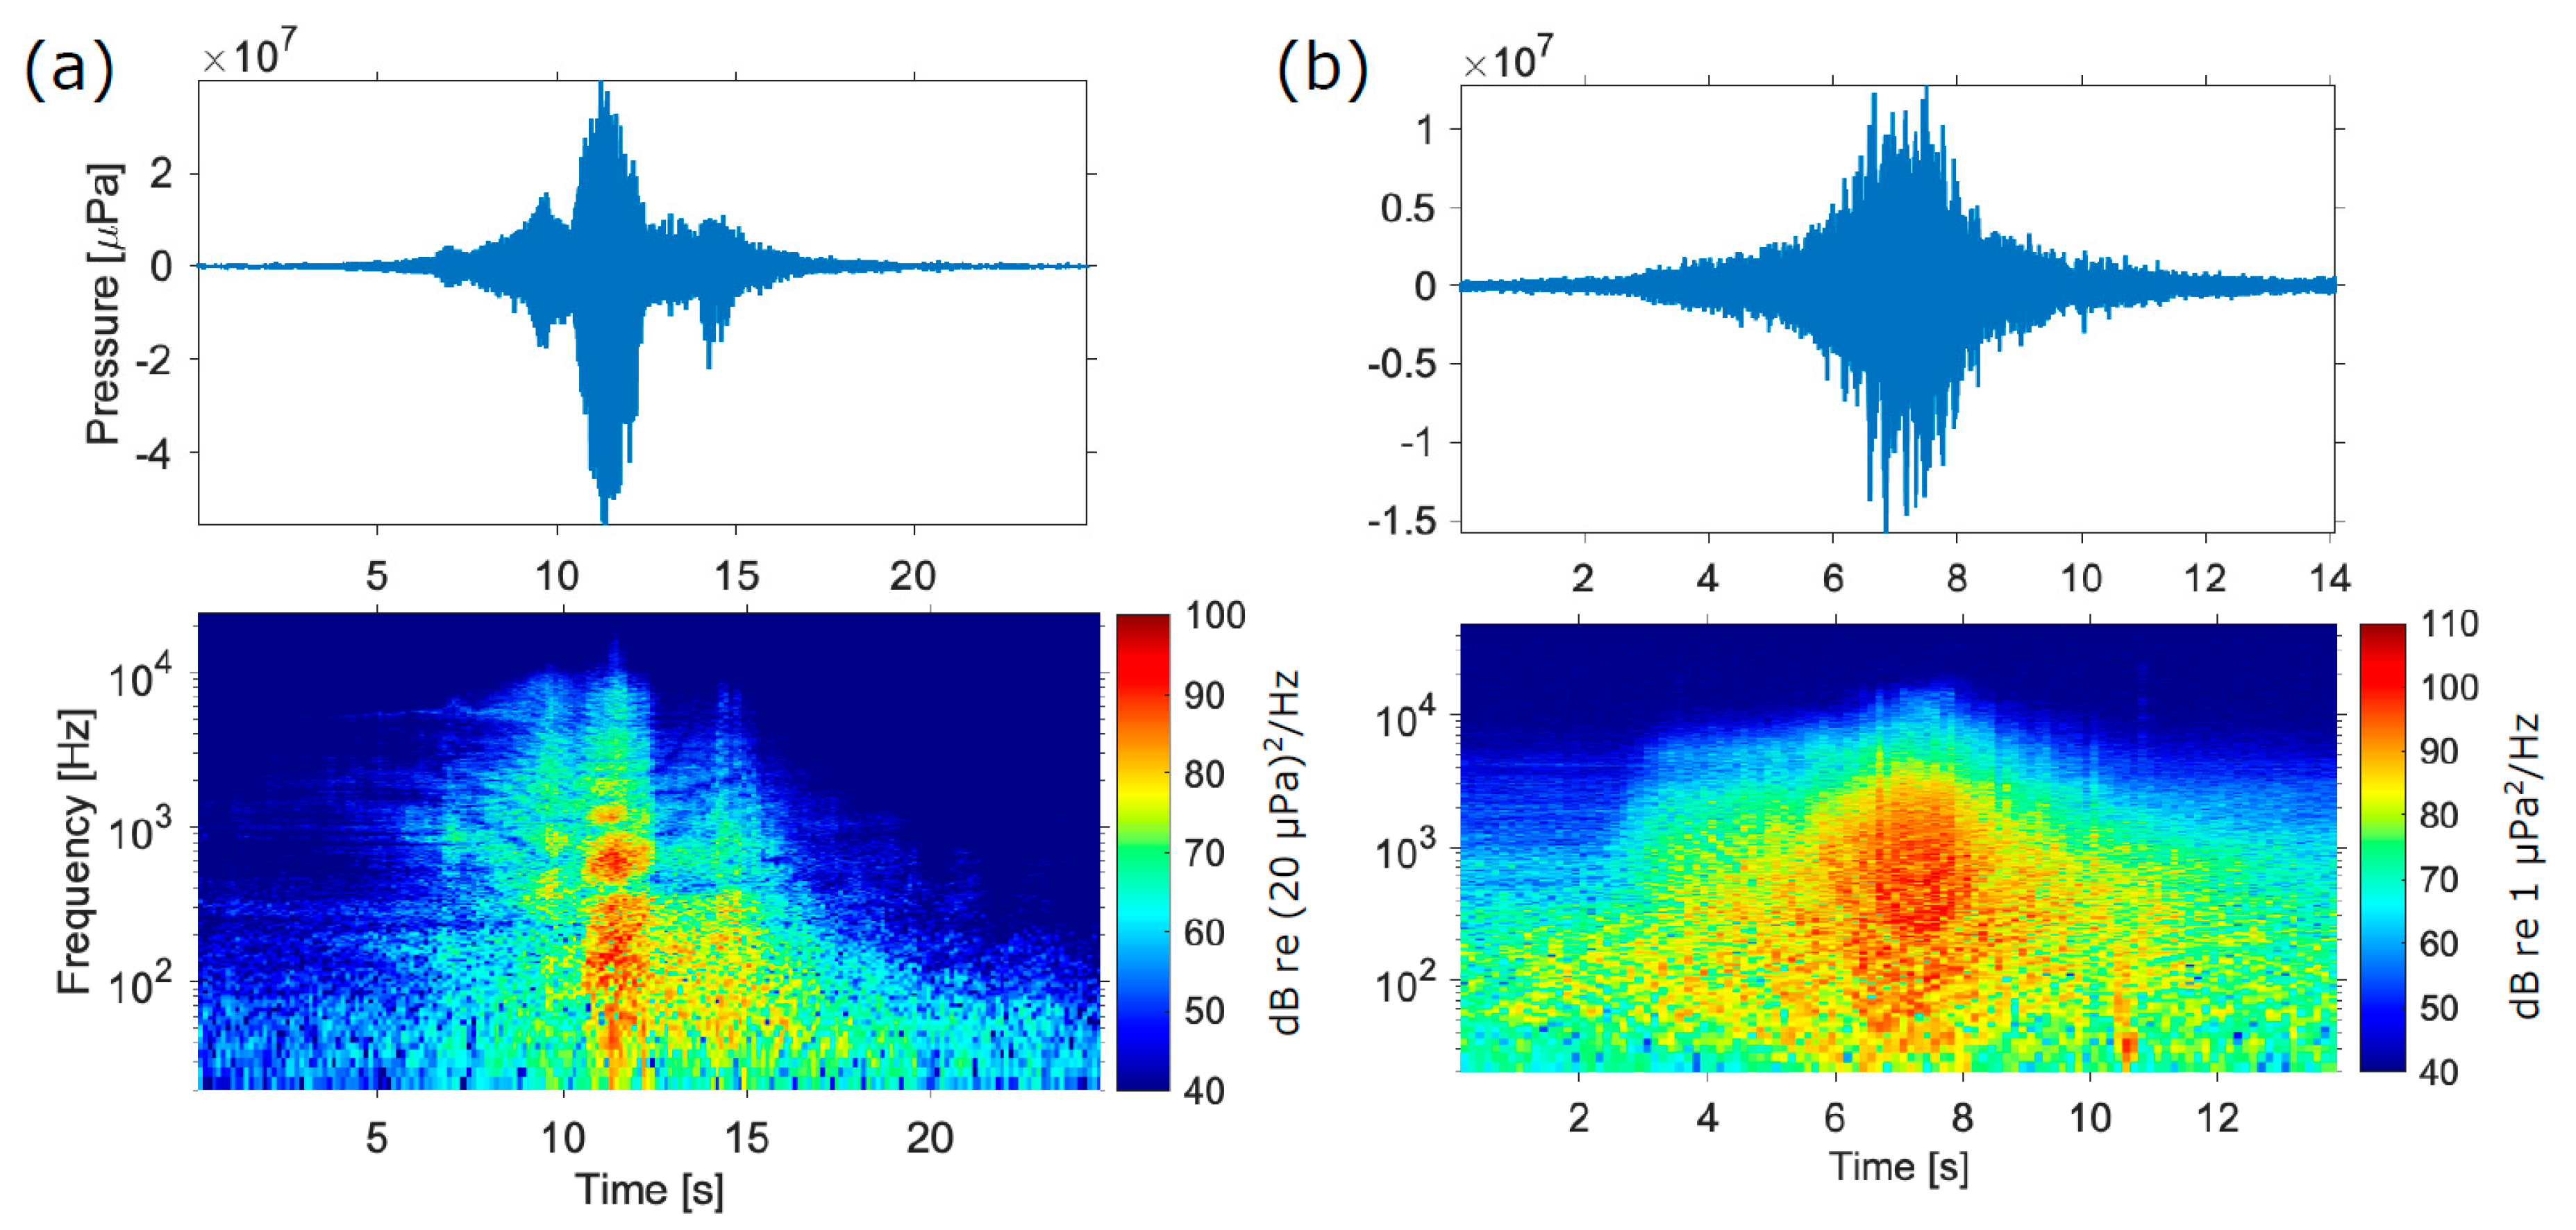
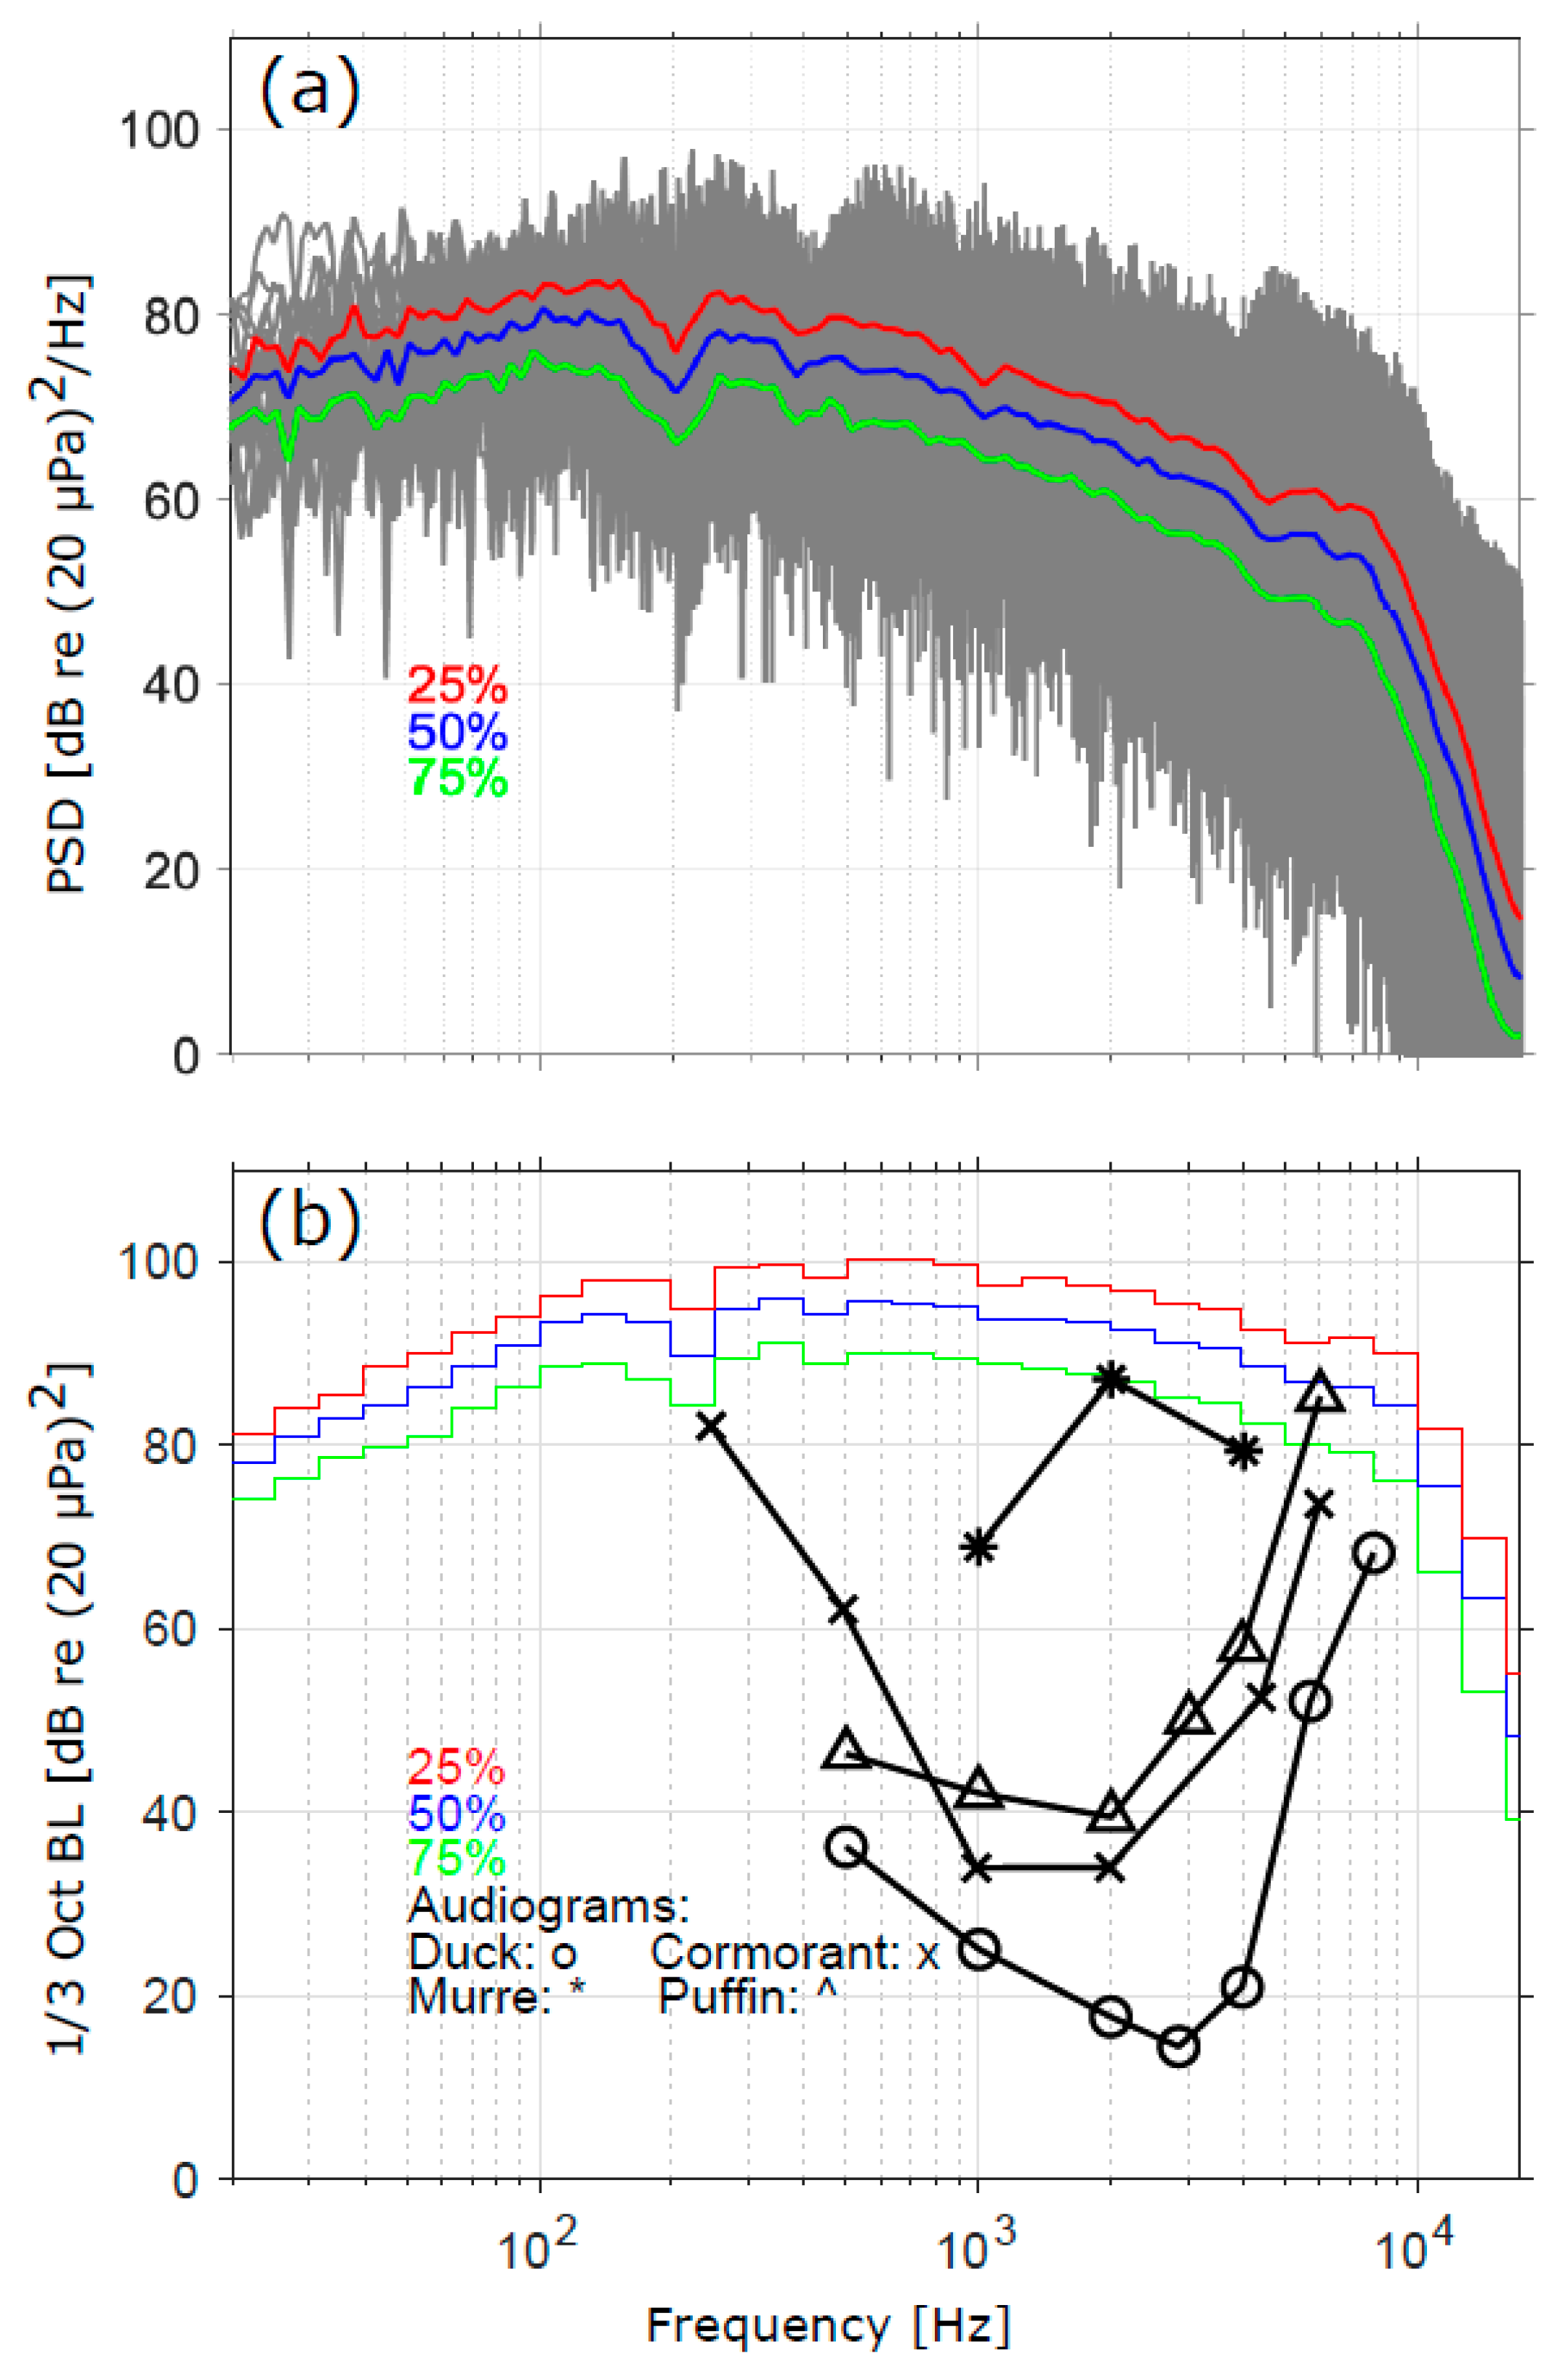
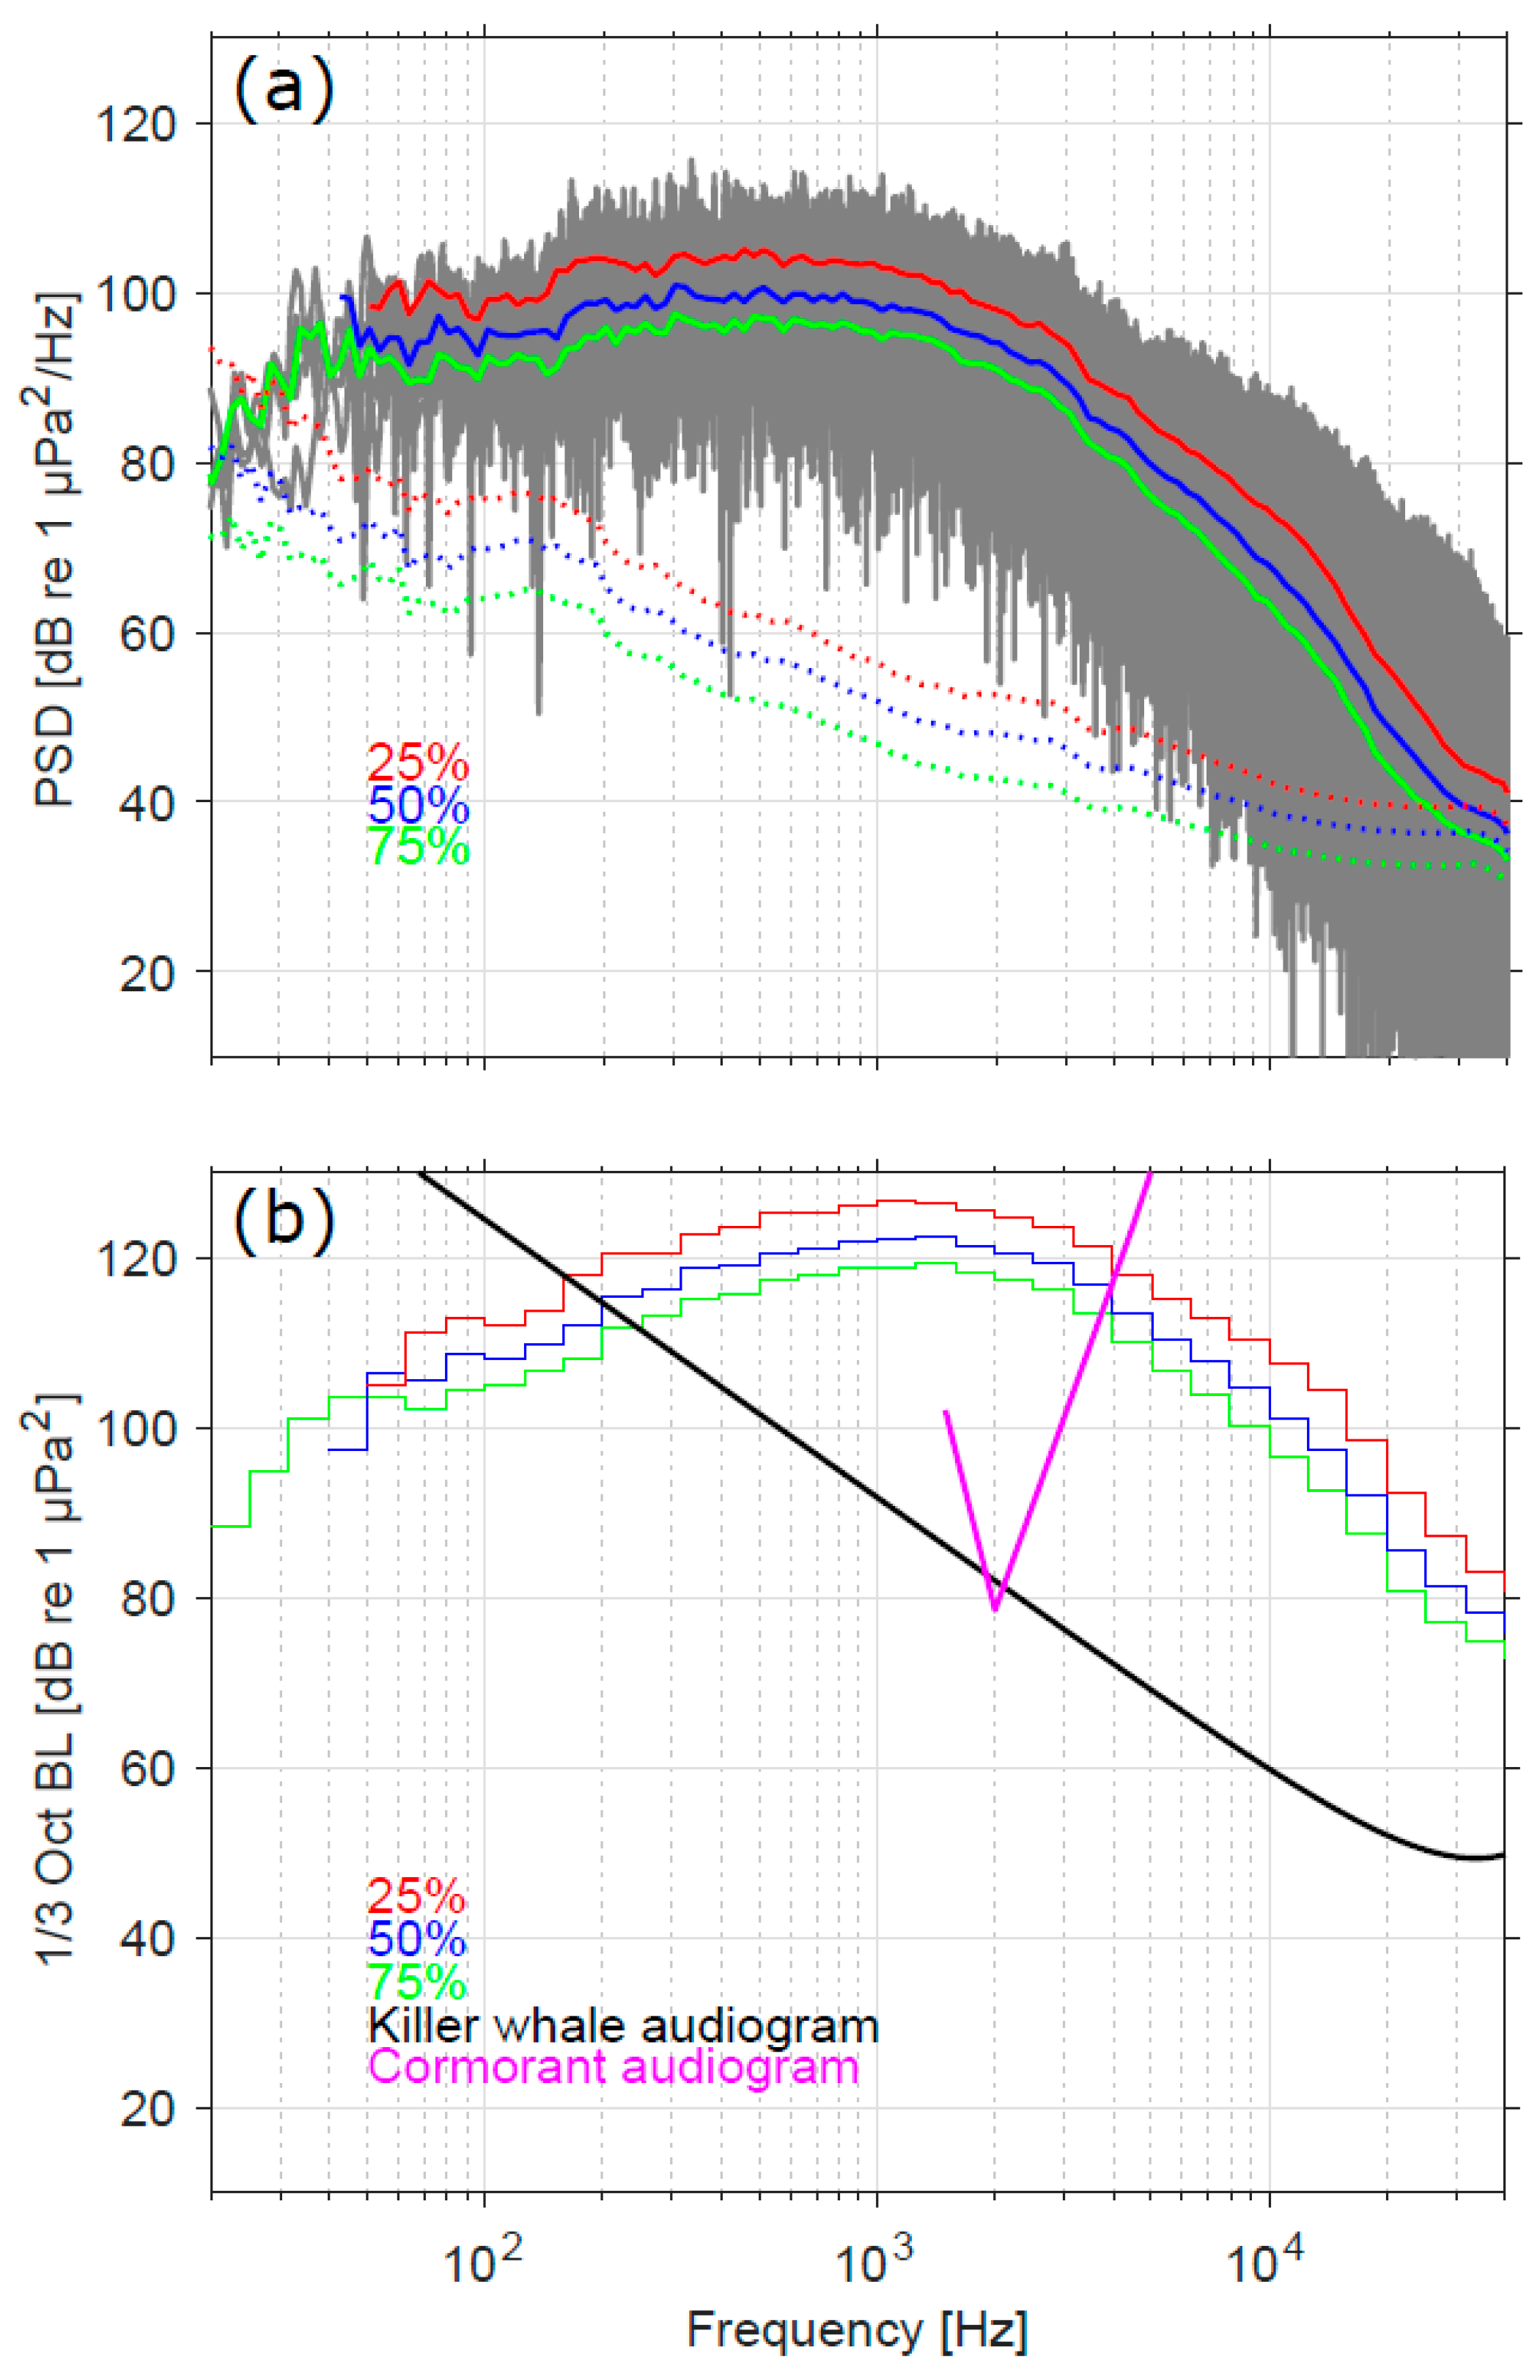
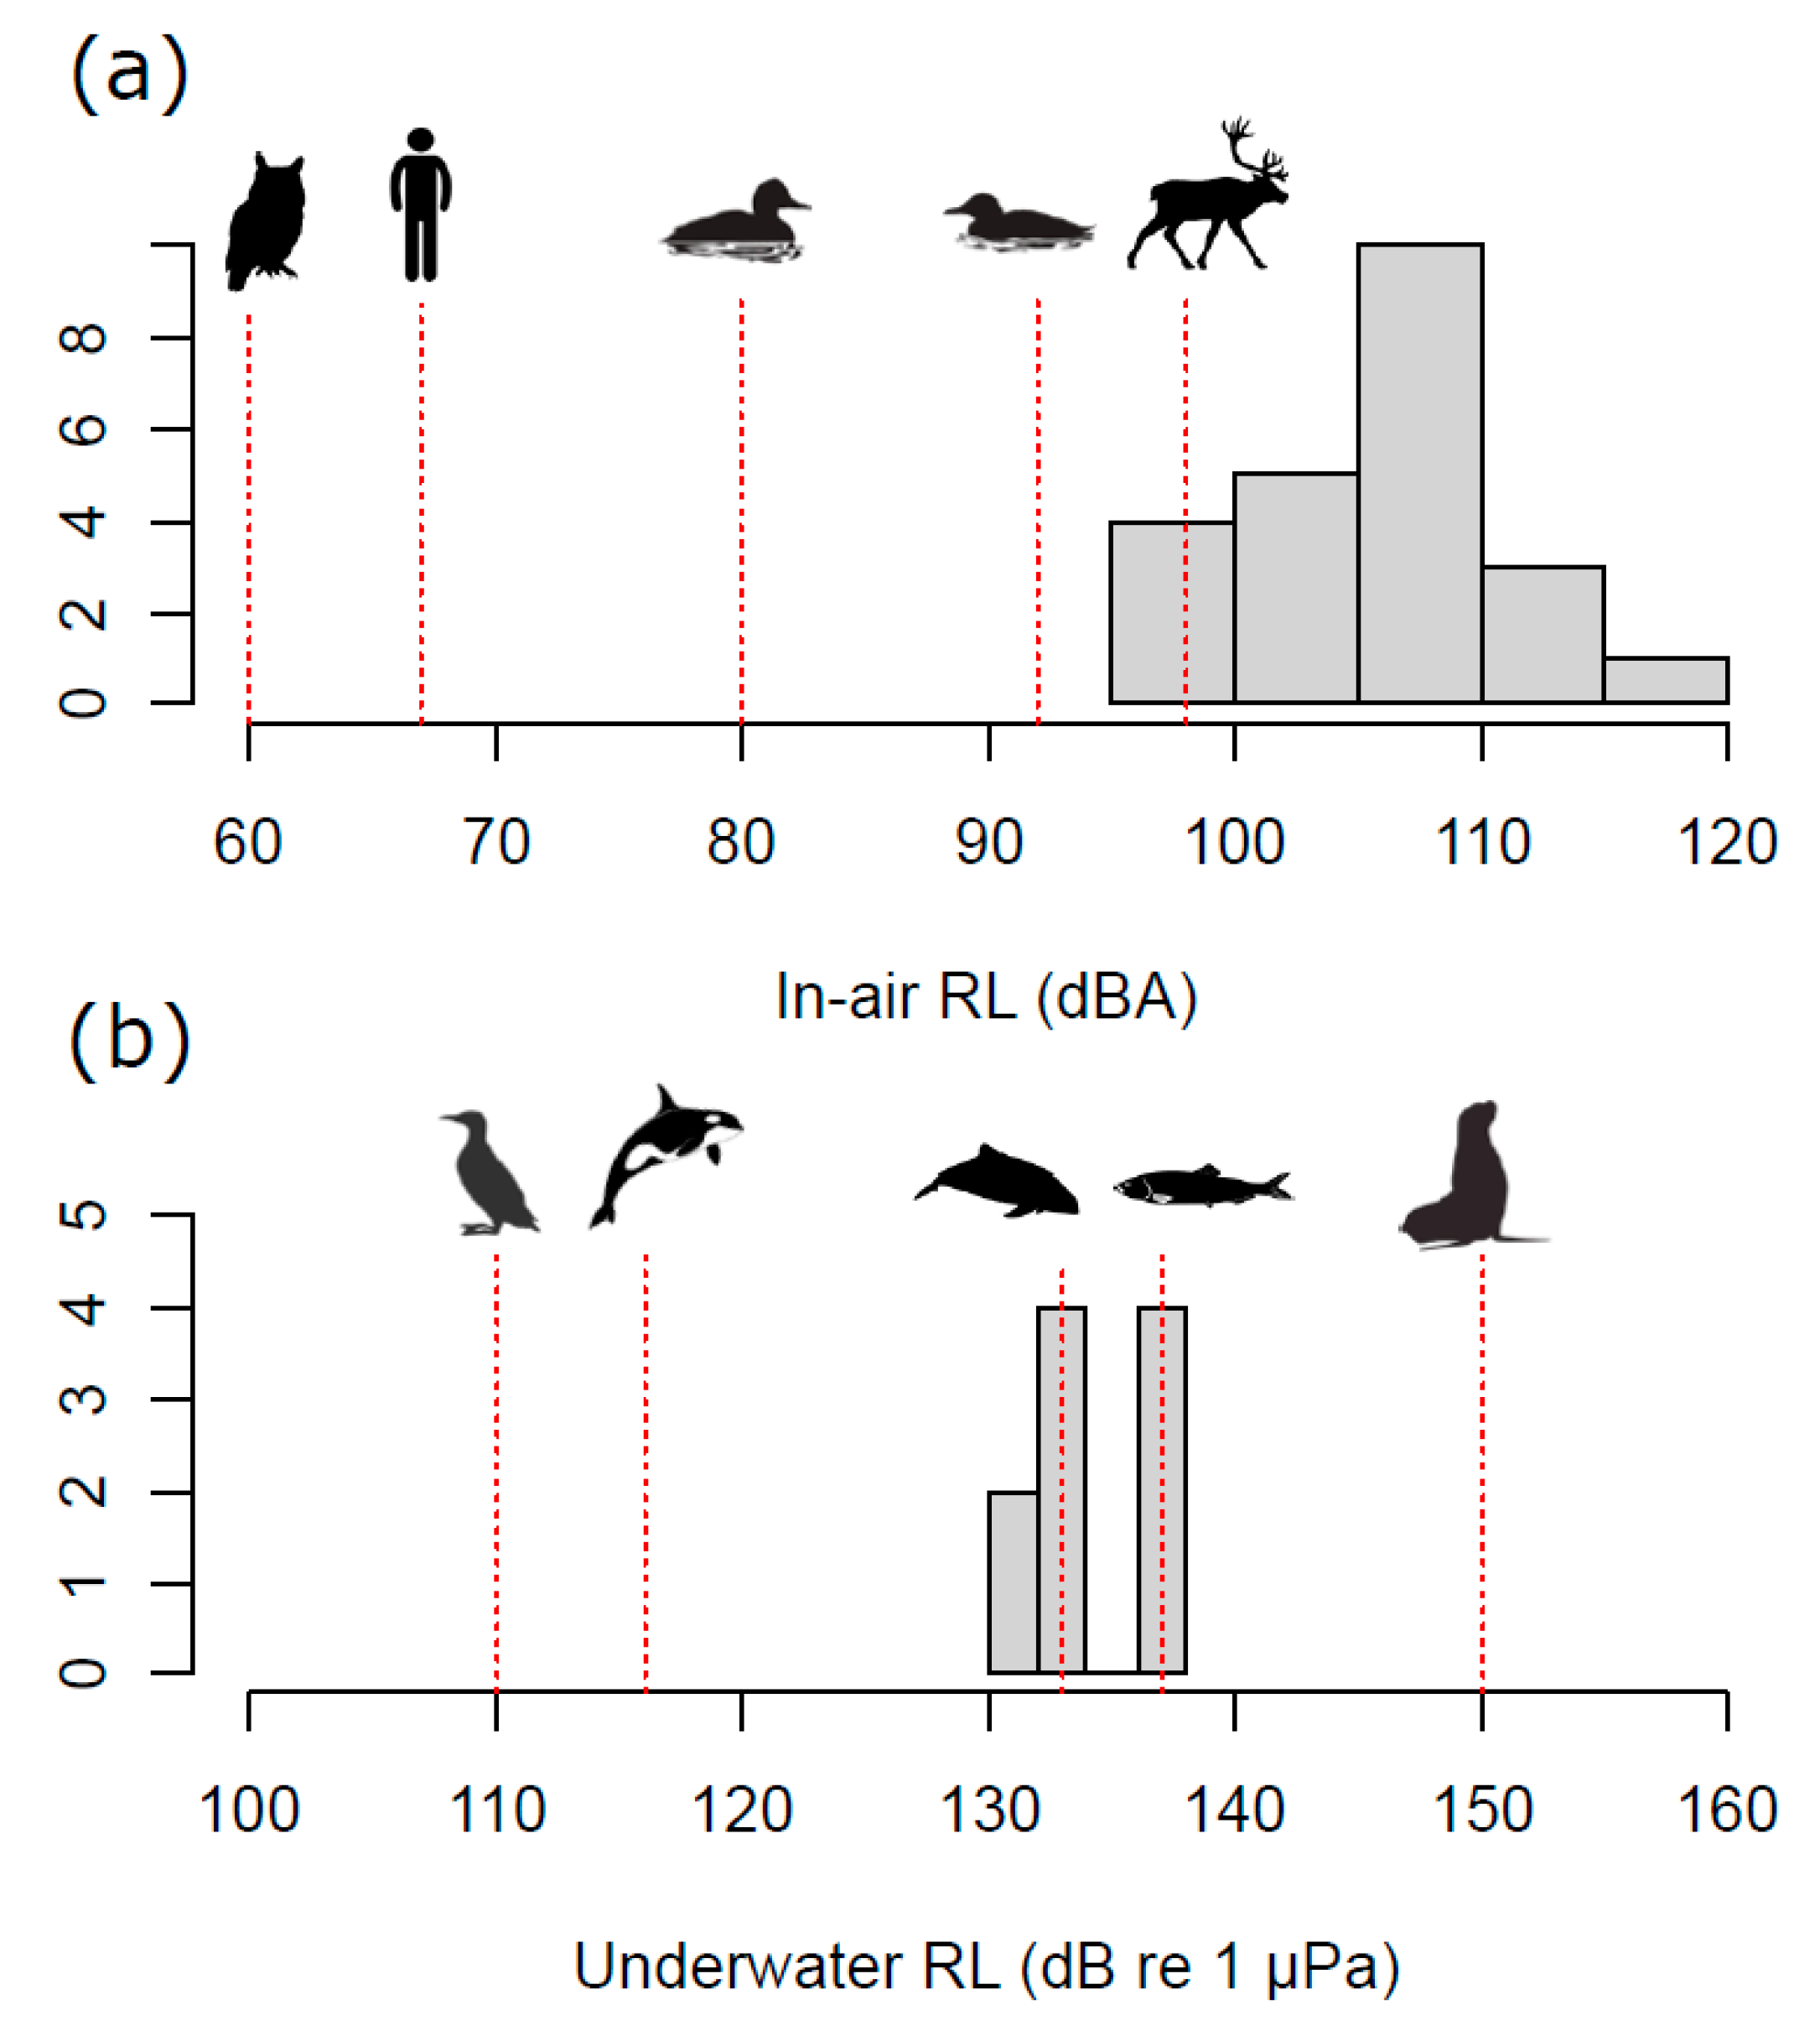
3.1. Sound Levels, Audibility, and Response Thresholds
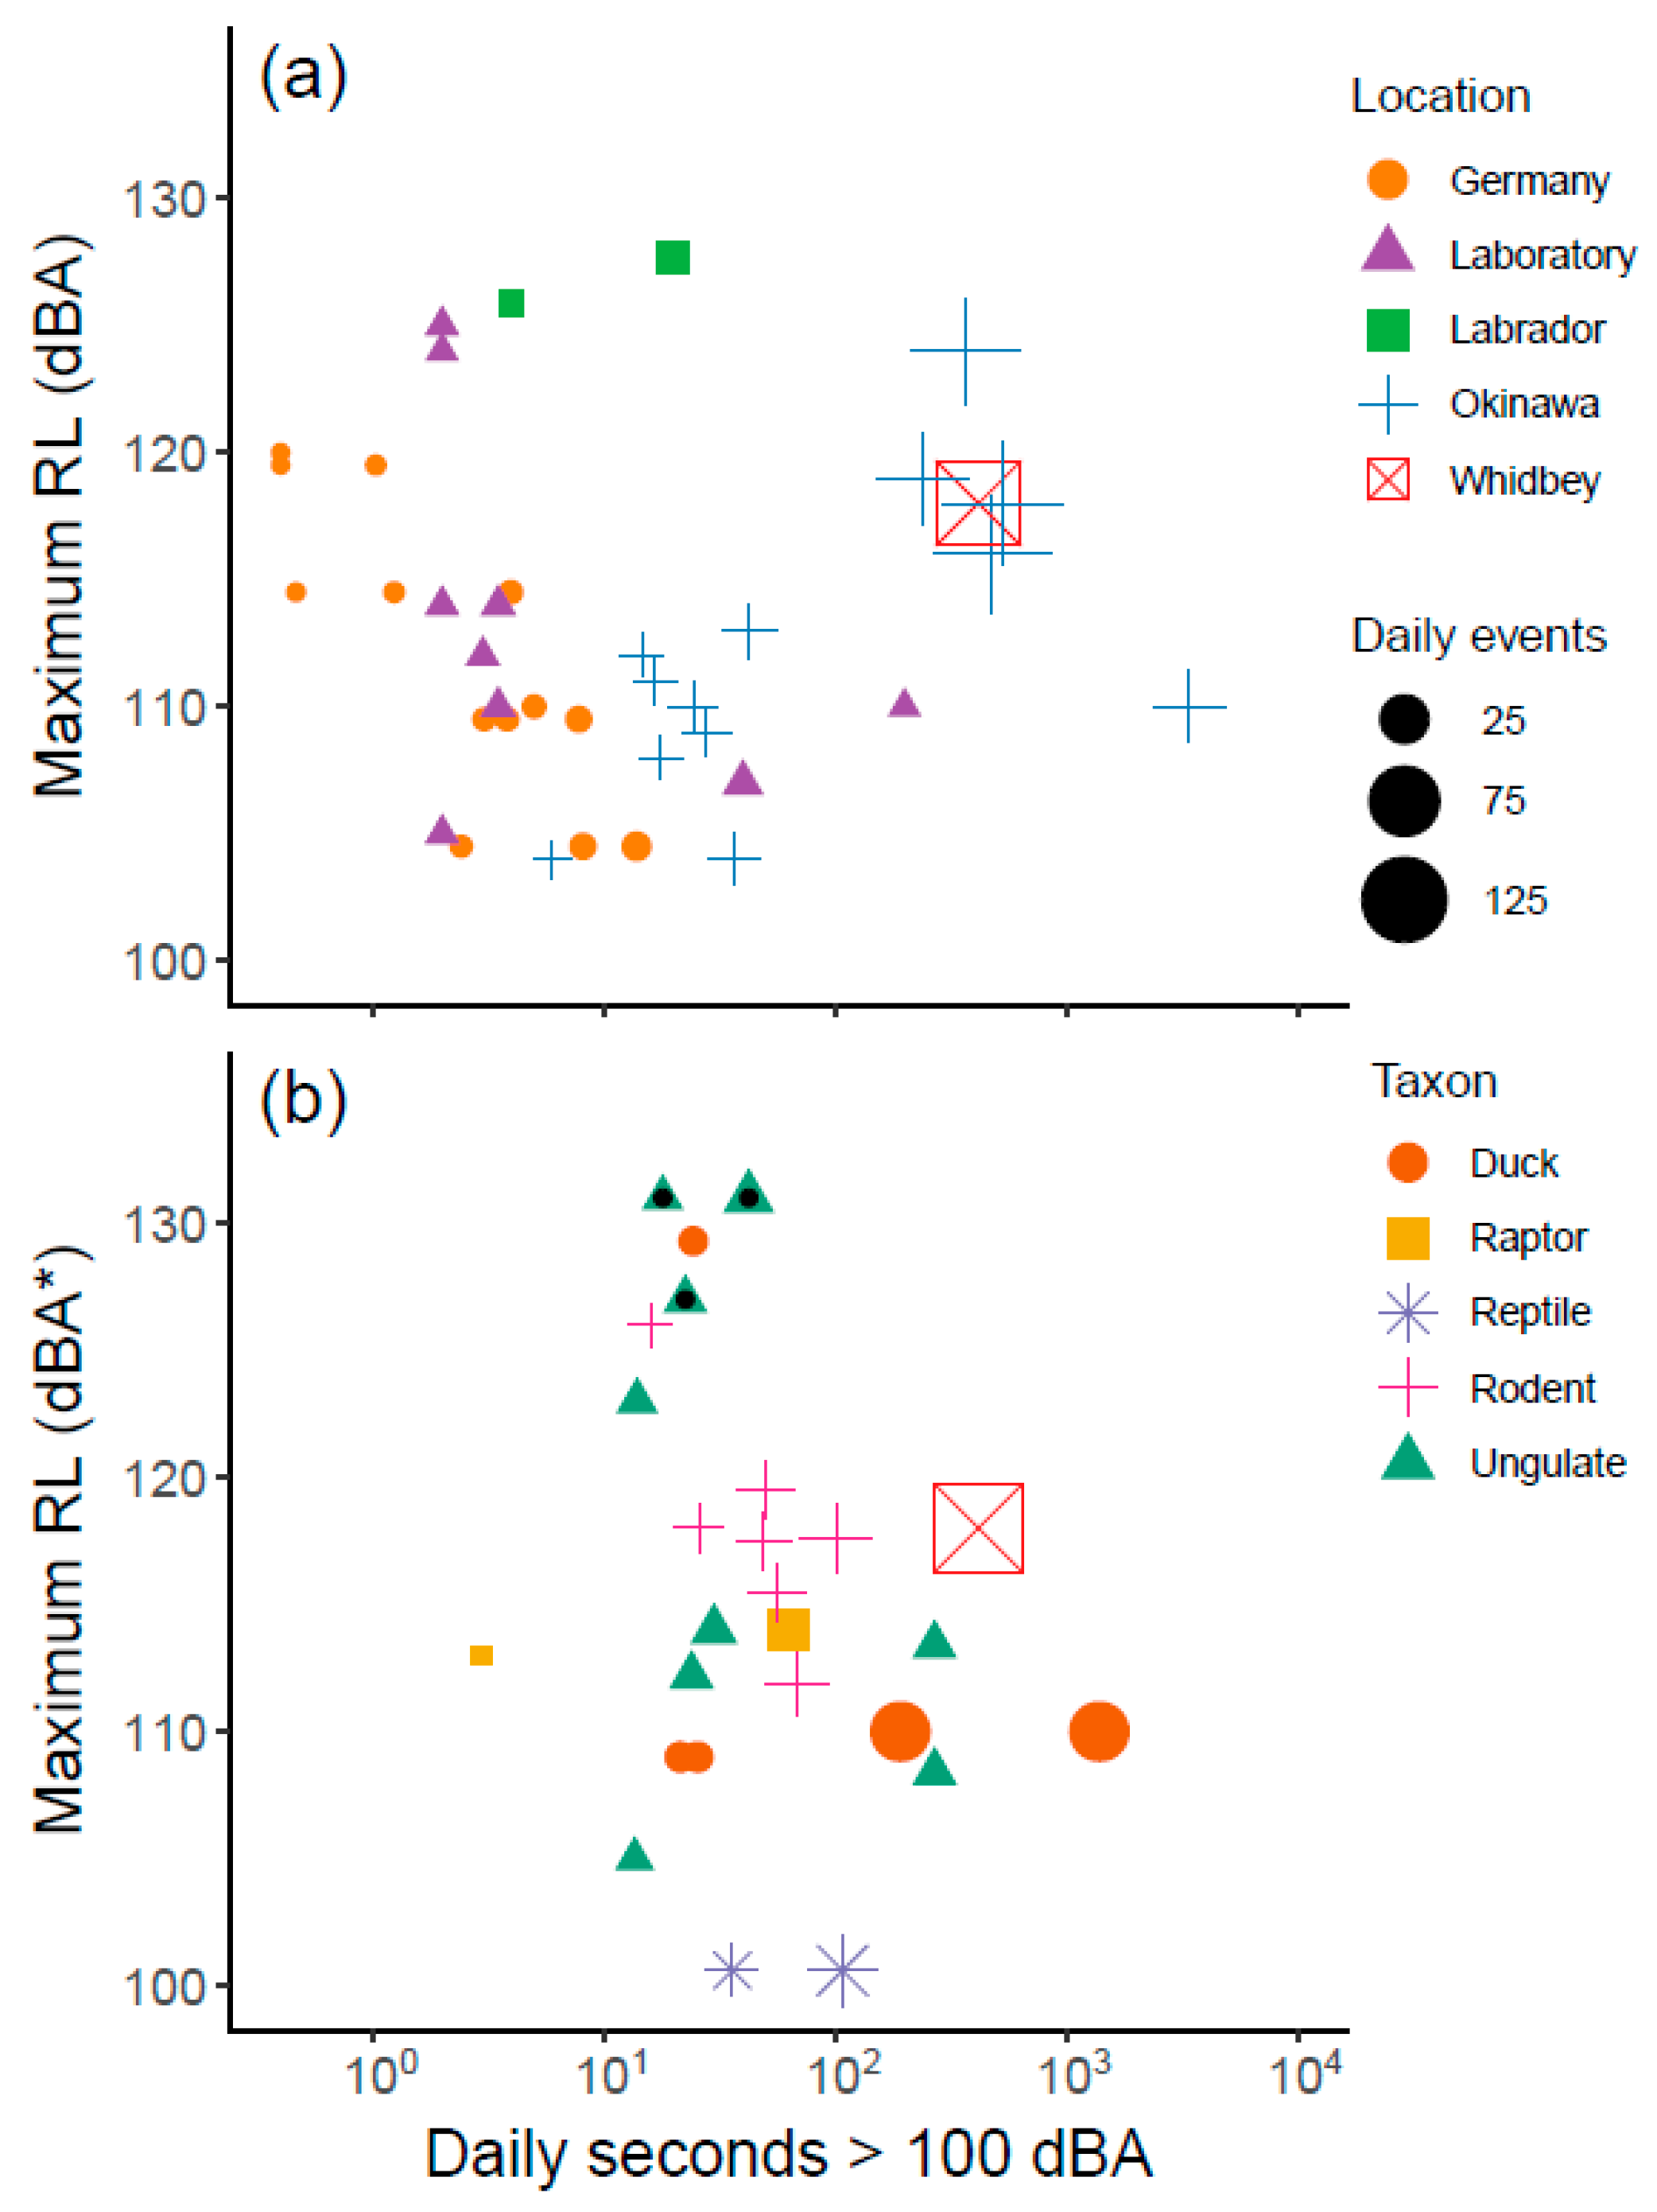
3.2. Comparison of Sound Levels and Flight Activity with Prior Studies
4. Discussion
Supplementary Materials
Author Contributions
Funding
Acknowledgments
Conflicts of Interest
References
- US Department of the Navy. Record of Decision for the Final Environmental Impact Statement for EA-18G “Growler” Airfield Operations at Naval Air Station Whidbey Island Complex, Island County, WA; United States Department of the Navy: Washington, DC, USA, 2019.
- Waitz, I.A.; Lukachko, S.P.; Lee, J.J. Military aviation and the environment: Historical trends and comparison to civil aviation. J. Aircr. 2005, 42, 329–339. [Google Scholar] [CrossRef]
- Pepper, C.B.; Nascarella, M.A.; Kendall, R.J. A review of the effects of aircraft noise on wildlife and humans, current control mechanisms, and the need for further study. Environ. Manag. 2003, 32, 418–432. [Google Scholar] [CrossRef]
- Basner, M.; Clark, C.; Hansell, A.; Hileman, J.I.; Janssen, S.; Shepherd, K.; Sparrow, V. Aviation noise impacts: State of the science. Noise Health 2017, 19, 41–50. [Google Scholar]
- Truban, E. Military exemptions from environmental regulations: Unwarranted special treatment or necessary relief. Villanova Environ. Law J. 2004, 15, 139–171. [Google Scholar]
- Okinawa Prefectural Government. A Report on the Aircraft Noise as a Public Health Problem in Okinawa; Department of Culture and Environmental Affairs: Okinawa, Japan, 1999.
- Kerry, G.; Weeler, P.D.; Hempstock, T.I.; James, D.J. Impulse noise metrics and their application to noise from low flying military jet aircraft. J. Acoust. Soc. Am. 1998, 103, 2800. [Google Scholar] [CrossRef]
- Shannon, G.; McKenna, M.F.; Angeloni, L.M.; Crooks, K.R.; Fristrup, K.M.; Brown, E.; Warner, K.A.; Nelson, M.D.; White, C.; Briggs, J.; et al. A synthesis of two decades of research documenting the effects of noise on wildlife: Effects of anthropogenic noise on wildlife. Biol. Rev. 2016, 91, 982–1005. [Google Scholar] [CrossRef] [PubMed]
- Efroymson, R.A.; Suter, G.W., II. Ecological risk assessment framework for low-altitude aircraft overflights: II. Estimating effects on wildlife. Risk Anal. 2001, 21, 263–274. [Google Scholar] [CrossRef] [PubMed]
- Kuehne, L.; Olden, J. Military flights threaten the wilderness soundscapes of the Olympic Peninsula, Washington. Northwest Sci. 2020, 94, 188–202. [Google Scholar]
- Erbe, C.; Williams, R.; Parsons, M.; Parsons, S.K.; Hendrawan, I.G.; Dewantama, I.M.I. Underwater noise from airplanes: An overlooked source of ocean noise. Mar. Pollut. Bull. 2018, 137, 656–661. [Google Scholar] [CrossRef]
- Williams, R.; Erbe, C.; Dewantama, I.M.I.; Hendrawan, I.G. Effect on ocean noise: Nyepi, a Balinese day of silence. Oceanography 2018, 31, 16–18. [Google Scholar] [CrossRef] [Green Version]
- Eller, A.I.; Cavanagh, R.C. Subsonic Aircraft Noise at and Beneath the Ocean Surface: Estimation of Risk for Effects on Marine Mammals; Science Applications International Corporation: McLean, VA, USA, 2000. [Google Scholar]
- Ashe, E.; Noren, D.P.; Williams, R. Animal behaviour and marine protected areas: Incorporating behavioural data into the selection of marine protected areas for an endangered killer whale population. Anim. Conserv. 2010, 13, 196–203. [Google Scholar] [CrossRef]
- Kunc, H.P.; Schmidt, R. The effects of anthropogenic noise on animals: A meta-analysis. Biol. Lett. 2019, 15, 20190649. [Google Scholar] [CrossRef] [PubMed]
- Francis, C.D.; Barber, J.R. A framework for understanding noise impacts on wildlife: An urgent conservation priority. Front. Ecol. Environ. 2013, 11, 305–313. [Google Scholar] [CrossRef] [Green Version]
- US Department of the Navy. Final Environmental Impact Statement for EA-18G Growler Airfield Operations at Naval Air Station Whidbey Island Complex; United States Department of the Navy: Washington, DC, USA, 2018.
- US Department of the Navy. Flight Operations Notification for NAS Whidbey Island Complex. Available online: https://www.cnic.navy.mil/regions/cnrnw/installations/nas_whidbey_island/news/news_releases/field-carrier-landing-practice-at-nas-whidbey-island-complex-for.html (accessed on 20 June 2020).
- US Fish and Wildlife Service. Biological Opinion: Naval Air Station Whidbey Island Complex EA-18G “Growler” Airfield Operations Project; United States Fish and Wildlife Service: Washington, DC, USA, 2018.
- International Organization for Standardization. International ISO Standard 18405, Underwater Acoustics—Terminology, 1st ed.; International Organization for Standardization: Geneva, Switzerland, 2017. [Google Scholar]
- Branstetter, B.K.; Leger, J.S.; Acton, D.; Stewart, J.; Houser, D.; Finneran, J.J.; Jenkins, K. Killer whale (Orcinus orca) behavioral audiograms. J. Acoust. Soc. Am. 2017, 141, 2387–2398. [Google Scholar] [CrossRef]
- Erbe, C.; Reichmuth, C.; Cunningham, K.; Lucke, K.; Dooling, R. Communication masking in marine mammals: A review and research strategy. Mar. Pollut. Bull. 2016, 103, 15–38. [Google Scholar] [CrossRef] [PubMed]
- Johansen, S.; Larsen, O.N.; Christensen-Dalsgaard, J.; Seidelin, L.; Huulvej, T.; Jensen, K.; Lunneryd, S.-G.; Boström, M.; Wahlberg, M. In-air and underwater hearing in the great cormorant (Phalacrocorax carbo sinensis). In Effects of Noise on Aquatic Life II; Springer: Berlin/Heidelberg, Germany, 2016; pp. 505–512. [Google Scholar]
- Crowell, S.E.; Wells-Berlin, A.M.; Therrien, R.E.; Yannuzzi, S.E.; Carr, C.E. In-air hearing of a diving duck: A comparison of psychoacoustic and auditory brainstem response thresholds. J. Acoust. Soc. Am. 2016, 139, 3001–3008. [Google Scholar] [CrossRef]
- Mooney, T.A.; Smith, A.; Larsen, O.N.; Hansen, K.A.; Wahlberg, M.; Rasmussen, M.H. Field-based hearing measurements of two seabird species. J. Exp. Biol. 2019, 222. [Google Scholar] [CrossRef] [Green Version]
- Okanoya, K.; Dooling, R.J. Hearing in passerine and psittacine birds: A comparative study of absolute and masked auditory thresholds. J. Comp. Psychol. 1987, 101, 7. [Google Scholar] [CrossRef]
- McKenna, M.F.; Shannon, G.; Fristrup, K. Characterizing anthropogenic noise to improve understanding and management of impacts to wildlife. Endanger Species Res. 2016, 31, 279–291. [Google Scholar] [CrossRef] [Green Version]
- Haralabidis, A.S.; Dimakopoulou, K.; Vigna-Taglianti, F.; Giampaolo, M.; Borgini, A.; Dudley, M.-L.; Pershagen, G.; Bluhm, G.; Houthuijs, D.; Babisch, W. Acute effects of night-time noise exposure on blood pressure in populations living near airports. Eur. Heart J. 2008, 29, 658–664. [Google Scholar] [CrossRef]
- Basner, M.; Buess, H.; Mueller, U.; Plath, G.; Samel, A. Aircraft noise effects on sleep: Final results of DLR laboratory and field studies of 2240 polysomnographically recorded subject nights. In Proceedings of the 33rd International Congress and Exposition on Noise Control Engineering, Prague, Czech Republic, 22–25 August 2004; pp. 22–25. [Google Scholar]
- US Fish and Wildlife Service. Biological Opinion: Navy’s Northwest Training and Testing Activities; United States Fish and Wildlife Service: Washington, DC, USA, 2016.
- Hayward, L.S.; Bowles, A.E.; Ha, J.C.; Wasser, S.K. Impacts of acute and long-term vehicle exposure on physiology and reproductive success of the northern spotted owl. Ecosphere 2011, 2, 1–20. [Google Scholar] [CrossRef]
- Delaney, D.K.; Grubb, T.G.; Beier, P.; Pater, L.L.; Reiser, M.H. Effects of helicopter noise on Mexican spotted owls. J. Wildl. Manag. 1999, 63, 60–76. [Google Scholar] [CrossRef]
- Mason, J.T.; McClure, C.J.; Barber, J.R. Anthropogenic noise impairs owl hunting behavior. Biol. Conserv. 2016, 199, 29–32. [Google Scholar] [CrossRef]
- Goudie, R.I.; Jones, I.L. Dose-response relationships of harlequin duck behaviour to noise from low-level military jet over-flights in central Labrador. Biol. Conserv. 2004, 31, 289–298. [Google Scholar] [CrossRef] [Green Version]
- Maier, J.A.; Murphy, S.M.; White, R.G.; Smith, M.D. Responses of caribou to overflights by low-altitude jet aircraft. J. Wildl. Manag. 1998, 62, 752–766. [Google Scholar] [CrossRef]
- Williams, R.; Bain, D.E.; Ford, J.K.; Trites, A.W. Behavioural responses of male killer whales to a ‘leapfrogging’ vessel. J. Cetacean Res. Manag. 2002, 4, 305–310. [Google Scholar]
- Hansen, K.A.; Hernandez, A.; Mooney, T.A.; Rasmussen, M.H.; Sørensen, K.; Wahlberg, M. The common murre (Uria aalge), an auk seabird, reacts to underwater sound. J. Acoust. Soc. Am. 2020, 147, 4069–4074. [Google Scholar] [CrossRef]
- Kastelein, R.A.; Steen, N.; Gransier, R.; Wensveen, P.J.; de Jong, C.A.F. Threshold received sound pressure levels of single 1–2 kHz and 6–7 kHz up-sweeps and down-sweeps causing startle responses in a harbor porpoise (Phocoena phocoena). J. Acoust. Soc. Am. 2012, 131, 2325–2333. [Google Scholar] [CrossRef] [PubMed]
- Doksæter, L.; Handegard, N.O.; Godø, O.R.; Kvadsheim, P.H.; Nordlund, N. Behavior of captive herring exposed to naval sonar transmissions (1.0–1.6 kHz) throughout a yearly cycle. J. Acoust. Soc. Am. 2012, 131, 1632–1642. [Google Scholar] [CrossRef]
- Houser, D.S.; Martin, S.W.; Finneran, J.J. Behavioral responses of California sea lions to mid-frequency (3250–3450 Hz) sonar signals. Mar. Environ. Res. 2013, 92, 268–278. [Google Scholar] [CrossRef]
- Gelderblom, F.B.; Gjestland, T.T.; Granoien, I.L.; Taraldsen, G. The impact of civil versus military aircraft noise on noise annoyance. In INTER-NOISE and NOISE-CON Congress and Conference Proceedings; Institute of Noise Control Engineering: Reston, VA, USA, 2014; Volume 249, pp. 786–795. [Google Scholar]
- Wu, Y.-X.; Liu, X.L.; Wang, B.-G.; Wang, X.Y. Aircraft noise-induced temporary threshold shift. Aviat. Space Environ. Med. 1989, 60, 268–270. [Google Scholar] [PubMed]
- Yong, J.S.; Wang, D.-Y. Impact of noise on hearing in the military. Mil. Med. Res. 2015, 2, 1–6. [Google Scholar] [CrossRef] [PubMed] [Green Version]
- Goudie, R.I. Multivariate behavioural response of harlequin ducks to aircraft disturbance in Labrador. Environ. Conserv. 2006, 33, 28–35. [Google Scholar] [CrossRef] [Green Version]
- Lilly, J. Whidbey Island Military Jet Noise Measurements; JGL Acoustics, Inc.: Issaquah, WA, USA, 2013. [Google Scholar]
- Lilly, J. Whidbey Island Military Jet Noise Measurements; JGL Acoustics, Inc.: Issaquah, WA, USA, 2016. [Google Scholar]
- Lilly, J. Military Jet Noise Measurements OLF Coupeville Whidbey Island, WA; JGL Acoustics, Inc.: Issaquah, WA, USA, 2020. [Google Scholar]
- Pipkin, A. Ebey’s Landing National Historical Reserve Acoustical Monitoring Report; National Park Service: Fort Collins, CO, USA, 2016.
- Hiramatsu, K.; Matsui, T.; Ito, A.; Miyakita, T.; Osada, Y.; Yamamoto, T. The Okinawa study: An estimation of noise-induced hearing loss on the basis of the records of aircraft noise exposure around Kadena Air Base. J. Sound Vib. 2004, 277, 617–625. [Google Scholar] [CrossRef]
- Miyakita, T.; Yoza, T.; Matsui, T.; Ito, A.; Hiramatsu, K.; Osada, Y.; Yamamoto, T. An epidemiological study regarding the hearing acuity of residents in the area with high level of aircraft noise. Jpn. J. Hyg. 2001, 56, 577–587. [Google Scholar] [CrossRef] [PubMed] [Green Version]
- Kuronen, P.; Pääkkönen, R.; Savolainen, S. Low-altitude overflights of fighters and the risk of hearing loss. Aviat. Space Environ. Med. 1999, 70, 650–655. [Google Scholar]
- Ising, H.; Joachims, Z.; Babisch, W.; Rebentisch, E. Effects of military low-altitude flight noise Part I: Temporary threshold shift in humans. Z. Fur Audiol. 1999, 38, 118–127. [Google Scholar]
- Matsui, T.; Uehara, T.; Miyakita, T.; Hiramatsu, K.; Yamamoto, T. Dose-response relationship between hypertension and aircraft noise exposure around Kadena airfield in Okinawa. In Proceedings of the 9th International Congress on Noise as a Public Health Problem, Foxwoods, CT, USA, 21–25 July 2008. [Google Scholar]
- Miyazaki, M. Circulatory effect of jet noise, with special reference to cerebral circulation. Jpn. Circ. J. 1978, 42, 1019–1024. [Google Scholar] [CrossRef] [Green Version]
- Ising, H.; Michalak, R. Effects of noise from military low-level flights on humans (part II. Noise as a Public Health Problem). New Adv. Noise Res. 1990, 1, 21–25. [Google Scholar]
- Ising, H.; Rebentisch, E.; Poustka, F.; Curio, I. Annoyance and health risk caused by military low-altitude flight noise. Int. Arch. Occup. Environ. Health 1990, 62, 357–363. [Google Scholar] [CrossRef]
- Lukas, J.S.; Dobbs, M.E.; Kryter, K.D. Disturbance of Human Sleep by Subsonic Jet Aircraft Noise and Simulated Sonic Booms; National Aeronautics and Space Administration: Washington, DC, USA, 1971.
- Tokuda, Y.; Barnett, P.B. Constructing a new US Military Base: A health threat to Okinawan people. Environ. Justice 2017, 10, 23–25. [Google Scholar] [CrossRef]
- Basner, M.; Babisch, W.; Davis, A.; Brink, M.; Clark, C.; Janssen, S.; Stansfeld, S. Auditory and non-auditory effects of noise on health. Lancet 2014, 383, 1325–1332. [Google Scholar] [CrossRef] [Green Version]
- Washington State Department of Health. Comments on the Environmental Impact Statement for EA-18G Growler Airfield Operations at Naval Air Station Whidbey Island; Washington State Department of Health: Tumwater, VA, USA, 2017.
- Erbe, C.; Parsons, M.; Duncan, A.; Osterrieder, S.K.; Allen, K. Aerial and underwater sound of unmanned aerial vehicles (UAV). J. Unmanned Veh. Syst. 2017, 5, 92–101. [Google Scholar] [CrossRef]
- Holt, M.M.; Noren, D.P.; Emmons, C.K. Effects of noise levels and call types on the source levels of killer whale calls. J. Acoust. Soc. Am. 2011, 130, 3100–3106. [Google Scholar] [CrossRef] [PubMed]
- Holt, M.M.; Noren, D.P.; Veirs, V.; Emmons, C.K.; Veirs, S. Speaking up: Killer whales (Orcinus orca) increase their call amplitude in response to vessel noise. J. Acoust. Soc. Am. 2009, 125, EL27–EL32. [Google Scholar] [CrossRef] [PubMed] [Green Version]
- Kastelein, R. Brief behavioral response threshold levels of a harbor porpoise (Phocoena phocoena) to five helicopter dipping sonar signals (1.33 to 1.43 kHz). Aquat. Mamm. 2013, 39, 162–173. [Google Scholar] [CrossRef]
- Kastelein, R.A.; van Heerden, D.; Gransier, R.; Hoek, L. Behavioral responses of a harbor porpoise (Phocoena phocoena) to playbacks of broadband pile driving sounds. Mar. Environ. Res. 2013, 92, 206–214. [Google Scholar] [CrossRef]
- Kastelein, R.A.; van der Heul, S.; Verboom, W.C.; Triesscheijn, R.J.; Jennings, N.V. The influence of underwater data transmission sounds on the displacement behaviour of captive harbour seals (Phoca vitulina). Mar. Environ. Res. 2006, 61, 19–39. [Google Scholar] [CrossRef]
- Malme, C.I.; Miles, P.R.; Clark, C.W.; Tyack, P.; Bird, J.E. Investigations of the Potential Effects of Underwater Noise from Petroleum Industry Activities on Migrating Gray Whale Behavior; Bolt Beranek and Newman Inc.: Cambridge, MA, USA, 1983. [Google Scholar]
- Lemon, M.; Lynch, T.P.; Cato, D.H.; Harcourt, R.G. Response of travelling bottlenose dolphins (Tursiops aduncus) to experimental approaches by a powerboat in Jervis Bay, New South Wales, Australia. Biol. Conserv. 2006, 127, 363–372. [Google Scholar] [CrossRef]
- Risch, D.; Corkeron, P.J.; Ellison, W.T.; Van Parijs, S.M. Changes in humpback whale song occurrence in response to an acoustic source 200 km away. PLoS ONE 2012, 7, e29741. [Google Scholar] [CrossRef]
- Kastelein, R.A.; Van Der Heul, S.; Verboom, W.C.; Jennings, N.; Van Der Veen, J.; de Haan, D. Startle response of captive North Sea fish species to underwater tones between 0.1 and 64 kHz. Mar. Environ. Res. 2008, 65, 369–377. [Google Scholar] [CrossRef] [PubMed] [Green Version]
- Science Applications International Corporation. Environmental Science Panel for Marbled Murrelet Underwater Noise Injury Threshold; Science Applications International Corporation: Bothell, WA, USA, 2011. [Google Scholar]
- Sørensen, K.; Neumann, C.; Dähne, M.; Hansen, K.A.; Wahlberg, M. Gentoo penguins (Pygoscelis papua) react to underwater sounds. R. Soc. Open Sci. 2020, 7, 191988. [Google Scholar] [CrossRef] [PubMed] [Green Version]
- US Department of the Navy. Northwest Training and Testing Final Supplemental Environmental Impact Statement/Overseas Environmental Impact Statement (FEIS/OEIS); United States Department of the Navy: Washington, DC, USA, 2020.
- Houghton, J.; Holt, M.M.; Giles, D.A.; Hanson, M.B.; Emmons, C.K.; Hogan, J.T.; Branch, T.A.; VanBlaricom, G.R. The relationship between vessel traffic and noise levels received by killer whales (Orcinus orca). PLoS ONE 2015, 10, e0140119. [Google Scholar] [CrossRef] [PubMed]
- Veirs, S.; Veirs, V.; Wood, J.D. Ship noise extends to frequencies used for echolocation by endangered killer whales. PeerJ 2016, 4, e1657. [Google Scholar] [CrossRef] [PubMed] [Green Version]
- Washington State Academy of Sciences. Summary of Key Research Findings about Underwater Noise and Vessel Disturbance; Washington State Academy of Sciences: Seattle, WA, USA, 2020. [Google Scholar]
- Lacy, R.C.; Williams, R.; Ashe, E.; Balcomb, K.C., III; Brent, L.J.; Clark, C.W.; Croft, D.P.; Giles, D.A.; MacDuffee, M.; Paquet, P.C. Evaluating anthropogenic threats to endangered killer whales to inform effective recovery plans. Sci. Rep. 2017, 7, 1–12. [Google Scholar] [CrossRef] [PubMed] [Green Version]
- Williams, R.; Clark, C.W.; Ponirakis, D.; Ashe, E. Acoustic quality of critical habitats for three threatened whale populations. Anim. Conserv. 2014, 17, 174–185. [Google Scholar] [CrossRef] [Green Version]
- Maxwell, S.M.; Hazen, E.L.; Bograd, S.J.; Halpern, B.S.; Breed, G.A.; Nickel, B.; Teutschel, N.M.; Crowder, L.B.; Benson, S.; Dutton, P.H. Cumulative human impacts on marine predators. Nat. Commun. 2013, 4, 1–9. [Google Scholar] [CrossRef] [Green Version]
- Williams, R.; Thomas, L.; Ashe, E.; Clark, C.W.; Hammond, P.S. Gauging allowable harm limits to cumulative, sub-lethal effects of human activities on wildlife: A case-study approach using two whale populations. Mar. Policy 2016, 70, 58–64. [Google Scholar] [CrossRef] [Green Version]
- Southall, B.L.; Finneran, J.J.; Reichmuth, C.; Nachtigall, P.E.; Ketten, D.R.; Bowles, A.E.; Ellison, W.T.; Nowacek, D.P.; Tyack, P.L. Marine mammal noise exposure criteria: Updated scientific recommendations for residual hearing effects. Aquat. Mamm. 2019, 45, 125–232. [Google Scholar] [CrossRef]
- Williams, R.; Wright, A.J.; Ashe, E.; Blight, L.K.; Bruintjes, R.; Canessa, R.; Clark, C.W.; Cullis-Suzuki, S.; Dakin, D.T.; Erbe, C. Impacts of anthropogenic noise on marine life: Publication patterns, new discoveries, and future directions in research and management. Ocean Coast. Manag. 2015, 115, 17–24. [Google Scholar] [CrossRef] [Green Version]
- Mizokami, K. The F-35 Could Make Some Neighborhoods in the U.S. Unliveable. Available online: https://www.popularmechanics.com/military/aviation/a28625774/f-35-too-loud/ (accessed on 20 September 2020).
- Verburg, S. Residents Weary of Jet Noise Worry about F-35. Available online: https://madison.com/wsj/news/local/environment/residents-weary-of-jet-noise-worry-about-f-35/article_d1a3c79a-34bb-5f65-8093-5c3c98cecae3.html (accessed on 20 September 2020).
- Cabestan, J.-P. China’s military base in Djibouti: A microcosm of China’s growing competition with the United States and new bipolarity. J. Contemp. China 2020, 29, 731–747. [Google Scholar] [CrossRef]


| Under Water | In Air | ||||||
|---|---|---|---|---|---|---|---|
| Orca whale (dBth) | Cormorant (dBth) | Duck (dBth) | Cormorant (dBth) | Murre (dBth) | Puffin (dBth) | Human (dBA) | |
| 25% | 56 | 44 | 88 | 71 | 28 | 65 | 109 |
| 50% | 54 | 42 | 84 | 69 | 25 | 63 | 107 |
| 75% | 48 | 40 | 81 | 65 | 18 | 60 | 104 |
Publisher’s Note: MDPI stays neutral with regard to jurisdictional claims in published maps and institutional affiliations. |
© 2020 by the authors. Licensee MDPI, Basel, Switzerland. This article is an open access article distributed under the terms and conditions of the Creative Commons Attribution (CC BY) license (http://creativecommons.org/licenses/by/4.0/).
Share and Cite
Kuehne, L.M.; Erbe, C.; Ashe, E.; Bogaard, L.T.; Salerno Collins, M.; Williams, R. Above and below: Military Aircraft Noise in Air and under Water at Whidbey Island, Washington. J. Mar. Sci. Eng. 2020, 8, 923. https://doi.org/10.3390/jmse8110923
Kuehne LM, Erbe C, Ashe E, Bogaard LT, Salerno Collins M, Williams R. Above and below: Military Aircraft Noise in Air and under Water at Whidbey Island, Washington. Journal of Marine Science and Engineering. 2020; 8(11):923. https://doi.org/10.3390/jmse8110923
Chicago/Turabian StyleKuehne, Lauren M., Christine Erbe, Erin Ashe, Laura T. Bogaard, Marena Salerno Collins, and Rob Williams. 2020. "Above and below: Military Aircraft Noise in Air and under Water at Whidbey Island, Washington" Journal of Marine Science and Engineering 8, no. 11: 923. https://doi.org/10.3390/jmse8110923