Article

Analysis of the Influence of Seasonal Water Column Dynamics on the Relationship between Marine Viruses and Microbial Food Web Components Using an Artificial Neural Network

1
Department of Marine Studies, University of Split, Ruđera Boškovića 37, 21000 Split, Croatia
2
Institute of Oceanography and Fisheries, Šetalište I. Meštrovića 63, 21000 Split, Croatia
*
Authors to whom correspondence should be addressed.
J. Mar. Sci. Eng. 2023, 11(3), 639; https://doi.org/10.3390/jmse11030639
Submission received: 15 February 2023 / Revised: 13 March 2023 / Accepted: 15 March 2023 / Published: 17 March 2023
(This article belongs to the Special Issue Feature Papers in Marine Biology)

Abstract

:
Artificial neural network analysis (ANN) is used to study the seasonal distribution of viruses and microbial food web (MFW) components in the open Adriatic Sea. The effect of viruses within the MFW is often overlooked, although viruses play an important role in microbial community dynamics. The results showed that the strongest influence is found in the nonlinear relationship between viruses and temperature. In addition, the algorithm showed that the number of viral populations in the P-limited open sea varies by season and according to the abundance of their main hosts, HB. A strong positive relationship between viruses and HB was found in more than 50% of the observed data. Moreover, this algorithm confirmed the association of the virus with the autotrophic part of the picoplankton and with heterotrophic nanoflagellates. The dynamics of the four resulting clusters, characterized by biological and environmental parameters, is described as a cyclic pattern in the water layer above the thermocline. Neural gas network analysis has been shown to be an excellent tool for describing changes in MFW components in the open Adriatic.

1. Introduction

In the not-so-distant past, microbial ecologists peeked into a drop of seawater and found that viruses were present in large quantities [1,2]. Today, we know very well that viruses are a highly abundant and dynamic component of the marine microbial community [3]. The most abundant viruses in the marine environment are bacterial and archaeal viruses, and it is estimated that 1023 infections of prokaryotic cells happen every second. Viruses are on average 10 times more abundant than bacteria, but the ratio of viruses to bacteria varies among different marine environments [4,5]. However, viruses are known to infect other marine microorganisms such as autotrophic picoplankton bacteria (Synechococcus and Prochlorococcus) and other picoeukaryotic microorganisms [6,7,8]. The lysis of these planktonic microorganisms has a major impact on the microbial community structure in different marine environments, thus driving microbial evolution [3,9].
Viral lysis, along with protistan grazing, account for up to 50% of the bacteria produced daily [3,10]. While grazers link bacterial carbon to higher trophic levels, viruses promote shunting or shuttling of released cell contents [11,12], thus lubricating the tiny wheels of the microbial food web [3,12,13,14,15,16,17]. These processes are an especially important source of new nutrients in the oligotrophic environment where regenerative primary production prevails, thus stimulating the growth of heterotrophic and autotrophic picoplankton [18].
Viruses themselves can be an important source of nutrients, particularly phosphorus, which is important in P-limited areas [19]. When present in larger quantities, viruses themselves can become the target of heterotrophic flagellate grazing [20,21,22].
Examination of virioplankton and its relationship with other types of microbial plankton can provide insight into the functions at the very base of the food chain [23]. To better understand the ecology of marine virioplankton, it is necessary to measure the temporal and spatial variability of viruses and compare them with other types of microbial plankton and abiotic parameters. Viral distribution varies in different marine environments, which is driven by biotic (host availability and variability) and abiotic factors such as temperature and nutrients [10,24,25]. In general, viral abundance decreases from the coast to the open seas, and with depth [26]. Changes in abundance are usually the result of changes in the viral host population, as host populations depend on the availability of nutrients as well as predation or parasitism. In oligotrophic environments, the prokaryotic population will be mostly dominated by competing specialists, and differentiation of the prokaryote population caused by resource availability affects changes in the viral population [27]. Conversely, viruses lyse the winners and keep the microbial population in balance, thus increasing diversity [28].
The open waters of the Adriatic Sea are generally considered to be an oligotrophic ecosystem with low production, where the microbial food web is the main trophic pathway and the picoplankton size fraction of the microbial community dominates the total biomass and production [29,30,31,32]. Planktonic food webs exhibit successions which are driven by water column dynamics [32,33]. In these P-limited oligotrophic waters, as indicated by an average phosphorus concentration below 0.1 μmol L−1 and N/P and Si/P ratios above 22, microbial community dynamics are determined by water column stratification [32,33,34,35].
In the past 20 years, numerous studies have been performed that describe the distribution and activity of viruses and their coupling with the microbial picoplankton community both in the coastal and open sea areas of the Mediterranean [36,37,38,39,40,41]; however, studies focusing on viruses in the open Adriatic are still scarce. Corinaldesi et al. [42] and Ordulj et al. [25] gave a comprehensive overview of the distribution of the virioplankton and microbial communities in the Adriatic, while Šantić et al. [43] analysed the distribution and activity of picoplankton in the South Adriatic Pit, but seasonal changes were not addressed for the open areas of the central and south Adriatic. The main objective of this study was to investigate the seasonal distribution of marine viruses in the open Adriatic Sea. Since viral populations are often nonlinearly related to biotic and abiotic parameters, we used neural gas (NG) analysis to achieve a good classification of microbial food web components and environmental parameters. In addition, as the abundance and composition of microbial host populations can be affected by predation and water column dynamics, we also analysed the relationship between viruses and the abundance of marine pico- and nano-plankton during periods with mixed and stratified water columns to identify the main factors determining the distribution of virus populations in the open Adriatic Sea.

2. Materials and Methods

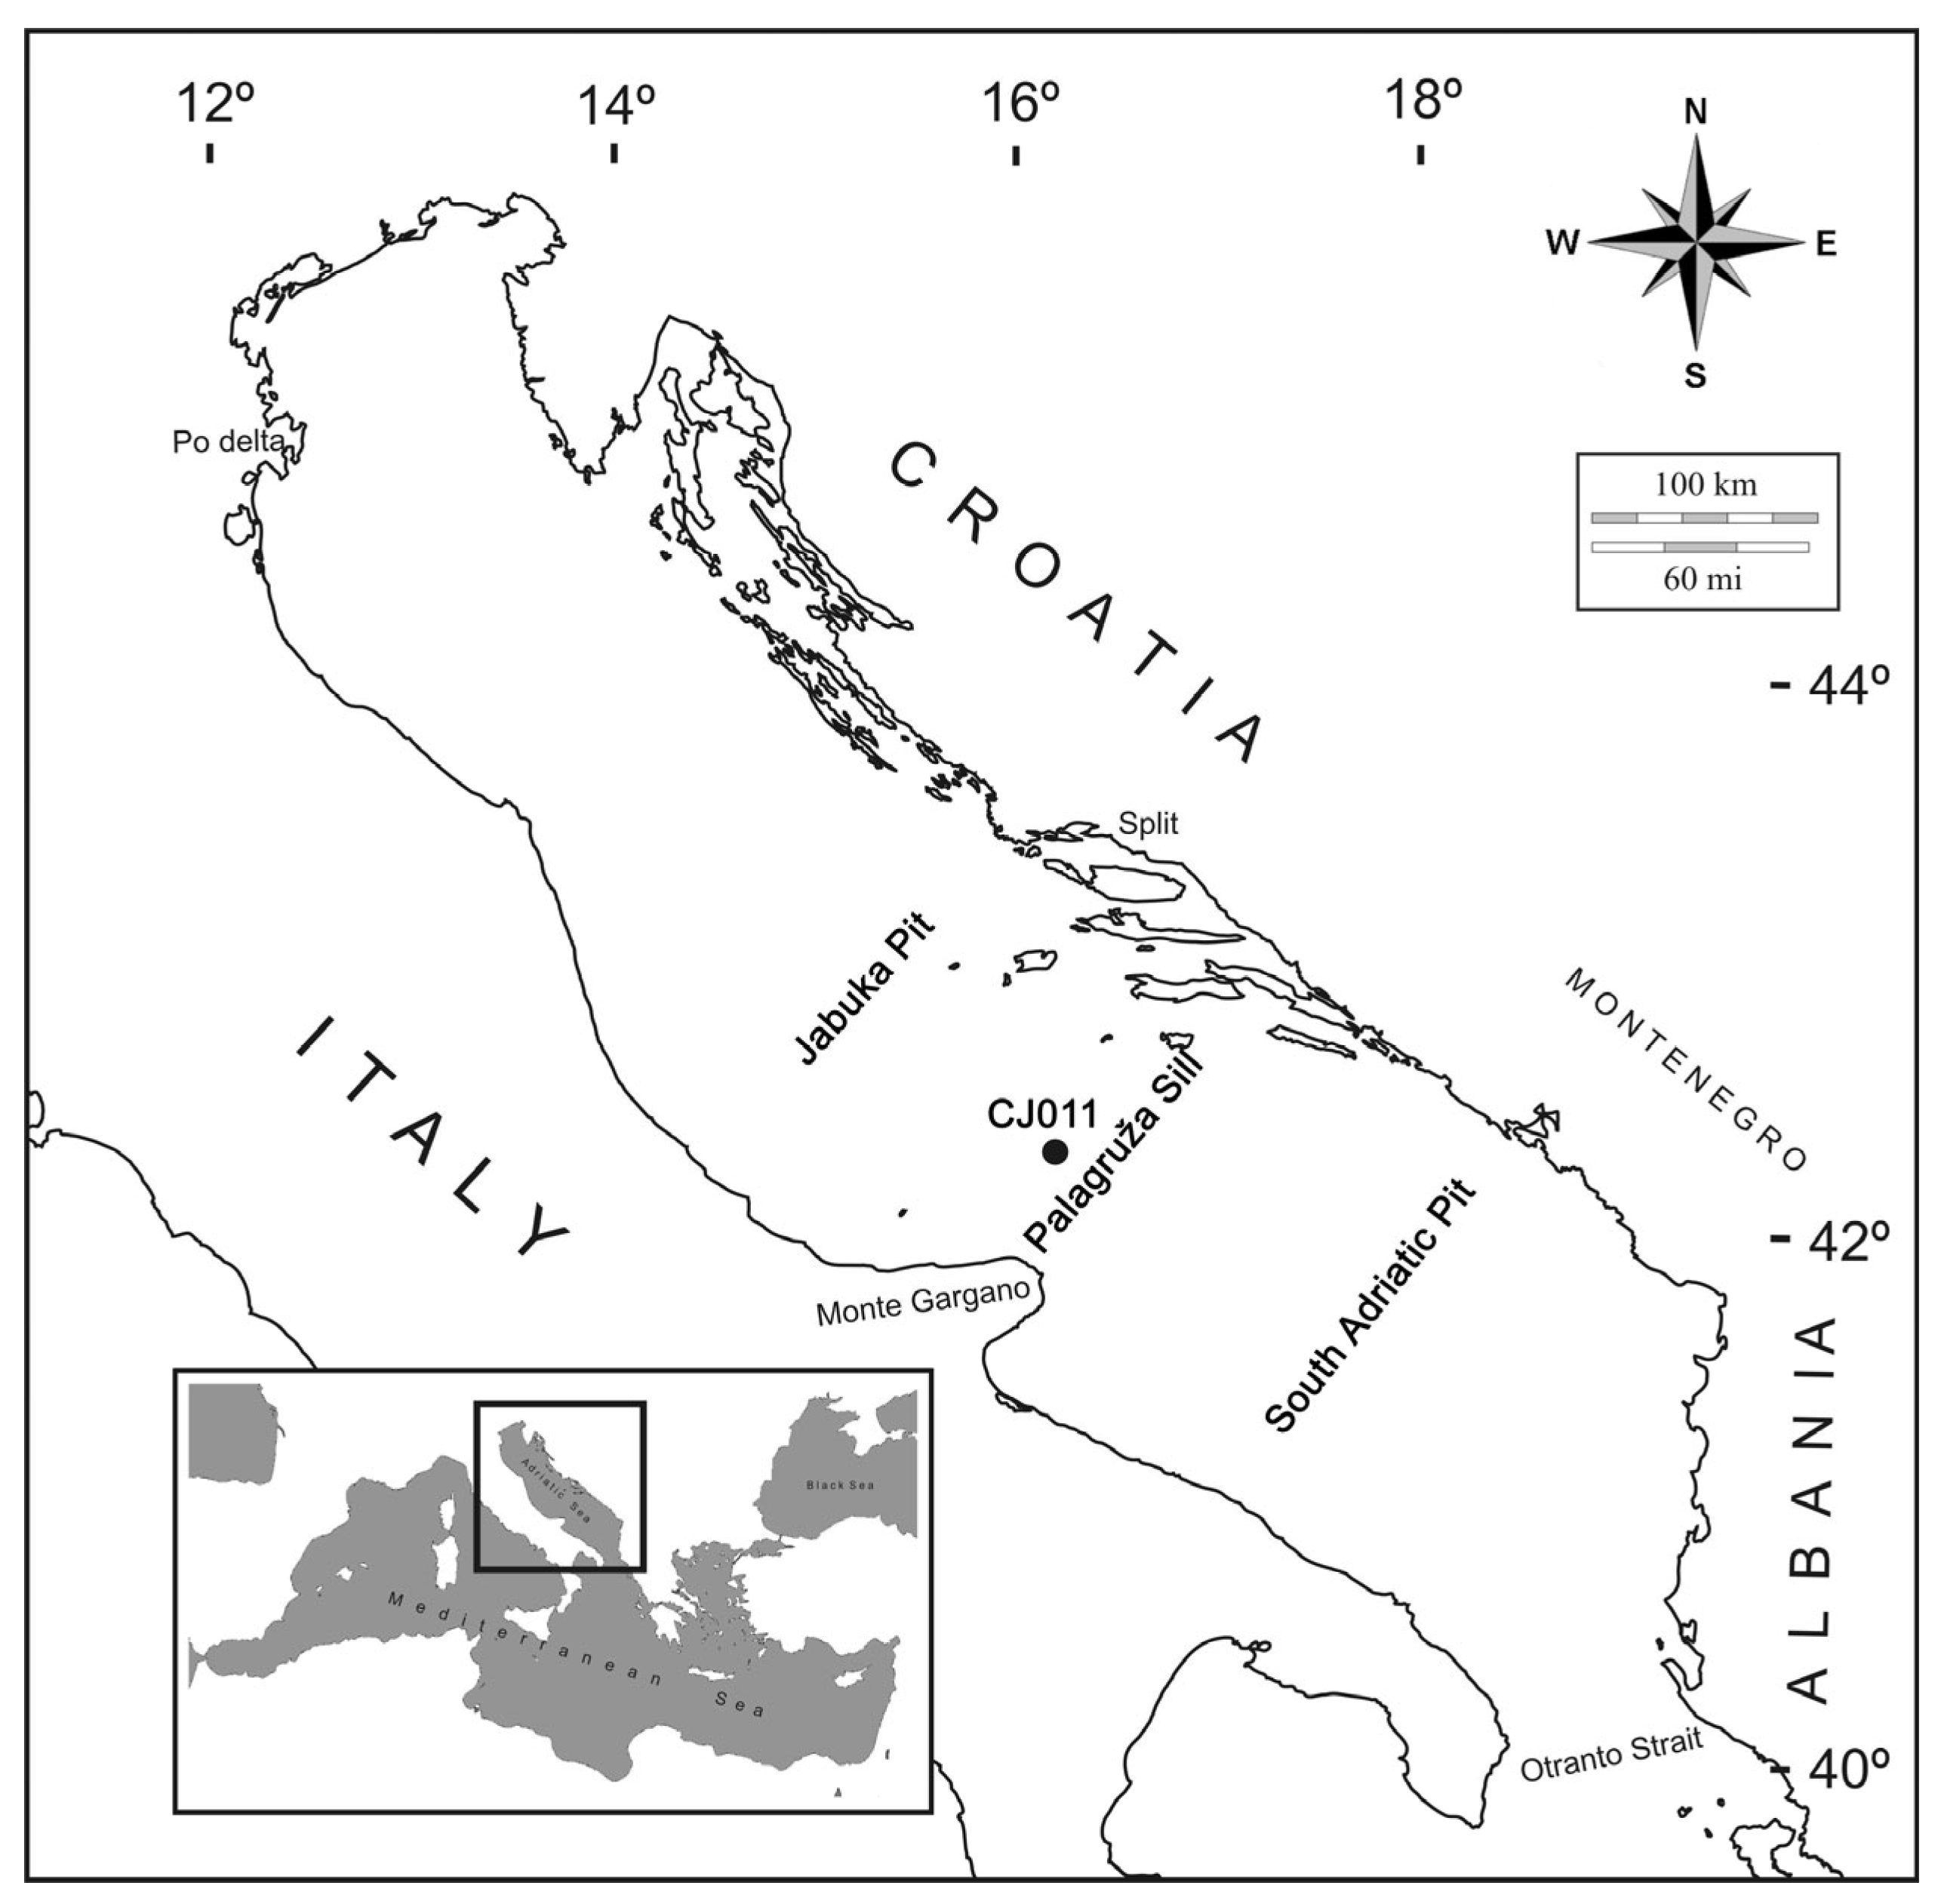
2.1. Study Sites and Sample Collection

Sampling and measurements were carried out via the research vessel BIOS DVA at a station in the open sea area of the middle Adriatic (Figure 1) between March and November 2013. Station CJ011 is located in the Palagruža Sill (170 m), which divides the Jabuka Pit from the South Adriatic Pit. This sampling location may be affected during the year by surface currents carrying nutrients deposited by the Po River along the Italian coast. Niskin bottles (5 L) were used to collect the samples, which were processed on board. Geographical location, sampling depth, and sampling months are shown in Table S1.

2.2. Environmental Parameters

A SeaBird 25 CTD profiler (Sea-Bird Electronics, Inc.; Bellevue, WA, USA) recorded temperature and salinity data with accuracy >±0.01 °C and ±0.02, respectively.
Seawater samples for dissolved nutrient analysis (nitrate, nitrite, and silicate) were collected in polyethylene vials and immediately frozen at −20 °C on board. Afterward, concentrations were determined in an onshore laboratory via an AutoAnalyzer III colorimeter (Seal Analytical, Mequon, WI, USA) using standard spectrophotometric methods [44]. Determination of orthophosphate and ammonium concentrations was performed immediately on board using a Shimadzu UV-VIS 1280 (Kyoto, Japan) spectrophotometer using methods described by Parsons et al. [45]. Chlorophyll a (Chl a) was determined based on 500-mL sub-samples filtered through Whatman GF/F glass-fibre filters and stored at −20 °C. Filters were homogenized, extracted in 90% acetone and subsequently analysed fluorometrically using a Turner TD-700 Laboratory Fluorometer (Sunnyvale, CA, USA), calibrated with pure Chl a (Sigma-Aldrich, Munich, Germany) [46]. Chl a analysis includes cells larger than 0.8 μm; this parameter can be considered a relative estimate of large phytoplankton biomass.

2.3. Marine Virus Counts

The abundance of virus-like particles (VLP) was determined as described in [47]. Collected samples were preserved in formaldehyde (2%, final concentration), flash-frozen in liquid nitrogen, and stored at −80 °C until analysis. A count was performed in the laboratory immediately after the end of the cruise. Preserved samples (2 mL) were filtered through 0.02-μm pore-size filters (Anodisc; diameter: 25 mm; Al2O3, Whatman, Maidstone, UK) and stained with SYBR Green I (stock solution diluted 1:300). Filters were incubated in the dark for 20 min and mounted on glass slides with a drop of 50% phosphate buffer (6.7 mM, pH 7.8) and 50% glycerol, containing 0.5% ascorbic acid. Slides were stored at a temperature of 20 °C until analysis. Viral counts were obtained via epifluorescence microscopy (Olympus BX 51, 1250× magnification, equipped with a blue excitation filter, Tokyo, Japan) and were expressed as the number of virus-like particles (VLP).

2.4. Bacterial, Synechococcus, Prochlorococcus, and Heterotrophic Nanoflagellate Counts

Abundances of Synechococcus (SYN), Prochlorococcus (PRO), picoeukaryotes (PE), heterotrophic nanoflagellates (HNFs), and heterotrophic bacteria (HB) were determined using flow cytometry [47]. Samples of autotrophic cells (2 mL) for flow cytometry counts of samples were preserved in 0.5% glutaraldehyde, frozen at −80 °C, and stored until analysis (5–10 days). Autotrophic cells were divided into two groups: cyanobacteria (Synechococcus and Prochlorococcus) and picoeukaryotes, distinguished according to light scattering, red emission of cellular chlorophyll content, and orange emission of phycoerythrin-rich cells. Individual subsamples for bacterial and HNF analysis were fixed at a final concentration of 2% formaldehyde and stored at 4 °C in the dark before analysis (5–10 days). Subsamples of bacteria were dyed with 1:5000 final SYBR Green I [48] for a staining time of 30 min at room temperature in the dark from an initial stock diluted to 1:10 with DMSO. Bacterial abundance was determined via scatter plots of particle side scatter versus SYBR Green I fluorescence related to cellular nucleic acid content, to discriminate bacteria from other particles. According to the cellular nucleic acid content, the bacterial population was divided into two sub-groups: HNA (high nucleic acid content) and LNA (low nucleic acid content) bacteria. Subsamples of HNFs were dyed with 1:10,000 final SYBR Green I [49] at a staining time of 30 min at room temperature in the dark from an initial stock diluted to 1:10 with DMSO. Samples were analysed on a Beckman Coulter EPICS XL-MCL with a high flow rate from 1 to 1.2 μL s−1.

2.5. Bacterial Production

Bacterial cell production was measured from DNA synthesis based on incorporation rates of 3H-thymidine [50]. Methyl-3H-thymidine was added to 10 mL samples at a final concentration of 10 nmol (specific activity: 86 Ci mmol−1). Triplicate samples with a formaldehyde-killed adsorption control (final concentration: 0.5%) were incubated for 1 h at room temperature, and incubations were stopped by adding formaldehyde (final concentration: 0.5%). The thymidine samples were extracted with ice-cold trichloroacetic acid (TCA). The TCA-insoluble fraction was collected by filtering the samples through Whatman filters with a 0.2-μm pore size. Conversion factors for bacterial production (BP) were calculated from the bacterial cell number and 3H-thymidine incorporation during bacterial growth in 1 μm pre-filtered seawater [51]—CF = (N2-N1)/3H, where N1 and N2 represent the numbers of bacteria at the beginning and the end of the experiment, respectively, and 3H is the integrated 3H-thymidine incorporation rate during the experiment. The bacterial-specific growth rate (SGR, day–1) was calculated from the estimates of BP and bacterial biomass (BB).

2.6. Characterization of the Studied Area according to Nutrient Status

The probable nutrient limitation at studied sites was assessed by comparing ambient nutrient concentrations with concentrations likely to limit nutrient uptake, which are based on studies of nutrient uptake kinetics [52,53,54,55], and criteria for stoichiometric nutrient limitation, which point out that ambient ratios of dissolved N/P < 10 and Si/N > 1 indicate stoichiometric N limitation, Si/N < 1 and Si/P < 10 indicate Si limitation, and N/P > 22 and Si/P > 22 suggest P limitation [56,57]. All samples with the concentration of PO4 < 0.1 μM and with N/P ratio > 22 and Si/P ratio > 22 were taken as phosphorus-limited.

2.7. Relative Importance of Bacterial Biomass Control Mechanisms

To assess the importance of nutrients or predation in regulating the BB, linear regression analysis between BB and BP was applied as suggested by [58,59,60]. If BP is considered to be equivalent to the nutrient supply, it would be completely converted to BB in the case of low predation. Conversely, if predation of bacteria is high, BB would not increase with an increase in BP. Accordingly, a strong relationship between BP and BB suggests bottom-up control of the bacteria, while the lack of a relationship suggests top-down control of the bacterial population. The biomass of heterotrophic bacteria was calculated using the following conversion factor of 20 fgC cell−1 [61,62].

2.8. Statistical Analysis

Statistical analyses were performed using Statistica 14.0 software. The dataset of the biotic parameters was log transformed according to the needs of the analysis. The normality criteria were tested using Kolmogorov–Smirnov and Shapiro–Wilk tests. A nonparametric Spearman’s p-correlation test was performed to assess the correlation between the microbial plankton population and the abiotic parameters. Values with an r-ratio between 0 and 0.3 were considered weakly correlated, values between 0.3 and 0.7 were considered moderately correlated, and values above 0.7 were considered strongly correlated. Results of the statistical tests are considered to be significant at p-values ≤ 0.05.
NG was used to determine the seasonal dynamics of the viral population and its relationship to the major MFW components. Separately normalized viral abundances and temperatures were used as elements of the data vectors. NG analysis is a weak smoothing algorithm that spreads the clusters far enough to cover all data, including extreme values, making it more suitable for detecting anomalies and outliers [63,64]. During the adaptation process, NG was trained with 5000 training epochs, with default values for the initial step size (0.5) and an initial decay constant (2.5), following Martinetz et al. [65]. The learning process that reduces data space into a certain number of clusters yields the best matching units (BMU). Links between the clusters are weak without a predefined topological structure in the manifold. The analysis resulted in four NG clusters referred to as BMUs. The SOM Toolbox version 2.0 for MATLAB used in this study was developed by E. Alhoniemi, J. Himberg, J. Parhankangas, and J. Vesanto at Helsinki University of Technology, Finland, and is available at http://www.cis.hut.fi/projects/somtoolbox/ (accessed on 10 February 2023).

3. Results

3.1. Environmental Parameters

The cruises were conducted between April and November 2013 at station CJ011. The sampling station is situated near the island of Palagruža in the mid-Adriatic, and during the year can be influenced by the exiting surface currents that bring nutrients deposited by the Po River in the Italian coastal area. Average values with standard deviations for temperature, salinity, and pH are shown in Table 1. The mean temperature of station CJ011 was 16.93 ± 3.36 °C, with the maximum in August (24.36 °C) and the minimum in June at 100 m depth (12.8 °C). The highest average temperature was measured in August and the lowest in March. A vertical temperature gradient with higher values at the surface and lower values in the bottom layer, which stratified the water column (SWC), was observed between May and October. During the rest of the sampling months, the water column was mixed (MWC). Mean salinity values did not change during the year, except that a vertical gradient between lower values at the surface and higher values at the bottom was observed during the warmer months. Total chlorophyl a concentration ranged from 0.09 to 0.94 μg L−1, with the maximum mean value of 0.34 ± 0.24 μg L−1 measured in May (Figure S1).
The mean values with standard deviation for the sampled station of nitrates, phosphates, and silicates are shown in Table 1. The highest concentrations of nitrates, and, in most of the sampling months, of phosphates and silicates, were found in the bottom layer. The highest average ammonia and silica concentrations were detected in March. All the nutrient concentrations were lower on average during June (Figure S2). Analysis of the ratios between nitrogen, phosphorus, and silica showed that this area was limited in phosphorus (DIN:P > 22; Si:P > 22, P < 0.1 uM), while there was virtually no limitation of nitrogen or silica (Figure S3).

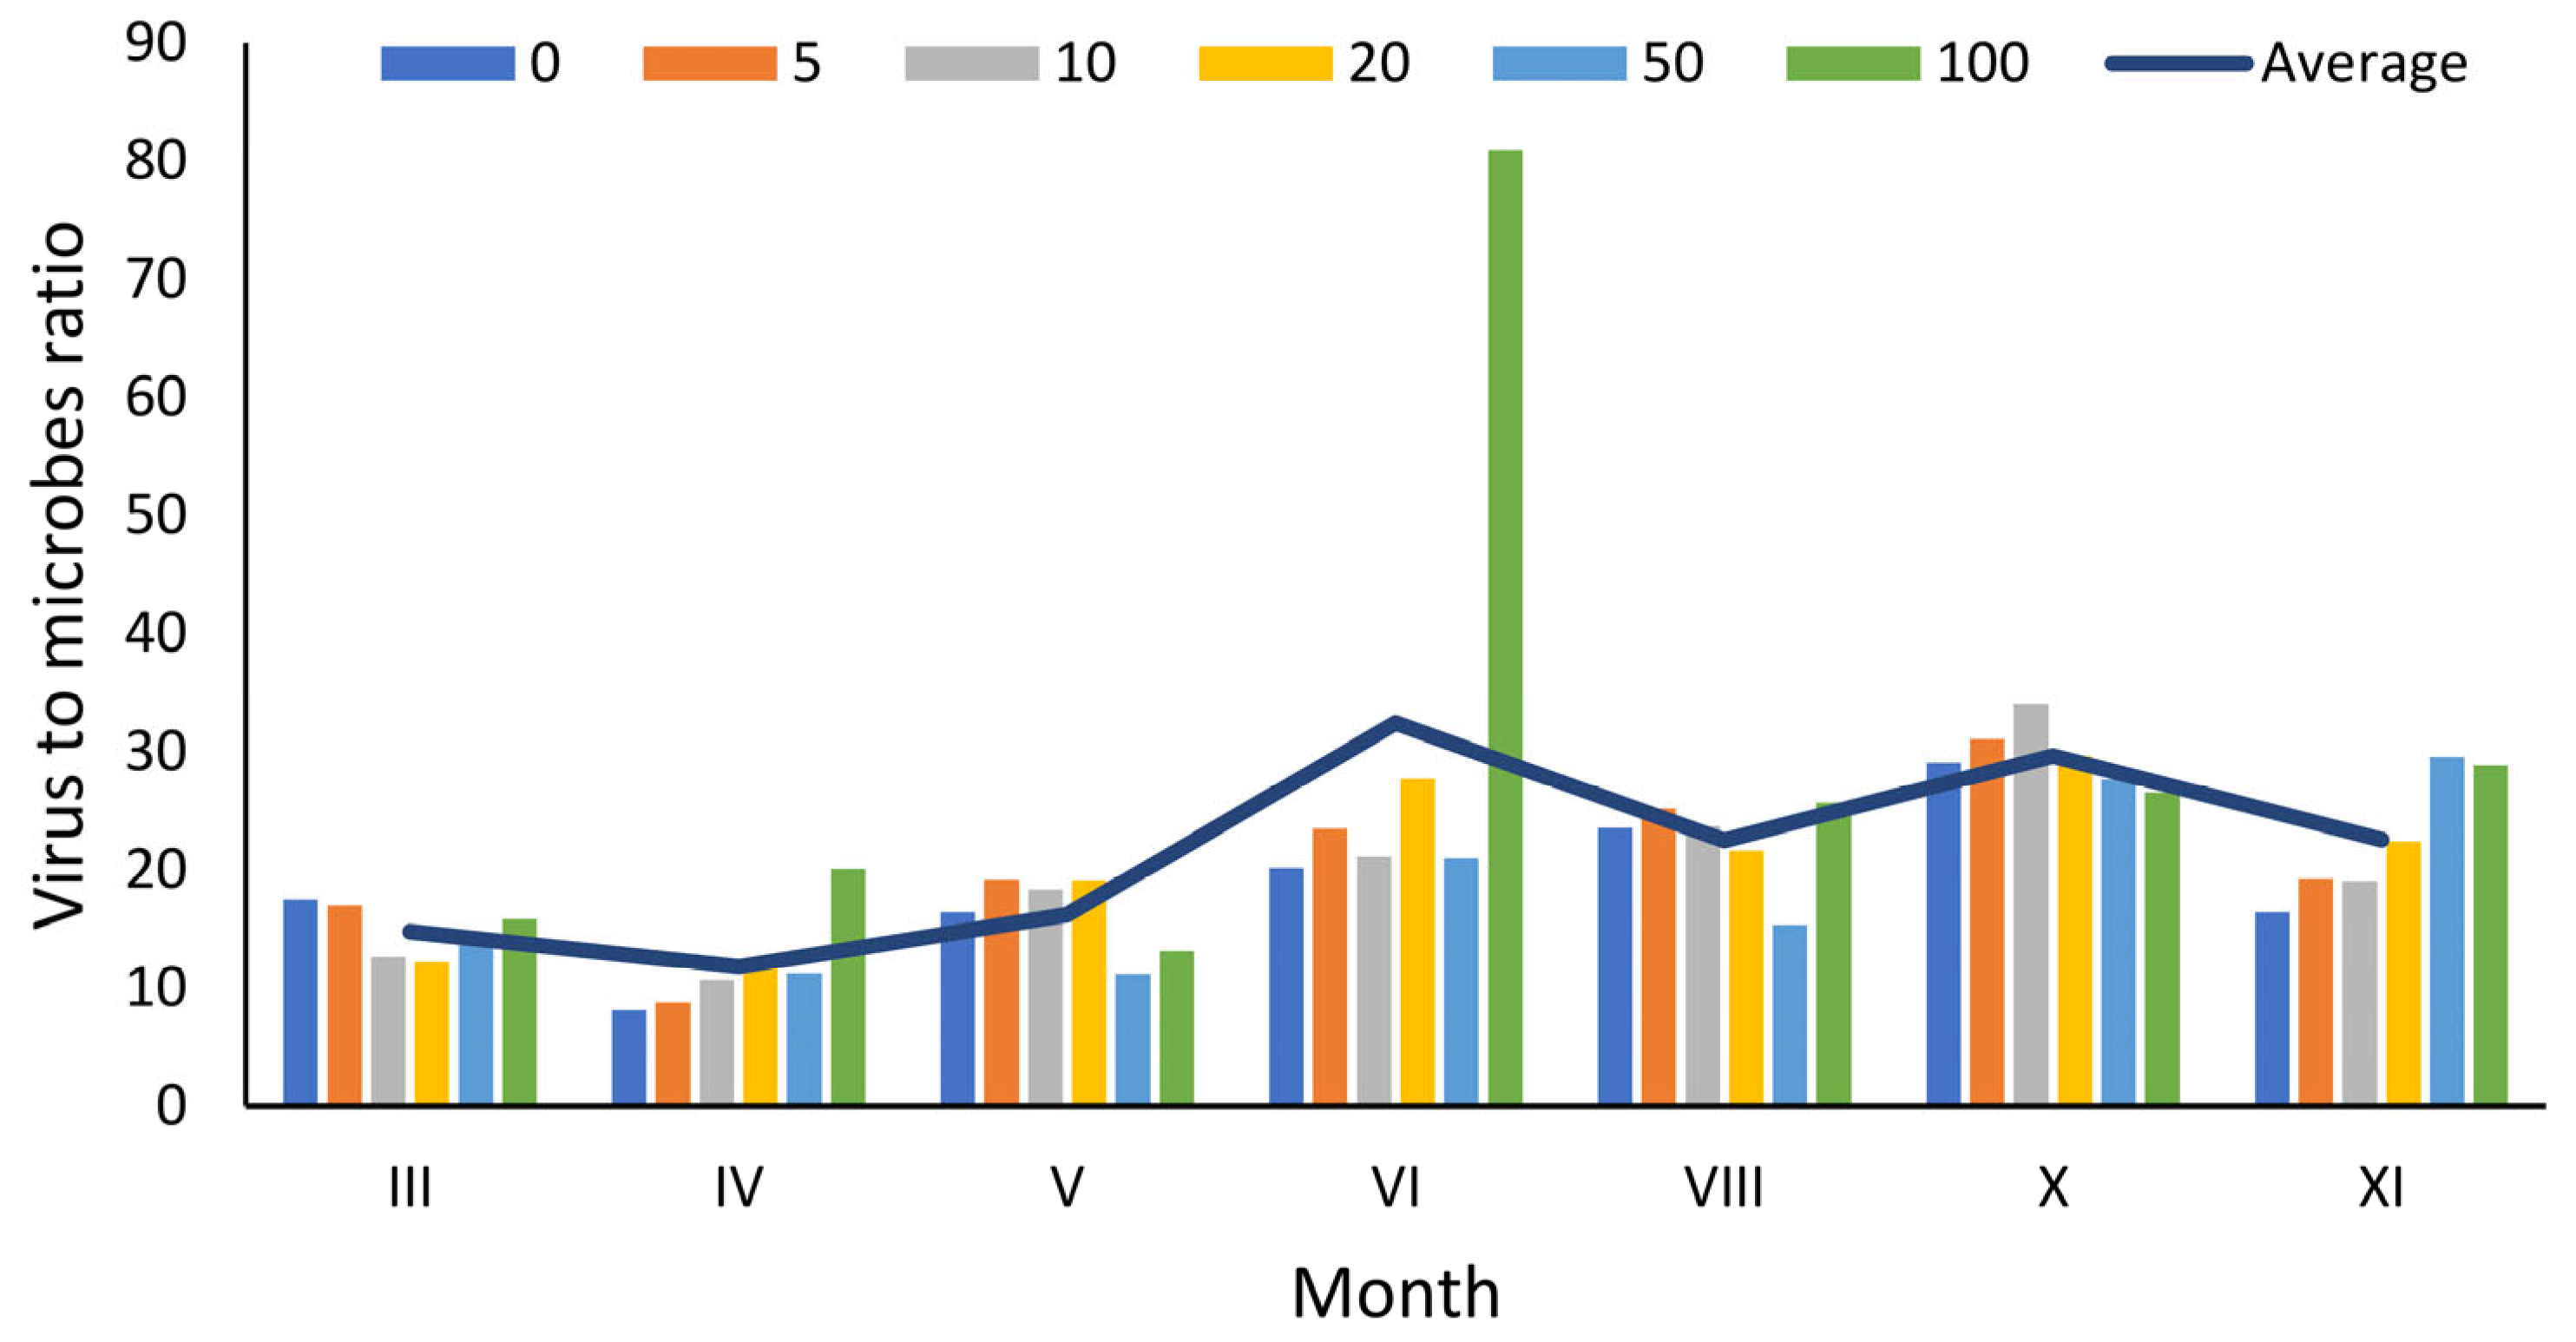
3.2. Distribution of Viruses

Viral abundance at CJ011 ranged from 4.18 × 10⁶ VLP mL−1 to 12.19 × 10⁶ VLP mL−1, with a mean value of 6.70 ± 2.16 × 10⁶ VLP mL−1 (Table 1). The increased mean abundances were determined during the summer sampling campaigns, with a 35.7% change when compared to winter samples, with the highest value in October at the depth of 10 m (12.19 × 10⁶ VLP mL−1) and the lowest in April at the surface (4.18 × 10⁶ VLP mL−1). Viral abundance started to increase with the water column stratification in May, and rather high values were determined at the depth of thermocline in June and August. The maximum average abundance was determined in October when the water column was still stratified. The average virus-to-microbe ratio (VMR) ratio was 21.42 ± 11.50, but the values varied substantially during the sampling campaigns (8.10–80.94). The VMR changed regarding the stratification of the water column, and on average was higher, during the SWC period, with higher values in depths above the thermocline with one exception in June when an unusually high value was determined at the bottom (Figure S4).
Viruses correlated positively with temperature (r = 0.58; n = 42, p < 0.05) and pH (r = 0.45; n = 42, p < 0.05) and negatively with salinity (r = −0.56; n = 42, p < 0.05), nitrite (r = −0.44; n = 42, p < 0.05) and silica (r = −0.44; n = 42, p < 0.05). A positive but weak correlation was observed with HNFs (r = 0.36; n = 42, p < 0.05), and a moderate but negative correlation was observed with PRO (r = −0.42; n = 42, p < 0.05) at the studied station (Table S2).

3.3. Abundance of Picoplankton and Nano Plankton Communities

Bacterial abundance ranged from 0.07 × 10⁶ mL−1 to 0.52 × 10⁶ cells mL−1, with a mean abundance of 0.34 ± 0.09 × 10⁶ cells mL−1 (Figure S4). The lowest abundance was found at the bottom in June, while the highest abundance was found in April at a depth of 5 m. The percentage of the LNA bacterial group ranged between 36.3% and 62% (an average value of 50.1 ± 6.21) and slightly prevailed in the sampled area. HNAs dominated the LNA bacterial community throughout the water column in the colder period (March, April, and November), while the LNA bacterial community dominated the water column in June, August, and October (Table S4). BP ranged between 0.10 and 1.20 × 10⁴ cells mL−1 h−1, with the highest mean value determined for March (0.45 ± 0.38 × 10⁴ cells m < L−1 h−1). BP was higher when the water column was temperature-stratified, with slightly larger values in the layer above the thermocline (0.28 ± 0.07 × 10⁴ cell mL−1 h−1) than when the water column was mixed (0.26 ± 0.26 × 10⁴ cell mL−1 h−1). Heterotrophic picoplankton (HPP) dominated the biomass of autotrophic picoplankton (APP), with the ratio always exceeding 1 at the station (Table S3). The average values with standard deviation are shown in Table 1.
Of all the members of the autotrophic picoplankton, Synechococcus dominated in 66.67% of the samples, with an abundance ranging from a few cells to 18.30 × 10³ cells mL−1 (Figure S4). Prochlorococcus was predominant in 23.81% of the samples, with an abundance ranging from a few cells to 7.15 × 10³ cells mL−1. Mean Synechococcus abundance was highest in May (9.26 ± 4.95 × 10³ cells mL−1), while the highest mean abundance of Prochlorococcus was determined in April (4.39 ± 0.56 × 10³ cells mL−1). Picoeukaryotes were present throughout the sampling period, but their abundance was highest in May (2.176 ± 1.27 × 10³ cells mL−1), when the maximum abundance of 3.88 × 10³ cells mL−1 was determined at the surface. The autotrophic picoplankton members had the lowest abundances in August (Figure S4).
The abundance of HNFs followed the abundance of HB (Table 1)—mainly its HNA group (r = 0.53, n = 42, p < 0.05)—and it ranged between 0.34 × 10³ mL−1 and 5.62 × 10³ mL−1, with the highest mean abundance determined in May (3.78 ± 1.96 × 10³ cells mL−1) (Figure S4).

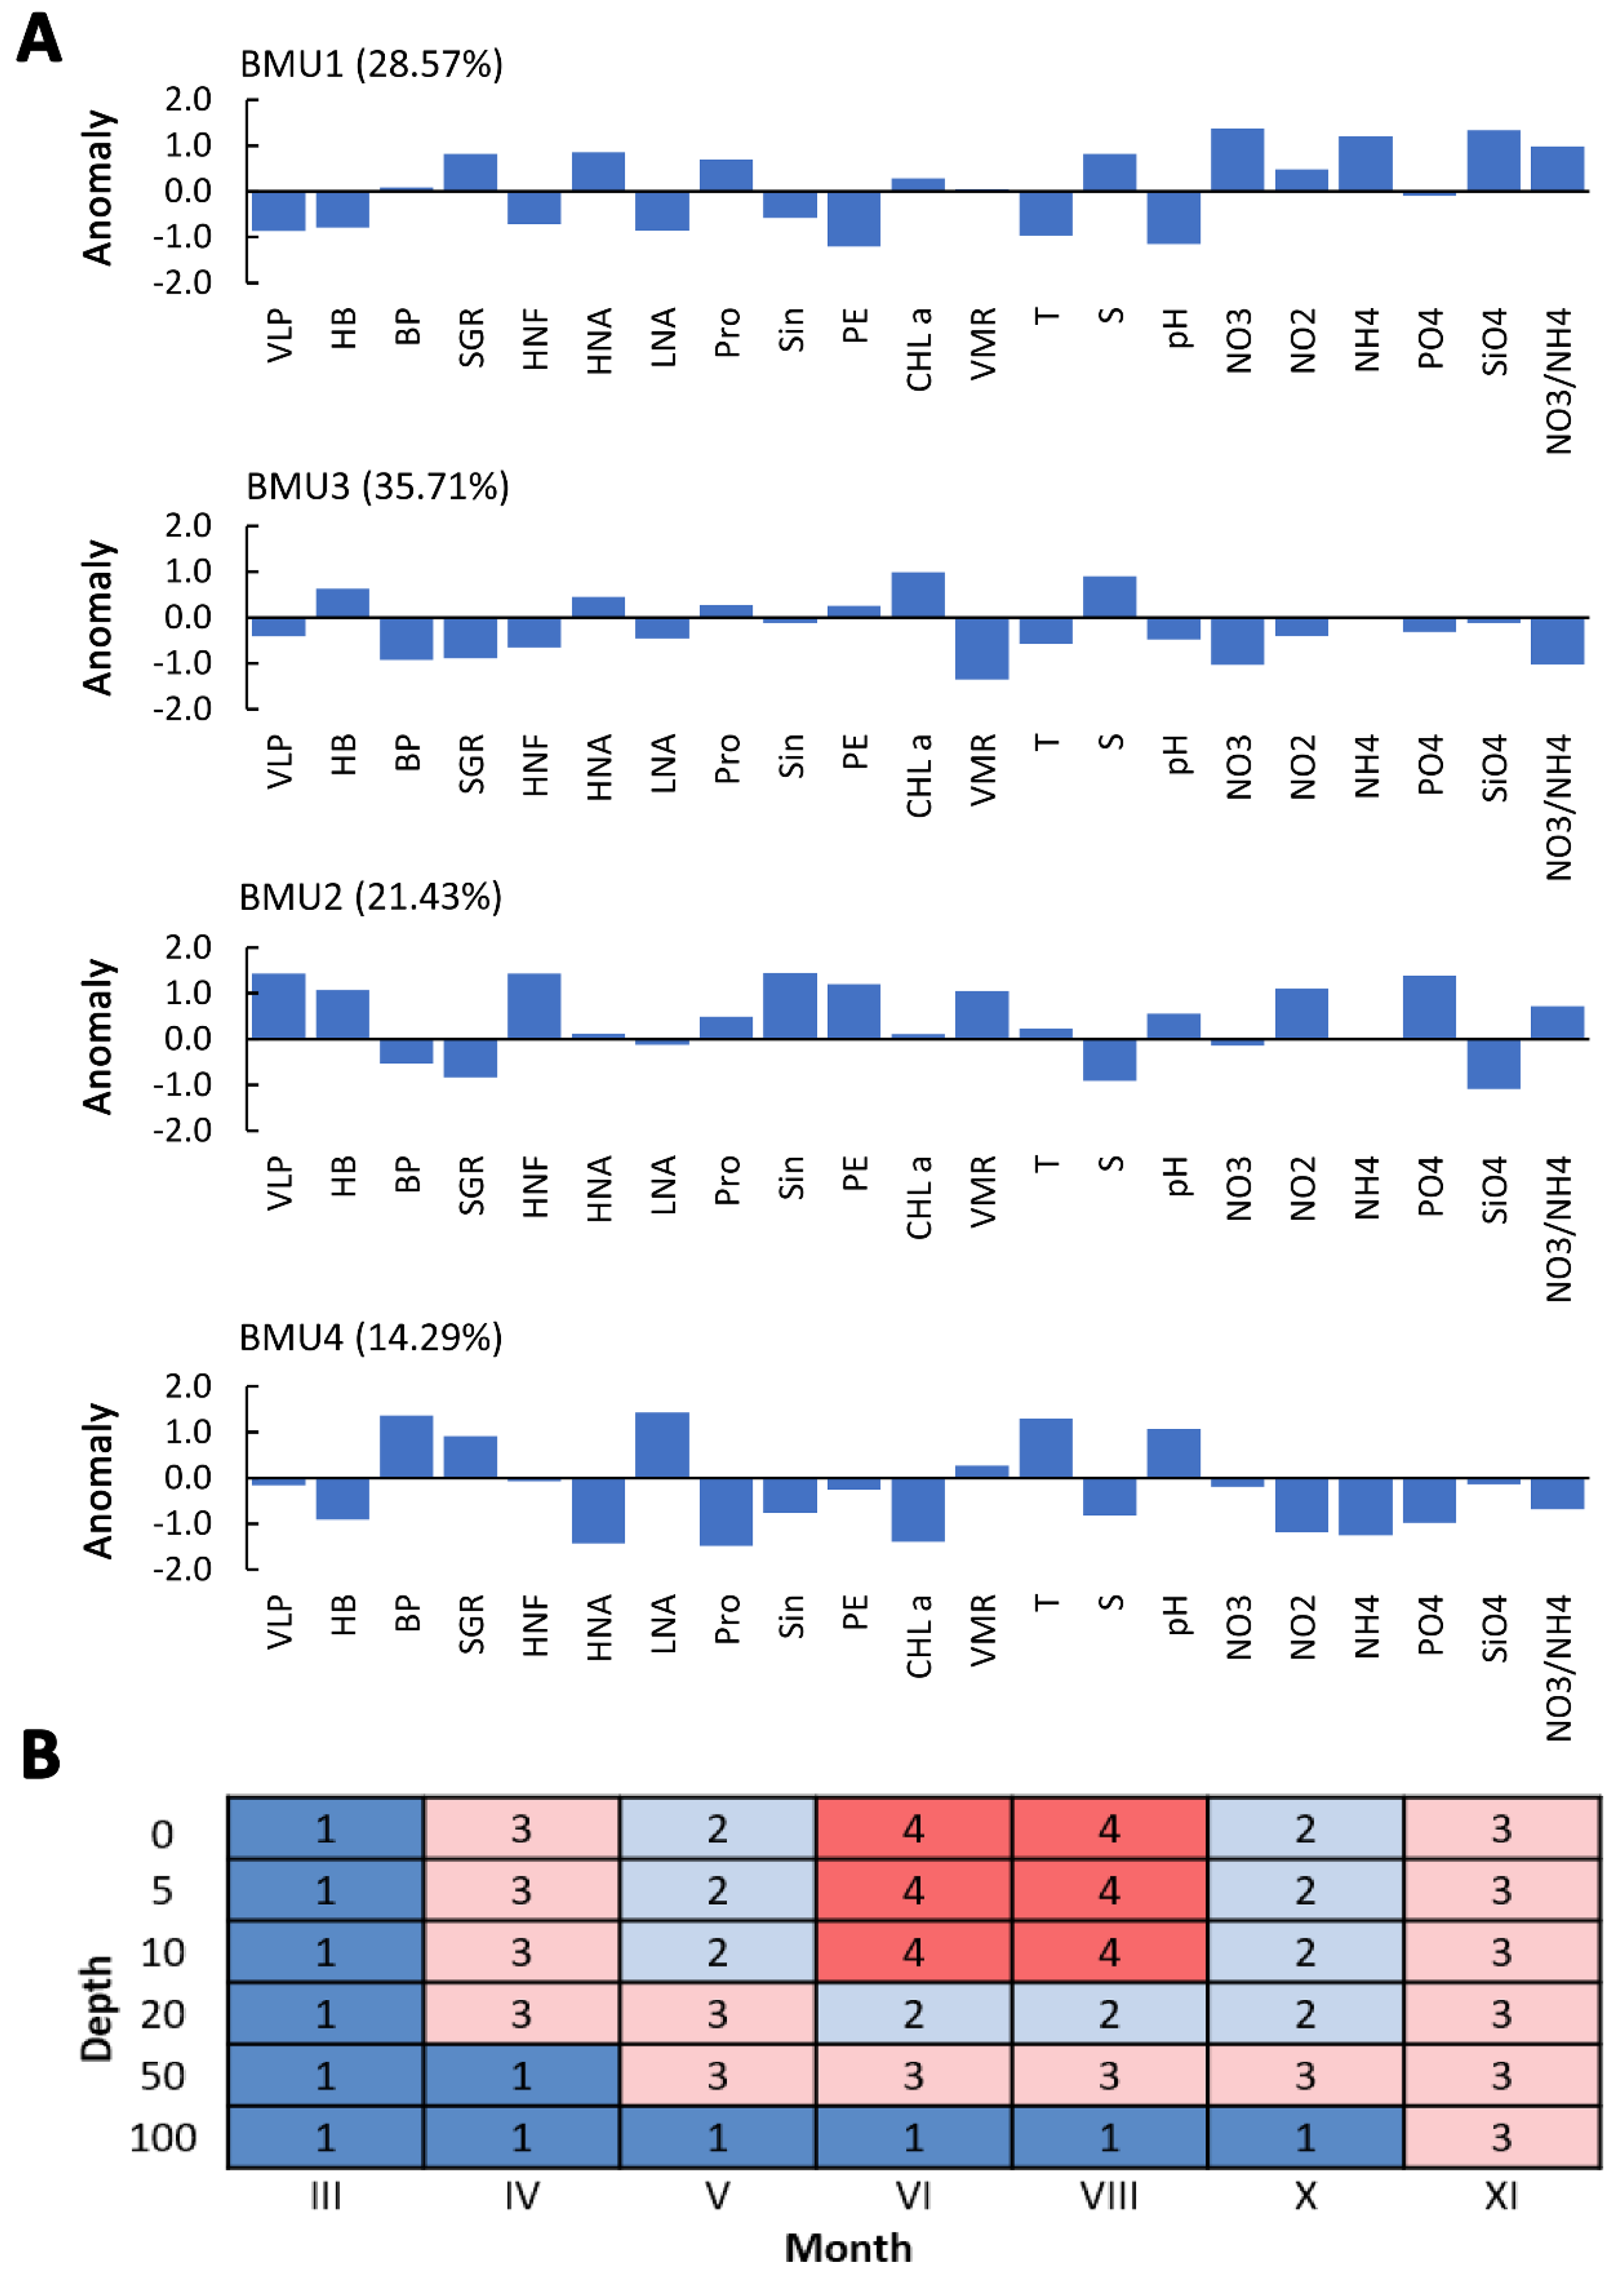
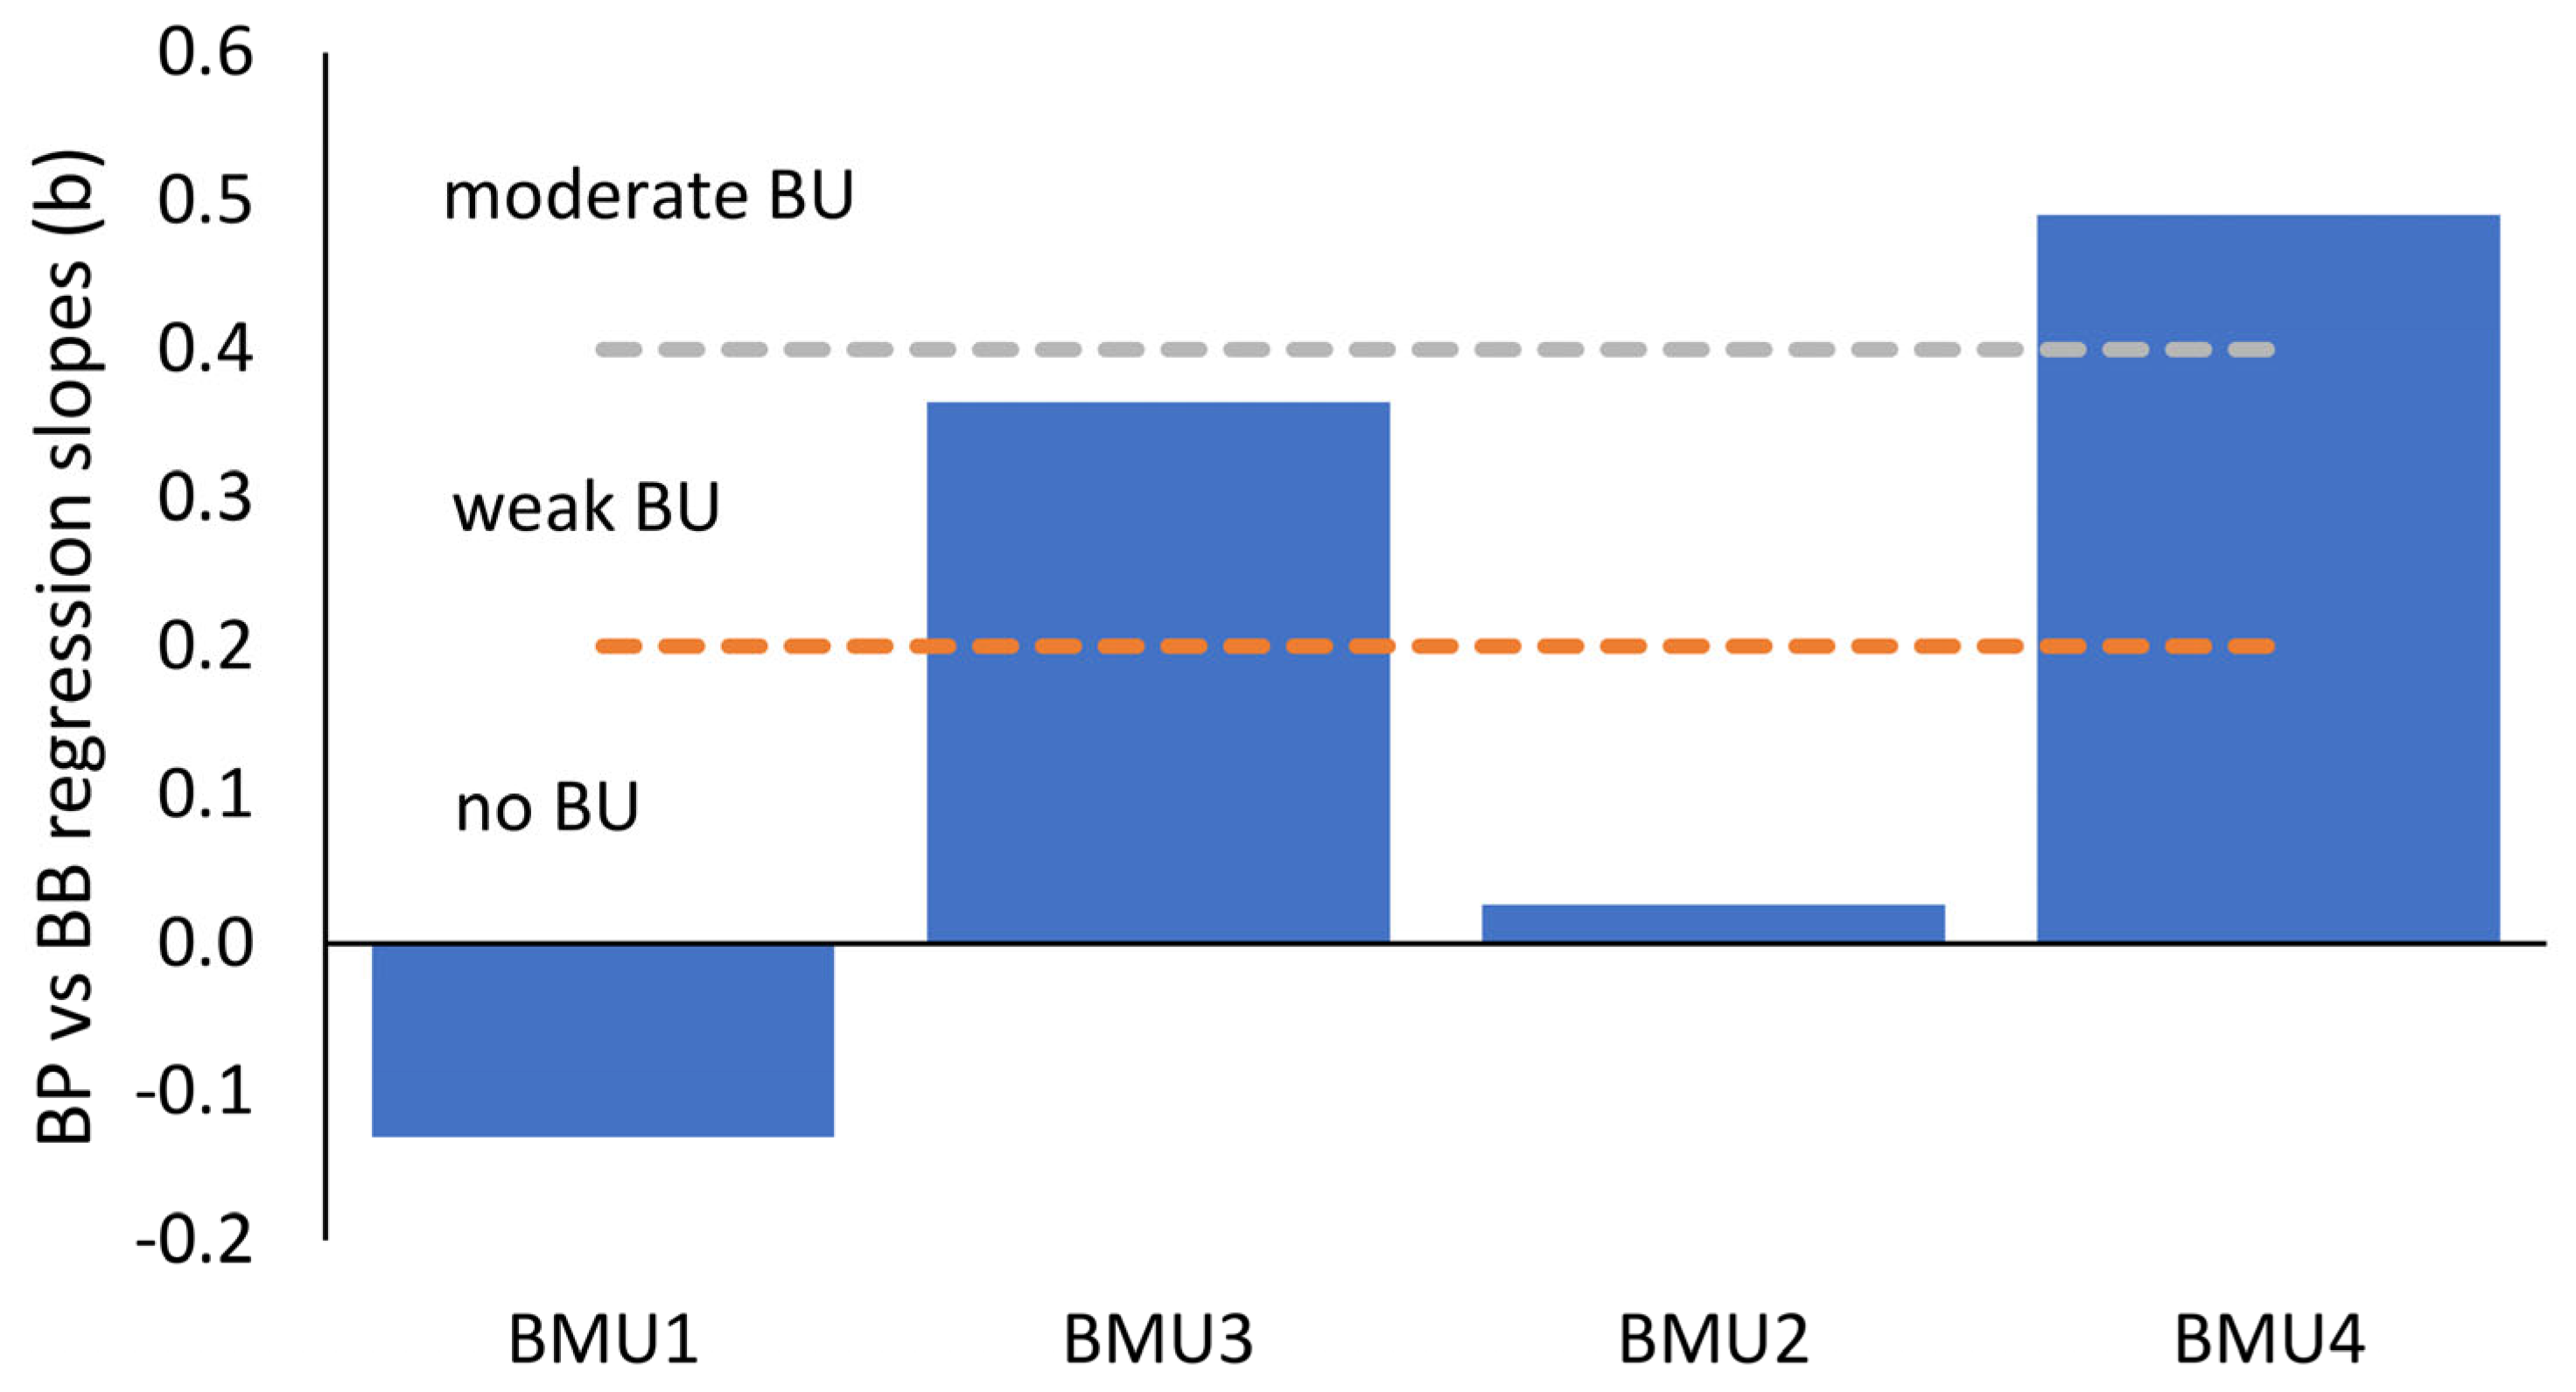
3.4. Top-Down vs. Bottom-Up Control of Heterotrophic Bacteria

Analysis of the relative importance of top-down (TD) and bottom-up (BU) control revealed that TD was more important in controlling bacterial populations in three of the four clusters. A moderately pronounced BU control was found only in BMU4 (regression slope b = 0.49), which represents the heated surface layer with low nutrient concentration (Figure S5).

3.5. Relationship between Viruses and the MFW Components

NG analysis was tested in several experiments with different biotic and abiotic parameters, and it fitted best when viral abundance and temperature were used. Four BMUs were distinguished, each BMU representing a cluster describing the ecological status of a single layer characterized by biotic and environmental parameters. Explanations for the observed patterns within the clusters were sought, and the mean values for the biotic and abiotic parameters are shown in Table 1. Clusters BMU1 and BMU3 represent conditions in the period prior to water column stratification with increased salinity, while clusters BMU2 and BMU4 represent conditions in the surface layers after thermocline formation and water column stratification (Figure 2B).
BMU1 represents the vertical temperature-mixed water column in March, and the bottom layer until November (Figure 2B). The cluster is characterized by low temperatures and phosphate values, while nitrogen and silica levels are high, with the highest mean salinity values (38.86 ± 0.02 PSU). In the APP microbial group, only PRO is abundant, while VLP, HB, and HNFs are low. A high SGR follows a low abundance of HB.
The BMU3 cluster corresponds to the conditions of the transition period before and after the formation of the thermocline and describes 35.71% of the data. In summer, it is located approximately at the depth of the deep Chl a maximum determined in the layer below the thermocline at a sampling depth of about 50 m (Figure S1). The cluster is characterized by lower temperature and higher salinity. Chl a concentration is high, as is the abundance of HB, dominated by HNA bacteria, and followed by a low SGR. Nutrient concentrations are low, especially nitrate concentrations, as indicated by the negative NO3/NH4 anomaly.
BMU2 represents the conditions after the thermocline has been formed, characterized by surface water with lower salinity. Phosphate and nitrite concentrations are elevated, while silicates are below average. Abundances of VLP are highest, with an average value of 9.89 ± 1.99, which is followed by a high VMR. HNF abundances also reached their maximum, as well as the abundances of the HB and APP microbial groups, especially SYN and PE. SGR and BP values are low. The high abundances of the APP microbial groups indicate their dominance over larger autotrophic eukaryotic microorganisms, as the chlorophyll a anomaly is not pronounced.
Cluster BMU4 is characterized by high temperatures and low nutrient concentrations. BP is high, as is SGR, while HB is below average and dominated by the LNA bacterial group. Abundance of VLP, HNFs, and picoautotrophs is low, as is the Chl a concentration.
The values of the environmental parameters are similar in BMU1 and BMU3, and the clusters are characterised by a vertical temperature-mixed water column. On the other hand, thermohaline stratification of the water column is observed in the BMU2 and BMU4 clusters (Figure S1). The results of NG analysis show that the thermohaline stratification of the water column affects the distribution of the virus population. This is also reflected in the relationship with MFW members. Thus, the relationships between the virus population and MFW members in the central Adriatic are seasonal and depth-dependent.

4. Discussion

Here we present data on the distribution of viruses and other components of planktonic microbial communities together with abiotic parameters collected over one year in the Adriatic Sea. The abundance of viruses in the open central Adriatic was consistent with previous results for the open Adriatic [25,42] and can be related to the values for the viral counts in the Mediterranean previously reported by numerous authors [36,37,38,39,40,41,66] and those generally in the open oceans [67]. Clustering showed that viruses were most abundant in the first 10 m in spring (May) and late summer (October) and at the depth of the thermocline (20 m) in summer (Figure 2). Interestingly, the abundance of viruses in BMU4, which describes the months of June and August, was lower at the surface than in the layers between 10 and 50 metres, which could be due to greater decay of viruses by intense solar radiation [45,68,69].
In general, the abundance of the virus population in the central Adriatic Sea changes with time and depth, which is consistent with the results of previous studies [21,25,42,70]. Viruses correlated significantly with abiotic parameters, mainly temperature (r = 0.58, n = 42, p < 0.05) and salinity (r = −0.56, n = 42, p < 0.05), but that connection could be a result of the same parameters affecting their hosts [24,27] (Table S2). NG analysis identified clusters representing a viral population as a function of abiotic and biotic parameters that vary temporally and spatially (Figure 2). The analysis showed how the viral population in the open Adriatic is determined by temperature, but this relationship is not linear, since an increase in temperature leads to an increase in the abundance of viruses, but only up to the point where the number of viruses decreases when water temperatures at the surface reach the highest values. Temperature-driven vertical stratification of the water column is known to alter the productivity of open marine areas by affecting the availability of nutrients and thus the abundance of viruses and their hosts in the water column [10,39,71,72]. The increase in viral numbers with SWC has been previously reported in the Adriatic Sea [25], in the Mediterranean Sea [36,39,40,41], and other regions [71,73,74,75].
Artificial neural networks are a useful modelling tool in environments with complex trophic conditions where nonlinear interactions of biological parameters are expected [33,76]. This method has been used previously to study virus populations [77,78,79], but rarely with the unsupervised learning algorithm used in this study.

4.1. Relation between Viruses and Microbial Picoplankton

The abundance of viruses largely follows the abundance of their primary hosts, the heterotrophic bacterial populations that dominate the environment, but also the autotrophic components of the microbial plankton community [3,24,28,80,81].
NG analyses showed that the abundance of viruses changes with the abundance of their hosts. This change, observed in BMU1 and BMU2, suggests a direct relationship between viruses and the microbial plankton community that was more pronounced with increasing water column stratification. Although the abundance of HB increased only slightly as the water column shifted from the MWC to the SWC period, the population increased significantly, as did HNFs. However, the bacterial population decreased during the summer, which was related to the decrease in VLP and HNF populations. This may be due to the shift in the bacterial population toward a higher proportion of the smaller and less active LNA bacterial group, which is particularly pronounced in BMU4. The LNA bacterial group, which is well adapted to oligotrophic conditions that characterize BMU4 [30], carries BP at low nutrient concentrations and possibly maintains the viral population at a stable summer level. Findings of the LNA bacterial group dominating the surface layers of the open Adriatic are consistent with previous studies [30,43,82,83].
The proportion of the HNA bacterial group was higher in deeper layers and during the MWC period. The dominance of HNA deeper and in the mixed water column was previously described in the open Adriatic by Šantić et al. [43] and in the western Mediterranean Sea by Winter et al. [39]. The HNA bacterial group may have kept viral abundance at a stable minimum under these conditions, although an increased abundance of PE could have also contributed. It is hypothesised that a more active bacterial group is a preferred host for lytic viruses to make more viral progeny and keep the population number stable [3,84]. While bacterial species compete for nutrients, viruses infect the winners, which can affect the abundance and diversity of the microbial community in the environment [85]. Additionally, a higher number of viruses could be produced due to the activation of lysogens that fast-growing bacteria tend to harbour [86,87], although previous work in the open Adriatic suggests that just 3% of the total bacterial population carries lysogens [70].
Mean bacterial abundance (and production) was highest in spring and lowest in August, which could be due to viral infection, although predation by HNFs cannot be ruled out. A similar decrease in bacterial abundance in summer was previously described by Ordulj et al. [25] in Adriatic coastal waters and by Sabbagh et al. [75] in the Red Sea. However, a correlation with the bacterial population is not always the case, and viruses often correlate with other microbes [88,89]. In this study, viruses were also linked with other autotrophic plankton groups (BMU1 and BMU2), and the relationship changed with water column stratification, suggesting that viruses also infect autotrophic picoplankton. Considering that the viral population in the ocean consists of viruses that infect all MFW components, such seasonal fluctuations are to be expected with a change in the ecological importance of their host populations [90]. Similar results were found in the western Mediterranean [41], where viruses correlated significantly with heterotrophic and autotrophic picoplankton, and the correlation changed with the seasons.

4.2. Virus-to-Microbe Ratio

Viruses are usually 10 to 20 times more abundant than heterotrophic and autotrophic picoplankton groups in the marine environment [4,5,10]. In our study, the viral population dominated the microbial population on average by 22.27 ± 10.28 times and in a range from 8.10 to 80.94 (Figure 3), which is consistent with previous results for the open waters of the Adriatic Sea [25] and the Mediterranean Sea [39,73,91] and generally represents the same ratio for the marine environment [4,5] (Figure 3). Temperature had a significant effect on viral host activity, as evidenced by the higher VMR during the SWC period in our study. Similar observations have been made previously in the Adriatic Sea [25] and the Mediterranean Sea [41].
VMR ratios varied in the water column, likely due to discontinuities of chemical and biological parameters that affected the abundance of their hosts [10]. For example, VMR was higher in the bottom layer than in the surface layer in April, June, August, and November, which was caused by a lower concentration of HB in the layer below the pycnocline. These differences could be due to the lower effect of abiotic parameters and nutrient concentrations, which favour slower bacterial growth and viral decay [92]. Accumulation of viral particles is therefore expected in oligotrophic environments where decay is low. The unusually low abundance of HB with fairly high abundances of PRO and SYN followed by a high VMR was detected in the bottom layer in June, which could be the result of water masses sinking from epipelagic zones, which could induce lysogenic viruses through the mixing process [93,94]. In addition, lysogeny and higher burst sizes have been proposed as mechanisms for a higher VMR [21], but lysogeny was not found to be of great importance in the open Adriatic [70]. However, a high VMR in the bathypelagic area has been previously described for the Mediterranean and other areas [39,81,92,95].

4.3. Control of Bacterial Populations in the Open Adriatic Sea

Strong TD control of the bacterial population was determined in almost all BMUs. The importance of viral infection and HNF grazing possibly increased with the formation of the thermocline, as described in BMU2. However, moderate BU control was determined in the surface layer represented by BMU4 when nutrients were depleted and the LNA bacterial group dominated the abundance of HB (Figure 4). Structural changes in MFW on the temporal scale, triggered by water column stratification, determined the strength of the two types of control [96].
Viruses are an important microbial mortality agent in oligotrophic areas where lysis may be equally as important as grazing in explaining the lack of standing-stock increase in microbes in that type of environment [7,97]. Viral lysis products may even directly or indirectly stimulate the growth of bacteria and picoplankton communities through shunting of dissolved organic matter [18,98,99], highlighting the important role of viruses in nutrient cycling [3,10,100,101]. The Gasol model [102] (Figure S6) revealed that TD control of HNFs was significant throughout the year, as was previously confirmed for the open central and south Adriatic [32,33]. It is known that high HNF grazing of HB can stimulate viral production and infection of bacterioplankton [8,103,104]. However, the SGR shifts in BMUs suggest that viruses may also be responsible for regenerating nutrients that maintain the HB population during the SWC period. This process is particularly evident in BMU4, where a positive SGR and a negative BB were observed, suggesting that the viral shunt possibly plays a role in recycling nutrients used by the bacterial population with a high SGR. The dominance of the viral shunt varies throughout the year, but when sampled on a larger scale, the process can be masked by bacterivory [105].
Interestingly, the virus population in BMU4 decreased when a moderate BU control of the bacterial population occurred. This population was probably kept in balance through infection of the LNA bacterial group which dominated in BMU4. The LNA bacterial group is particularly abundant and active in oligotrophic environments because it is better adapted to the low nutrient content in these areas [43]. HNFs respond to temperature variations similarly to viral populations, although in summer, when the water column is stratified, higher pressure on bacterial populations can also be expected [106]. It is possible that both HNFs and viruses are responsible for regenerating the nutrients needed for the HB population during the SWC period by killing winners adapted to the low nutrient conditions ascribed to BMU4 [107]. Infection and grazing pressure on the bacterial population could confer HNF and viral populations to balance their populations by targeting APP groups, especially under BMU2 conditions. It is known that HNFs selectively feed on larger microbial cells [108], although autotrophic organisms such as Prochlorococcus and Synechococcus are not considered high-quality food sources [109,110,111]. On the other hand, viruses exert a greater impact on the APP group in oligotrophic environments than in eutrophic coastal environments, where their effect on the HB population is more significant [10,112]. A similar observation has already been made in the Adriatic Sea [25,113,114].

5. Conclusions

The results of neural gas network analysis show that the virus population depends on spatial and temporal changes of biotic and abiotic factors. The strongest influence was found in the nonlinear relationship between viruses and temperature. Specifically, an increase in temperature leads to an increase in virus population, but only to the point where the virus population decreases as water temperature continues to rise. The number of virus populations in the P-limited open sea varied with the seasons, influenced by changes in water column stratification and abundance of its main host, HB. In more than 50% of observed data, a strong positive relationship between viruses and HB was determined. Moreover, this algorithm confirmed the association of viruses with the autotrophic part of the picoplankton and with HNFs. The dynamics of the four resulting clusters characterized by biological and environmental parameters are described as a cyclic pattern in the water layer above the thermocline when observed during the year. However, a long-term study period could provide better insight into the repeatability of the clusters. Neural gas analysis has proven to be an excellent tool for describing changes in MFW components in the open Adriatic.

Supplementary Materials

The following supporting information can be downloaded at: https://www.mdpi.com/article/10.3390/jmse11030639/s1, Table S1. Geographical location data and sampling depth; Table S2. Spearman’s R-rank values from the relationship analysis between virus-like particles (VLPs) and the biotic and abiotic variables; Table S3. The biomass of MFW components; Figure S1. Monthly values of temperature, salinity, and Chl a; Figure S2. Monthly concentration of nutrients; Figure S3. Cluster mapping in the nutrient ratio framework; Table S4. The ratio between HNA and LNA bacterial group; Figure S4. Abundances with average values; Figure S5. Log-log scatter plot of bacterial biomass and bacterial production; Figure S6. Relationship between the log abundances of heterotrophic nanoflagellates (empirical model by Gasol).

Author Contributions

Conceptualization, M.O.; methodology, D.Š., F.M., Ž.N.G. and J.V.; validation, D.Š., S.Š. and M.Š.; formal analysis, M.O., F.M., S.J., D.Š., Ž.N.G. and J.V.; investigation, M.O.; resources, M.O. and M.Š; data curation, M.O., D.Š. and F.M.; writing—original draft preparation, M.O.; writing—review and editing, M.O., M.Š., D.Š. and S.Š.; visualization, M.O. All authors have read and agreed to the published version of the manuscript.

Funding

This research received no external funding.

Data Availability Statement

The dataset presented in this study is available on valid request from the corresponding authors.

Acknowledgments

The authors would like to thank the crew of R/V BIOS DVA for their assistance during sampling efforts.

Conflicts of Interest

The authors declare no conflict of interest.

References

  1. Bergh, Ø.; Børsheim, K.Y.; Bratbak, G.; Heldal, M. High Abundance of Viruses Found in Aquatic Environments. Nature 1989, 340, 467–468. [Google Scholar] [CrossRef]
  2. Proctor, L.M.; Fuhrman, J.A. Viral Mortality of Marine Bacteria and Cyanobacteria. Nature 1990, 343, 60–62. [Google Scholar] [CrossRef]
  3. Suttle, C.A. Viruses in the Sea. Nature 2005, 437, 356–361. [Google Scholar] [CrossRef]
  4. Parikka, K.J.; Le Romancer, M.; Wauters, N.; Jacquet, S. Deciphering the Virus-to-Prokaryote Ratio (VPR): Insights into Virus–Host Relationships in a Variety of Ecosystems. Biol. Rev. 2017, 92, 1081–1100. [Google Scholar] [CrossRef] [PubMed]
  5. Wigington, C.H.; Sonderegger, D.; Brussaard, C.P.D.; Buchan, A.; Finke, J.F.; Fuhrman, J.A.; Lennon, J.T.; Middelboe, M.; Suttle, C.A.; Stock, C.; et al. Re-Examination of the Relationship Between Marine Virus and Microbial Cell Abundances. Nat. Microbiol. 2016, 1, 4–11. [Google Scholar] [CrossRef] [Green Version]
  6. Baudoux, A.C.; Veldhuis, M.J.W.; Witte, H.J.; Brussaard, C.P.D. Viruses as Mortality Agents of Picophytoplankton in the Deep Chlorophyll Maximum Layer During IRONAGES III. Limnol. Oceanogr. 2007, 52, 2519–2529. [Google Scholar] [CrossRef]
  7. Mojica, K.D.A.; Huisman, J.; Wilhelm, S.W.; Brussaard, C.P.D. Latitudinal Variation in Virus-Induced Mortality of Phytoplankton Across the North Atlantic Ocean. ISME J. 2016, 10, 500–513. [Google Scholar] [CrossRef] [PubMed] [Green Version]
  8. Tsai, A.Y.; Gong, G.C.; Chung, C.C.; Huang, Y.T. Different Impact of Nanoflagellate Grazing and Viral Lysis on Synechococcus spp. and Picoeukaryotic Mortality in Coastal Waters. Estuar. Coast. Shelf Sci. 2018, 209, 1–6. [Google Scholar] [CrossRef]
  9. Rohwer, F.; Thurber, R.V. Viruses Manipulate the Marine Environment. Nature 2009, 459, 207–212. [Google Scholar] [CrossRef]
  10. Weinbauer, M.G. Ecology of Prokaryotic Viruses. FEMS Microbiol. Rev. 2004, 28, 127–181. [Google Scholar] [CrossRef] [PubMed] [Green Version]
  11. Zimmerman, A.E.; Howard-Varona, C.; Needham, D.M.; John, S.G.; Worden, A.Z.; Sullivan, M.B.; Waldbauer, J.R.; Coleman, M.L. Metabolic and Biogeochemical Consequences of Viral Infection in Aquatic Ecosystems. Nat. Rev. Microbiol. 2020, 18, 21–34. [Google Scholar] [CrossRef] [PubMed]
  12. Poulton, A.J. Shunt or Shuttle. Nat. Geosci. 2021, 14, 180–181. [Google Scholar] [CrossRef]
  13. Allen, M.J.; Wilson, W.H. Aquatic Virus Diversity Accessed Through Omic Techniques: A Route Map to Function. Curr. Opin. Microbiol. 2008, 11, 226–232. [Google Scholar] [CrossRef]
  14. Danovaro, R.; Dell’Anno, A.; Corinaldesi, C.; Magagnini, M.; Noble, R.; Tamburini, C.; Weinbauer, M. Major Viral Impact on The Functioning of Benthic Deep-Sea Ecosystems. Nature 2008, 454, 1084–1087. [Google Scholar] [CrossRef]
  15. Kaneko, H.; Blanc-Mathieu, R.; Endo, H.; Chaffron, S.; Delmont, T.O.; Gaia, M.; Henry, N.; Hernández-Velázquez, R.; Nguyen, C.H.; Mamitsuka, H.; et al. Eukaryotic Virus Composition Can Predict the Efficiency of Carbon Export in the Global Ocean. iScience 2021, 24, 102002. [Google Scholar] [CrossRef] [PubMed]
  16. Sullivan, M.B.; Weitz, J.S.; Wilhelm, S. Viral Ecology Comes of Age. Environ. Microbiol. Rep. 2017, 9, 3. [Google Scholar] [CrossRef]
  17. Riemann, L.; Holmfeldt, K.; Titelman, J. Importance of Viral Lysis and Dissolved DNA For Bacterioplankton Activity in A P-Limited Estuary, Northern Baltic Sea. Microb. Ecol. 2009, 57, 286–294. [Google Scholar] [CrossRef]
  18. Weinbauer, M.G.; Bonilla-Findji, O.; Chan, A.M.; Dolan, J.R.; Short, S.M.; Imek, K.; Wilhelm, S.W.; Suttle, C.A. Synechococcus Growth in the Ocean May Depend on the Lysis of Heterotrophic Bacteria. J. Plankton Res. 2011, 33, 1465–1476. [Google Scholar] [CrossRef]
  19. Jover, L.F.; Effler, T.C.; Buchan, A.; Wilhelm, S.W.; Weitz, J.S. The Elemental Composition of Virus Particles: Implications for Marine Biogeochemical Cycles. Nat. Rev. Microbiol. 2014, 12, 519–528. [Google Scholar] [CrossRef]
  20. Gonzalez, J.M.; Suttle, C.A. Grazing by Marine Nanoflagellates on Viruses and Virus-Sized Particles: Ingestion and Digestion. Mar. Ecol. Prog. Ser. 1993, 94, 1–10. [Google Scholar] [CrossRef]
  21. Bongiorni, L.; Magagnini, M.; Armeni, M.; Noble, R.; Danovaro, R. Viral Production, Decay Rates, and Life Strategies Along a Trophic Gradient in the North Adriatic Sea. Appl. Environ. Microbiol. 2005, 71, 6644–6650. [Google Scholar] [CrossRef] [PubMed] [Green Version]
  22. Welsh, J.E.; Steenhuis, P.; de Moraes, K.R.; van der Meer, J.; Thieltges, D.W.; Brussaard, C.P.D. Marine Virus Predation by Non-Host Organisms. Sci. Rep. 2020, 10, 5221. [Google Scholar] [CrossRef] [PubMed] [Green Version]
  23. Thingstad, T.F.; Skjoldal, E.F.; Bohne, R.A. Phosphorus Cycling and Algal-Bacterial Competition in Sandsfjord, Western Norway. Mar. Ecol. Prog. Ser. 1993, 99, 239–259. [Google Scholar] [CrossRef]
  24. Jacquet, S.; Miki, T.; Noble, R.; Peduzzi, P.; Wilhelm, S. Viruses in Aquatic Ecosystems: Important Advancements of the Last 20 Years and Prospects for the Future in the Field of Microbial Oceanography and Limnology. Adv. Oceanogr. Limnol. 2010, 1, 97–141. [Google Scholar] [CrossRef]
  25. Ordulj, M.; Krstulović, N.; Šantić, D.; Jozić, S.; Šolić, M. Distribution of Marine Viruses in the Central and South Adriatic Sea. Mediterr. Mar. Sci. 2015, 16, 65–72. [Google Scholar] [CrossRef] [Green Version]
  26. Suttle, C.A. Marine Viruses–Major Players in the Global Ecosystem. Nat. Rev. Microbiol. 2007, 5, 801–812. [Google Scholar] [CrossRef] [PubMed]
  27. Winter, C.; Bouvier, T.; Weinbauer, M.G.; Thingstad, T.F. Trade-Offs Between Competition and Defense Specialists Among Unicellular Planktonic Organisms: The “Killing the Winner” Hypothesis Revisited. Microbiol. Mol. Biol. Rev. 2010, 74, 42–57. [Google Scholar] [CrossRef] [Green Version]
  28. Weinbauer, M.G.; Rassoulzadegan, F. Are Viruses Driving Microbial Diversification and Diversity? Environ. Microbiol. 2004, 6, 1–11. [Google Scholar] [CrossRef]
  29. Šolić, M.; Krstulović, N.; Kušpilić, G.; Ninčević Gladan, Ž.; Bojanić, N.; Šestanović, S.; Šantić, D.; Ordulj, M.; Ninčević Gladan, T.; Bojanić, N.; et al. Changes in Microbial Food Web Structure in Response to Changed Environmental Trophic Status: A Case Study of the Vranjic Basin (Adriatic Sea). Mar. Environ. Res. 2010, 70, 239–249. [Google Scholar] [CrossRef]
  30. Šantić, D.; Krstulović, N.; Šolić, M.; Ordulj, M.; Kušpilić, G. Dynamics of Prokaryotic Picoplankton Community in the Central and Southern Adriatic Sea (Croatia). Helgol. Mar. Res. 2013, 67, 471–481. [Google Scholar] [CrossRef] [Green Version]
  31. Šolić, M.; Grbec, B.; Matić, F.; Šantić, D.; Šestanović, S.; Ninčević Gladan, Ž.; Bojanić, N.; Ordulj, M.; Jozić, S.; Vrdoljak, A. Spatio-Temporal Reproducibility of the Microbial Food Web Structure Associated with the Change in Temperature: Long-Term Observations in the Adriatic Sea. Prog. Oceanogr. 2018, 161, 87–101. [Google Scholar] [CrossRef]
  32. Šolić, M.; Šantić, D.; Šestanović, S.; Bojanić, N.; Grbec, B.; Jozić, S.; Vrdoljak, A.; Ordulj, M.; Matić, F.; Kušpilić, G.; et al. Impact of Water Column Stability Dynamics on the Succession of Plankton Food Web Types in the Offshore Area of the Adriatic Sea. J. Sea Res. 2020, 158, 101860. [Google Scholar] [CrossRef]
  33. Šolić, M.; Šantić, D.; Šestanović, S.; Kušpilić, G.; Matić, F.; Vrdoljak Tomaš, A.; Jozić, S.; Bojanić, N.; Ninčević Gladan, Ž. Changing Ecological Conditions in the Marine Environment Generate Different Microbial Food Web Structures in a Repeatable Manner. Front. Mar. Sci. 2022, 8, 2104. [Google Scholar] [CrossRef]
  34. Malfatti, F.; Turk, V.; Tinta, T.; Mozetič, P.; Manganelli, M.; Samo, T.J.; Ugalde, J.A.; Kovač, N.; Stefanelli, M.; Antonioli, M.; et al. Microbial Mechanisms Coupling Carbon and Phosphorus Cycles in Phosphorus-Limited Northern Adriatic Sea. Sci. Total Environ. 2014, 470–471, 1173–1183. [Google Scholar] [CrossRef] [PubMed]
  35. Šolić, M.; Krstulović, N.; Šantić, D.; Šestanović, S.; Ordulj, M.; Bojanić, N.; Kušpilić, G. Structure of Microbial Communities in Phosphorus-Limited Estuaries Along the Eastern Adriatic Coast. J. Mar. Biol. Assoc. UK 2015, 95, 1565–1578. [Google Scholar] [CrossRef]
  36. Alonso, M.C.; Jimenez-Gomez, F.; Rodriguez, J.; Borrego, J.J. Distribution of Virus-Like Particles in an Oligotrophic Marine Environment (Alboran Sea, Western Mediterranean). Microb. Ecol. 2001, 42, 407–415. [Google Scholar] [CrossRef]
  37. Magagnini, M.; Corinaldesi, C.; Monticelli, L.S.; De Domenico, E.; Danovaro, R. Viral Abundance and Distribution in Mesopelagic and Bathypelagic Waters of the Mediterranean Sea. Deep. Res. Part I Oceanogr. Res. Pap. 2007, 54, 1209–1220. [Google Scholar] [CrossRef]
  38. Boras, J.A.; Sala, M.M.; Vázquez-Domínguez, E.; Weinbauer, M.G.; Vaqué, D. Annual Changes of Bacterial Mortality due to Viruses and Protists in an Oligotrophic Coastal Environment (NW Mediterranean). Environ. Microbiol. 2009, 11, 1181–1193. [Google Scholar] [CrossRef]
  39. Winter, C.; Kerros, M.E.; Weinbauer, M.G. Seasonal and Depth-Related Dynamics of Prokaryotes and Viruses in Surface and Deep Waters of the Northwestern Mediterranean Sea. Deep. Res. Part I Oceanogr. Res. Pap. 2009, 56, 1972–1982. [Google Scholar] [CrossRef]
  40. Magiopoulos, I.; Pitta, P. Viruses in a Deep Oligotrophic Sea: Seasonal Distribution of Marine Viruses in the Epi-, Meso- and Bathypelagic Waters of the Eastern Mediterranean Sea. Deep. Res. Part I Oceanogr. Res. Pap. 2012, 66, 1–10. [Google Scholar] [CrossRef]
  41. Johnstone, C.; Salles, S.; Mercado, J.M.; Cortés, D.; Yebra, L.; Gómez-Jakobsen, F.; Sánchez, A.; Alonso, A.; Valcárcel-Pérez, N. Abundance of Virus-Like Particles (Vlps) and Microbial Plankton Community Composition in a Mediterranean Sea Coastal Area. Aquat. Microb. Ecol. 2018, 81, 137–148. [Google Scholar] [CrossRef]
  42. Corinaldesi, C.; Crevatin, E.; Del Negro, P.; Marini, M.; Russo, A.; Fonda-Umani, S.; Danovaro, R. Large-Scale Spatial Distribution of Virioplankton in the Adriatic Sea: Testing the Trophic State Control Hypothesis. Appl. Environ. Microbiol. 2003, 69, 2664–2673. [Google Scholar] [CrossRef] [Green Version]
  43. Šantić, D.; Kovačević, V.; Bensi, M.; Giani, M.; Tomaš, A.V.A.V.; Ordulj, M.; Santinelli, C.; Šestanović, S.; Šolić, M.; Grbec, B. Picoplankton Distribution and Activity in the Deep Waters of the Southern Adriatic Sea. Water 2019, 11, 1655. [Google Scholar] [CrossRef] [Green Version]
  44. Grasshoff, K.; Ehrhardt, M.; Kremling, K. Methods of Sea Water Analysis. Int. Rev. Gesamten Hydrobiol. Hydrogr. 1983, 70, 302–303. [Google Scholar] [CrossRef]
  45. Parsons, R.J.; Breitbart, M.; Lomas, M.W.; Carlson, C.A. Ocean Time-Series Reveals Recurring Seasonal Patterns of Virioplankton Dynamics in the Northwestern Sargasso Sea. ISME J. 2012, 6, 273–284. [Google Scholar] [CrossRef] [Green Version]
  46. Strickland, J.D.H.; Parsons, T.R. A Practical Handbook of Seawater Analysis; Fisheries Research Board of Canada: Ottawa, ON, Canada, 1972; Volume 167. [Google Scholar]
  47. Noble, R.T.; Fuhrman, J.A. Use of SYBR Green I for Rapid Epifluorescence Counts of Marine Viruses and Bacteria. Aquat. Microb. Ecol. 1998, 14, 113–118. [Google Scholar] [CrossRef] [Green Version]
  48. Zubkov, M.V.; Burkill, P.H.; Topping, J.N. Flow Cytometric Enumeration of DNA-Stained Oceanic Planktonic Protists. J. Plankton Res. 2006, 29, 79–86. [Google Scholar] [CrossRef] [Green Version]
  49. Christaki, U.; Van Wambeke, F.; Lefevre, D.; Lagaria, A.; Prieur, L.; Pujo-Pay, M.; Grattepanche, J.D.; Colombet, J.; Psarra, S.; Dolan, J.R.; et al. Microbial Food Webs and Metabolic State Across Oligotrophic Waters of the Mediterranean Sea During Summer. Biogeosciences 2011, 8, 1839–1852. [Google Scholar] [CrossRef] [Green Version]
  50. Fuhrman, J.A.; Azam, F. Thymidine Incorporation as a Measure of Heterotrophic Bacterioplankton Production in Marine Surface Waters: Evaluation and Field Results. Mar. Biol. 1982, 66, 109–120. [Google Scholar] [CrossRef]
  51. Riemann, B.; Bjørnsen, P.K.; Newell, S.; Fallon, R. Calculation of Cell Production of Coastal Marine Bacteria Based on Measured Incorporation of [3H]thymidine 1, 2. Limnol. Oceanogr. 1987, 32, 471–476. [Google Scholar] [CrossRef]
  52. Rhee, G.Y. Phosphate uptake under nitrate limitation by Scenedesmus sp. and its ecological implications. J. Phycol. 1974, 9, 495–506. [Google Scholar] [CrossRef]
  53. Perry, M.J.; Eppley, R.W. Phosphate Uptake by Phytoplankton in the Central North Pacific Ocean. Deep Sea Res. Part A Oceanogr. Res. Pap. 1981, 28, 39–49. [Google Scholar] [CrossRef]
  54. Brzezinski, M.A. The Si:C:N Ratio of Marine Diatoms: Interspecific Variability and the Effect of Some Environmental Variables. J. Phycol. 1985, 21, 347–357. [Google Scholar] [CrossRef]
  55. Goldman, J.C.; Glibert, P.M. Kinetics of Inorganic Nitrogen Uptake by Phytoplankton. In Nitrogen in the Marine Environment; Elsevier: Amsterdam, The Netherlands, 1983; pp. 233–274. [Google Scholar]
  56. Dortch, Q.; Whitledge, T.E. Does Nitrogen or Silicon Limit Phytoplankton Production in the Mississippi River Plume and Nearby Regions? Cont. Shelf Res. 1992, 12, 1293–1309. [Google Scholar] [CrossRef]
  57. Justić, D.; Rabalais, N.N.; Turner, R.E.; Dortch, Q. Changes in Nutrient Structure of River-Dominated Coastal Waters: Stoichiometric Nutrient Balance and Its Consequences. Estuar. Coast. Shelf Sci. 1995, 40, 339–356. [Google Scholar] [CrossRef]
  58. Billen, G.; Servais, P.; Becquevort, S. Dynamics of Bacterioplankton in Oligotrophic and Eutrophic Aquatic Environments: Bottom-Up or Top-Down Control? Hydrobiologia 1990, 207, 37–42. [Google Scholar] [CrossRef]
  59. Ducklow, H.W. Factors Regulating Bottom-Up Control of Bacteria Biomass in Open Ocean Plankton Communities. Arch. Hydrobiol. Beih. Ergebn. Limnol. 1992, 37, 207–217. [Google Scholar]
  60. Šolić, M.; Šantić, D.; Šestanović, S.; Bojanić, N.; Jozić, S.; Ordulj, M.; Tomaš, A.V.; Kušpilić, G. Changes in the Trophic Pathways within the Microbial Food Web in the Global Warming Scenario: An Experimental Study in the Adriatic Sea. Microorganisms 2020, 8, 510. [Google Scholar] [CrossRef] [PubMed] [Green Version]
  61. Lee, S.; Fuhrman, J.A. Relationships between Biovolume and Biomass of Naturally Derived Marine Bacterioplankton. Appl. Environ. Microbiol. 1987, 53, 1298–1303. [Google Scholar] [CrossRef] [PubMed] [Green Version]
  62. Kirchman, D.L.; Keil, R.G.; Simon, M. Biomass and Production of Heterotrophic Bacterioplankton in the Oceanic Subarctic Pacific Samples for Bacterial Abundance and Incorporation Rates Were Taken from CTD Niskin Bottles. These Bottles All Had Silicone Tubing During the Cruises Reported Here. Deep. Res. Part 1. Oceanogr. Res. Pap. 1993, 40, 967–988. [Google Scholar] [CrossRef]
  63. Kohonen, T. Self-Organized Formation of Topologically Correct Feature Maps. Biol. Cybern. 1982, 43, 59–69. [Google Scholar] [CrossRef]
  64. Martinetz, T.; Schulten, K. A “Neural Gas” Network Learns Topologies. In Artificial Neural Networks; Elsevier: Amsterdam, The Netherlands, 1991; pp. 397–402. [Google Scholar]
  65. Martinetz, T.; Berkovich, S.G.; Schulten, K.J. “Neural-gas” Network for Vector Quantization and its Application to Time-Series Prediction. IEEE Trans. Neural Netw. 1993, 4, 558–569. [Google Scholar] [CrossRef] [PubMed]
  66. Fonda, U.S.; Malisana, E.; Focaracci, F.; Magagnini, M.; Corinaldesi, C.; Danovaro, R. Disentangling the Effect of Viruses and Nanoflagellates on Prokaryotes in Bathypelagic Waters of the Mediterranean Sea. Mar. Ecol. Prog. Ser. 2010, 418, 73–85. [Google Scholar] [CrossRef]
  67. Xie, L.; Wei, W.; Cai, L.; Chen, X.; Huang, Y.; Jiao, N.; Zhang, R.; Luo, Y.-W. A Global Viral Oceanography Database (gVOD). Earth Syst. Sci. Data Discuss. 2020, 13, 1251–1271. [Google Scholar] [CrossRef]
  68. Cochlan, W.P.; Wikner, J.; Steward, G.F.; Smith, D.C. Environments. Mar. Ecol. -Prog. Ser. 1993, 92, 77–87. [Google Scholar] [CrossRef]
  69. Liang, Y.; Li, L.; Luo, T.; Zhang, Y.; Zhang, R.; Jiao, N. Horizontal and Vertical Distribution of Marine Virioplankton: A basin Scale Investigation Based on a Global Cruise. PLoS ONE 2014, 9, e111634. [Google Scholar] [CrossRef]
  70. Ordulj, M.; Krstulović, N.; Šantić, D.; Jozić, S.; Šolić, M. Viral Dynamics in two Trophically Different Areas in the Central Adriatic Sea. Helgol. Mar. Res. 2017, 71, 22. [Google Scholar] [CrossRef] [Green Version]
  71. Brum, J.R.; Hurwitz, B.L.; Schofield, O.; Ducklow, H.W.; Sullivan, M.B. Seasonal Time Bombs: Dominant Temperate Viruses Affect Southern Ocean Microbial Dynamics. ISME J. 2016, 10, 437–449. [Google Scholar] [CrossRef]
  72. Sotomayor-Garcia, A.; Sala, M.M.; Ferrera, I.; Estrada, M.; Vázquez-Domínguez, E.; Emelianov, M.; Cortés, P.; Marrasé, C.; Ortega-Retuerta, E.; Nunes, S.; et al. Assessing Viral Abundance and Community Composition in Four Contrasting Regions of the Southern Ocean. Life 2020, 10, 107. [Google Scholar] [CrossRef] [PubMed]
  73. De Corte, D.; Sintes, E.; Yokokawa, T.; Reinthaler, T.; Herndl, G.J. Links Between Viruses and Prokaryotes Throughout the Water Column Along a North Atlantic Latitudinal Transect. ISME J. 2012, 6, 1566–1577. [Google Scholar] [CrossRef] [Green Version]
  74. Liang, Y.; Zhang, Y.; Zhang, Y.; Luo, T.; Rivkin, R.B.; Jiao, N. Distributions and Relationships of Virio- and Picoplankton in The Epi-, Meso- and Bathypelagic Zones of the Western Pacific Ocean. FEMS Microbiol. Ecol. 2017, 93, fiw238. [Google Scholar] [CrossRef]
  75. Sabbagh, E.I.; Huete-Stauffer, T.M.; Calleja, M.L.L.; Silva, L.; Viegas, M.; Morán, X.A.G. Weekly Variations of Viruses and Heterotrophic Nanoflagellates and Their Potential Impact on Bacterioplankton in Shallow Waters of the Central Red Sea. FEMS Microbiol. Ecol. 2021, 96, fiaa033. [Google Scholar] [CrossRef] [PubMed]
  76. Šantić, D.; Piwosz, K.; Matić, F.; Vrdoljak Tomaš, A.; Arapov, J.; Dean, J.L.; Šolić, M.; Koblížek, M.; Kušpilić, G.; Šestanović, S. Artificial Neural Network Analysis of Microbial Diversity in the Central and Southern Adriatic Sea. Sci. Rep. 2021, 11, 11186. [Google Scholar] [CrossRef] [PubMed]
  77. Winter, C.; Smit, A.; Szoeke-Dénes, T.; Herndl, G.J.; Weinbauer, M.G. Modelling Viral Impact on Bacterioplankton in the North Sea Using Artificial Neural Networks. Environ. Microbiol. 2005, 7, 881–893. [Google Scholar] [CrossRef]
  78. Pereira, G.C.; Oliveira, M.M.F.; Ebecken, N.F.F. Genetic Optimization of Artificial Neural Networks to Forecast Virioplankton Abundance from Cytometric Data. J. Intell. Learn. Syst. Appl. 2013, 05, 57–66. [Google Scholar] [CrossRef] [Green Version]
  79. Hurwitz, B.L.; Sullivan, M.B. The Pacific Ocean Virome (POV): A Marine Viral Metagenomic Dataset and Associated Protein Clusters for Quantitative Viral Ecology. PLoS ONE 2013, 8, e57355. [Google Scholar] [CrossRef]
  80. Breitbart, M.; Thompson, L.R.; Suttle, C.A.; Sullivan, M.B. Exploring the Vast Diversity of Marine Viruses. Oceanography 2007, 20, 135–139. [Google Scholar] [CrossRef]
  81. Wommack, K.E.; Colwell, R.R. Virioplankton: Viruses in Aquatic Ecosystems. Microbiol. Mol. Biol. Rev. 2000, 64, 69–114. [Google Scholar] [CrossRef] [Green Version]
  82. Šantić, D.; Šestanović, S.; Šolić, M.; Krstulović, N.; Kušpilić, G.; Ordulj, M.; Ninčević Gladan, Ž. Dynamics of the Picoplankton Community from Coastal Waters to the Open Sea in the Central Adriatic. Mediterr. Mar. Sci. 2014, 15, 179–188. [Google Scholar] [CrossRef] [Green Version]
  83. Šantić, D.; Krstulović, N.; Šolić, M.; Kušpilić, G. HNA and LNA Bacteria in Relation to the Activity of Heterotrophic Bacteria. Acta Adriat. 2012, 53, 25–39. [Google Scholar]
  84. Trombetta, T.; Vidussi, F.; Roques, C.; Scotti, M.; Mostajir, B. Marine Microbial Food Web Networks During Phytoplankton Bloom and Non-bloom Periods: Warming Favors Smaller Organism Interactions and Intensifies Trophic Cascade. Front. Microbiol. 2020, 11, 502336. [Google Scholar] [CrossRef] [PubMed]
  85. Thingstad, T.F. Elements of a Theory for the Mechanisms Controlling Abundance, Diversity, and Biogeochemical Role of Lytic Bacterial Viruses in Aquatic Systems. Limnol. Oceanogr. 2000, 45, 1320–1328. [Google Scholar] [CrossRef]
  86. Touchon, M.; Bernheim, A.; Rocha, E.P.C. Genetic and Life-History Traits Associated with the Distribution of Prophages in Bacteria. ISME J. 2016, 10, 2744–2754. [Google Scholar] [CrossRef] [PubMed] [Green Version]
  87. Chen, X.; Ma, R.; Yang, Y.; Jiao, N.; Zhang, R. Viral Regulation on Bacterial Community Impacted by Lysis-Lysogeny Switch: A Microcosm Experiment in Eutrophic Coastal Waters. Front. Microbiol. 2019, 10, 1763. [Google Scholar] [CrossRef] [Green Version]
  88. Yang, Y.; Yokokawa, T.; Motegi, C.; Nagata, T. Large-Scale Distribution of Viruses in Deep Waters of the Pacific and Southern Oceans. Aquat. Microb. Ecol. 2014, 71, 193–202. [Google Scholar] [CrossRef] [Green Version]
  89. De Corte, D.; Sintes, E.; Yokokawa, T.; Lekunberri, I.; Herndl, G.J. Large-Scale Distribution of Microbial and Viral Populations in the South Atlantic Ocean. Environ. Microbiol. Rep. 2016, 8, 305–315. [Google Scholar] [CrossRef] [Green Version]
  90. Johannessen, T.V.; Larsen, A.; Bratbak, G.; Pagarete, A.; Edvardsen, B.; Egge, E.D.; Sandaa, R.A. Seasonal Dynamics of Haptophytes and Dsdna Algal Viruses Suggest Complex Virus-Host Relationship. Viruses 2017, 9, 84. [Google Scholar] [CrossRef]
  91. Siokou-Frangou, I.; Christaki, U.; Mazzocchi, M.G.; Montresor, M.; Ribera D’Alcala, M.; Vaque, D.; Zingone, A. Plankton in the Open Mediterranean Sea: A Review. Biogeosciences 2010, 7, 1543–1586. [Google Scholar] [CrossRef] [Green Version]
  92. Parada, V.; Sintes, E.; Van Aken, H.M.; Weinbauer, M.G.; Herndl, G.J. Viral Abundance, Decay, and Diversity in the Meso- and Bathypelagic Waters of the North Atlantic. Appl. Environ. Microbiol. 2007, 73, 4429–4438. [Google Scholar] [CrossRef] [Green Version]
  93. Hurwitz, B.L.; Brum, J.R.; Sullivan, M.B. Depth-stratified functional and taxonomic niche specialization in the “core” and “flexible” Pacific Ocean Virome. ISME J. 2015, 9, 472–484. [Google Scholar] [CrossRef] [Green Version]
  94. Winter, C.; Köstner, N.; Kruspe, C.P.; Urban, D.; Muck, S.; Reinthaler, T.; Herndl, G.J. Mixing Alters the Lytic Activity of Viruses in the Dark Ocean. Ecology 2018, 99, 700–713. [Google Scholar] [CrossRef] [PubMed] [Green Version]
  95. De Corte, D.; Sintes, E.; Winter, C.; Yokokawa, T.; Reinthaler, T.; Herndl, G.J. Links Between Viral and Prokaryotic Communities Throughout the Water Column in the (Sub)Tropical Atlantic Ocean. ISME J. 2010, 4, 1431–1442. [Google Scholar] [CrossRef] [PubMed]
  96. Šolić, M.; Krstulović, N.; Vilibić, I.; Bojanić, N.; Kušpilić, G.; Šestanović, S.; Šantić, D.; Ordulj, M. Variability in the Bottom-Up and Top-Down Controls of Bacteria on Trophic and Temporal Scales in the Middle Adriatic Sea. Aquat. Microb. Ecol. 2010, 58, 15–29. [Google Scholar] [CrossRef] [Green Version]
  97. Weinbauer, M.G.; Christaki, U.; Nedoma, J.; Šimek, K. Comparing the Effects of Resource Enrichment and Grazing on Viral Production in a Meso-Eutrophic Reservoir. Aquat. Microb. Ecol. 2003, 31, 137–144. [Google Scholar] [CrossRef]
  98. Middelboe, M.; Riemann, L.; Steward, G.F.; Hansen, V.; Nybroe, O. Virus-induced transfer of organic carbon between marine bacteria in a model community. Aquat. Microb. Ecol. 2003, 33, a033P001. [Google Scholar] [CrossRef] [Green Version]
  99. Ory, P.; Hartmann, H.J.; Jude, F.; Dupuy, C.; Del Amo, Y.; Catala, P.; Mornet, F.; Huet, V.; Jan, B.; Vincent, D.; et al. Pelagic Food Web Patterns: Do They Modulate Virus and Nanoflagellate Effects on Picoplankton During the Phytoplankton Spring Bloom? Environ. Microbiol. 2010, 12, 2755–2772. [Google Scholar] [CrossRef] [PubMed] [Green Version]
  100. Fuhrman, J.A. Marine Viruses and Their Biogeochemical and Ecological Effects. Nature 1999, 399, 541–548. [Google Scholar] [CrossRef]
  101. Brussaard, C.P.D.; Wilhelm, S.W.; Thingstad, F.; Weinbauer, M.G.; Bratbak, G.; Heldal, M.; Kimmance, S.A.; Middelboe, M.; Nagasaki, K.; Paul, J.H.; et al. Global-Scale Processes with a Nanoscale Drive: The Role of Marine Viruses. ISME J. 2008, 2, 575–578. [Google Scholar] [CrossRef] [Green Version]
  102. Gasol, J.M. A Framework for the Assessment of Top-Down vs. Bottom-Up Control of Heterotrophic Nanoflagellate Abundance. Mar. Ecol. Prog. Ser. 1994, 113, 291–300. [Google Scholar] [CrossRef]
  103. Šimek, K.; Pernthaler, J.; Weinbauer, M.G.; Hornák, K.; Dolan, J.R.; Nedoma, J.; Mašín, M.; Amann, R. Changes in Bacterial Community Composition and Dynamics and Viral Mortality Rates Associated with Enhanced Flagellate Grazing in a Mesoeutrophic Reservoir. Appl. Environ. Microbiol. 2001, 67, 2723–2733. [Google Scholar] [CrossRef] [Green Version]
  104. Ho, P.; Gong, G.; Mukhanov, V.; Zhu, Z.; Tsai, A. Annual Cycle of the Synechococcus spp. and Picoeukaryotic Growth and Loss Rates in a Subtropical Coastal Ecosystem. Diversity 2022, 14, 49. [Google Scholar] [CrossRef]
  105. Shiah, F.-K.; Lai, C.-C.; Chen, T.-Y.; Ko, C.-Y.; Tai, J.-H.; Chang, C.-W. Viral Shunt in Tropical Oligotrophic Ocean. Sci. Adv. 2022, 8, eabo2829. [Google Scholar] [CrossRef]
  106. Vaqué, D.; Gasol, J.M.; Marrasé, C. Grazing rates on bacteria: The Significance of Methodology and Ecological Factors. Mar. Ecol. Prog. Ser. 1994, 109, 263–274. [Google Scholar] [CrossRef]
  107. Chen, X.; Weinbauer, M.G.; Jiao, N.; Zhang, R. Revisiting Marine Lytic and Lysogenic Virus-Host Interactions: Kill-the-Winner and Piggyback-the-Winner. Sci. Bull. 2021, 66, 871–874. [Google Scholar] [CrossRef] [PubMed]
  108. Weinbauer, M.G.; Kerros, M.E.; Motegi, C.; Wilhartitz, I.C.; Rassoulzadegan, F.; Torreton, J.P.; Mari, X. Bacterial Community Composition and Potential Controlling Mechanisms Along a Trophic Gradient in a Barrier Reef System. Aquat. Microb. Ecol. 2010, 60, 15–28. [Google Scholar] [CrossRef]
  109. Christaki, U.; Giannakourou, A.; Van Wambeke, F.; Grégori, G. Nanoflagellate Predation on Auto- And Heterotrophic Picoplankton in the Oligotrophic Mediterranean Sea. J. Plankton Res. 2001, 23, 1297–1310. [Google Scholar] [CrossRef] [Green Version]
  110. Frias-Lopez, J.; Thompson, A.; Waldbauer, J.; Chisholm, S.W. Use of Stable Isotope-Labelled Cells to Identify Active Grazers of Picocyanobacteria in Ocean Surface Waters. Environ. Microbiol. 2009, 11, 512–525. [Google Scholar] [CrossRef] [Green Version]
  111. Bouvy, M.; Bettarel, Y.; Bouvier, C.; Domaizon, I.; Jacquet, S.; Le Floc’h, E.; Montanié, H.; Mostajir, B.; Sime-Ngando, T.; Torréton, J.P.; et al. Trophic Interactions between Viruses, Bacteria and Nanoflagellates Under Various Nutrient Conditions and Simulated Climate Change. Environ. Microbiol. 2011, 13, 1842–1857. [Google Scholar] [CrossRef] [PubMed]
  112. Parada, V.; Herndl, G.J.; Weinbauer, M.G. Viral Burst Size of Heterotrophic Prokaryotes in Aquatic Systems. J. Mar. Biol. Assoc. UK 2006, 86, 613–621. [Google Scholar] [CrossRef]
  113. Weinbauer, M.G.; Fuks, D.; Peduzzi, P. Distribution of Viruses and Dissolved DNA Along a Coastal Trophic Gradient in the Northern Adriatic Sea. Appl. Environ. Microbiol. 1993, 59, 4074–4082. [Google Scholar] [CrossRef] [Green Version]
  114. Šolić, M.; Šantić, D.; Šestanović, S.; Bojanić, N.; Ordulj, M.; Jozić, S.; Vrdoljak, A. The effect of Temperature Increase on Microbial Carbon Fluxes in the Adriatic Sea: An Experimental Approach. FEMS Microbiol. Ecol. 2018, 94, fiy169. [Google Scholar] [CrossRef] [PubMed] [Green Version]
Figure 1. Study area with a sampling station.
Jmse 11 00639 g001
Figure 2. (A) Bar plot representations of biotic and abiotic parameters for NG best-matching units and the relative frequency appearance for each unit. Values are standardized as z-scores; (B) water column distribution of NG best-matching units (labelled by number and differentiated by colour).
Jmse 11 00639 g002
Figure 3. Monthly values with mean of virus-to-microbe ratio (VMR) for the sampled station.
Jmse 11 00639 g003
Figure 4. Regression slopes of bacterial production (BP) vs. bacterial biomass (BB) representing the relative BU and TD control of bacterial population for analysed clusters. The orange line marks the upper limit of no BU, and the grey line marks the upper limit for weak BU values according to Ducklow [59]. Values are standardized as z-scores.
Jmse 11 00639 g004
Table 1. Mean values and standard deviation for biotic parameters (HB—heterotrophic bacteria, BP—bacterial production, HNF—heterotrophic nanoflagellates, HNA—high nucleic acid heterotrophic bacterial group, LNA—low nucleic acid heterotrophic bacterial group, PRO—Prochlorococcus, SYN—Synechococcus, PE—picoeukaryotes, CHL a—chlorophyll a, VMR—virus-to-microbe ratio) and environmental parameters at studied site and samples assigned to clustered in best matching units (BMUs).
CJ011BMU1BMU2BMU3BMU4
VLP (×106 VLP mL−1)6.7 ± 2.285.14 ± 0.689.89 ± 1.996.09 ± 1.766.59 ± 1.13
HB (×106 cells mL−1)0.34 ± 0.090.29 ± 0.10.39 ± 0.020.37 ± 0.10.29 ± 0.06
BP (×104 cells mL−1)0.27 ± 0.180.28 ± 0.30.26 ± 0.070.25 ± 0.120.32 ± 0.09
HNF (×103 cells mL−1)2.04 ± 1.271.55 ± 0.963.33 ± 1.761.59 ± 0.752.08 ± 0.78
HNA (%)49.9 ± 6.2151.53 ± 4.4949.62 ± 9.6550.47 ± 5.1245.6 ± 24.24
LNA (%)50.1 ± 6.2148.48 ± 4.4950.38 ± 9.6549.53 ± 5.1254.4 ± 4.44
PRO (×103 cells mL−1)1.95 ± 1.712.36 ± 1.042.19 ± 2.452.02 ± 1.810.61 ± 0.32
SYN (×103 cells mL−1)2.66 ± 3.391.65 ± 1.395.21 ± 6.192.46 ± 2.071.34 ± 0.43
PE (×103 cells mL−1)1.23 ± 0.790.74 ± 0.511.74 ± 1.161.34 ± 0.671.14 ± 0.27
CHL a (mg m−3)0.27 ± 0.260.27 ± 0.190.25 ± 0.360.37 ± 0.250.05 ± 0.06
SGR (day−1)0.56 ± 0.320.62 ± 0.590.59 ± 0.400.50 ± 0.220.54 ± 0.39
VMR21.42 ± 11.5023 ± 21.1125.7 ± 6.1118.29 ± 7.3423.1 ± 1.86
T (°C)16.93 ± 3.3613.85 ± 0.5718.97 ± 0.8815.52 ± 0.5623.55 ± 1
S38.62 ± 0.3438.81 ± 0.0738.25 ± 0.3438.84 ± 0.0738.28 ± 0.38
O2 (mL/L)5.65 ± 0.315.7 ± 0.25.66 ± 0.295.61 ± 0.335.61 ± 0.47
pH8.20 ± 0.038.18 ± 0.028.22 ± 0.028.2 ± 0.038.24 ± 0.01
NO3 (μmol L−1)1.01 ± 0.991.6 ± 1.360.96 ± 0.680.59 ± 0.710.94 ± 0.77
NO2 (μmol L−1)0.13 ± 0.140.15 ± 0.140.19 ± 0.230.11 ± 0.060.06 ± 0.04
NH4+ (μmol L−1)0.74 ± 0.540.93 ± 0.720.71 ± 0.520.71 ± 0.430.47 ± 0.38
PO4 (μmol L−1)0.02 ± 0.020.02 ± 0.020.04 ± 0.030.02 ± 0.030.01 ± 0.01
SiO4 (μmol L−1)0.99 ± 0.641.29 ± 0.360.7 ± 0.210.94 ± 0.960.93 ± 0.08
Disclaimer/Publisher’s Note: The statements, opinions and data contained in all publications are solely those of the individual author(s) and contributor(s) and not of MDPI and/or the editor(s). MDPI and/or the editor(s) disclaim responsibility for any injury to people or property resulting from any ideas, methods, instructions or products referred to in the content.

