
Environmental Life-Cycle Assessment of Eco-Friendly Alternative Ship Fuels (MGO, LNG, and Hydrogen) for 170 GT Nearshore Ferry

 , ,
, ,  ,
,
Abstract
:1. Introduction
- -
- Technology development for future eco-friendly ships to achieve up to 70% reduction of their GHG emissions by 2030,
- -
- Actual proof project of the eco-friendly ship propulsion technology for small-size ships operating in nearshore areas,
- -
- Conversion of all government-owned ships into environmentally friendly ships by 2030 (2030 Eco-Friendly Vessel Conversion Plan),
- -
- Establishment of alternative fuel supply chain and the required infrastructure.
2. LCA Methodologies
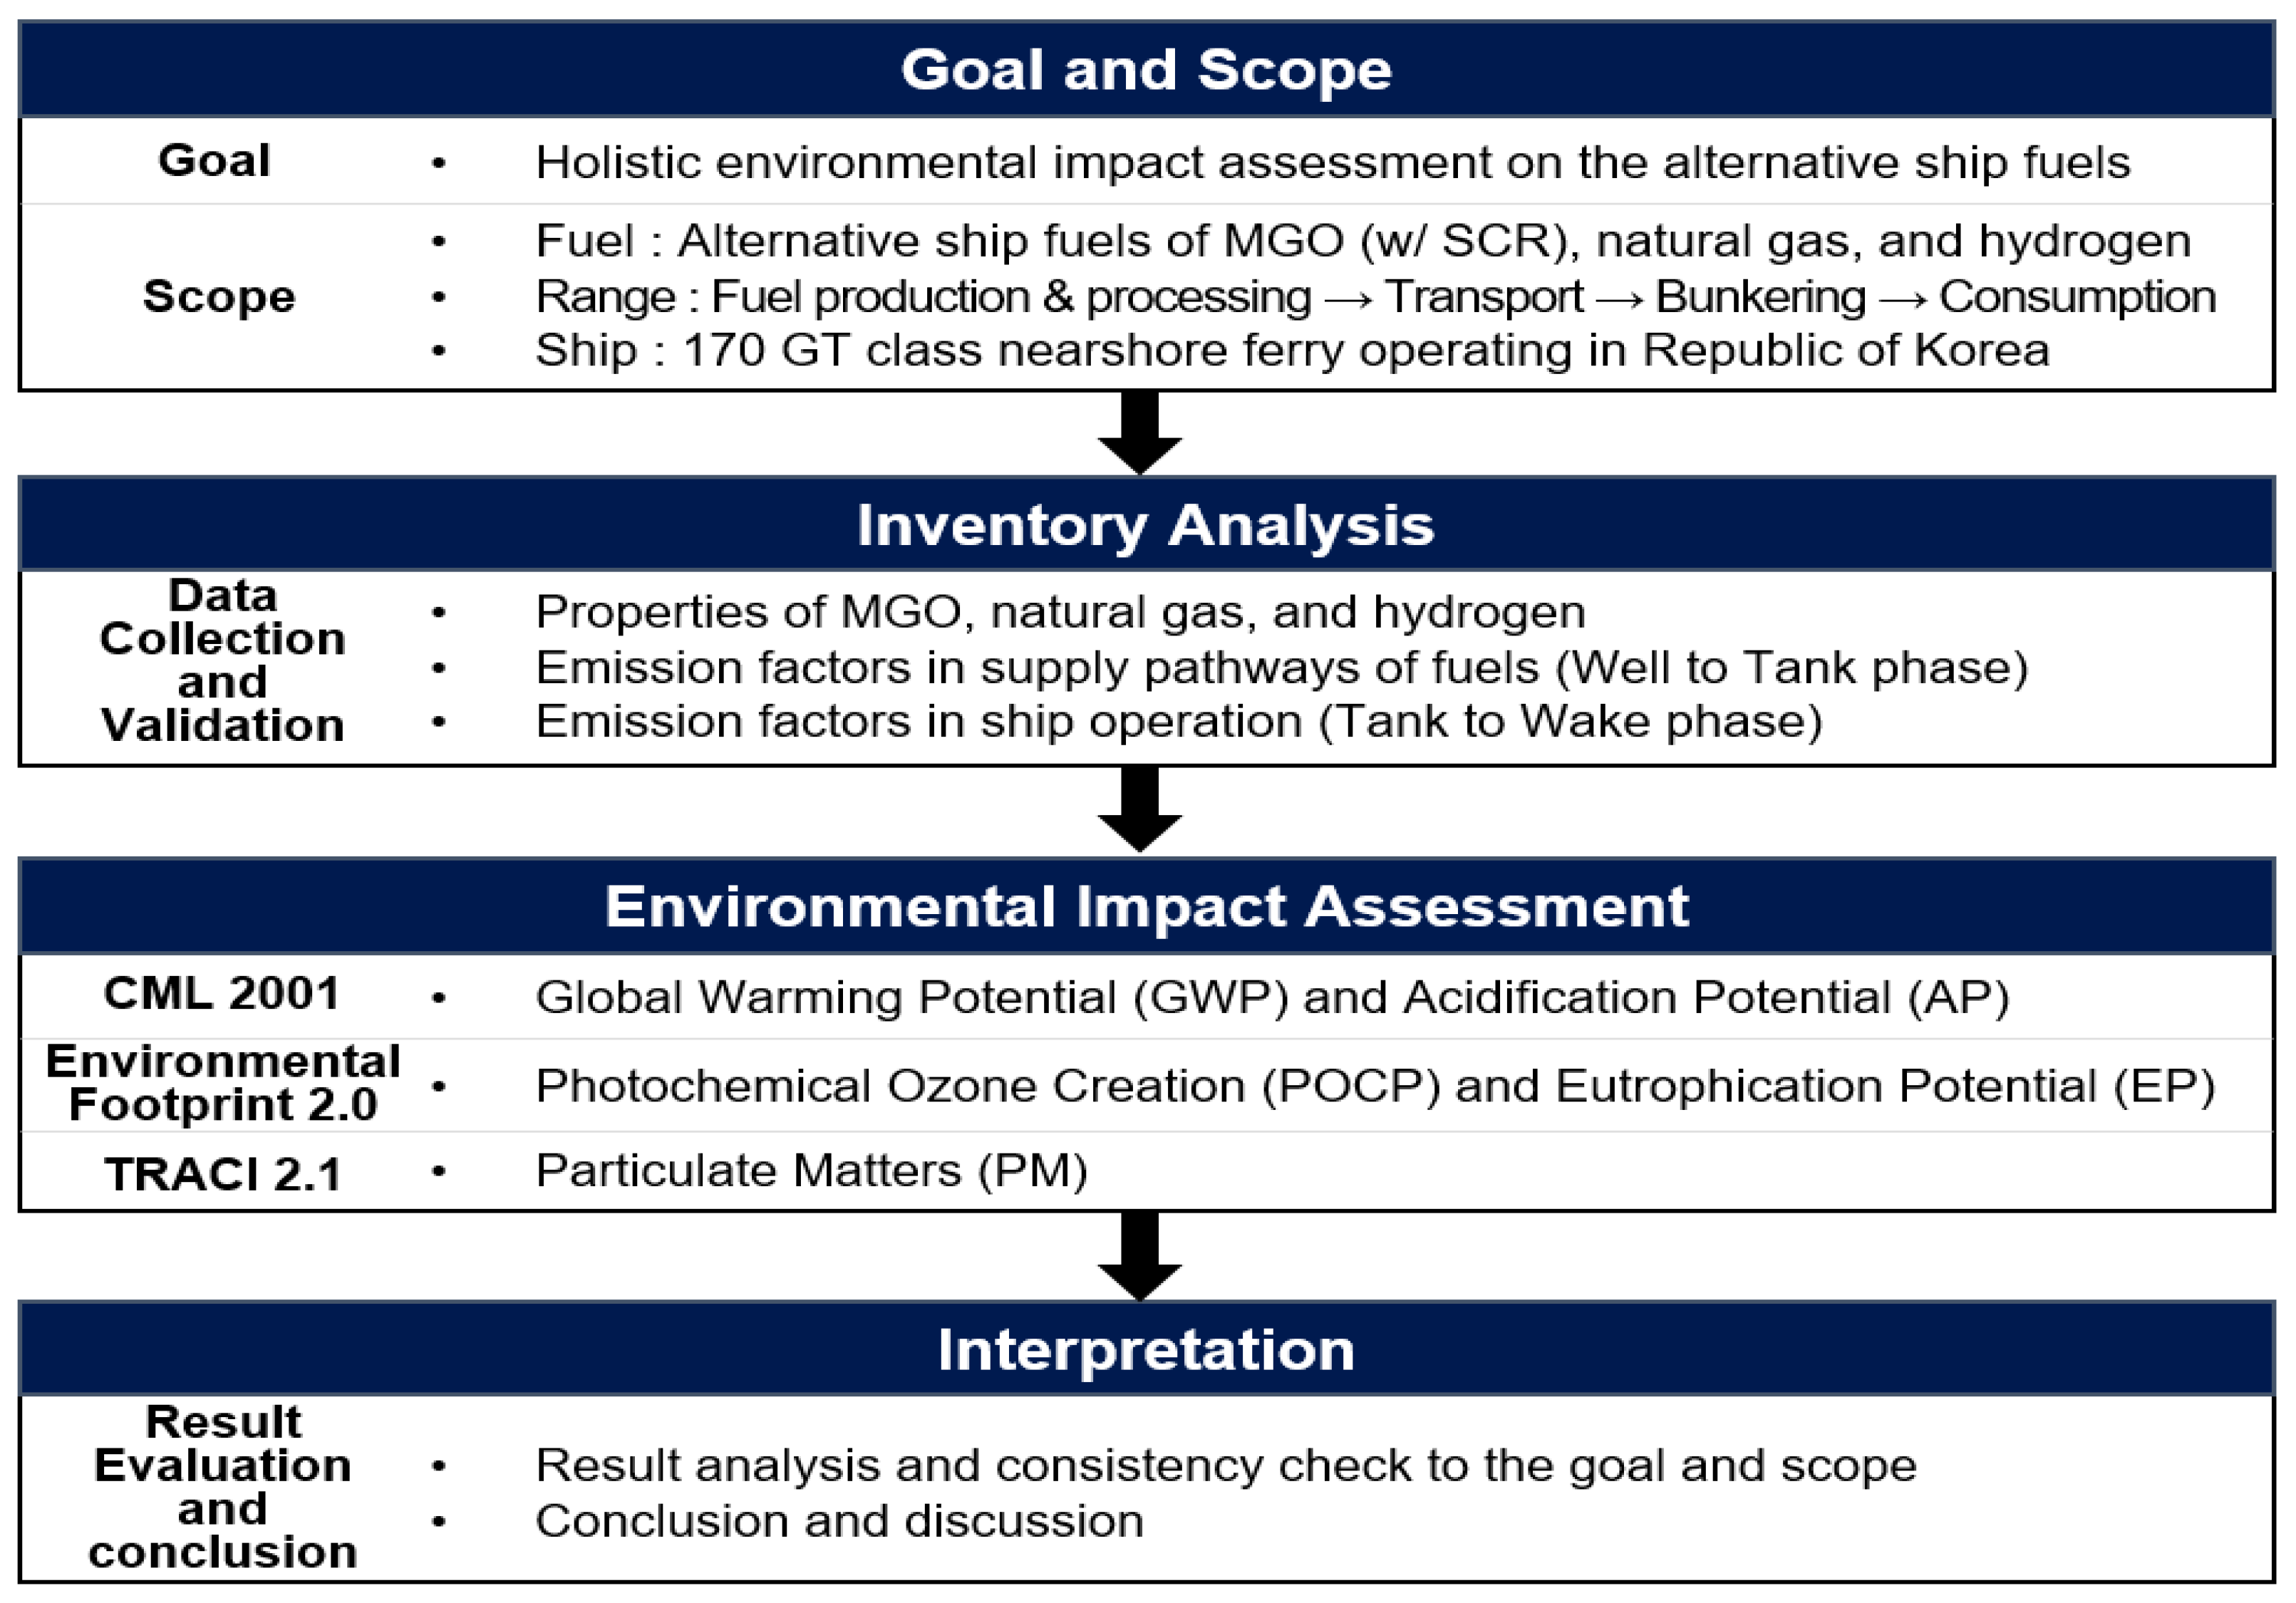
2.1. LCA Scope and Procedure
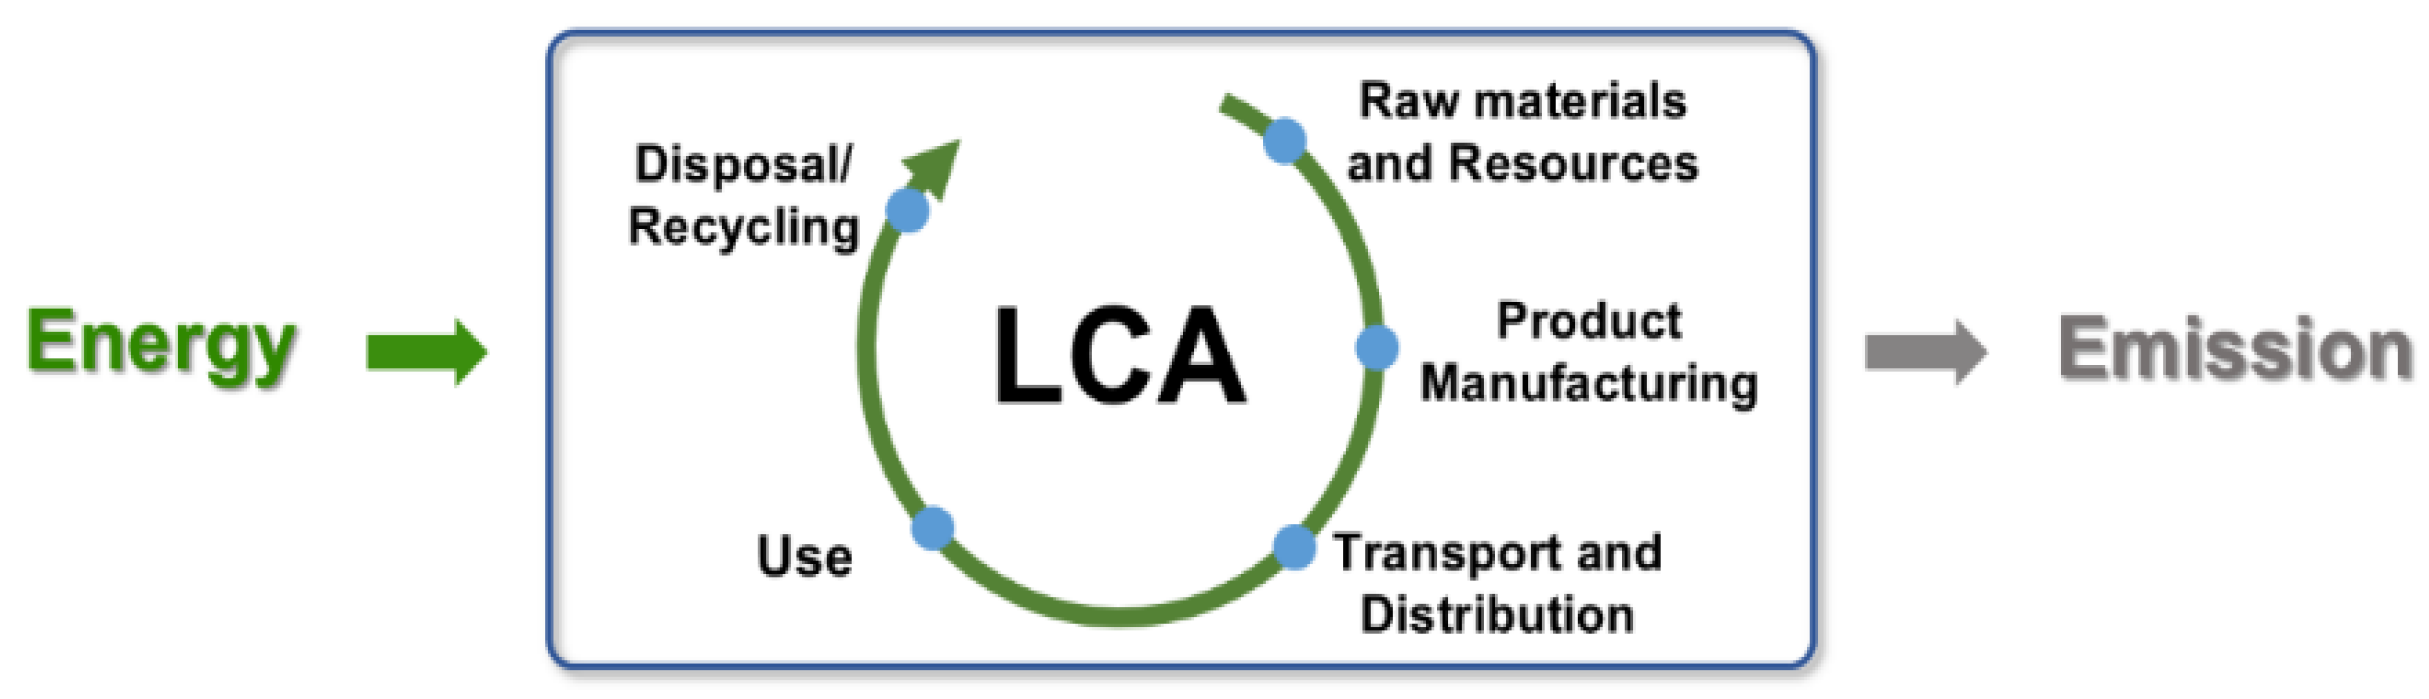
- Goal and scope: This stage defines why the research was performed and the issues to be discussed with the readers.
- Inventory analysis: This stage includes the collection of data about the emission factors and properties to be used to quantify relevant inputs and outputs of a system.
- Impact assessment: In this stage, potential environmental impacts are assessed using the data collected in the previous step.
- Interpretation: In this stage, the results of the impact assessment are analyzed and summarized.
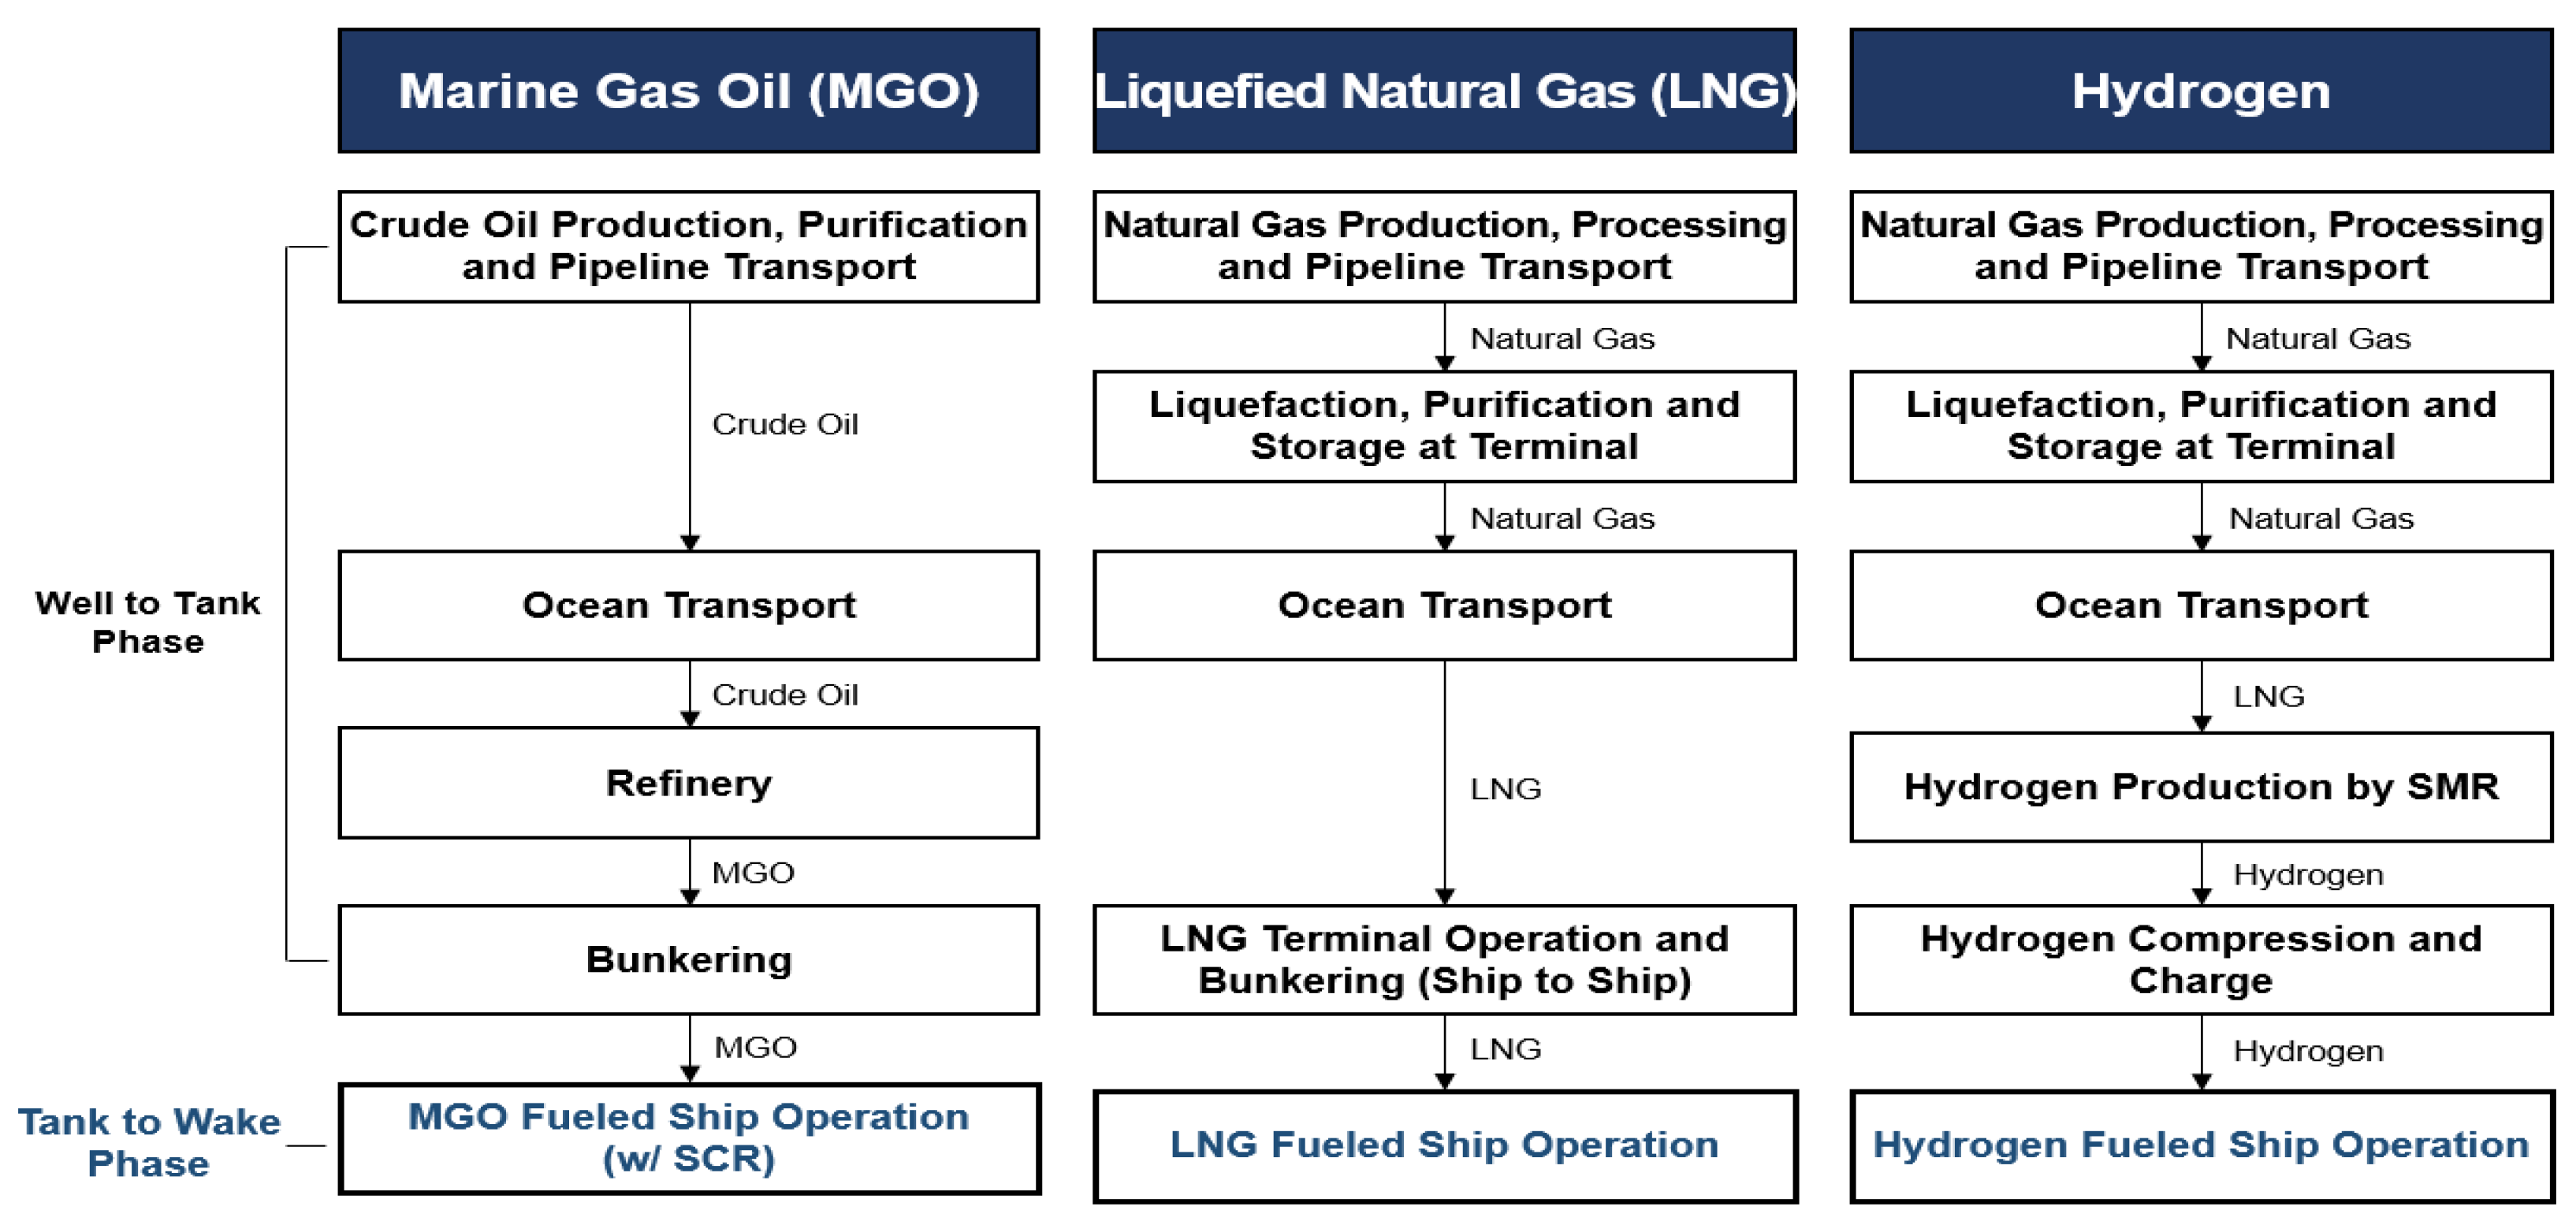
- Well-to-tank analysis from fuel production to the fuel tank of a ship, including the transportation of the fuel;
- Tank-to-wake analysis during the operation of the ship;
- Well-to-wake analysis from the production of the fuel to the operation of the ship.
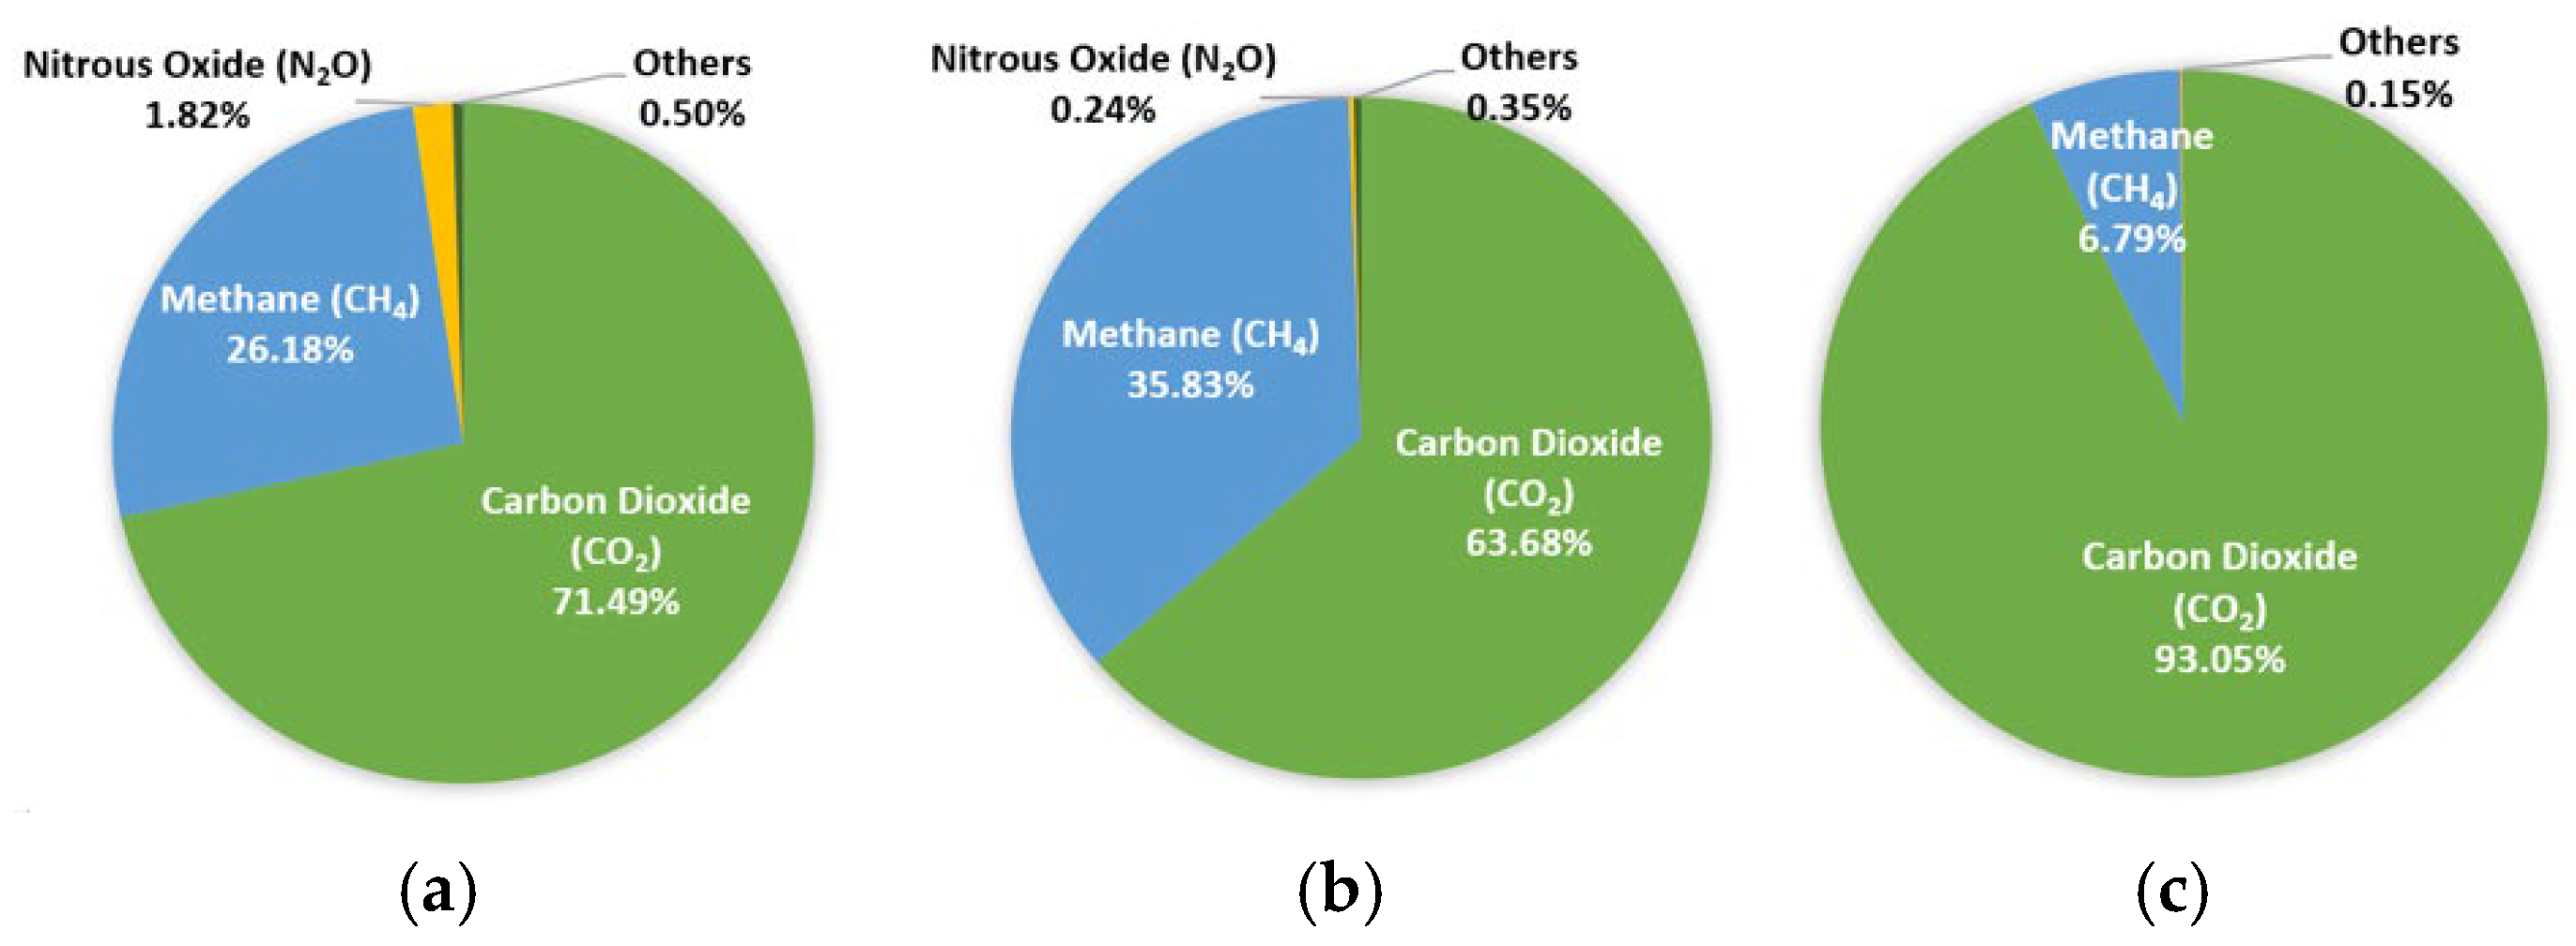
- Global warming potential (GWP): An indicator of the energy absorbed by the emissions of 1 kg of exhausted gas over a period of time (compared to the emissions of 1 kg of carbon dioxide (CO2)). The GWP of the greenhouse gases can be obtained using Equation (1).
- Acidification potential (AP): An indicator of the acidification of the soil and rivers due air pollutants;
- Photochemical ozone creation potential (POCP): The degree to which VOCs cause ozone pollution by participating in photochemical reactions in the atmosphere;
- Eutrophication potential (EP): A measure of the phenomenon in which nutrients are oversupplied;
- Particulate matter (PM): The sum of all solid and liquid particles suspended in the atmosphere.
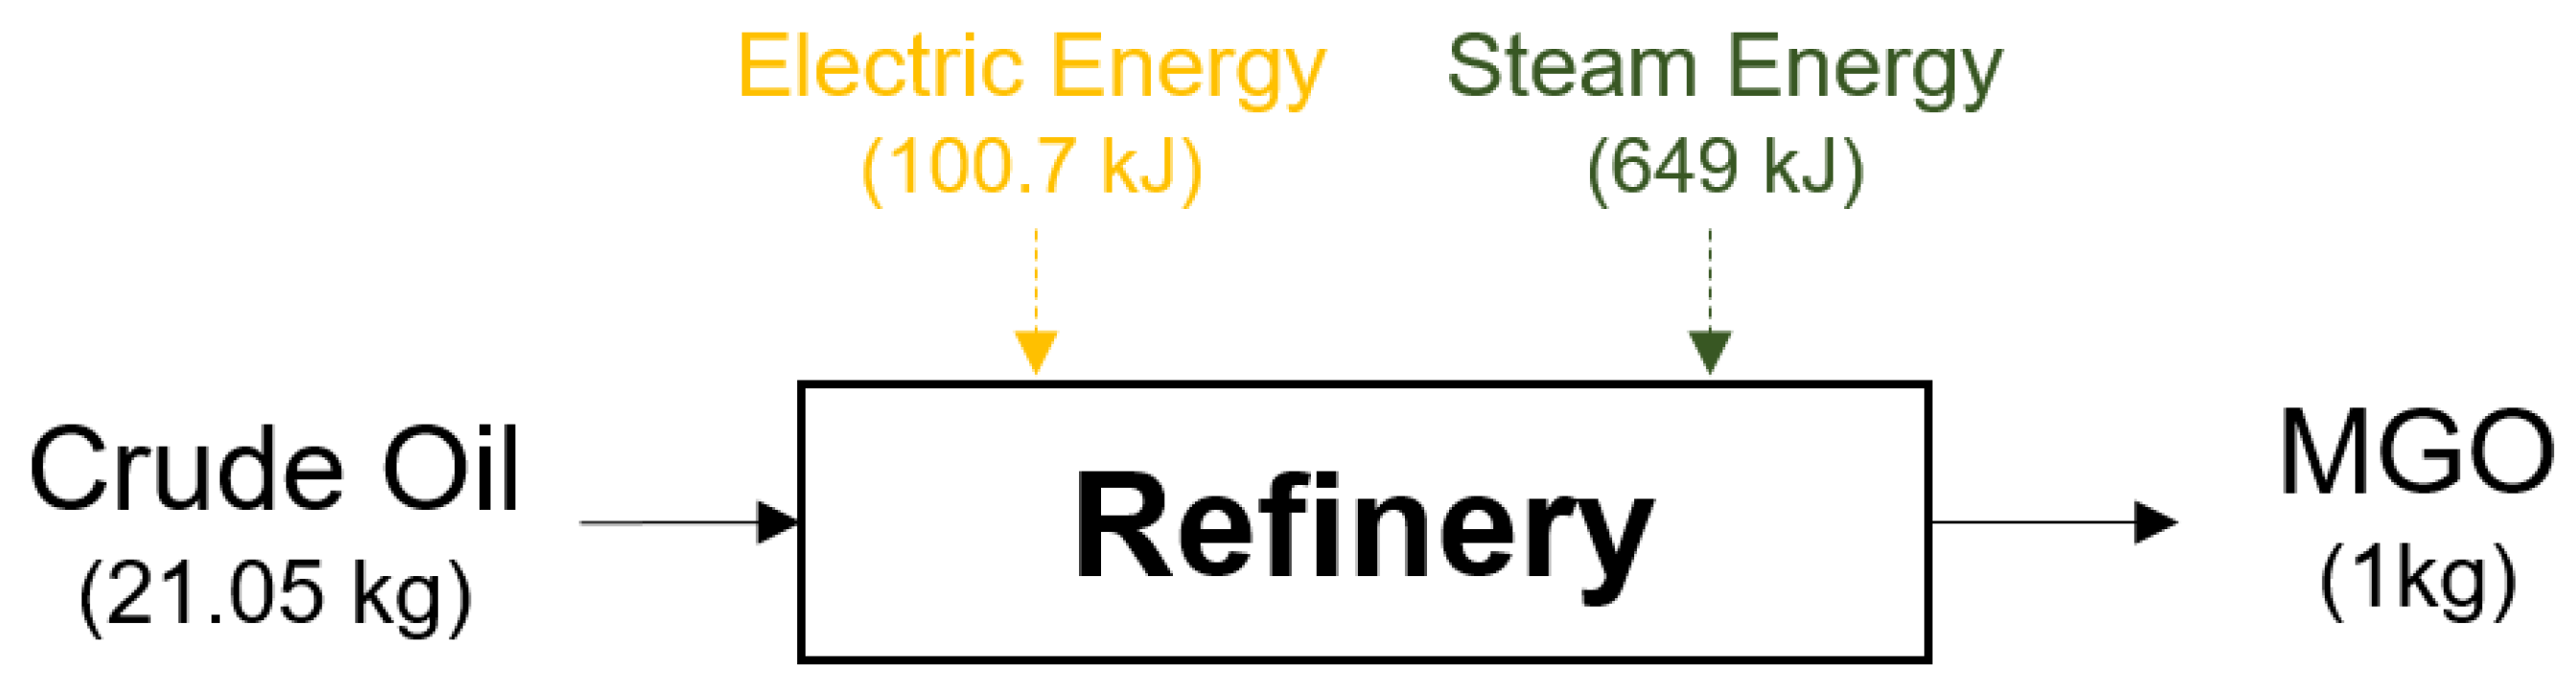
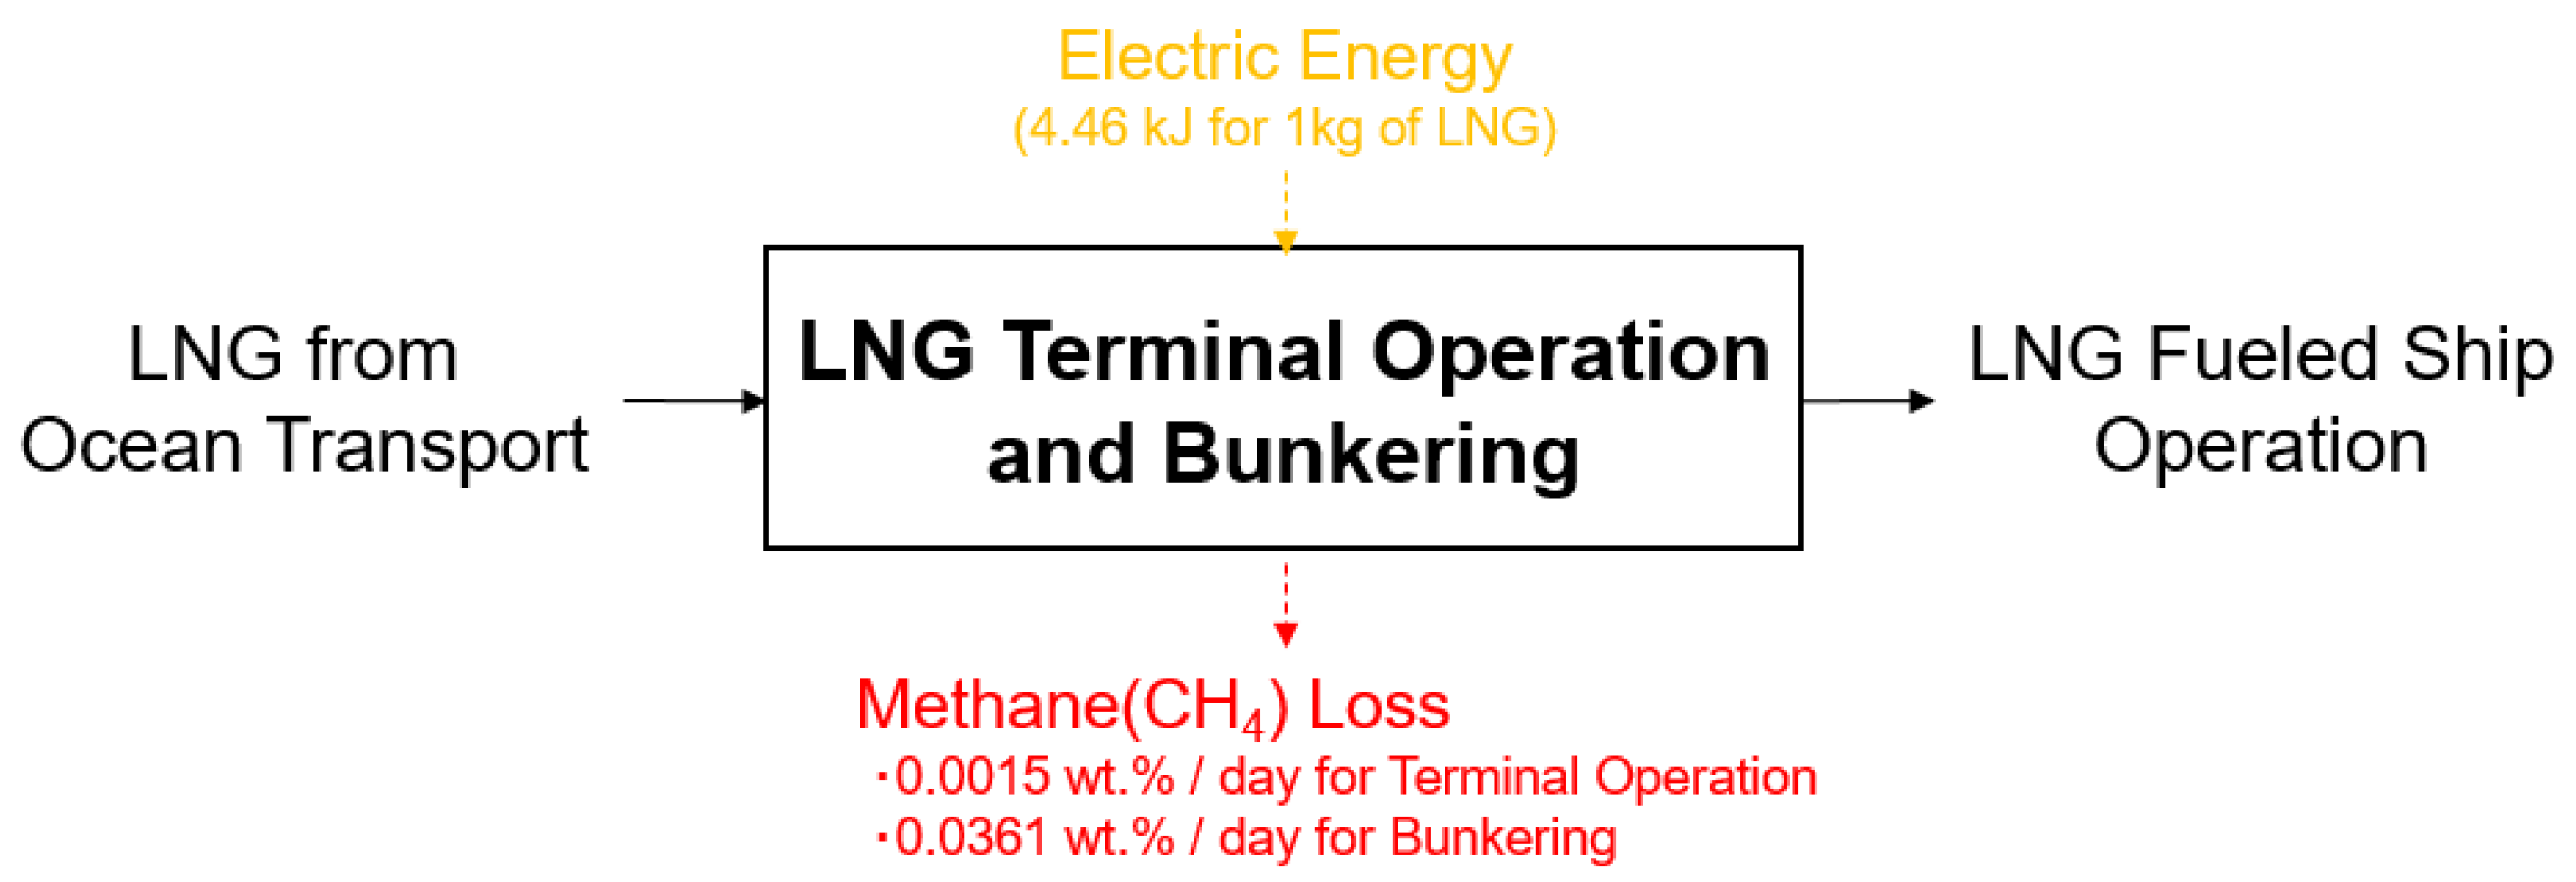
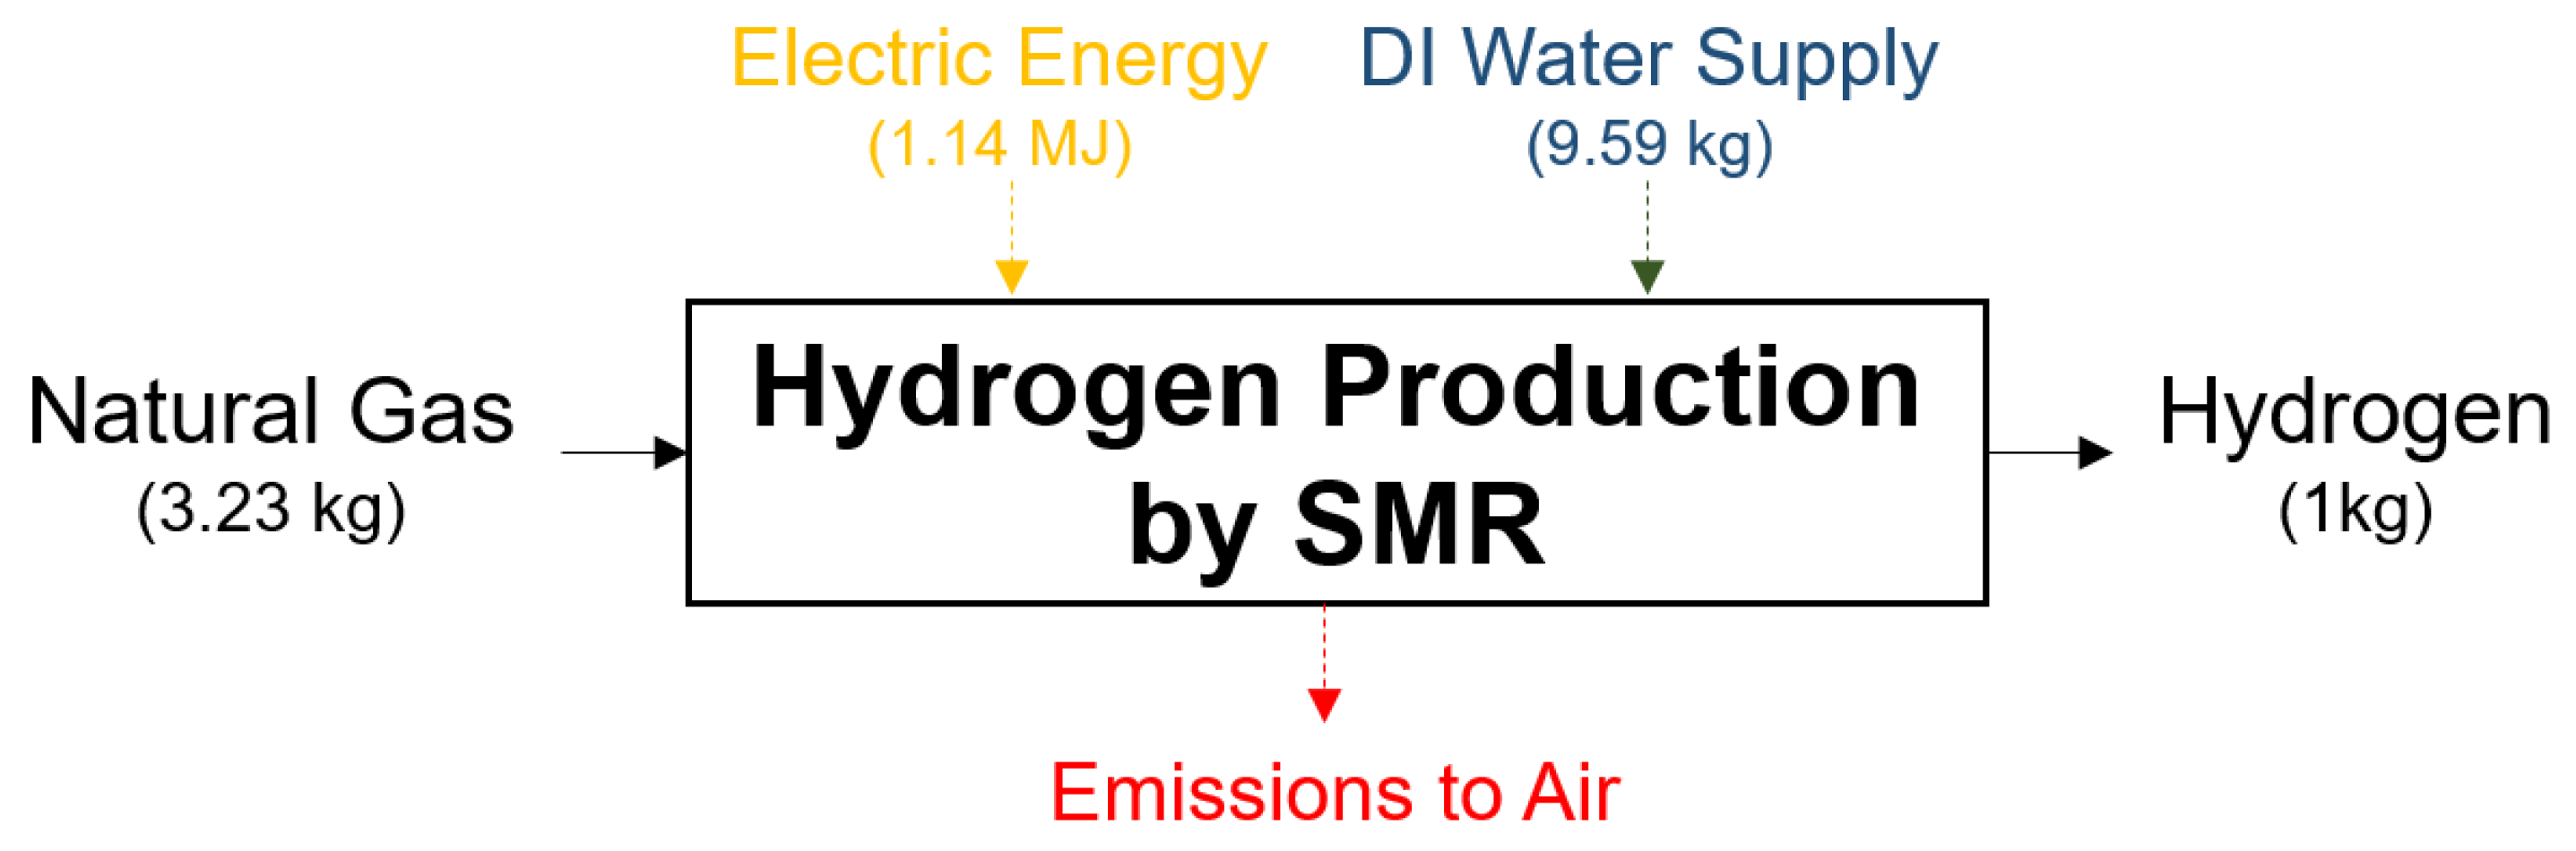
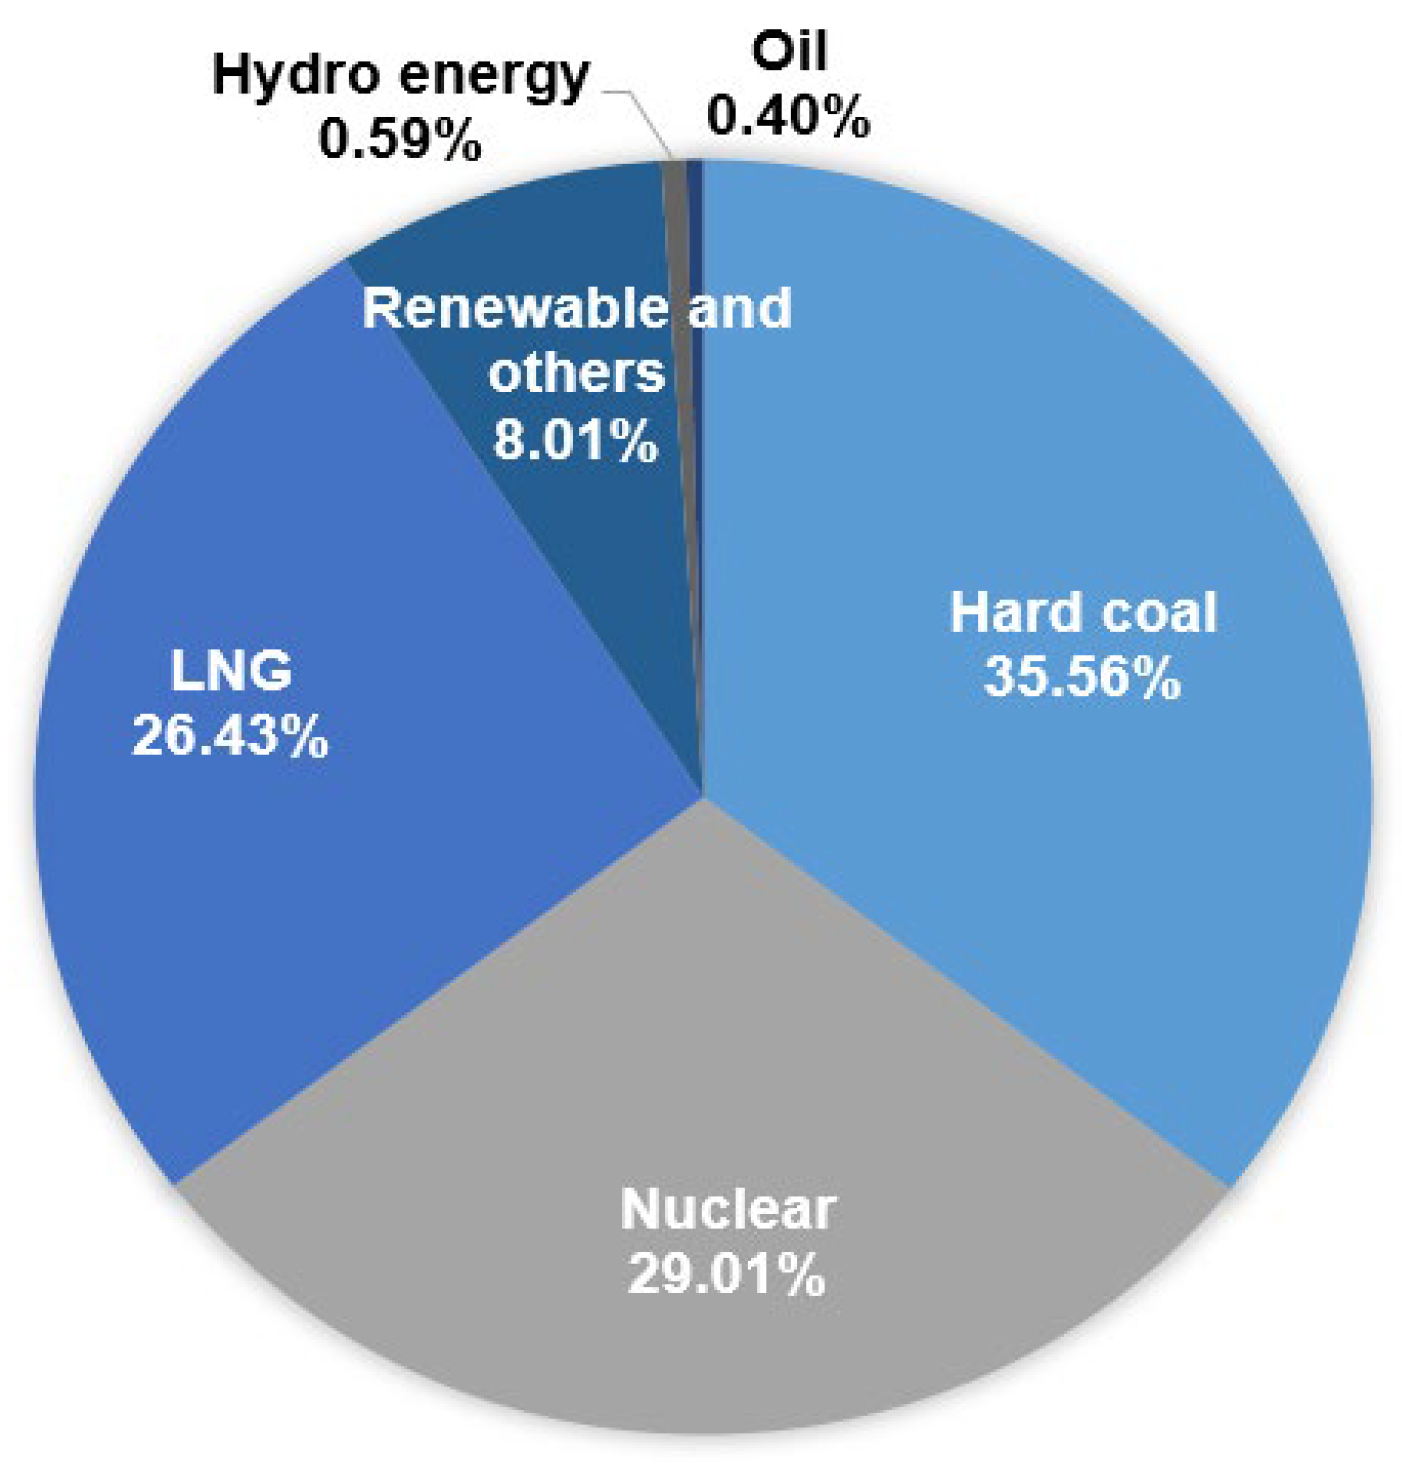
2.2. Inventory Analysis: Well-to-Tank Phase
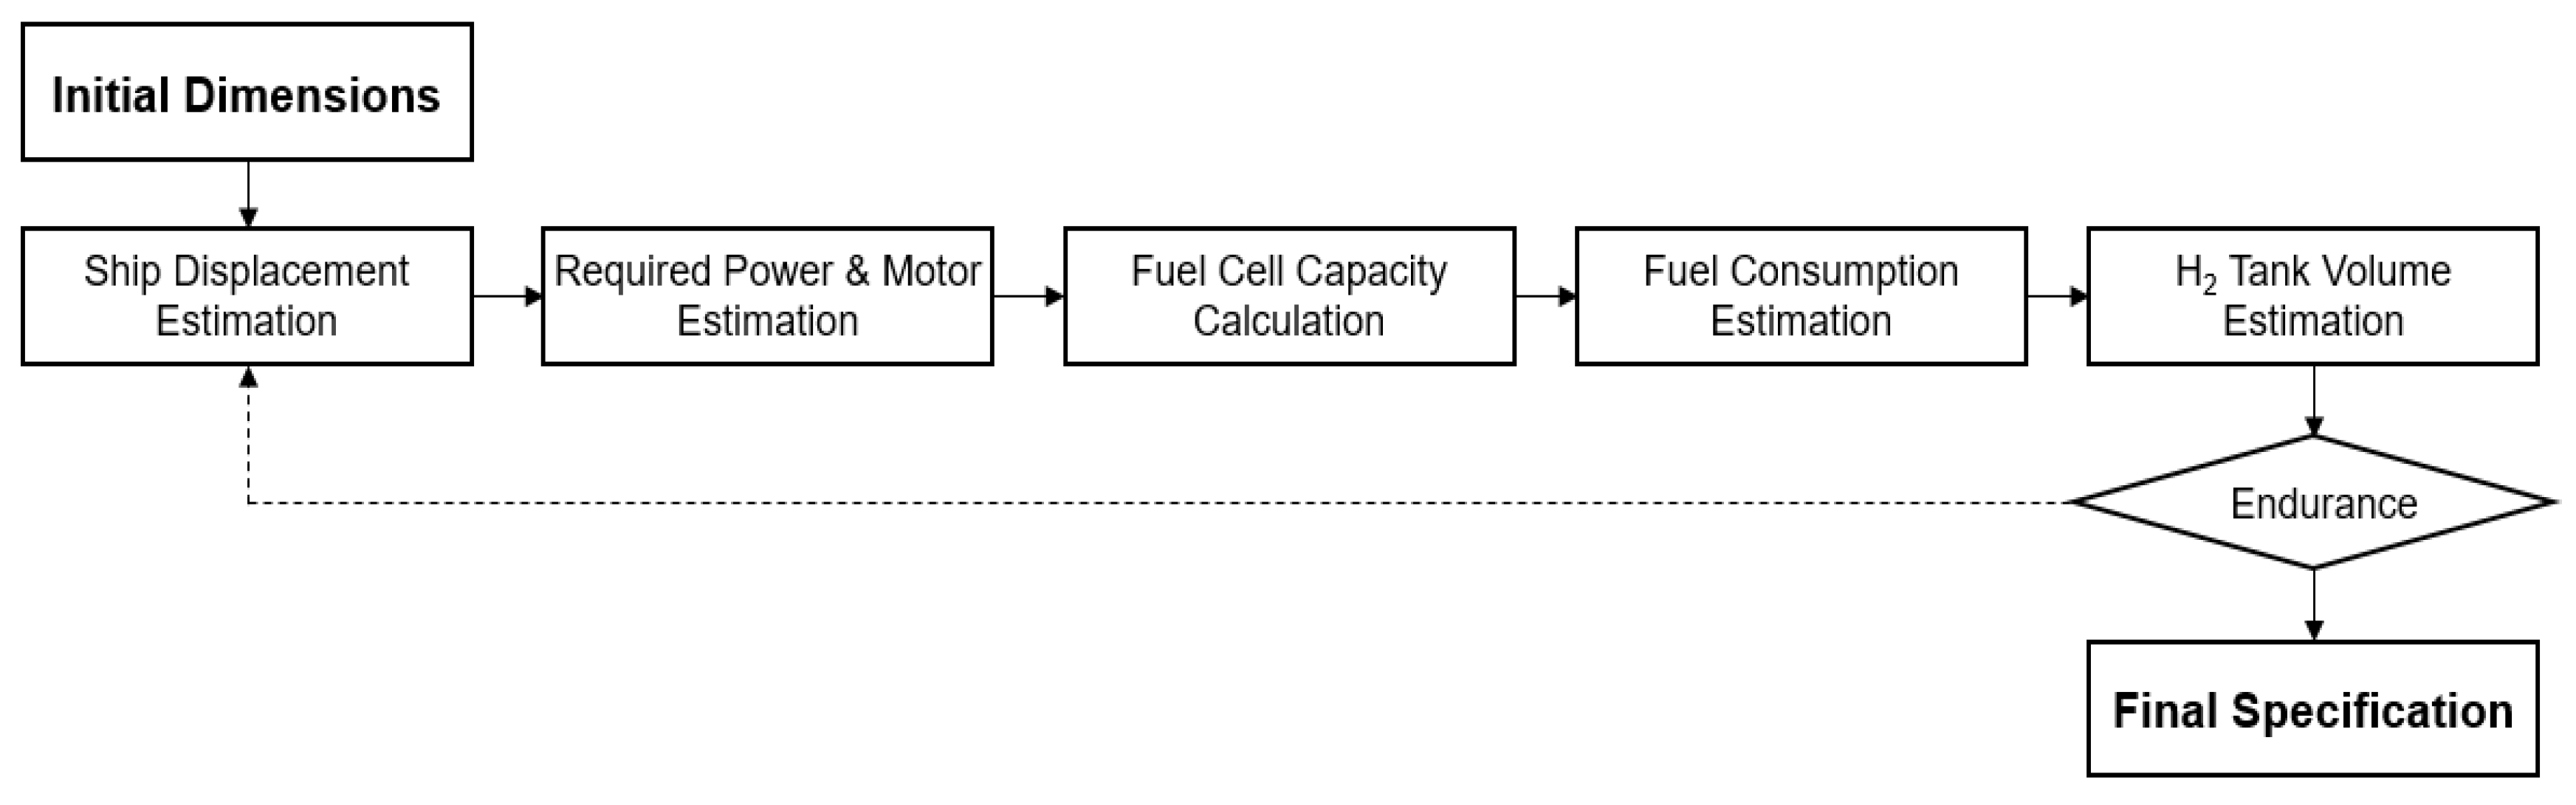
2.3. Inventory Analysis: Tank-to-Wake Phase
- -
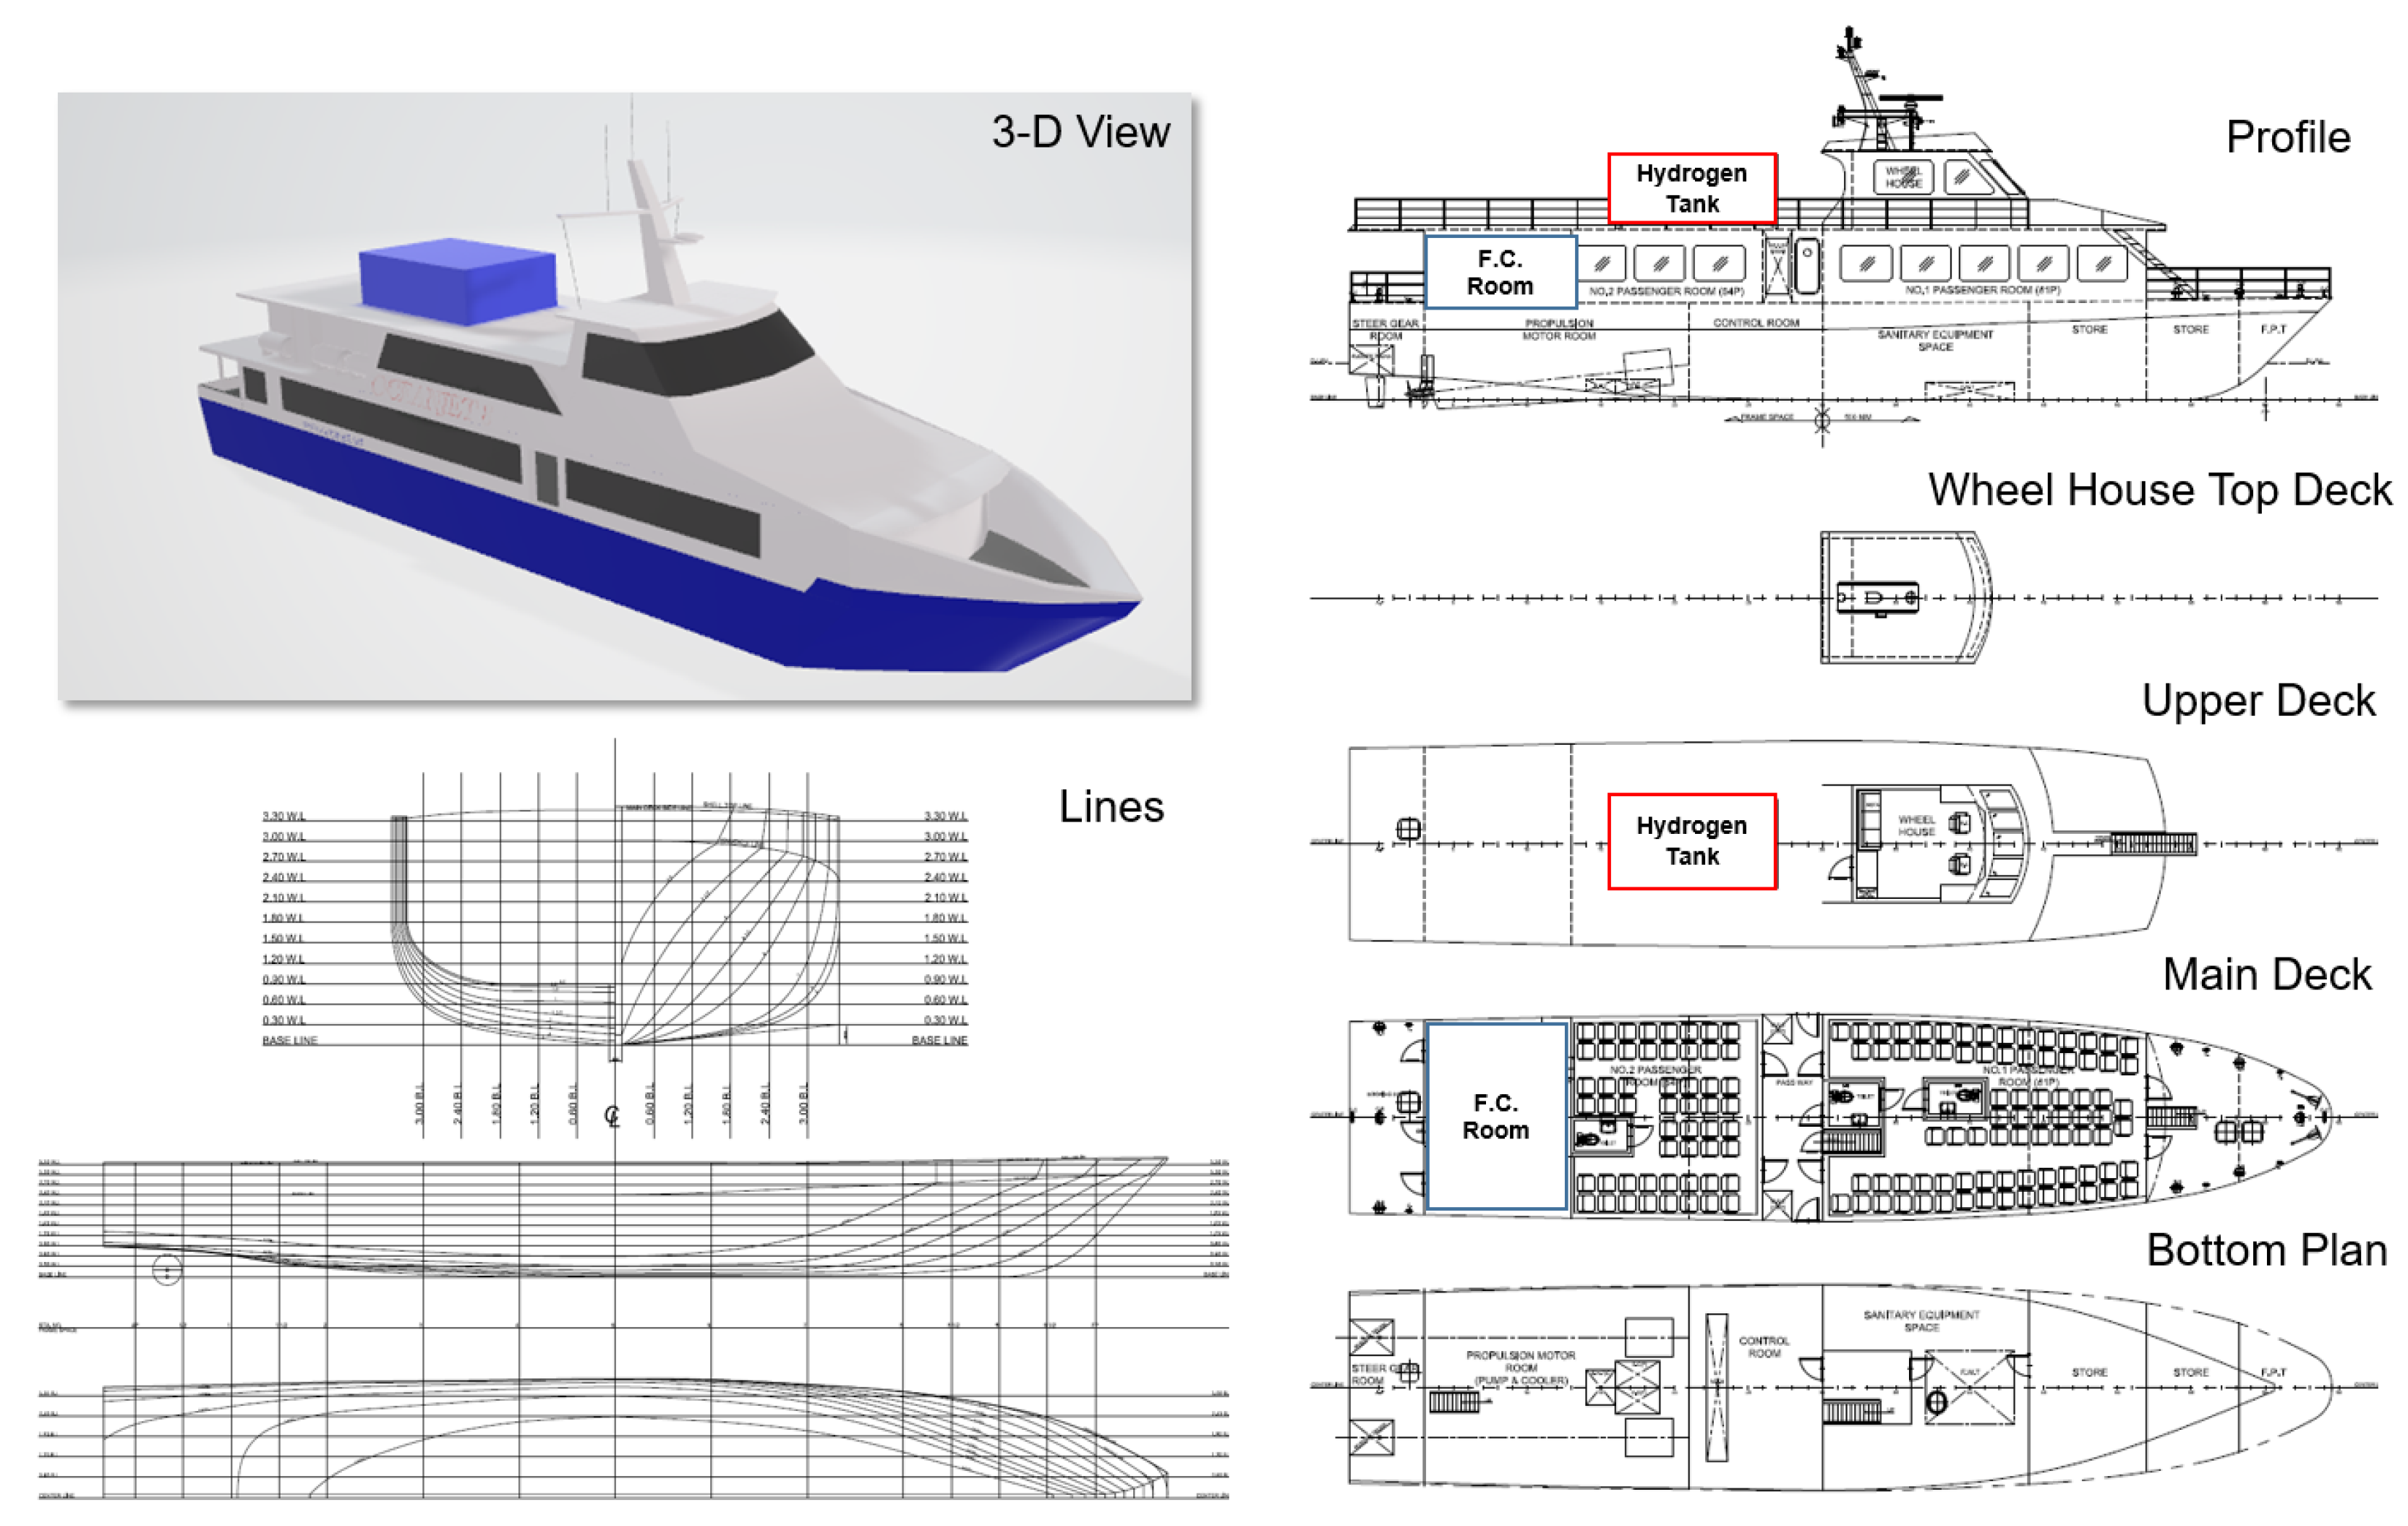
- Size of the ship: The length of the ship (LOA) must be greater than 30 m to retain sufficient area for being equipped with the hydrogen tank and other equipment;
- -
- Type and capacity of the ship: nearshore ferry, capable of transporting more than 130 people;
- -
- Speed of the ship: 15 knots (77% of nearshore ferries in ROK, a total of 166 ships, operate at around 15 knots [38]);
- -
- Gross tonnage: larger than 100 GT (70% of nearshore ferries in ROK are in the range of 100–500 GT [38]);
- -
- Distance of the sea route: 100 nautical miles with two round trips per day (obtained as an average sea route distance of 100~200 GT ships in the ROK (KSA, 2019)).
3. Results and Discussion
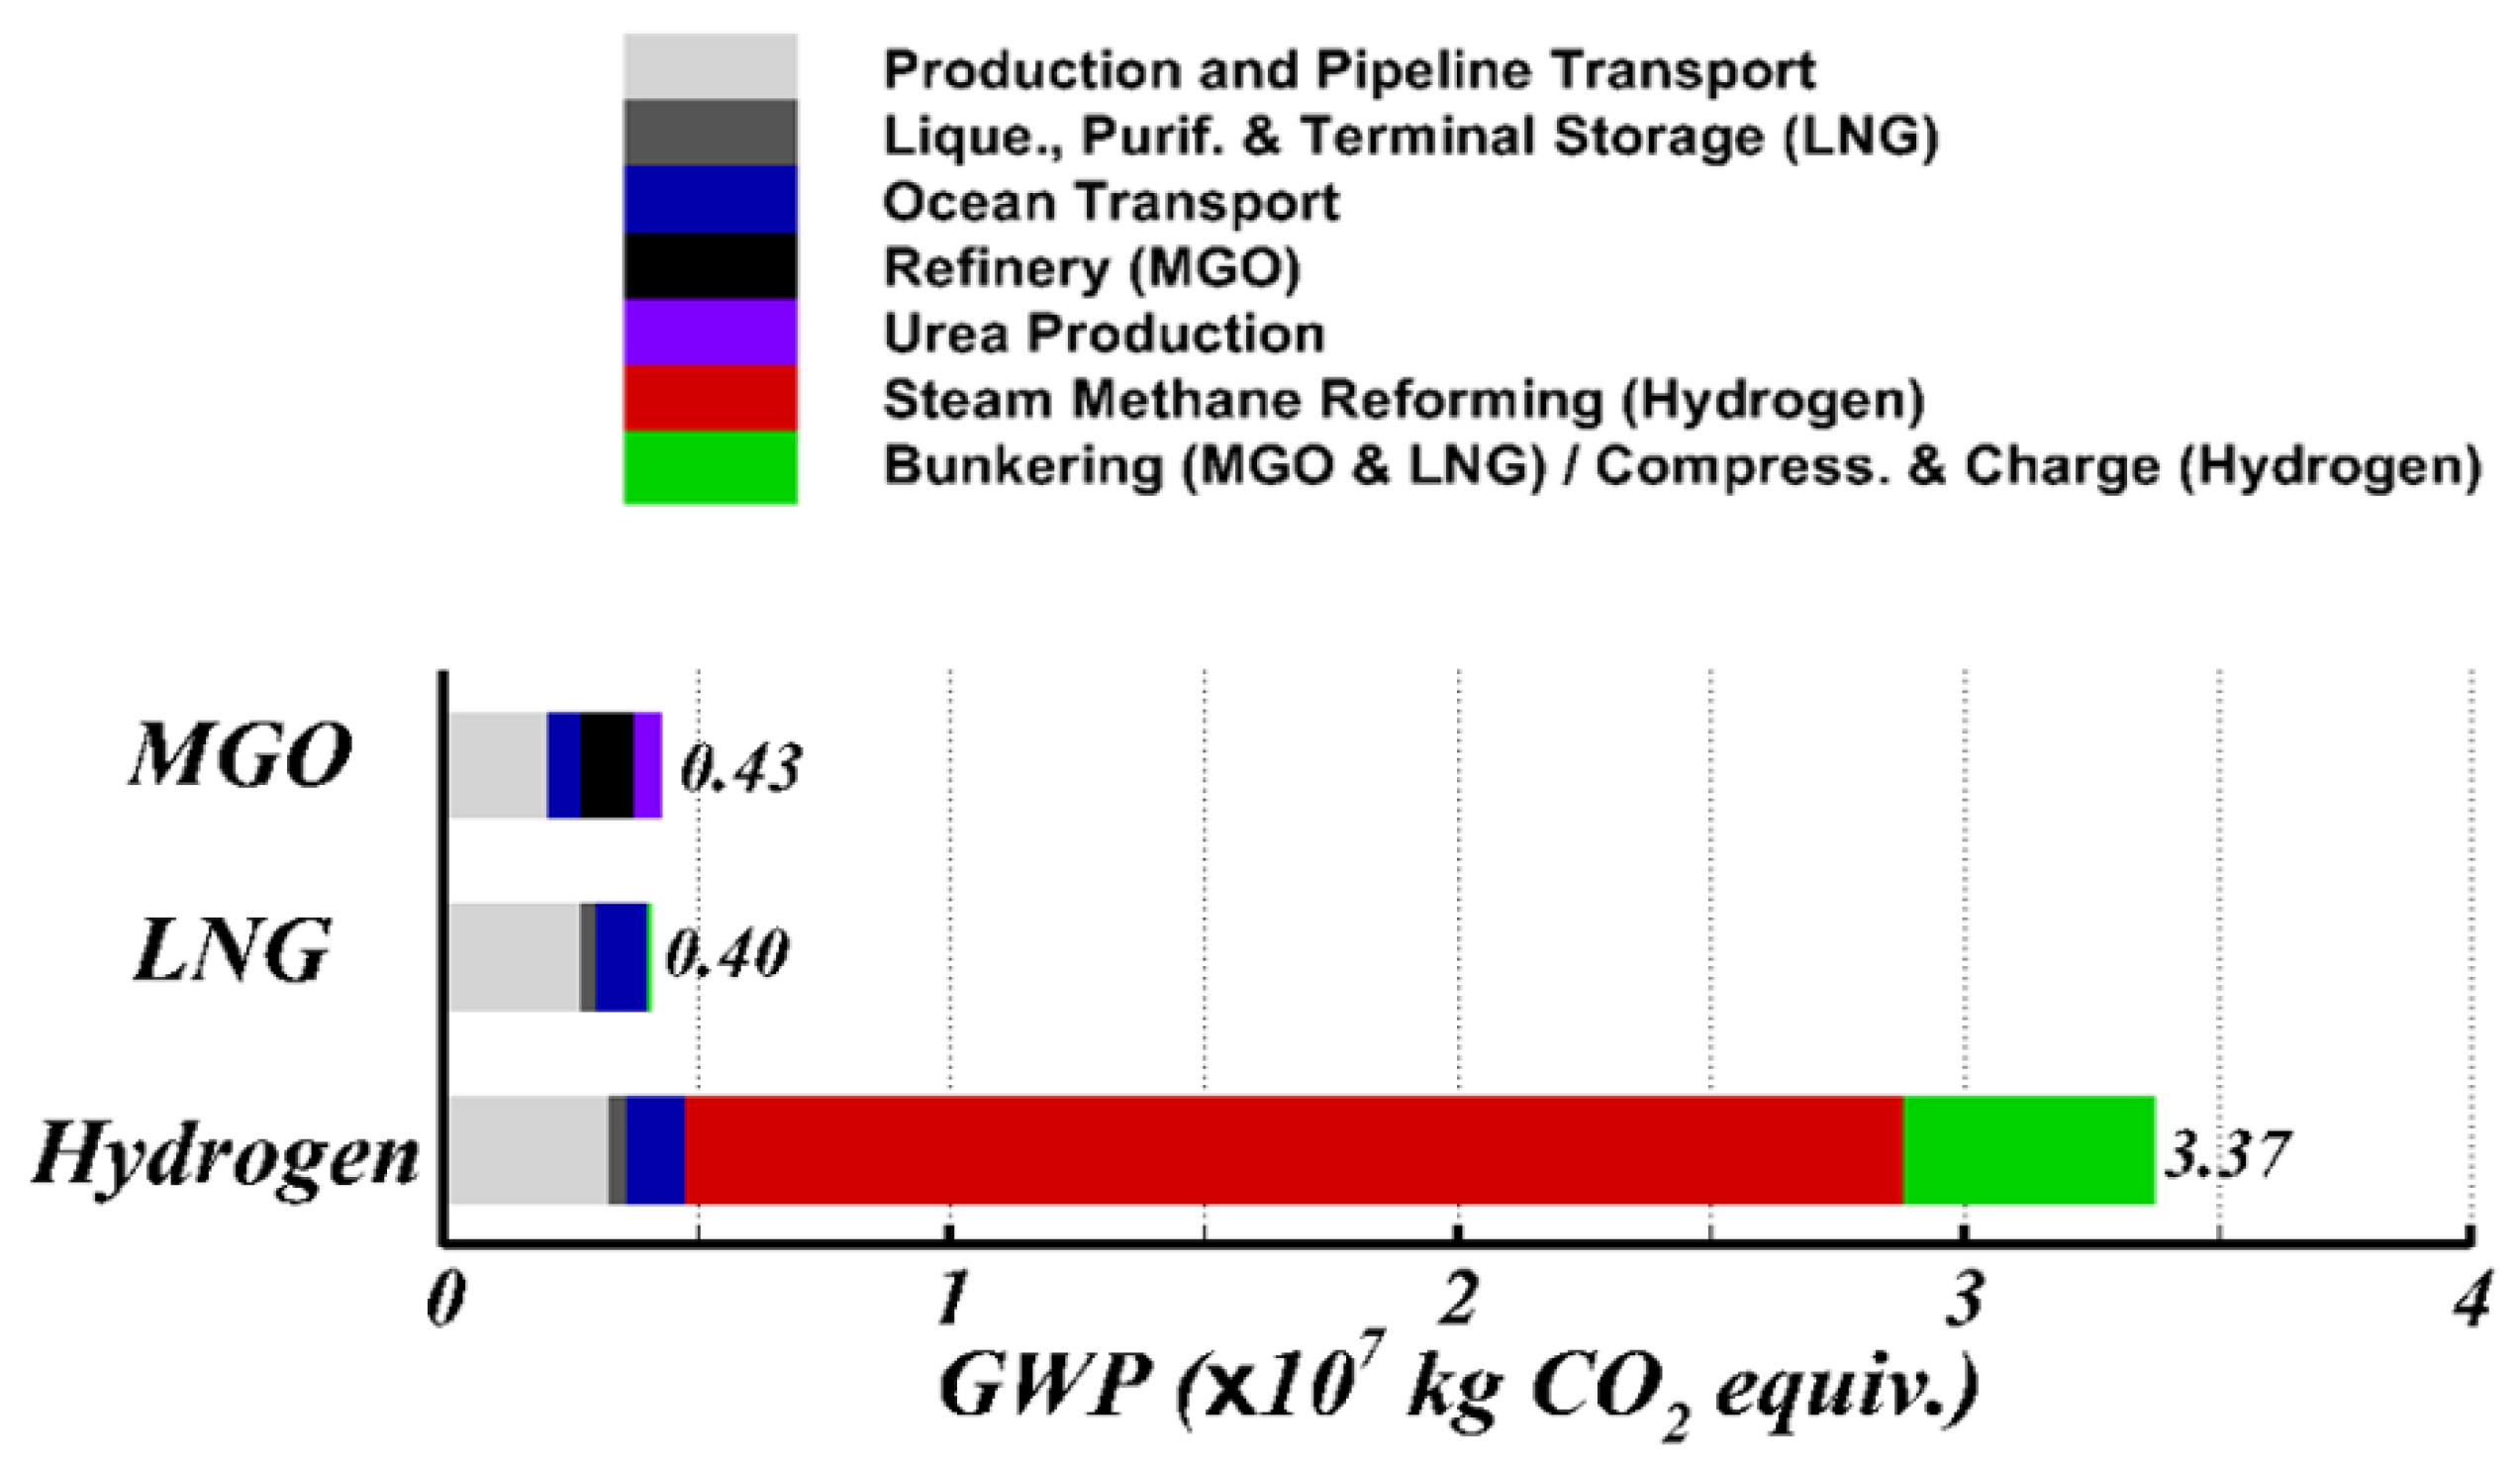
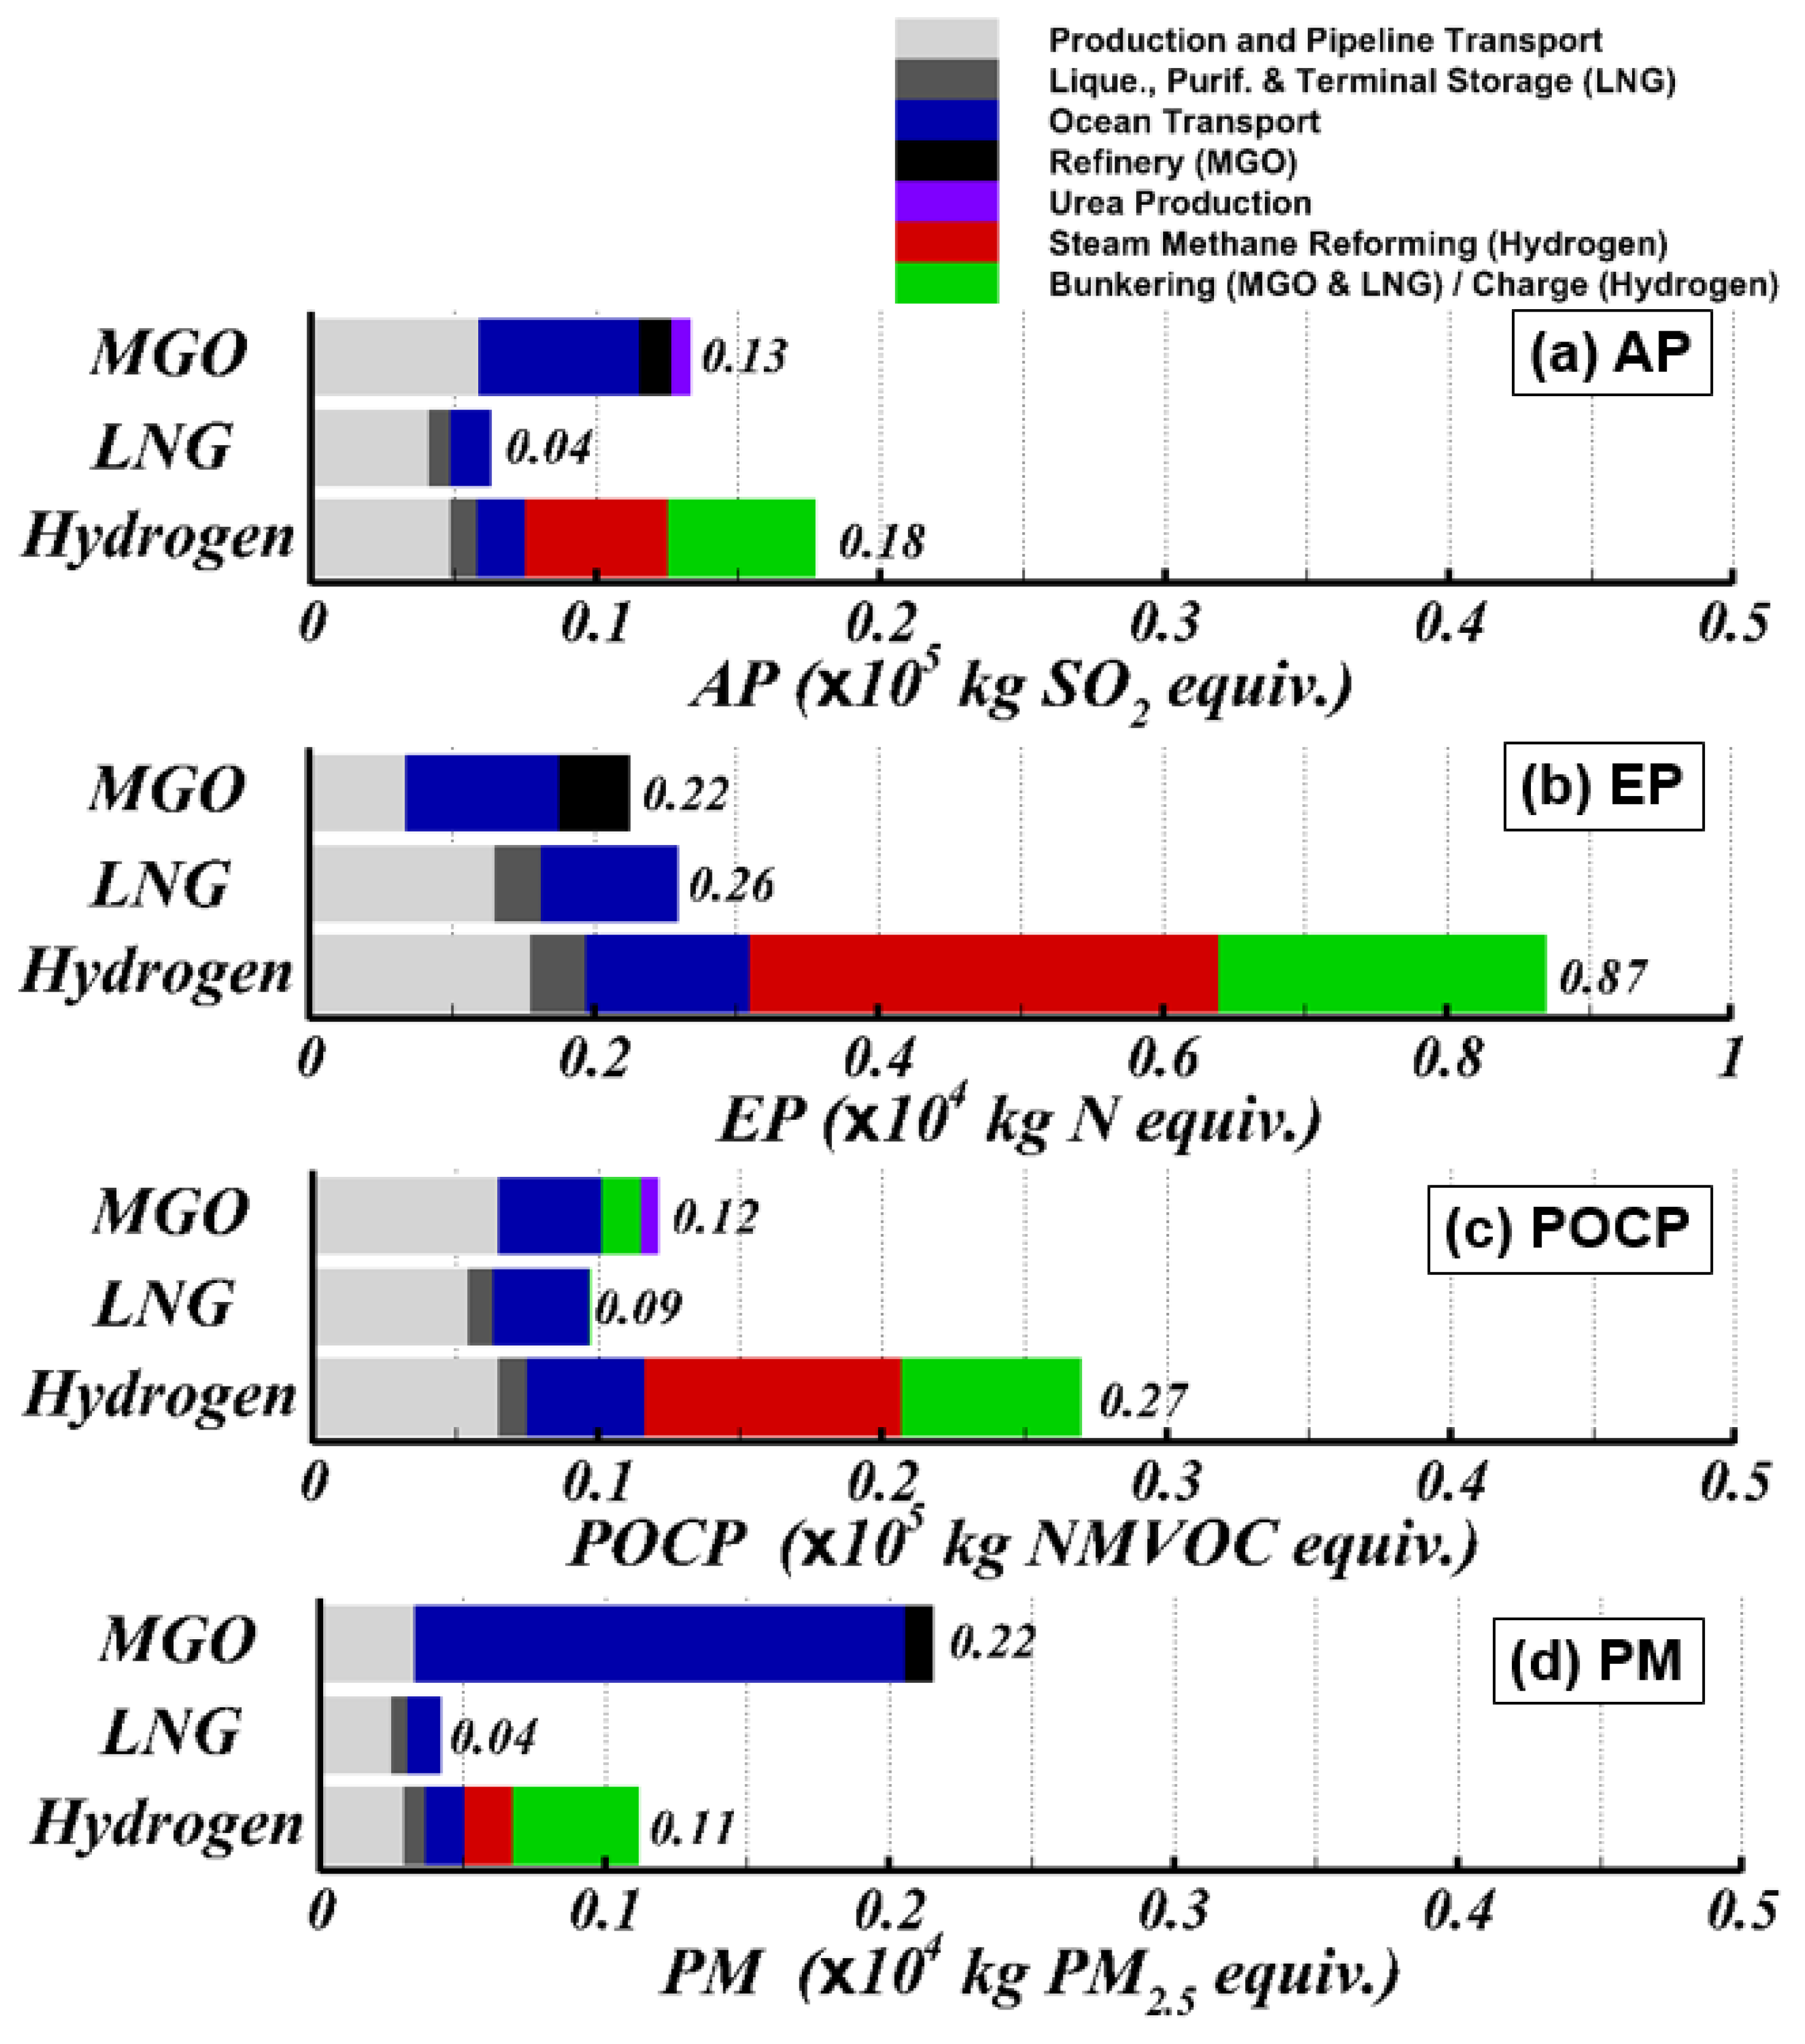
3.1. Environmental Impact Assessment in the Well-to-Tank Phase
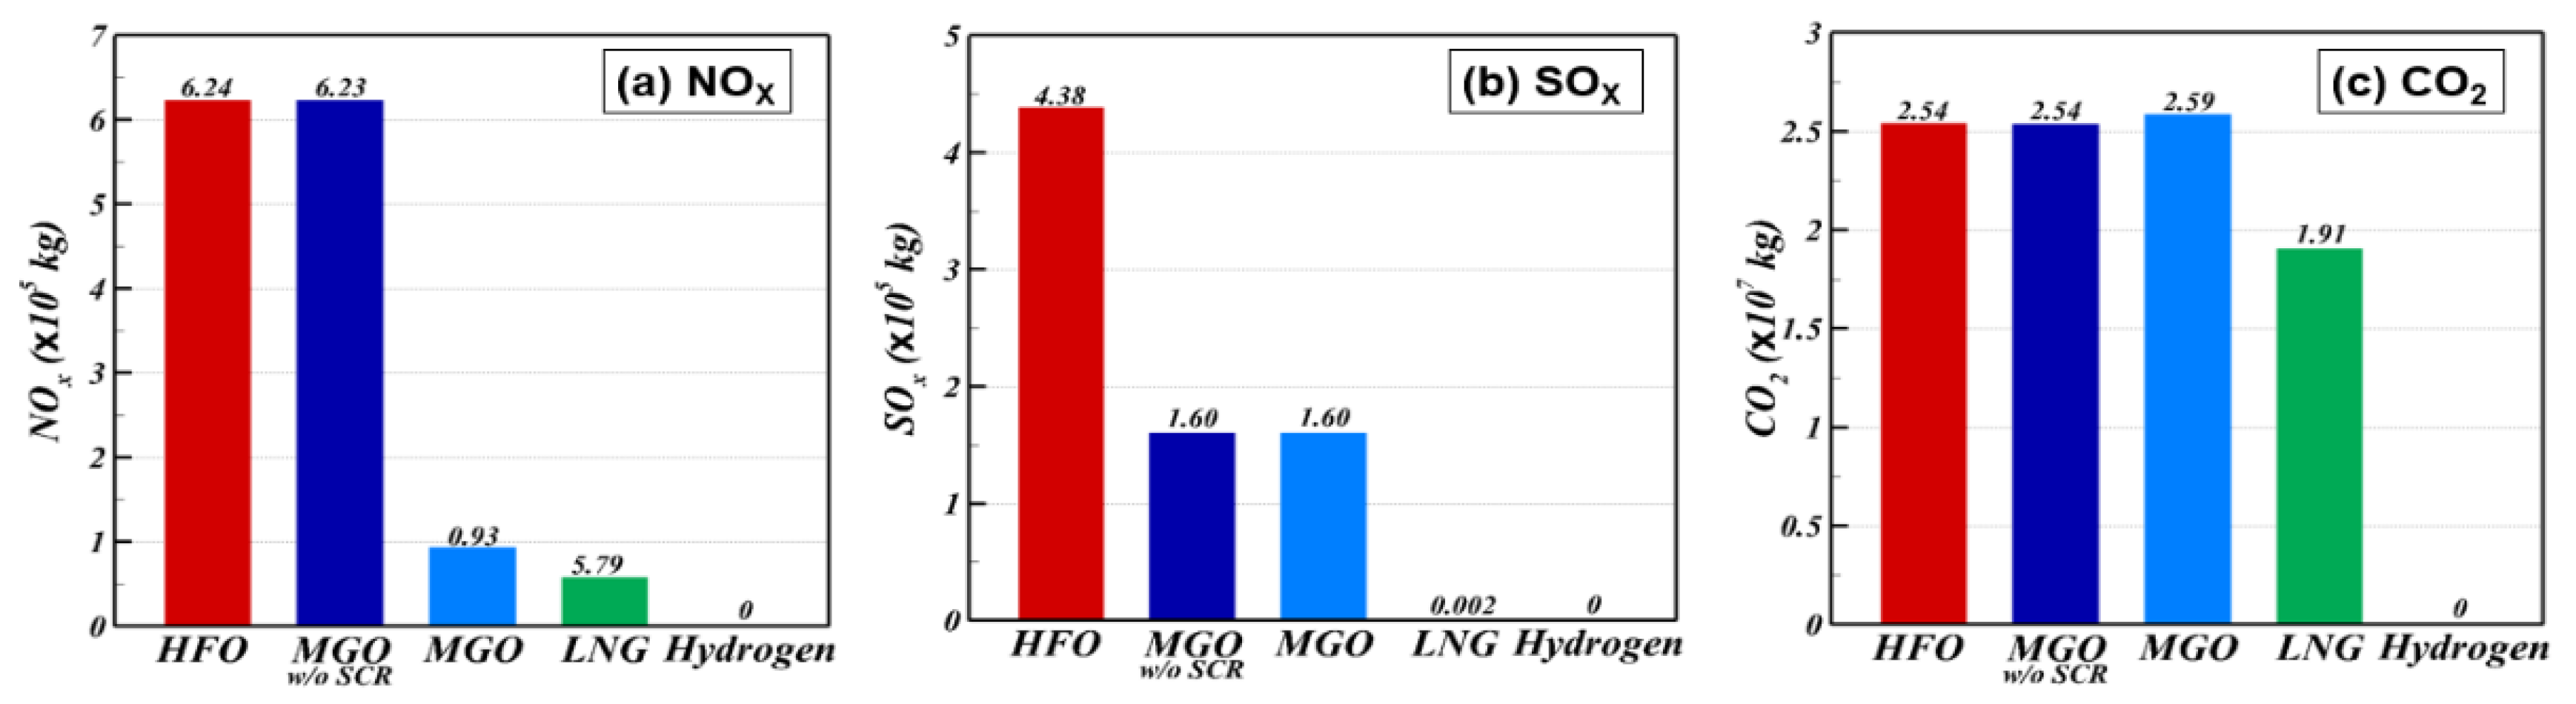
3.2. Environmental Impact Assessment in the Tank-to-Wake Phase
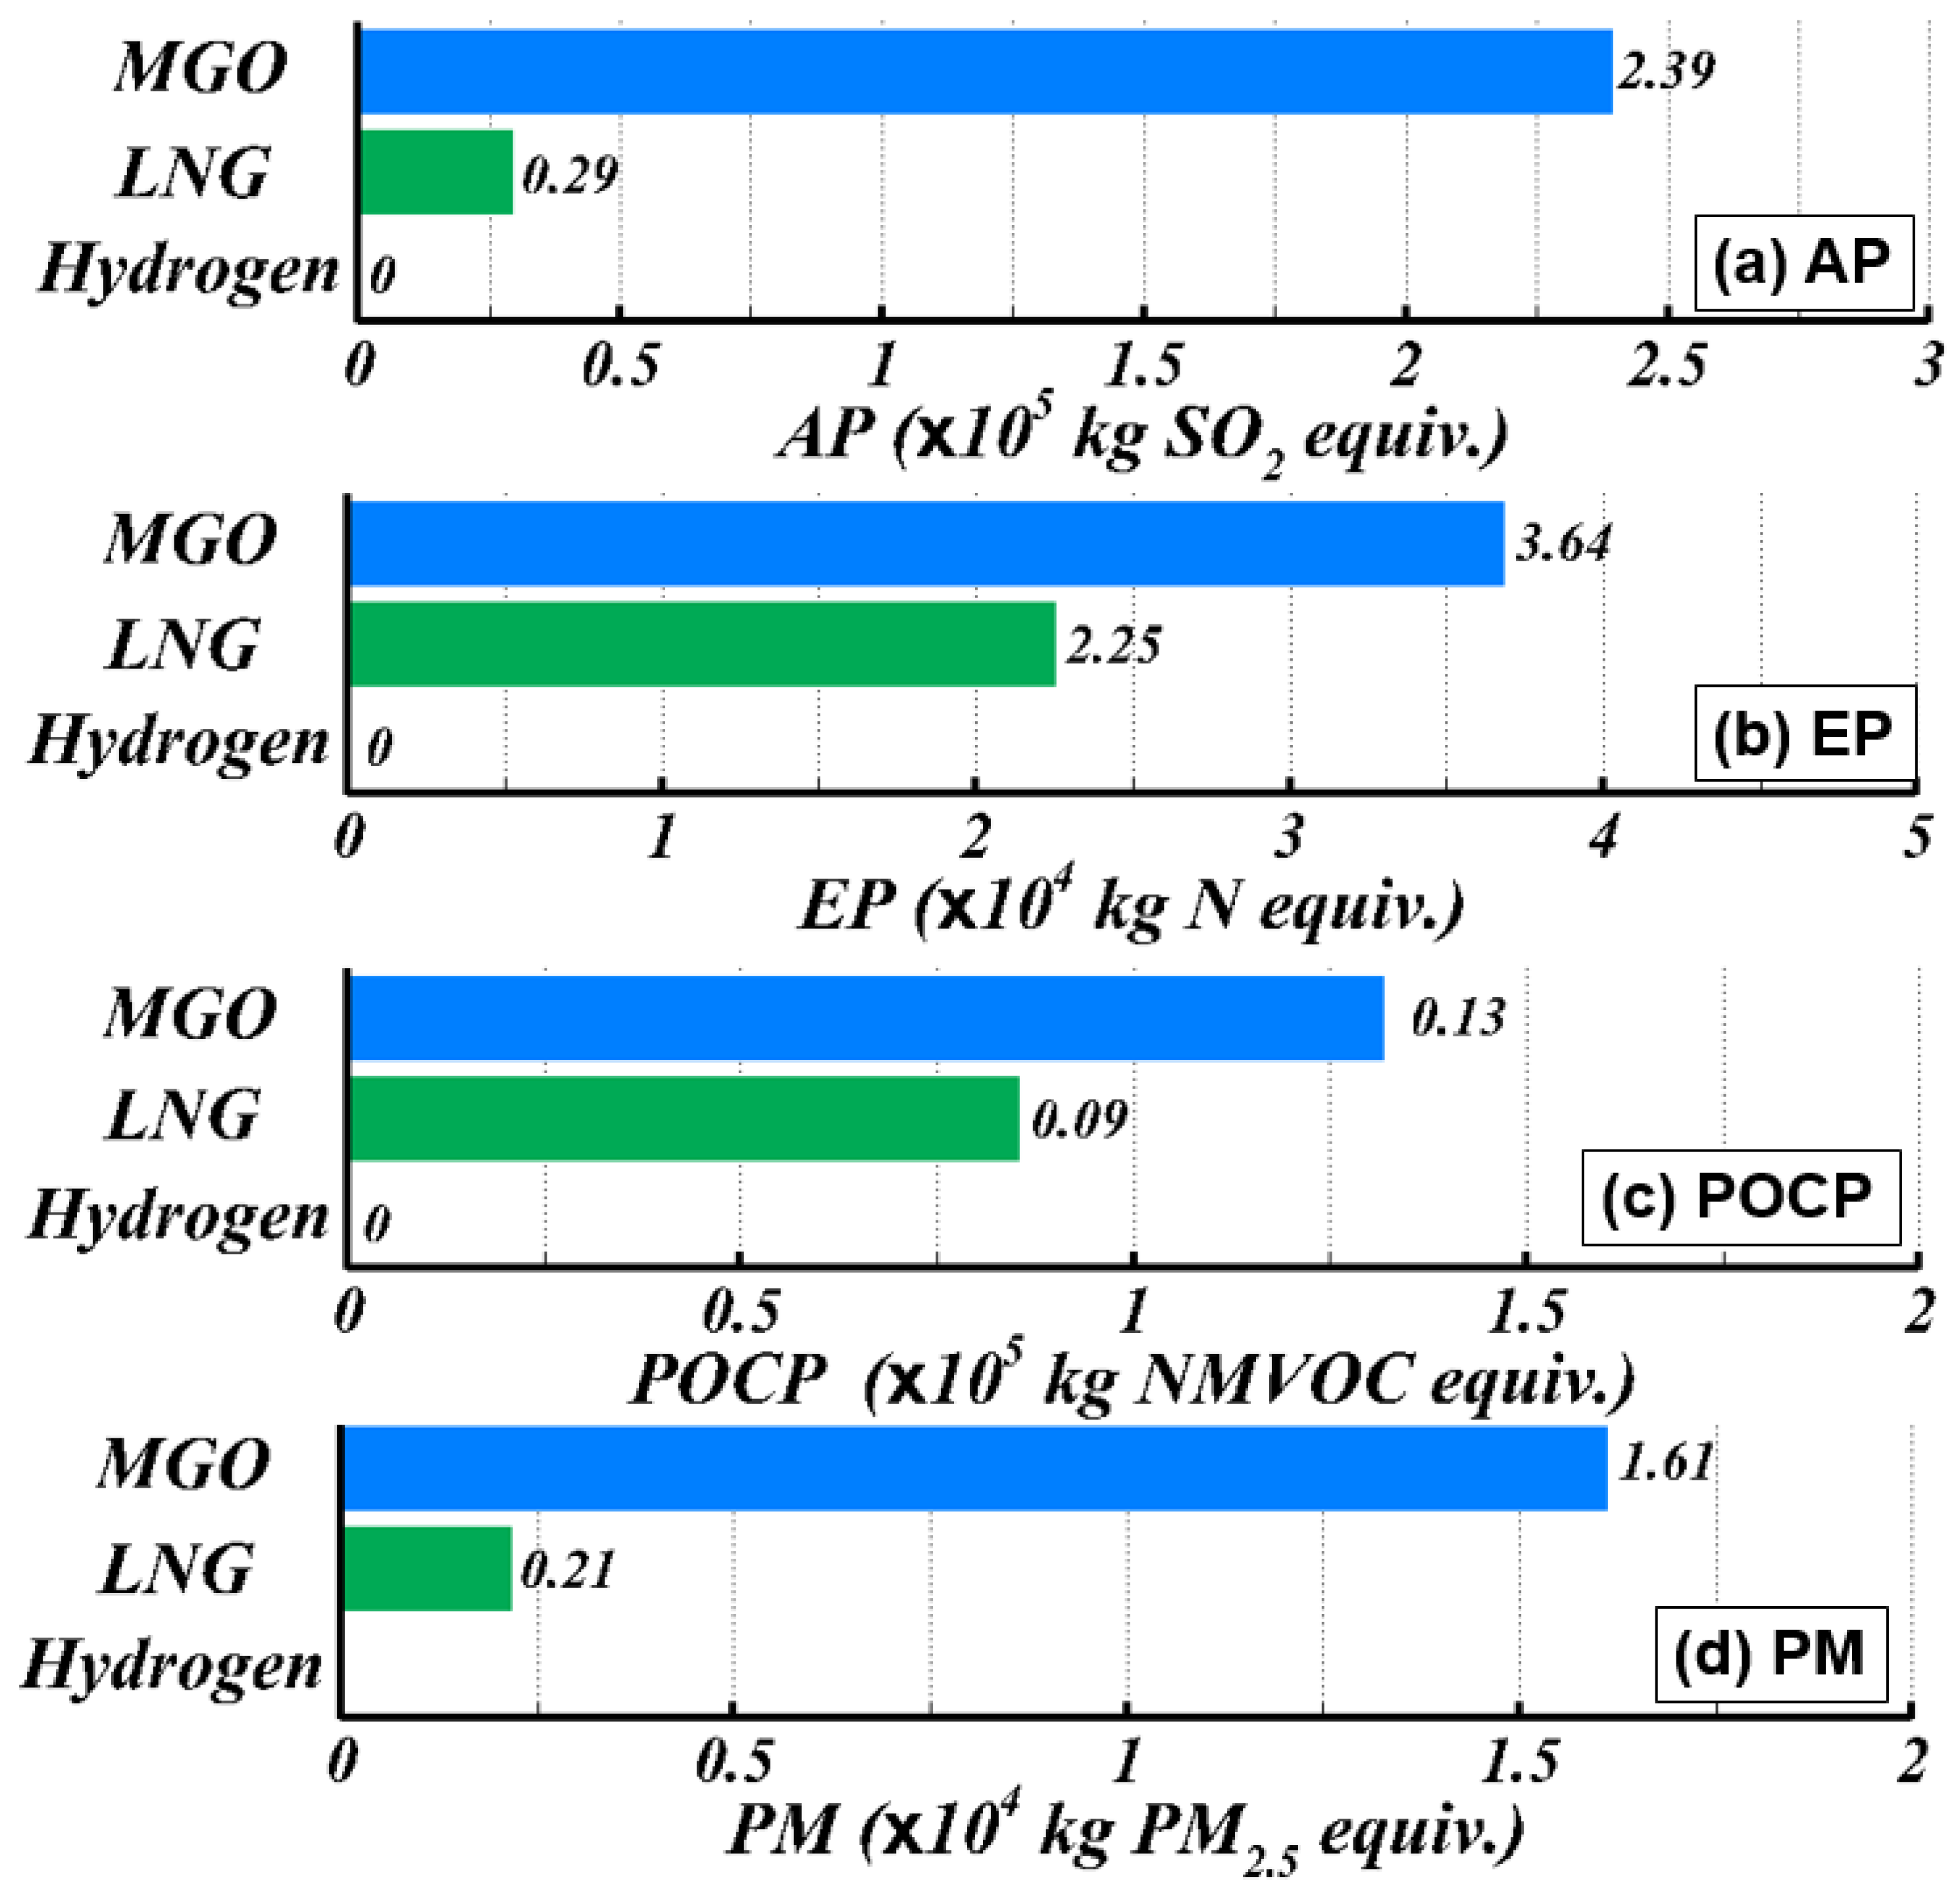
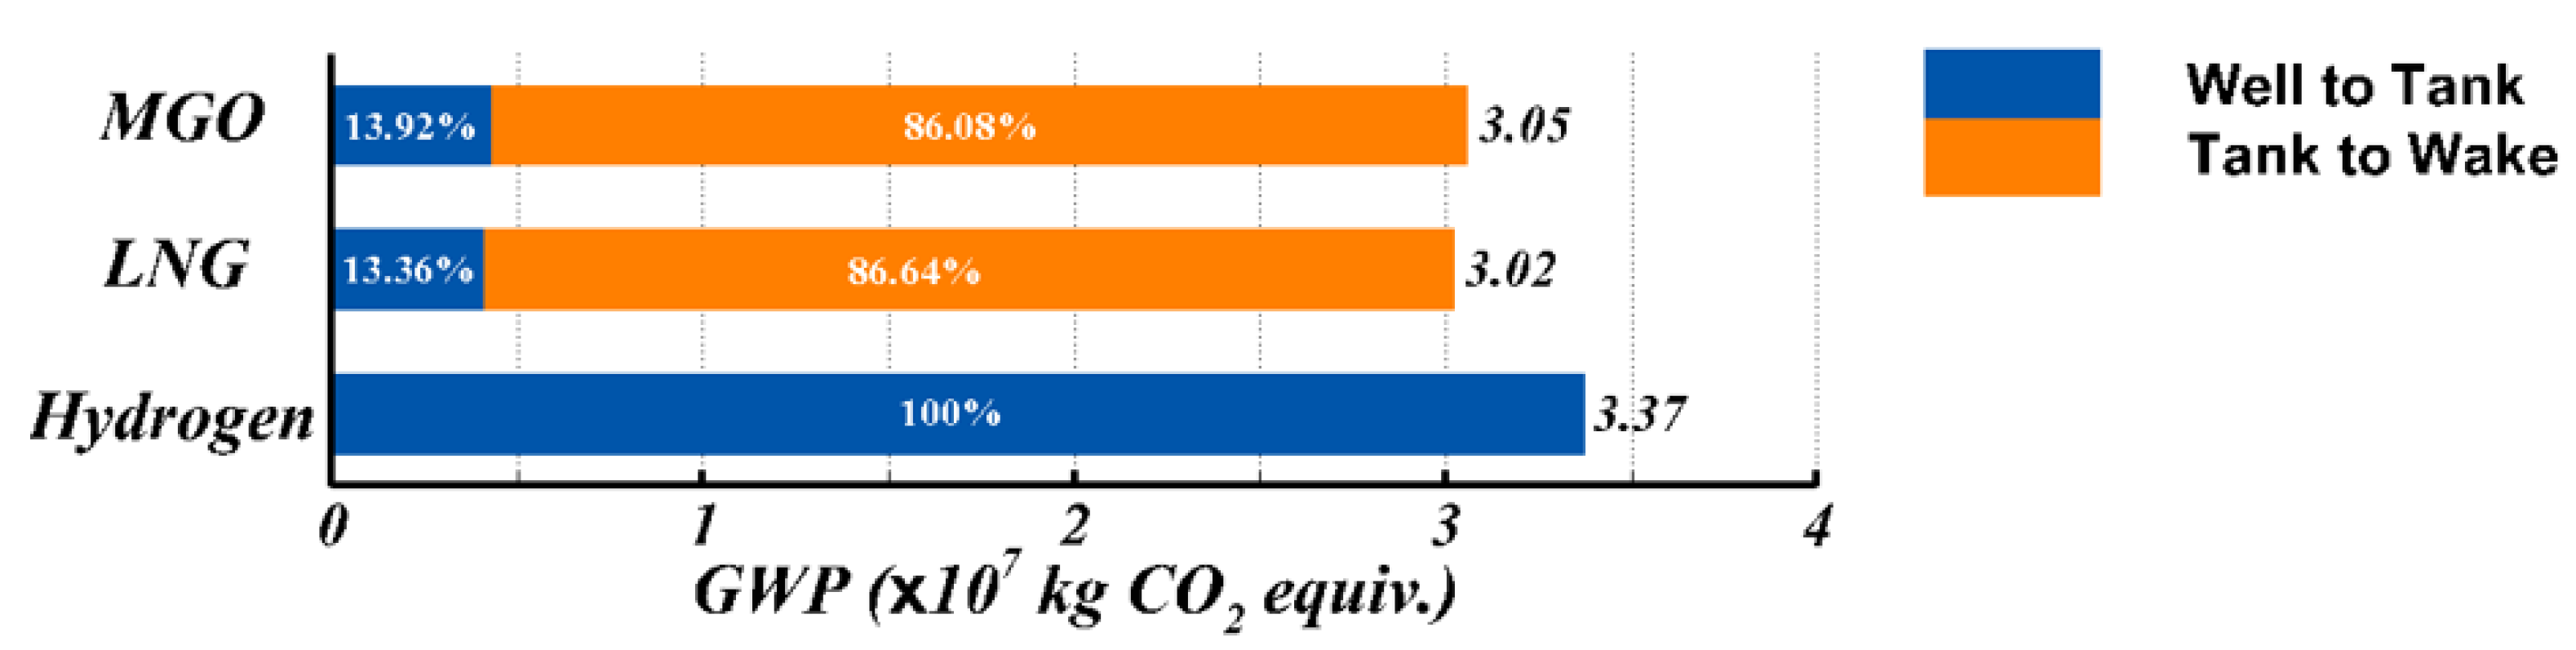
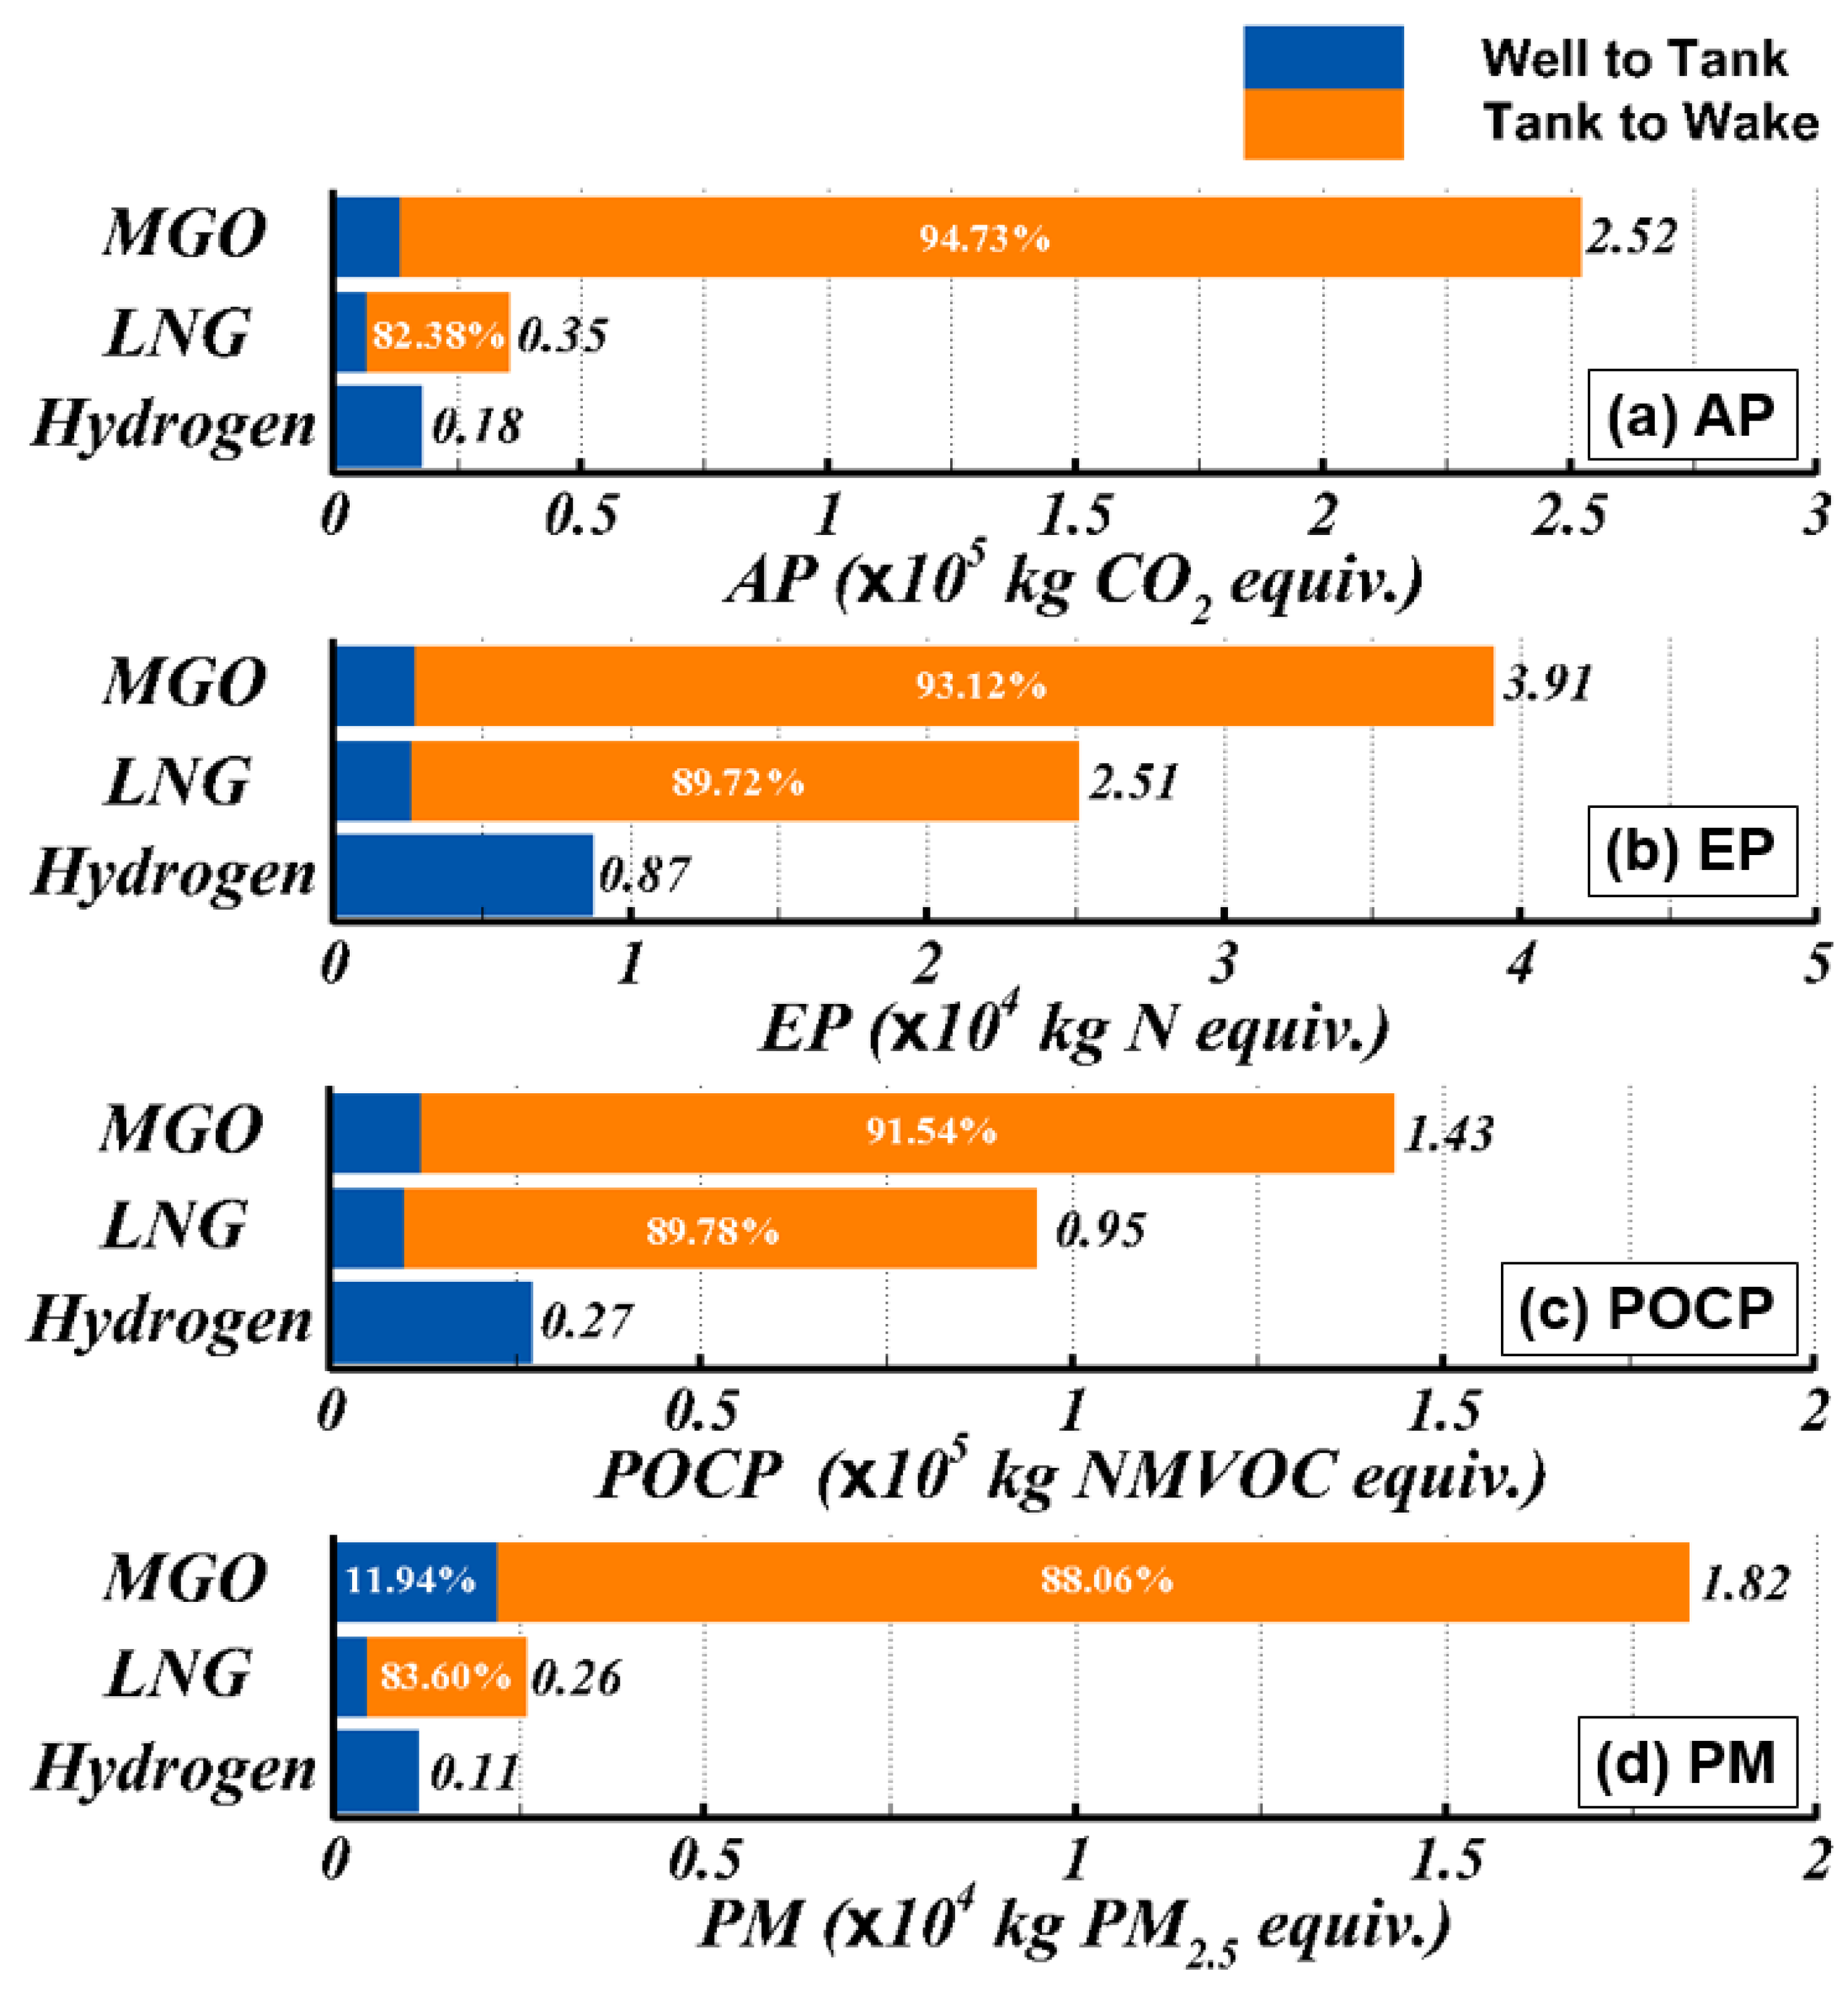
3.3. Environmental Impact Assessment in the Well-to-Wake Phase
4. Conclusions
- In the well-to-tank phase, hydrogen showed the highest level of GWP among the alternative ship fuels. This is because of the large amount of CO2 emissions during the hydrogen generation process of the SMR and the electricity consumed in the hydrogen compression process. The hydrogen also showed the largest level of AP, EP, POCP, and PM emissions.
- In the tank-to-wake phase, it was found that MGO and LNG could remarkably reduce the SOx and NOx emissions to levels lower than the emissions of HFO. Furthermore, LNG could reduce the CO2 emissions, but the GWP level in the phase was similar to the results of MGO due to its methane slip phenomenon during the operation of the ship. The hydrogen fuel did not emit any gases in the phase because the fuel cell only produced water.
- In the well-to-wake phase, as the sum of the well-to-tank phase and tank-to-wake phase, MGO and LNG showed similar GWP emissions, while hydrogen emitted about a 10% higher GWP level than the others. However, hydrogen showed a significantly lower level of emissions for all other environmental categories of AP, EP, POCP, and PM than MGO and LNG, while the maximum level was recorded from MGO in the phase.
- The GWP emissions were shown to be the maximum from hydrogen among the alternative fuels over their life cycles; however, in the other environmental categorizes of AP, EP, POCP, and PM, hydrogen could reduce the amount of emissions to a significantly greater extent than the others. Normally, GWP is taken into account to assess the environmental impacts of the alternative ship fuels considering the greenhouse effect, based on IMO’s 2050 GHG regulation. However, other environmental categories, i.e., AP, EP, POCP, and PM, should also be considered in order to acquire an accurate assessment of the environmental impact of the alternative fuels for ships.
Author Contributions
Funding
Institutional Review Board Statement
Informed Consent Statement
Data Availability Statement
Conflicts of Interest
Abbreviations
| NOx | Nitrogen oxides |
| ECA | Emission control area |
| IMO | International maritime organization |
| SOx | Sulphur oxides |
| GHG | Greenhouse gases |
| MEPC | Marine environment protection committee |
| MGO | Marine gas oil |
| LNG | Liquefied natural gas |
| SCR | Selective catalytic reduction |
| PEMFC | Proton-exchange membrane fuel cell |
| SOFC | Solid oxide fuel cell |
| LCA | Life-cycle assessment |
| ISO | International Organization for Standardization |
| HFO | Heavy fuel oil |
| GWP | Global warming potential |
| AP | Acidification potential |
| EP | Eutrophication potential |
| POCP | Photochemical ozone creation potential |
| SMR | Steam methane reforming |
| LCCA | Life-cycle cost assessment |
| PM | Particulate matter |
| GT | Gross tonnage |
| VOCs | Volatile organic compounds |
| NMVOC | Non-methane volatile organic compounds |
| TRACI | Tool for the reduction and assessment of chemical and other environmental impacts |
| DI | Deionized |
| AIP | Approval in principle |
| CCS | Carbon capture and storage |
| CCUS | Carbon capture, utilization, and storage |
| CAPEX | Capital expenditures |
| OPEX | Operating expenditure |
Appendix A

| MGO | LNG | Hydrogen | |
|---|---|---|---|
| GWP (kg CO2 equiv.) | 4,250,620.10 | 4,033,280.24 | 33,706,772.69 |
| AP (kg SO2 equiv.) | 13,283.88 | 6245.23 | 17,693.00 |
| EP (kg N equiv.) | 2687.37 | 2579.93 | 8691.01 |
| POCP (kg NMVOC equiv.) | 12,122.20 | 9712.52 | 26,980.69 |
| PM (kg PM2.5 equiv.) | 2178.95 | 421.60 | 1116.39 |
| MGO | LNG | Hydrogen | |
|---|---|---|---|
| GWP (kg CO2 equiv.) | 26,280,812.67 | 26,156,802.07 | 0 |
| AP (kg SO2 equiv.) | 239,341.28 | 29,206.76 | 0 |
| EP (kg N equiv.) | 36,816.46 | 22,517.70 | 0 |
| POCP (kg NMVOC equiv.) | 131,671.37 | 85,280.95 | 0 |
| PM (kg PM2.5 equiv.) | 16,100.50 | 2148.41 | 0 |
| MGO | LNG | Hydrogen | |
|---|---|---|---|
| GWP (kg CO2 equiv.) | 30,531,432.37 | 30,190,082.31 | 33,706,772.69 |
| AP (kg SO2 equiv.) | 251,955.04 | 35,451.98 | 17,693.00 |
| EP (kg N equiv.) | 39,057.29 | 25,097.62 | 8691.01 |
| POCP (kg NMVOC equiv.) | 143,152.76 | 94,993.46 | 26,980.69 |
| PM (kg PM2.5 equiv.) | 18,249.31 | 2570.01 | 1116.39 |
References
- International Maritime Organization (I.M.O.). Regulations for the Prevention of Air Pollution from Ships. Resolution MEPC 176(58); International Maritime Organization: London, UK, 2008. [Google Scholar]
- International Maritime Organization (I.M.O.). Guidelines for Exhaust Gas Cleaning Systems. Resolution MEPC 259(68); International Maritime Organization: London, UK, 2015. [Google Scholar]
- International Maritime Organization (I.M.O.). Initial IMO Strategy on Reduction of GHG Emissions from Ships. Resolution MEPC 304(72); International Maritime Organization: London, UK, 2018. [Google Scholar]
- Ministry of Oceans and Fishers, Korean Government. Act on the Promotion of Development and Distribution of Environmentally Friendly Ships; Ministry of Trade Industry and Energy Enforcement 20. 1. 1.; Enactment No. 16167; Ministry of Oceans and Fishers, Korean Government: Sejong, Korea, 2018.
- Joint Relevant Ministries, Korean Government. Strategy for 2030 Greenship-K—Basic Plan for Development and Distribution of 1st Eco-Friendly Ship (‘21~’30); Joint Relevant Ministries, Korean Government: Sejong, Korea, 2020. [Google Scholar]
- DNV. LNG Statistics. In Alternative Fuels Insight; DNV: Byrum, Norway, 2018. [Google Scholar]
- Ministry of Trade, Industry and Energy, Korean Government. Roadmap for Activating the Hydrogen Economy; Ministry of Trade, Industry and Energy, Korean Government: Sejong, Korea, 2019.
- Guinée, J.B. Handbook on life cycle assessment operational guide to the ISO standards. Int. J. Life Cycle Assess 2002, 7, 311–313. [Google Scholar] [CrossRef]
- Finnveden, G.; Hauschild, M.Z.; Ekvall, T.; Guinée, J.; Heijungs, R.; Hellweg, S.; Koehler, A.; Pennington, D.; Suh, S. Recent developments in Life Cycle Assessment. J. Environ. Manag. 2009, 91, 1–21. [Google Scholar] [CrossRef] [PubMed]
- Levasseur, A.; Lesage, P.; Margni, M.; Deschenes, L.; Samson, R. Considering Time in LCA: Dynamic LCA and Its Application to Global Warming Impact Assessments. Environ. Sci. Technol. 2019, 44, 3169–3174. [Google Scholar] [CrossRef]
- Lim, S.; Lee, K. Parallel production of biodiesel and bioethanol in palm-oil-based biorefineries: Life cycle assessment on the energy and greenhouse gases emissions. Biofuels 2011, 5, 132–150. [Google Scholar] [CrossRef]
- Awuah-Offei, K.; Adekpedjou, A. Application of life cycle assessment in the mining industry. Int. J. Life Cycle Assess 2011, 16, 82–89. [Google Scholar]
- Bengtsson, S.; Andersson, K.; Fridell, E. Life Cycle Assessment of Marine Fuels: A Comparative Study of Four Fossil Fuels for Marine Propulsion; Chalmers University of Technology: Gothenburg, Sweden, 2011. [Google Scholar]
- Jeong, B. Comparative Analysis of SOx Emission-Compliant Options for Marine Vessels from Environmental Perspective. J. Korean Soc. Power Syst. Eng. 2018, 22, 72–78. [Google Scholar] [CrossRef]
- Sharafian, A.; Blomerus, P.; Mérida, W. Natural gas as a ship fuel: Assessment of greenhouse gas and air pollutant reduction potential. Energy Policy 2019, 131, 332–346. [Google Scholar]
- Hwang, S.S.; Jeong, B.U.; Jung, K.H.; Kim, M.G.; Zhou, P. Life cycle assessment of LNG fueled vessel in domestic services. J. Mar. Sci. Eng. 2019, 7, 359. [Google Scholar]
- Hwang, S.S.; Gil, S.J.; Lee, G.N.; Lee, J.W.; Park, H.; Jung, K.H.; Suh, S.B. Life Cycle Assessment of Alternative Ship Fuels for Coastal Ferry Operating in Republic of Korea. J. Mar. Sci. Eng. 2020, 8, 660. [Google Scholar]
- de-Troya, J.J.; Alvarez, C.; Fernández-Garrido, C.; Carral, L. Analysing the possibilities of using fuel cells in ships. Int. J. Hydrogen Energy 2016, 41, 2853–2866. [Google Scholar] [CrossRef]
- Perčić, M.; Vladimir, N.; Jovanović, I.; Koričan, M. Application of fuel cells with zero-carbon fuels in short-sea shipping. Appl. Energy 2022, 309, 118463. [Google Scholar] [CrossRef]
- Fan, A.; Wang, J.; He, Y.; Percic, M.; Vladimir, N.; Yang, L. Decarbonising inland ship power system: Alternative solution and assessment method. Energy 2021, 226, 120266. [Google Scholar] [CrossRef]
- Percic, M.; Vladimir, N.; Fan, A. Techno-economic assessment of alternative marine fuels for inland shipping in Croatia. Renew. Sustain. Energy Rev. 2021, 148, 111363. [Google Scholar] [CrossRef]
- Percic, M.; Vladimir, N.; Korican, M. Electrification of inland waterway ships considering power system lifetime emissions and costs. Energies 2021, 14, 7046. [Google Scholar] [CrossRef]
- Brynolf, S.; Taljegard, M.; Grahn, M.; Hansson, J. Electrofuels for the transport sector: A review of production costs. Renew. Sustain. Energy Rev. 2018, 81, 1887–1905. [Google Scholar] [CrossRef]
- Percic, M.; Ancic, I.; Vladimir, N. Life-cycle cost assessments of different power system configurations to reduce the carbon footprint in the Croatian short-sea shipping sector. Renew. Sustain. Energy Rev. 2020, 131, 110028. [Google Scholar] [CrossRef]
- Percic, M.; Vladimir, N.; Fan, A. Life-cycle cost assessment of alternative marine fuels to reduce the carbon footprint in short-sea shipping: A case study of Croatia. Appl. Energy 2020, 279, 115848. [Google Scholar] [CrossRef]
- Thilo, K.; Baitz, M.; Colodel, C.M. GaBi Databases & Modelling Principles; Sphera: Leinfelden-Echterdingen, Germany, 2021. [Google Scholar]
- ISO 14040; Environmental Management—Life Cycle Assessment-Principles and Framework. International Standard Organization (I.S.O.): Geneva, Switzerland, 2016.
- Dreyer, L.C.; Niemann, A.L.; Hauschild, M.Z. Comparison of three different LCIA methods: EDIP97, CML2001 and Eco-indicator 99. Int. J. Life Cycle Assess 2003, 8, 191–200. [Google Scholar] [CrossRef]
- Chomkhamsri, K.; Wolf, M.A.; Pant, R. International Reference Life Cycle Data System (ILCD) Handbook: Review Schemes for Life Cycle Assessment. In Towards Life Cycle Sustainability Management; Springer: Berlin/Heidelberg, Germany, 2011; pp. 107–117. [Google Scholar]
- Bare, J.C. TRACI: The tool for the reduction and assessment of chemical and other environmental impacts. J. Ind. Ecol. 2002, 6, 49–78. [Google Scholar] [CrossRef]
- Sphera. GaBi Solutions: GaBi LCA Database Documentation 2020; Extension database II: Energy. 2020. Available online: http://www.gabi-software.com/support/gabi/gabi-database-2020-lci-documentation/extension-database-ii-energy/ (accessed on 21 July 2020).
- Wang, M.; Lee, H.; Molburg, J. Allocation of energy use in petroleum refineries to petroleum products. Int. J. Life Cycle Assess 2004, 9, 34–44. [Google Scholar] [CrossRef]
- Knaggs, T. Significant Ships of 2008; RINA: London, UK, 2008. [Google Scholar]
- Bhat, S.A.; Sadhukhan, J. Process intensification aspects for steam methane reforming: An overview. AIChE J. 2009, 55, 408–422. [Google Scholar] [CrossRef]
- Spath, P.L.; Mann, M.K. Life Cycle Assessment of Hydrogen Production via Natural Gas Steam Reforming; No. NREL/TP-570-27637; National Renewable Energy Lab: Golden, CO, USA, 2000.
- Gardiner, M. Energy requirements for hydrogen gas compression and liquefaction as related to vehicle storage needs. In DOE Hydrogen and Fuel Cells Program Record; 9013; DOE: Washington, DC, USA, 2009. [Google Scholar]
- Schinas, O.; Butler, M. Feasibility and commercial considerations of LNG-fueled ships. Ocean Eng. 2015, 122, 84–96. [Google Scholar] [CrossRef]
- Korea Shipping Association. Statistical Yearbook of Coastal Shipping; Korea Shipping Association: Seoul, Korea, 2019. [Google Scholar]
- Bureau Veritas Marine & Offshore. Approval in Principle: Hydrogen Fuel Cell Ship; SAFE/20/01651 rev.01; Bureau Veritas Marine & Offshore: Paris, France, 2020. [Google Scholar]
- International Maritime Organization (I.M.O.). Fourth IMO Greenhouse Gas Study 2020; International Maritime Organization (I.M.O.): London, UK, 2020. [Google Scholar]
- Haszeldine, R.S. Carbon capture and storage: How green can black be? Science 2009, 325, 1647–1652. [Google Scholar] [CrossRef] [PubMed]


| Crude Oil Carrier | LNG Carrier | |
|---|---|---|
| Type of Engine | SS diesel engine | 2-stroke Otto-cycle X-DF (with methane slip of 2.5 g CH4/kWh) |
| Engine capacity (kW) | 12,330 | 27,300 |
| Design speed (knots) | 15.2 | 19.5 |
| Cargo capacity (m3) | 57,741 | 147,237 |
| Type of fuel | MGO | LNG |
| Specific Dimensions | Remarks | |
|---|---|---|
| L(LOA) × B × D | 33.0 m × 7.0 m × 3.3 m | Mono hull, aluminum |
| Gross tonnage | 170 GT | |
| Passenger capacity | 135 | |
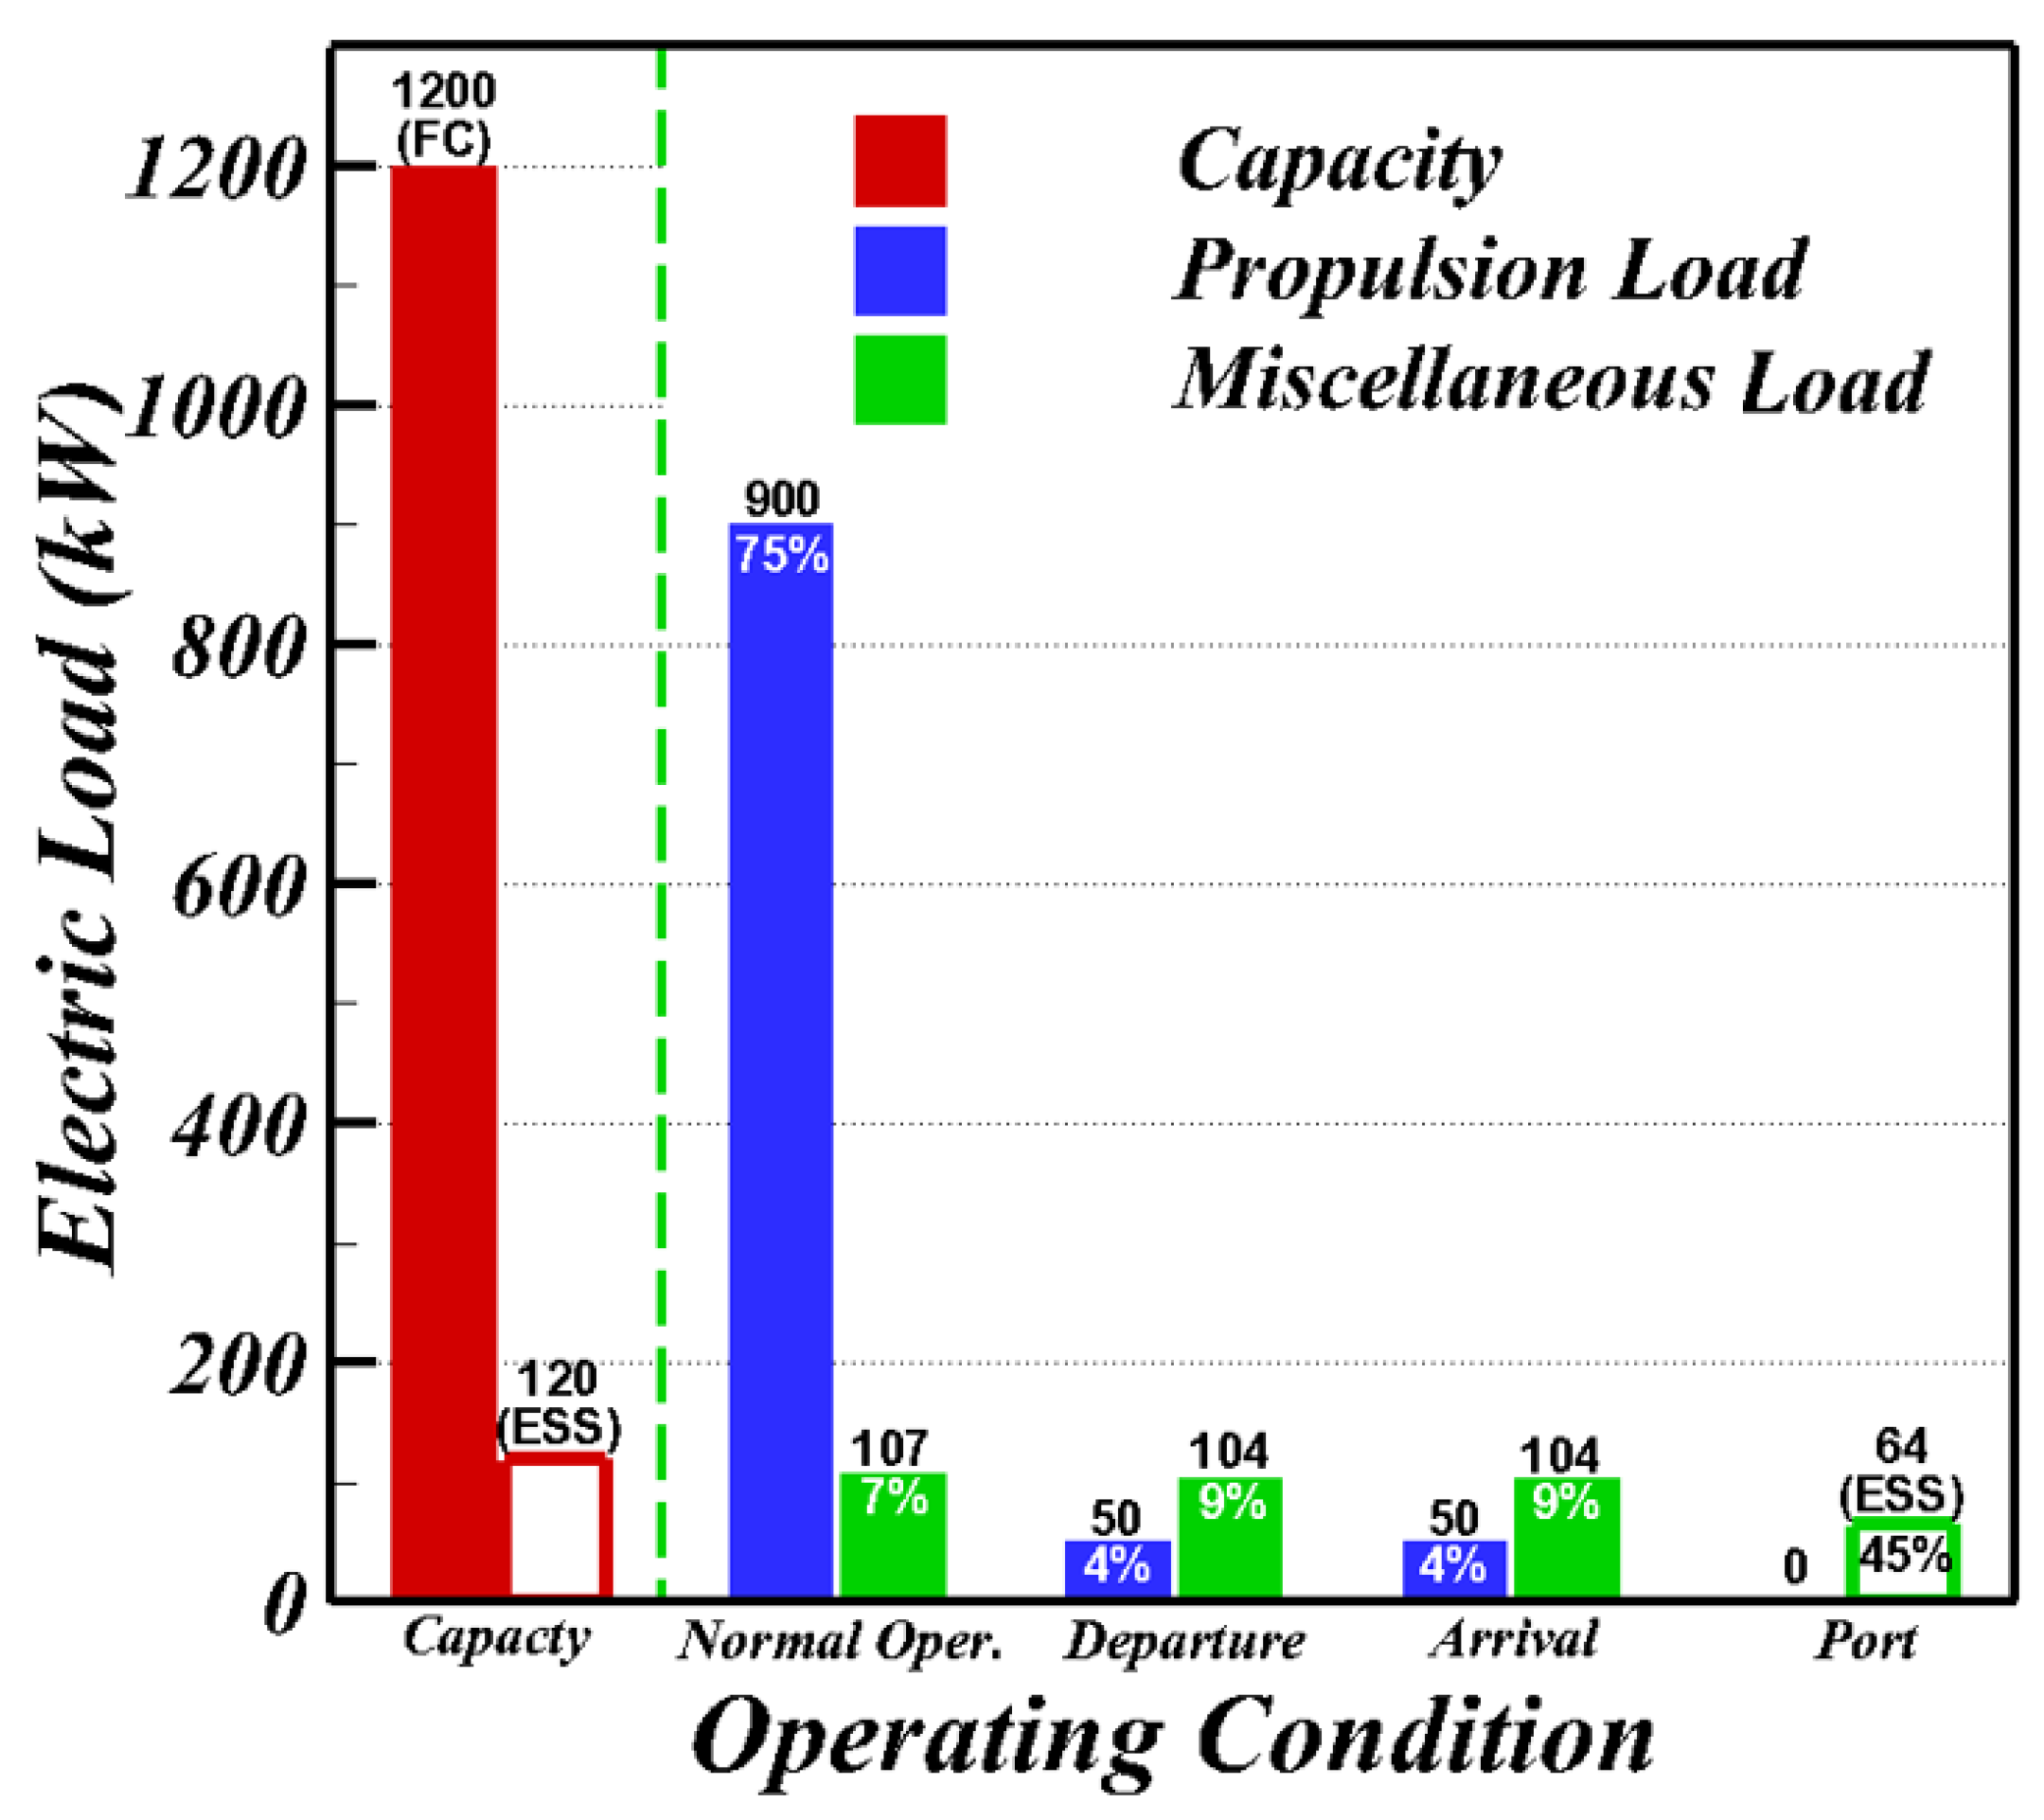
| Fuel cell | 1200 kW (PEMFC) | 10% margin for MCR, 25% for NCR |
| Propulsion motor | MCR: 1080 kW (540 kW × 2) NCR: 900 kW (450 kW × 2) | 17% Margin |
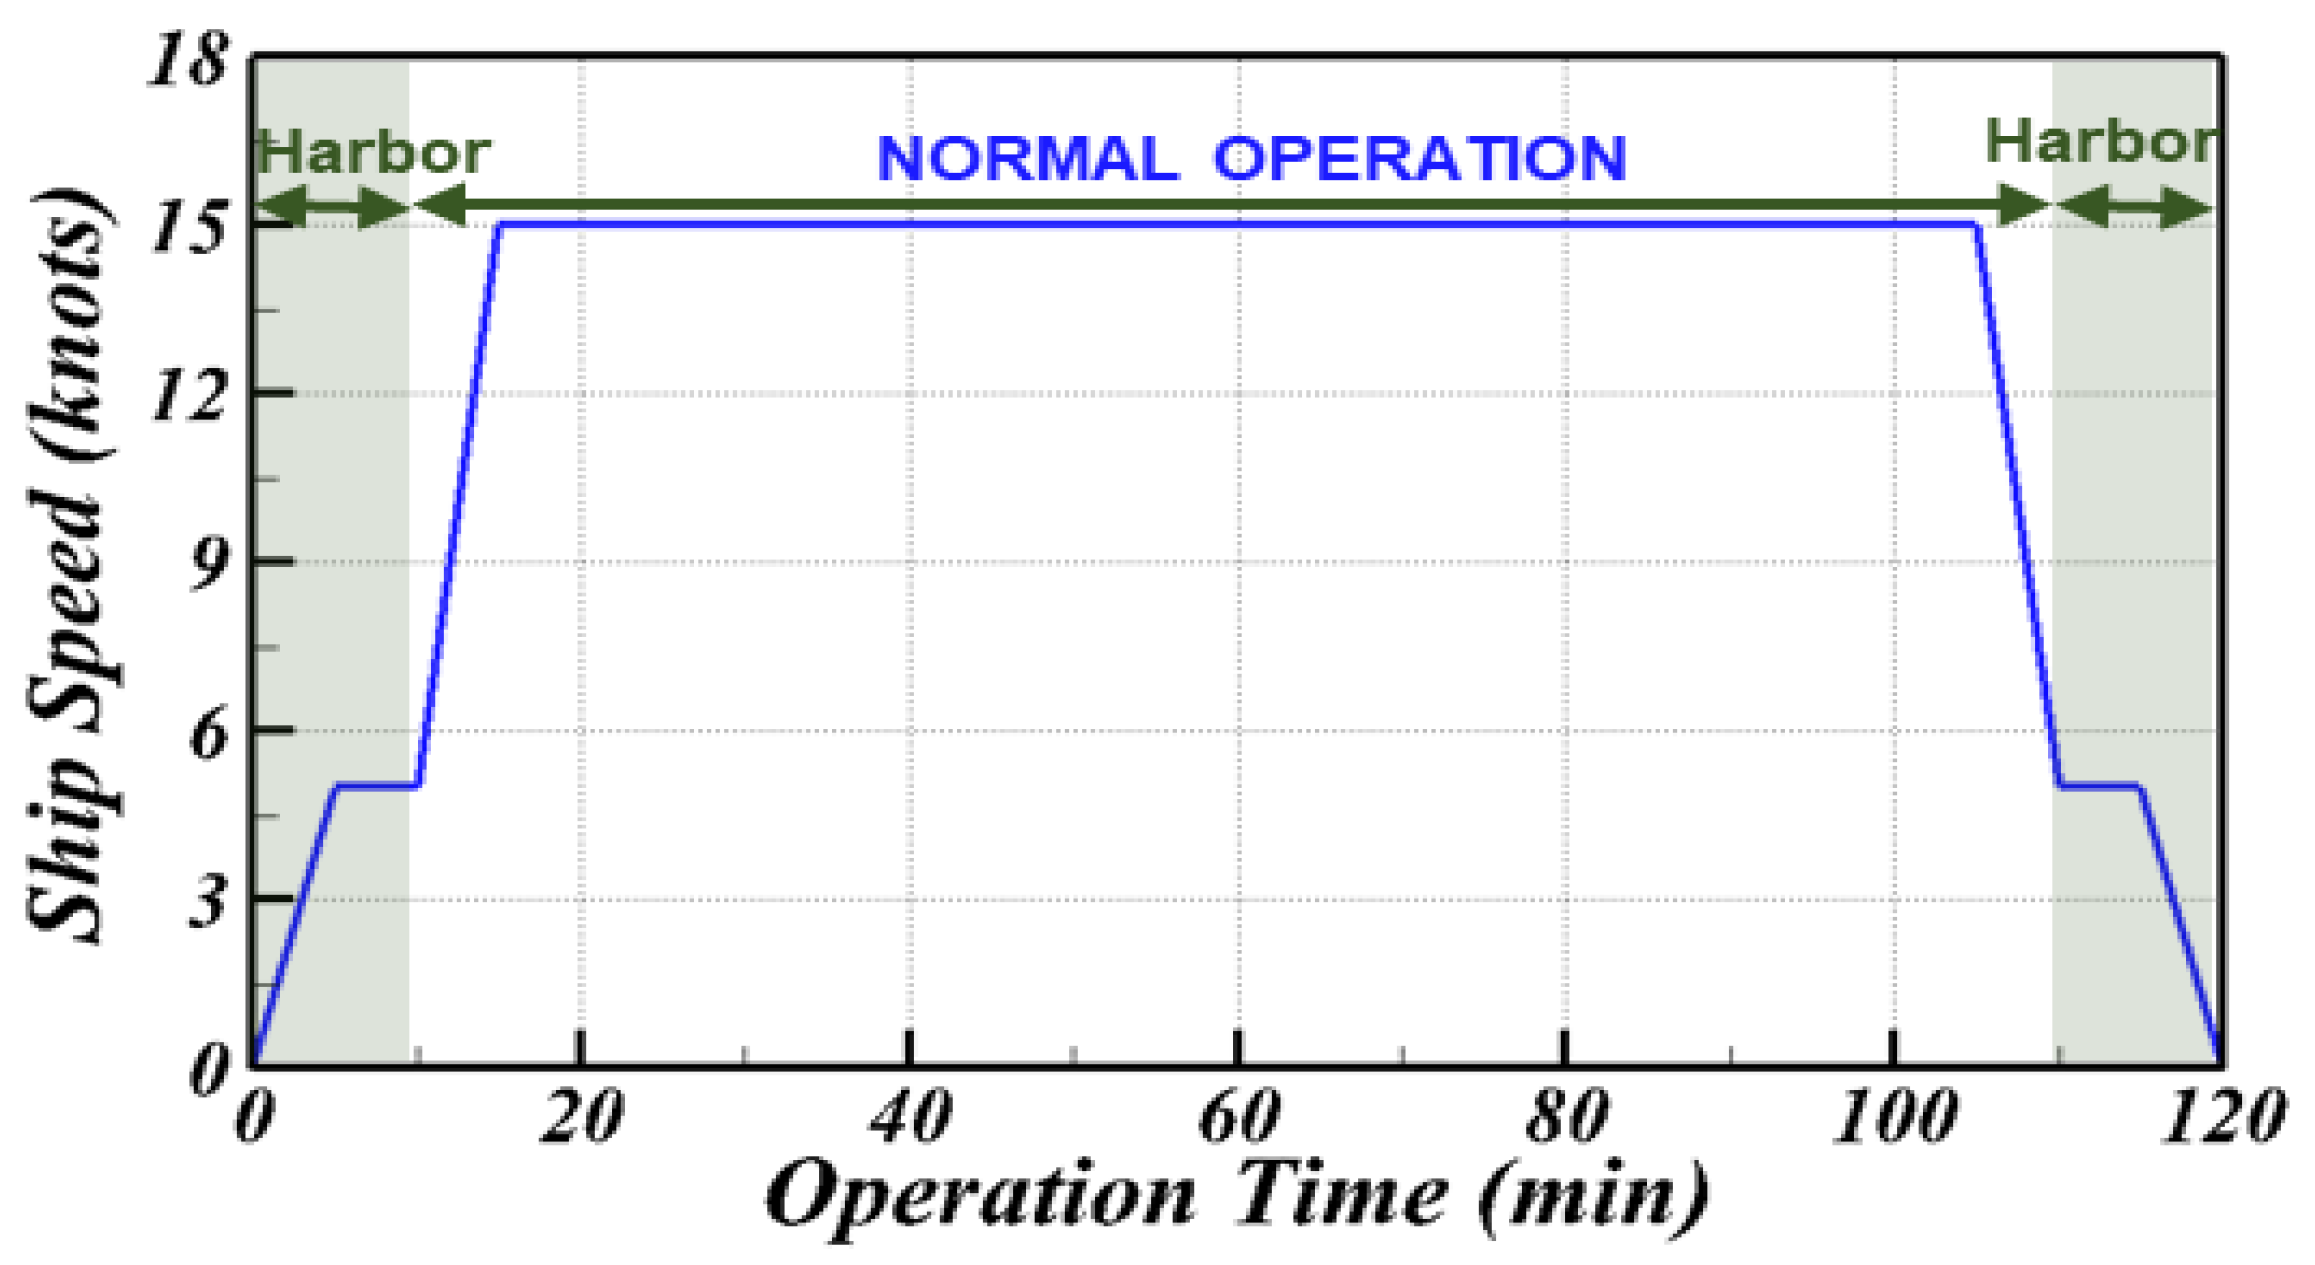
| Speed | Maximum: 16.0 knots at MCR Operating: 15.0 knots at NCR | w/o for maximum, 10% for operation |
| Endurance | 100 N. Miles at 15 knots | at NCR |
| Fuel storage | Total 525 kg | 500 L H2 tank under 700 bar × 25 EA |
| Converter | DC-DC, DC-AC, 380 V | |
| Battery | 120 kWh | In port |
| Trip Hour for One-Way Trip (min) | Energy Consumption for Each Round Trip (MJ) | Round Trip Frequency per Day | Lifetime (Years) | Total Energy Consumption (MJ) |
|---|---|---|---|---|
| 120 | 1.098 × 10⁴ | 2 | 20 | 1.603 × 10⁸ |
| Type of Fuel | MGO | LNG | Hydrogen |
|---|---|---|---|
| Capacity (kW) | 1200 | ||
| Type of generator | MS diesel generator (with SCR) | 4-stroke Otto-cycle X-DF (with a methane slip of 5.5 g CH4/kWh) | Fuel cell with electric motor |
| Efficiency (%) | 46 | 47 | 53 |
| Lower heating value (MJ/kg) | 42.7 | 49.2 | 120 |
| Fuel consumption for 1 round trip (g/kWh) | 184.7 | 155.8 | 56.6 |
| Total fuel consumption (tons) | 8.15 × 10⁶ | 6.97 × 10⁶ | 2.52 × 10⁶ |
| Carbon Dioxide (CO2) | Methane (CH4) | Nitrous Oxide (N2O) | Chlorofluorocarbons (CFCs) | |
|---|---|---|---|---|
| Global warming potential | 1 | 28 | 265 | 1300~23,900 |
Publisher’s Note: MDPI stays neutral with regard to jurisdictional claims in published maps and institutional affiliations. |
© 2022 by the authors. Licensee MDPI, Basel, Switzerland. This article is an open access article distributed under the terms and conditions of the Creative Commons Attribution (CC BY) license (https://creativecommons.org/licenses/by/4.0/).
Share and Cite
Lee, G.N.; Kim, J.M.; Jung, K.H.; Park, H.; Jang, H.S.; Lee, C.S.; Lee, J.W. Environmental Life-Cycle Assessment of Eco-Friendly Alternative Ship Fuels (MGO, LNG, and Hydrogen) for 170 GT Nearshore Ferry. J. Mar. Sci. Eng. 2022, 10, 755. https://doi.org/10.3390/jmse10060755
Lee GN, Kim JM, Jung KH, Park H, Jang HS, Lee CS, Lee JW. Environmental Life-Cycle Assessment of Eco-Friendly Alternative Ship Fuels (MGO, LNG, and Hydrogen) for 170 GT Nearshore Ferry. Journal of Marine Science and Engineering. 2022; 10(6):755. https://doi.org/10.3390/jmse10060755
Chicago/Turabian StyleLee, Gang Nam, Jong Mu Kim, Kwang Hyo Jung, Hyun Park, Hag Soo Jang, Chung Seong Lee, and Ji Won Lee. 2022. "Environmental Life-Cycle Assessment of Eco-Friendly Alternative Ship Fuels (MGO, LNG, and Hydrogen) for 170 GT Nearshore Ferry" Journal of Marine Science and Engineering 10, no. 6: 755. https://doi.org/10.3390/jmse10060755