
Hole-Expansion: Sensitivity of Failure Prediction on Plastic Anisotropy Modeling


1
Department of Mechanical Engineering, University of New Hampshire, 33 Academic Way, Durham, NH 03824, USA
2
Department of Integrated Systems Engineering, The Ohio State University, 1971 Neil Avenue, Columbus, OH 43210, USA
*
Author to whom correspondence should be addressed.
J. Manuf. Mater. Process. 2021, 5(2), 28; https://doi.org/10.3390/jmmp5020028
Submission received: 9 February 2021
/
Revised: 20 March 2021
/
Accepted: 23 March 2021
/
Published: 25 March 2021
(This article belongs to the Special Issue Advances in Sheet Metal Forming and Structures)
Abstract
:The influence of yield function parameters on hole-expansion (HE) predictions are investigated for an anisotropic AA6022-T4 aluminum sheet. The HE experiment is performed in a fully-instrumented double-action hydraulic press with a flat-headed punch. Full strain fields are measured by a stereo-type digital image correlation (DIC) system. The stress state gradually changes from uniaxial to plane-strain tension to biaxial tension in the radial direction. Besides HE, the plastic anisotropy of AA6022-T4 is characterized by uniaxial tension and plane-strain tension experiments. Uniaxial tension is considered as the most important, since it is the stress state along the hoop direction in the hole. For the finite element (FE) simulation, the Yld2000-2d non-quadratic anisotropic yield function is used with two different parameter sets, calibrated by: (1) uniaxial tension only (termed Calib1) and, (2) both uniaxial and plane-strain tension (Calib2). The strain field predictions show a good agreement with the experiments only for Calib2, which takes into account plane-strain as well uniaxial tension. This indicates the importance of biaxial modes, and in particular plane-strain tension, for the adopted yield function to produce accurate HE simulations.
1. Introduction
The hole-expansion (HE) of a thin sheet using a flat-headed punch is akin to the expansion of a circular hole in an equibiaxial tensile field. The stress state at the hole periphery is uniaxial tension in a local coordinate system tangent to the hole, while farther away it is equibiaxial tension, with all the intermediate states occurring in-between. Furthermore, if the sheet is anisotropic, the strain fields around the expanding hole clearly reflect the corresponding orientational dependence of the material. By monitoring the evolution of these fields, e.g., using stereo-type digital image correlation (DIC) [1,2], the HE experiment can be used to probe the anisotropy of the sheet. Inversely, it can be used to validate the structure and calibration of an anisotropic yield function that has been selected to model the sheet behavior [2,3].
The isotropic HE case was treated analytically by Taylor [4] and Budiansky and Mangasarian [5]. Perhaps the first investigation of the anisotropic case was by [6], who used the yield function proposed by Parmar and Mellor [7] and discovered that the strain field predictions were very sensitive to the anisotropic parameters. Further solutions were provided by Durban [8,9,10] for the case of normal anisotropy (i.e., isotropy in the plane of the sheet). The effect of two non-quadratic yield criteria [11,12] was discussed by Cohen et al. [13].
Beyond these works, a variety of anisotropic yield criteria, e.g., Hill ’48 [14], Barlat ’89 [15], and Yld2000-2D [16], or crystal plasticity, have been used in numerical simulations of HE [3,17,18,19,20,21,22,23,24]. In some of these works, anisotropy was calibrated based on uniaxial tension tests at angles to the rolling direction (RD). When rotated to the material axes, these tests included a shear stress component, but they were unsuitable in probing the specifics of the yield locus in the plane-strain and equibiaxial tension regions, which, as discussed earlier, are dominant in the majority of the HE specimen.
In this paper, the effect of the calibration of the anisotropic yield function on the HE strain field predictions is examined. The material selected is AA6022-T4, as in our earlier works [2]. Two alternative data-sets for calibration are adopted, leading to two distinct representations of the yield locus. These are then introduced in finite element (FE) simulations of HE. The predictions of global (i.e., punch force-displacement) and local (i.e., strain fields and their evolution with punch displacement) responses are compared to the experiments.
The results of this work can aid industry in selecting and calibrating an anisotropic yield function appropriate to each material at hand. In particular, comparing the predictions to the HE experiment reveals the ability of the yield function to capture the resulting strain fields, including their local features. This is in turn necessary for accurate predictions of failure in the form of necking and the resulting tearing, which is a prerequisite for reliable virtual process design. Furthermore, this work can be used as a 1st step in assessing the forming limits that can be expected in hole stretching and flanging.
2. Plastic Anisotropy
2.1. Review of Anisotropic Yield Function
The non-quadratic anisotropic yield function Yld2000-2d [16] is constructed based on the non-quadratic isotropic one [11] formulated as:
where are the principal components of deviatoric stress of Cauchy stress , is equivalent stress, and is an exponent based on the crystal structure, i.e., = 6 for body-centered cubic (BCC) and = 8 for face-centered cubic (FCC) materials [25]. To introduce plastic anisotropy in the isotropic function, the Cauchy stress is linearly transformed into and as follows:
by two transformation operators and . In plane-stress components form, Equation (2) can be written as:
Each operator and is determined by anisotropic material parameters, i.e., , as:
As a result, by the transformation of Equation (1), Yld2000-2d anisotropic yield function is expressed as follows:
where are the principal stress components of and .
2.2. Calibration of Yld2000-2d Parameters
As in our earlier work [2], the material of this study is the automotive aluminum alloy AA6022-T4, received as a sheet of 1 mm thickness. Parameter calibration of Yld2000-2d can involve various experimental results, such as uniaxial tension, plane-strain tension, simple shear, in-plane biaxial tension, disk compression, etc. Depending on the applications of interest, different experiments can be used for the calibration, which results in different anisotropic parameters and yield loci. For example, in the original paper [16], the parameters were calibrated based on uniaxial tension in every 45° from the RD and equibiaxial tension. Four flow stresses and four strain ratios, in total eight experimental data, were used to calibrate the eight material parameters using Newton–Raphson method. Ha et al. [26,27] examined the ductile fracture of automotive aluminum sheets, for which plane-strain tension was taken into account in the parameter calibration to capture the deformation in a localized zone before fracture. In HE [2], although the stress state varies from uniaxial to equibiaxial tension along the radial direction from the edge, anisotropy in uniaxial tension is often considered the most critical for parameter calibration due to the high strain concentration near the hole edge. As a result, the effect of various biaxial stress states in the surrounding material, which potentially lead to fracture, is often ignored in the material modeling and analysis of the numerical simulation.
In this work, the role of plastic anisotropy in biaxial tension, especially plane-strain tension, on the HE simulation is investigated by using two different sets of Yld2000-2d parameters. Each parameter set is calibrated with different experiments: Calib1 is based on uniaxial tension in every 15° from the RD, and Calib2 includes plane-strain tension in every 45° from the RD in addition to the same experiments for Calib1. Experimental data for elasto-plastic behavior is taken from the authors’ previous work [2]. The values are summarized in Table 1. Based on them, anisotropic parameters of Yld2000-2d are calibrated independently. The eight anisotropic parameters are determined using the Levenberg–Marquardt nonlinear least-square algorithm. For the plane-strain tension, only the major stress component along the loading direction can be identified in the experiment (using the procedure detailed in [28,29,30,31]) and the minor one, transverse to the loading direction, is determined by the optimization with , with the plane-strain assumption (i.e., zero minor strain, transverse to the loading) [28,29,30]. The calibrated parameters for Calib1 and Calib2 are listed in Table 2.
For the strain hardening, the same parameters as the Voce isotropic model are used with [2], i.e., . As detailed, that hardening curve was identified by a special procedure, i.e., by matching the internal and external work inside the diffuse neck of a tensile specimen [32,33].
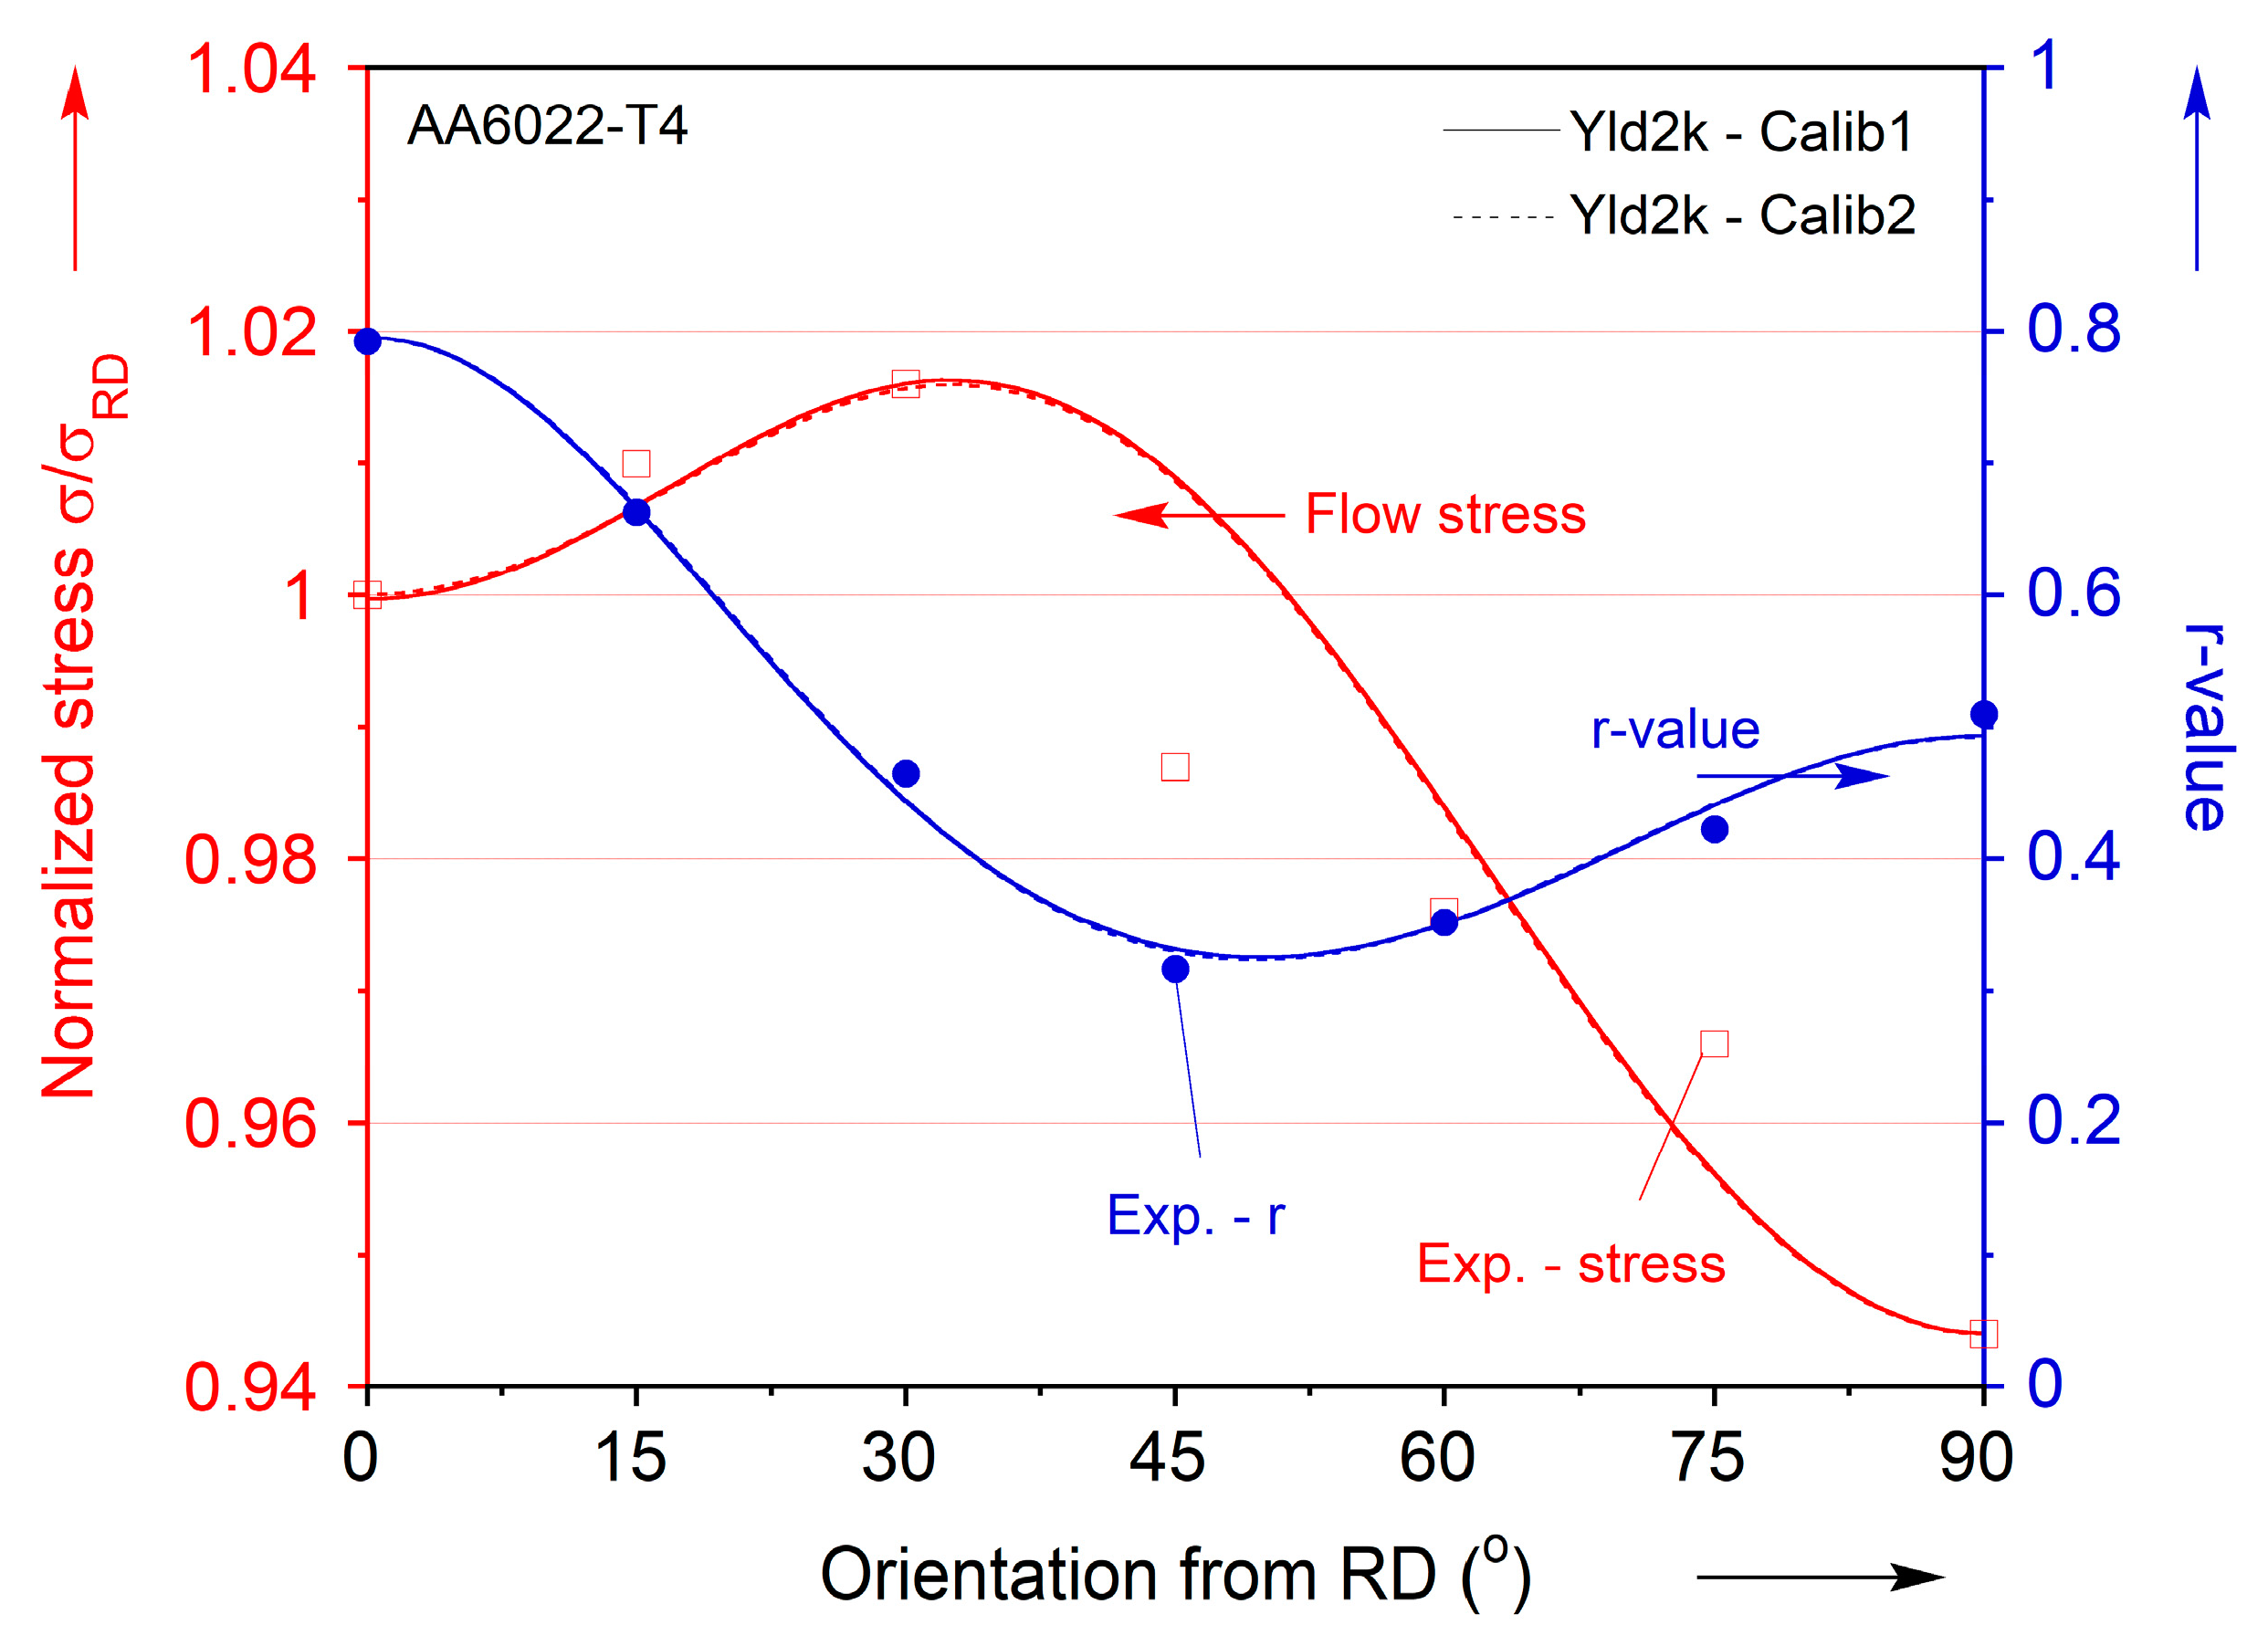
Figure 1 shows a comparison of the experiment and the prediction of Yld2000-2d for the normalized flow stresses and r-values in the uniaxial tension in every 15°. Both parameter sets, i.e., Calib1 and Calib2, capture the plastic anisotropy in the uniaxial tension very well and their predictions are almost identical. This is a natural output of the parameter calibration since both parameter sets are calibrated using the uniaxial tension.
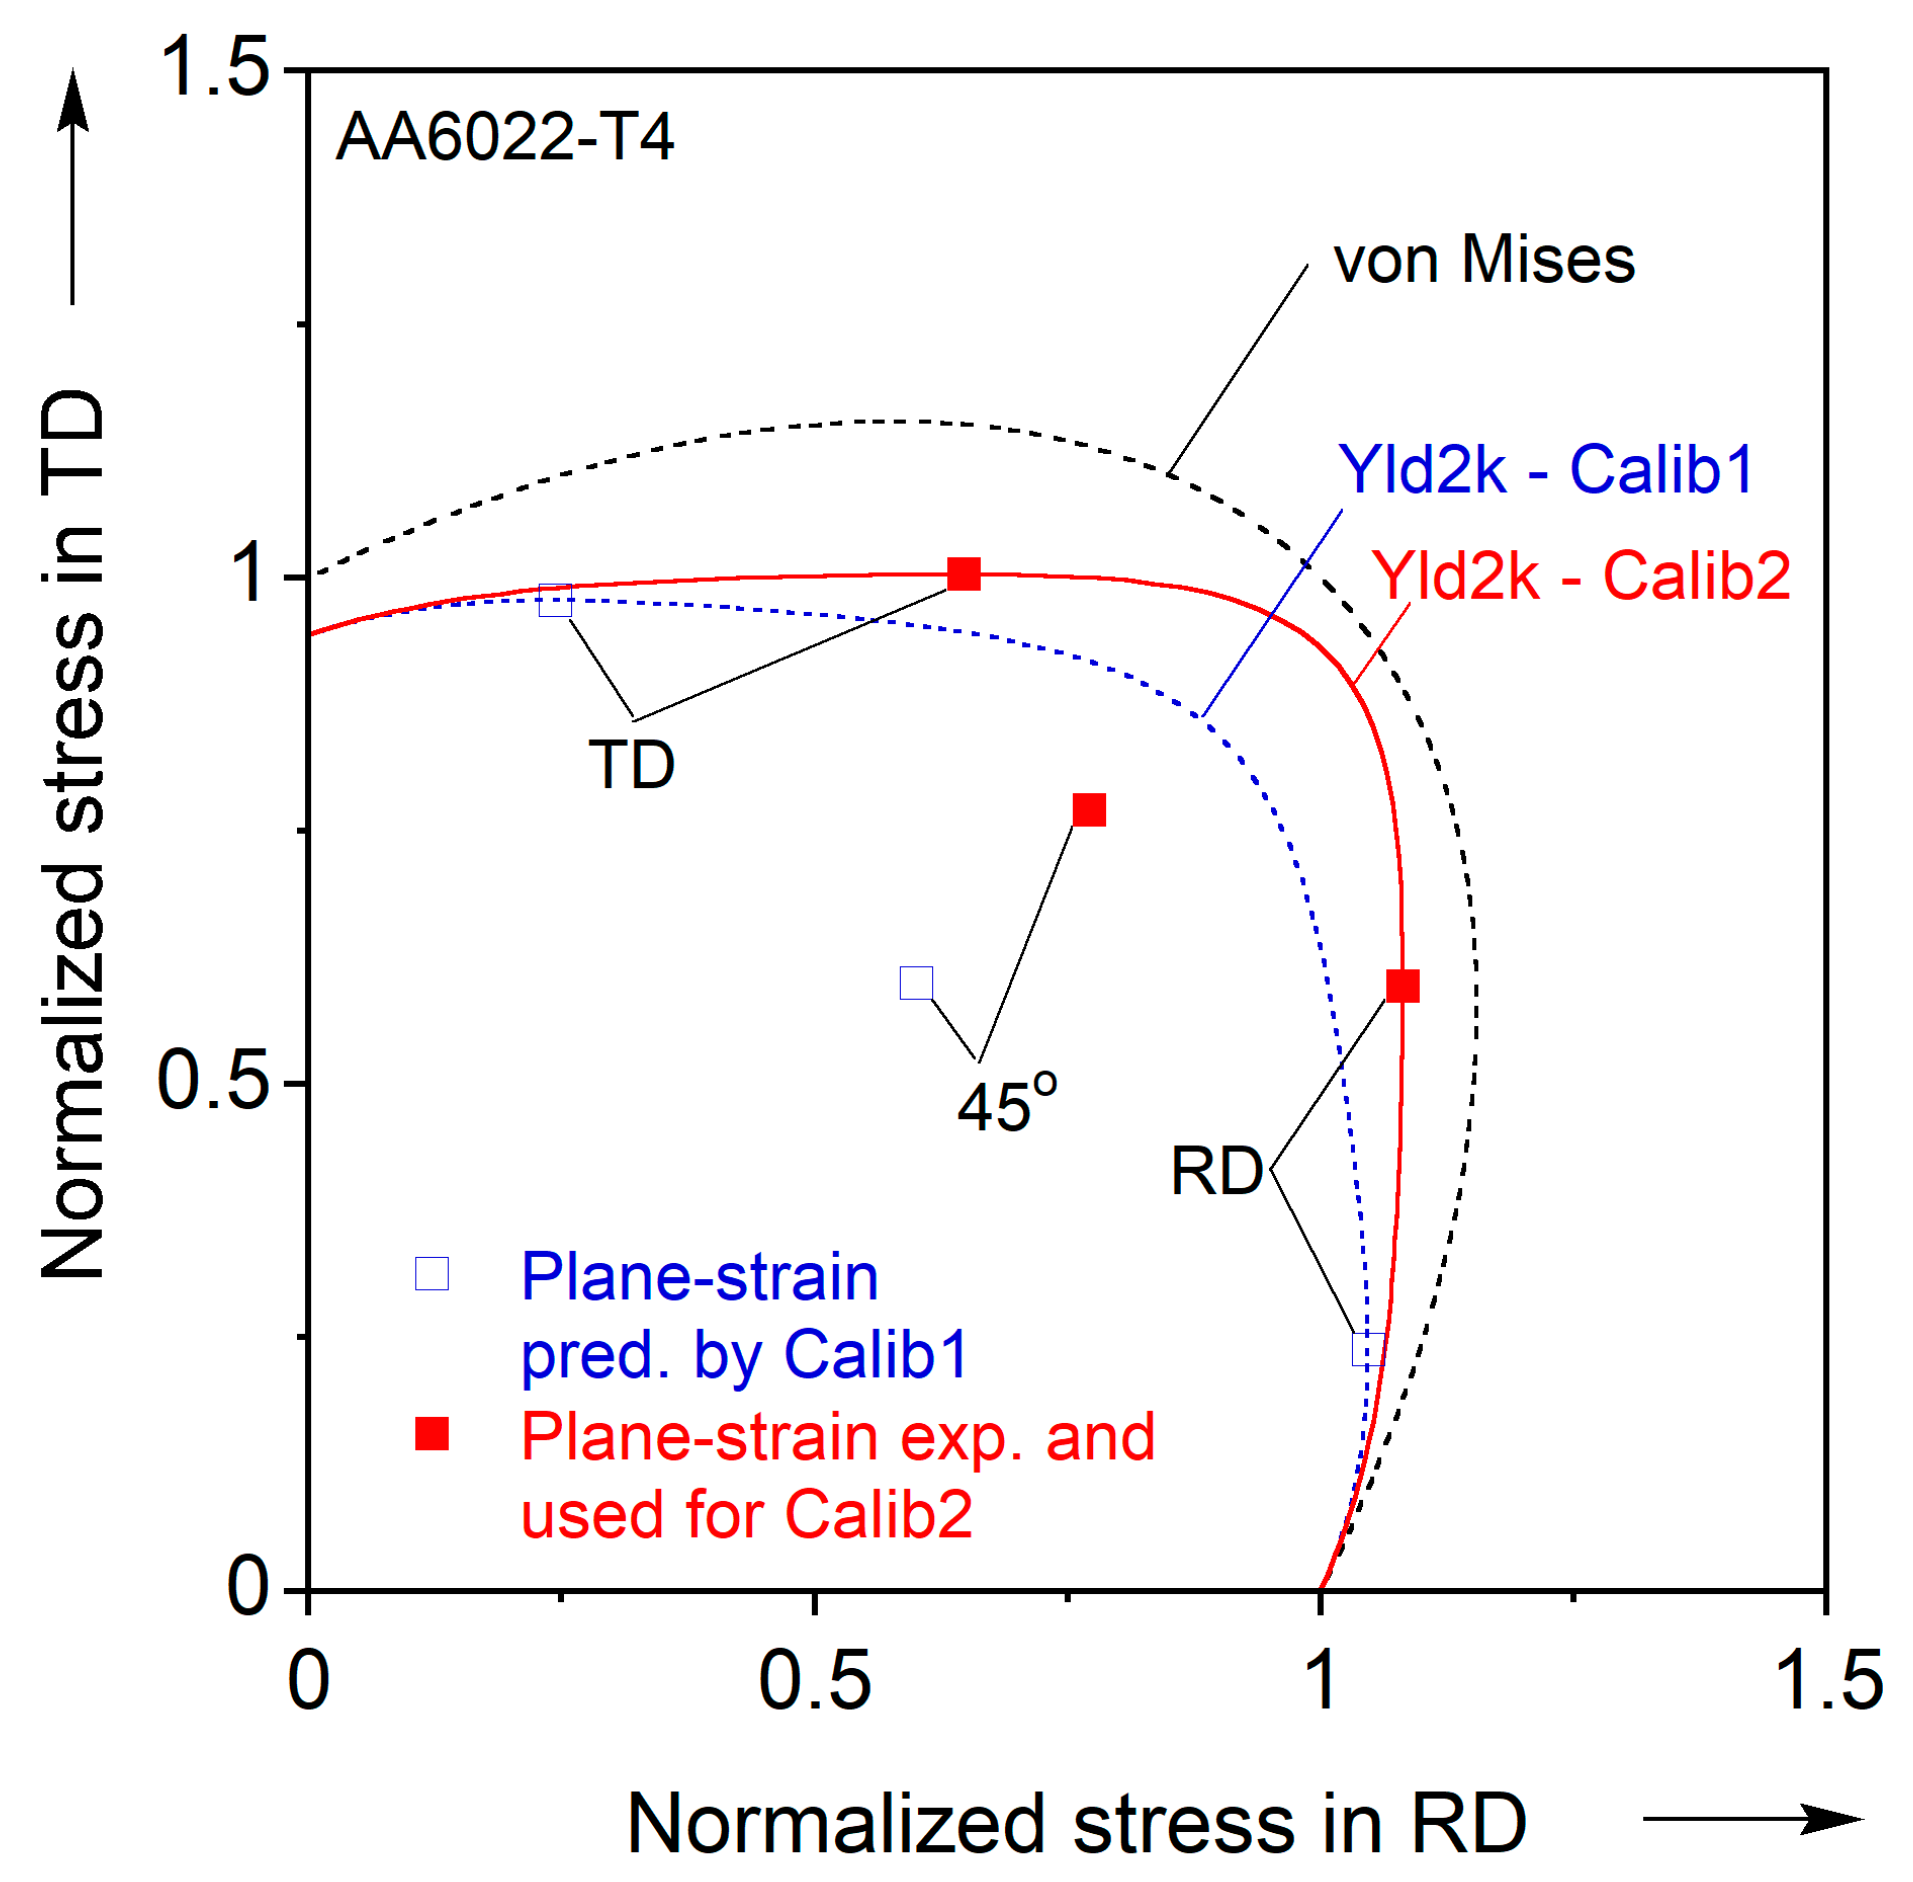
Nevertheless, the corresponding yield loci of Calb1 and Calb2 show a significant difference in Figure 2, especially near plane-strain and biaxial stress states. This is because the experiment of plane-strain tension is not considered in the parameter calibration of Calib1 and, as a result, the plane-strain condition is predicted by Calib1 to be far away from the experiment. It should be noted that the plane-strain condition of Calib1 (blue empty square symbol) is located much closer to the uniaxial tension, while Calib2 is located near to the equibiaxial tension (red filled square symbol).
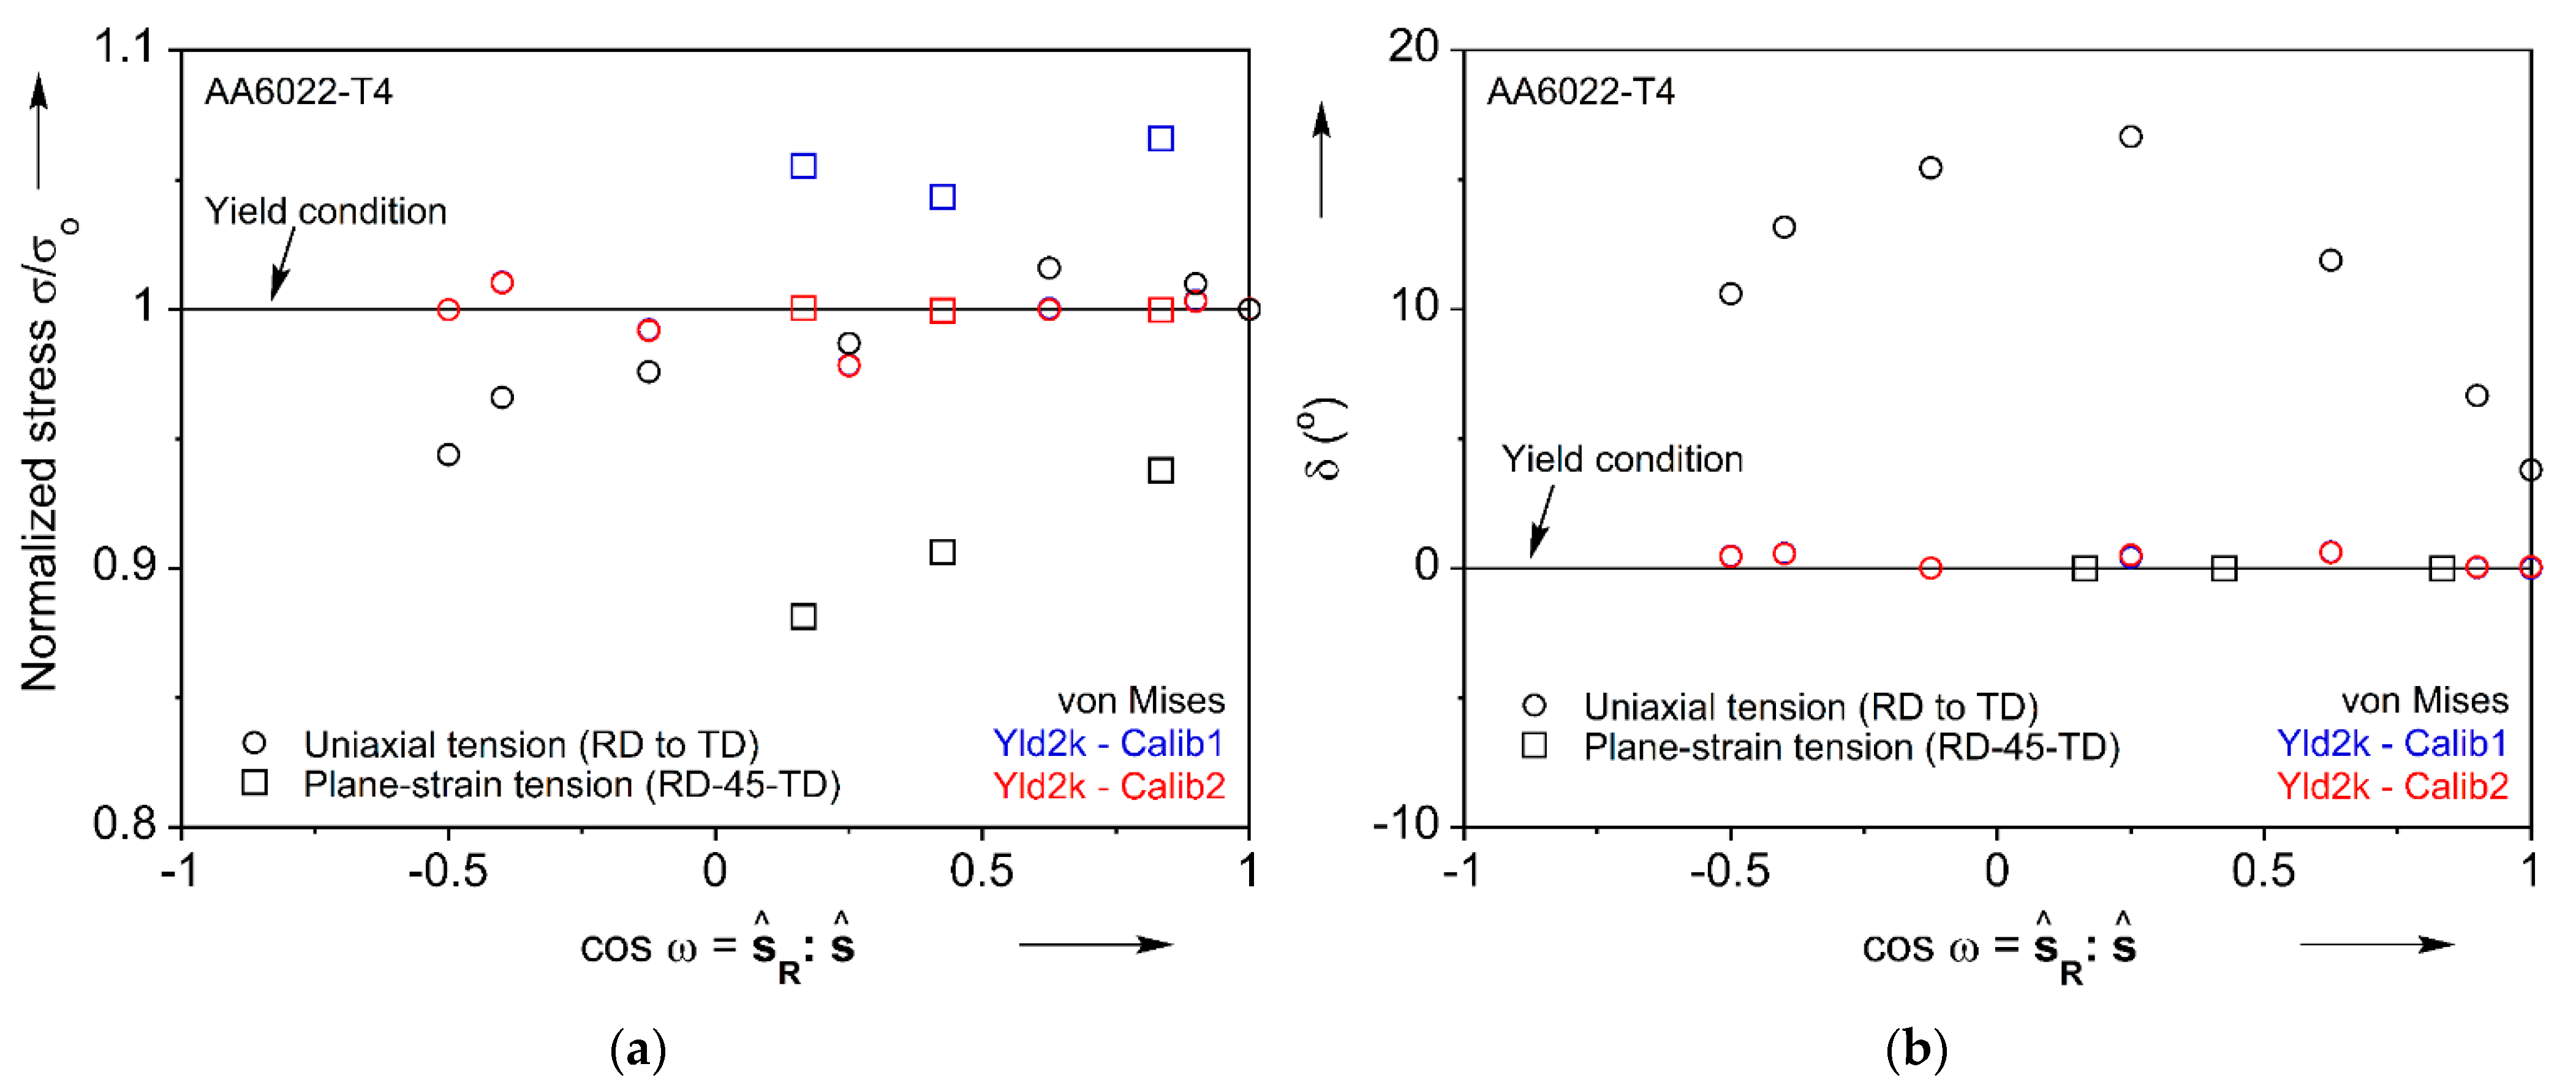
A quantitative assessment of the performance of Calib1 and Calib2 in capturing all the experiments is shown in Figure 3, using the representation proposed by [34]. See also [27,29,30,35]. For each experiment, the orientation of the stress state with respect to a reference direction is computed as . Then, the normalized stress with respect to the equivalent stress (Figure 3a) and the angle between the normal of the predicted yield locus and the experiment (Figure 3b) are plotted against . The deviations of these quantities from 1 are a quantitative measure of the ability by the given yield function to capture the experiments. As a comparison, von Mises is also evaluated with Yld2000-2d (Calib1 and Calib2); the latter is consistently much better than the former for all experiments considered in this work, see Figure 3. Both Calib1 and Calib2 of Yld2000-2d show a good agreement in the uniaxial tension condition, but Calib1 greatly misses the plane-strain tension condition.
3. Hole-Expansion
3.1. Experiment
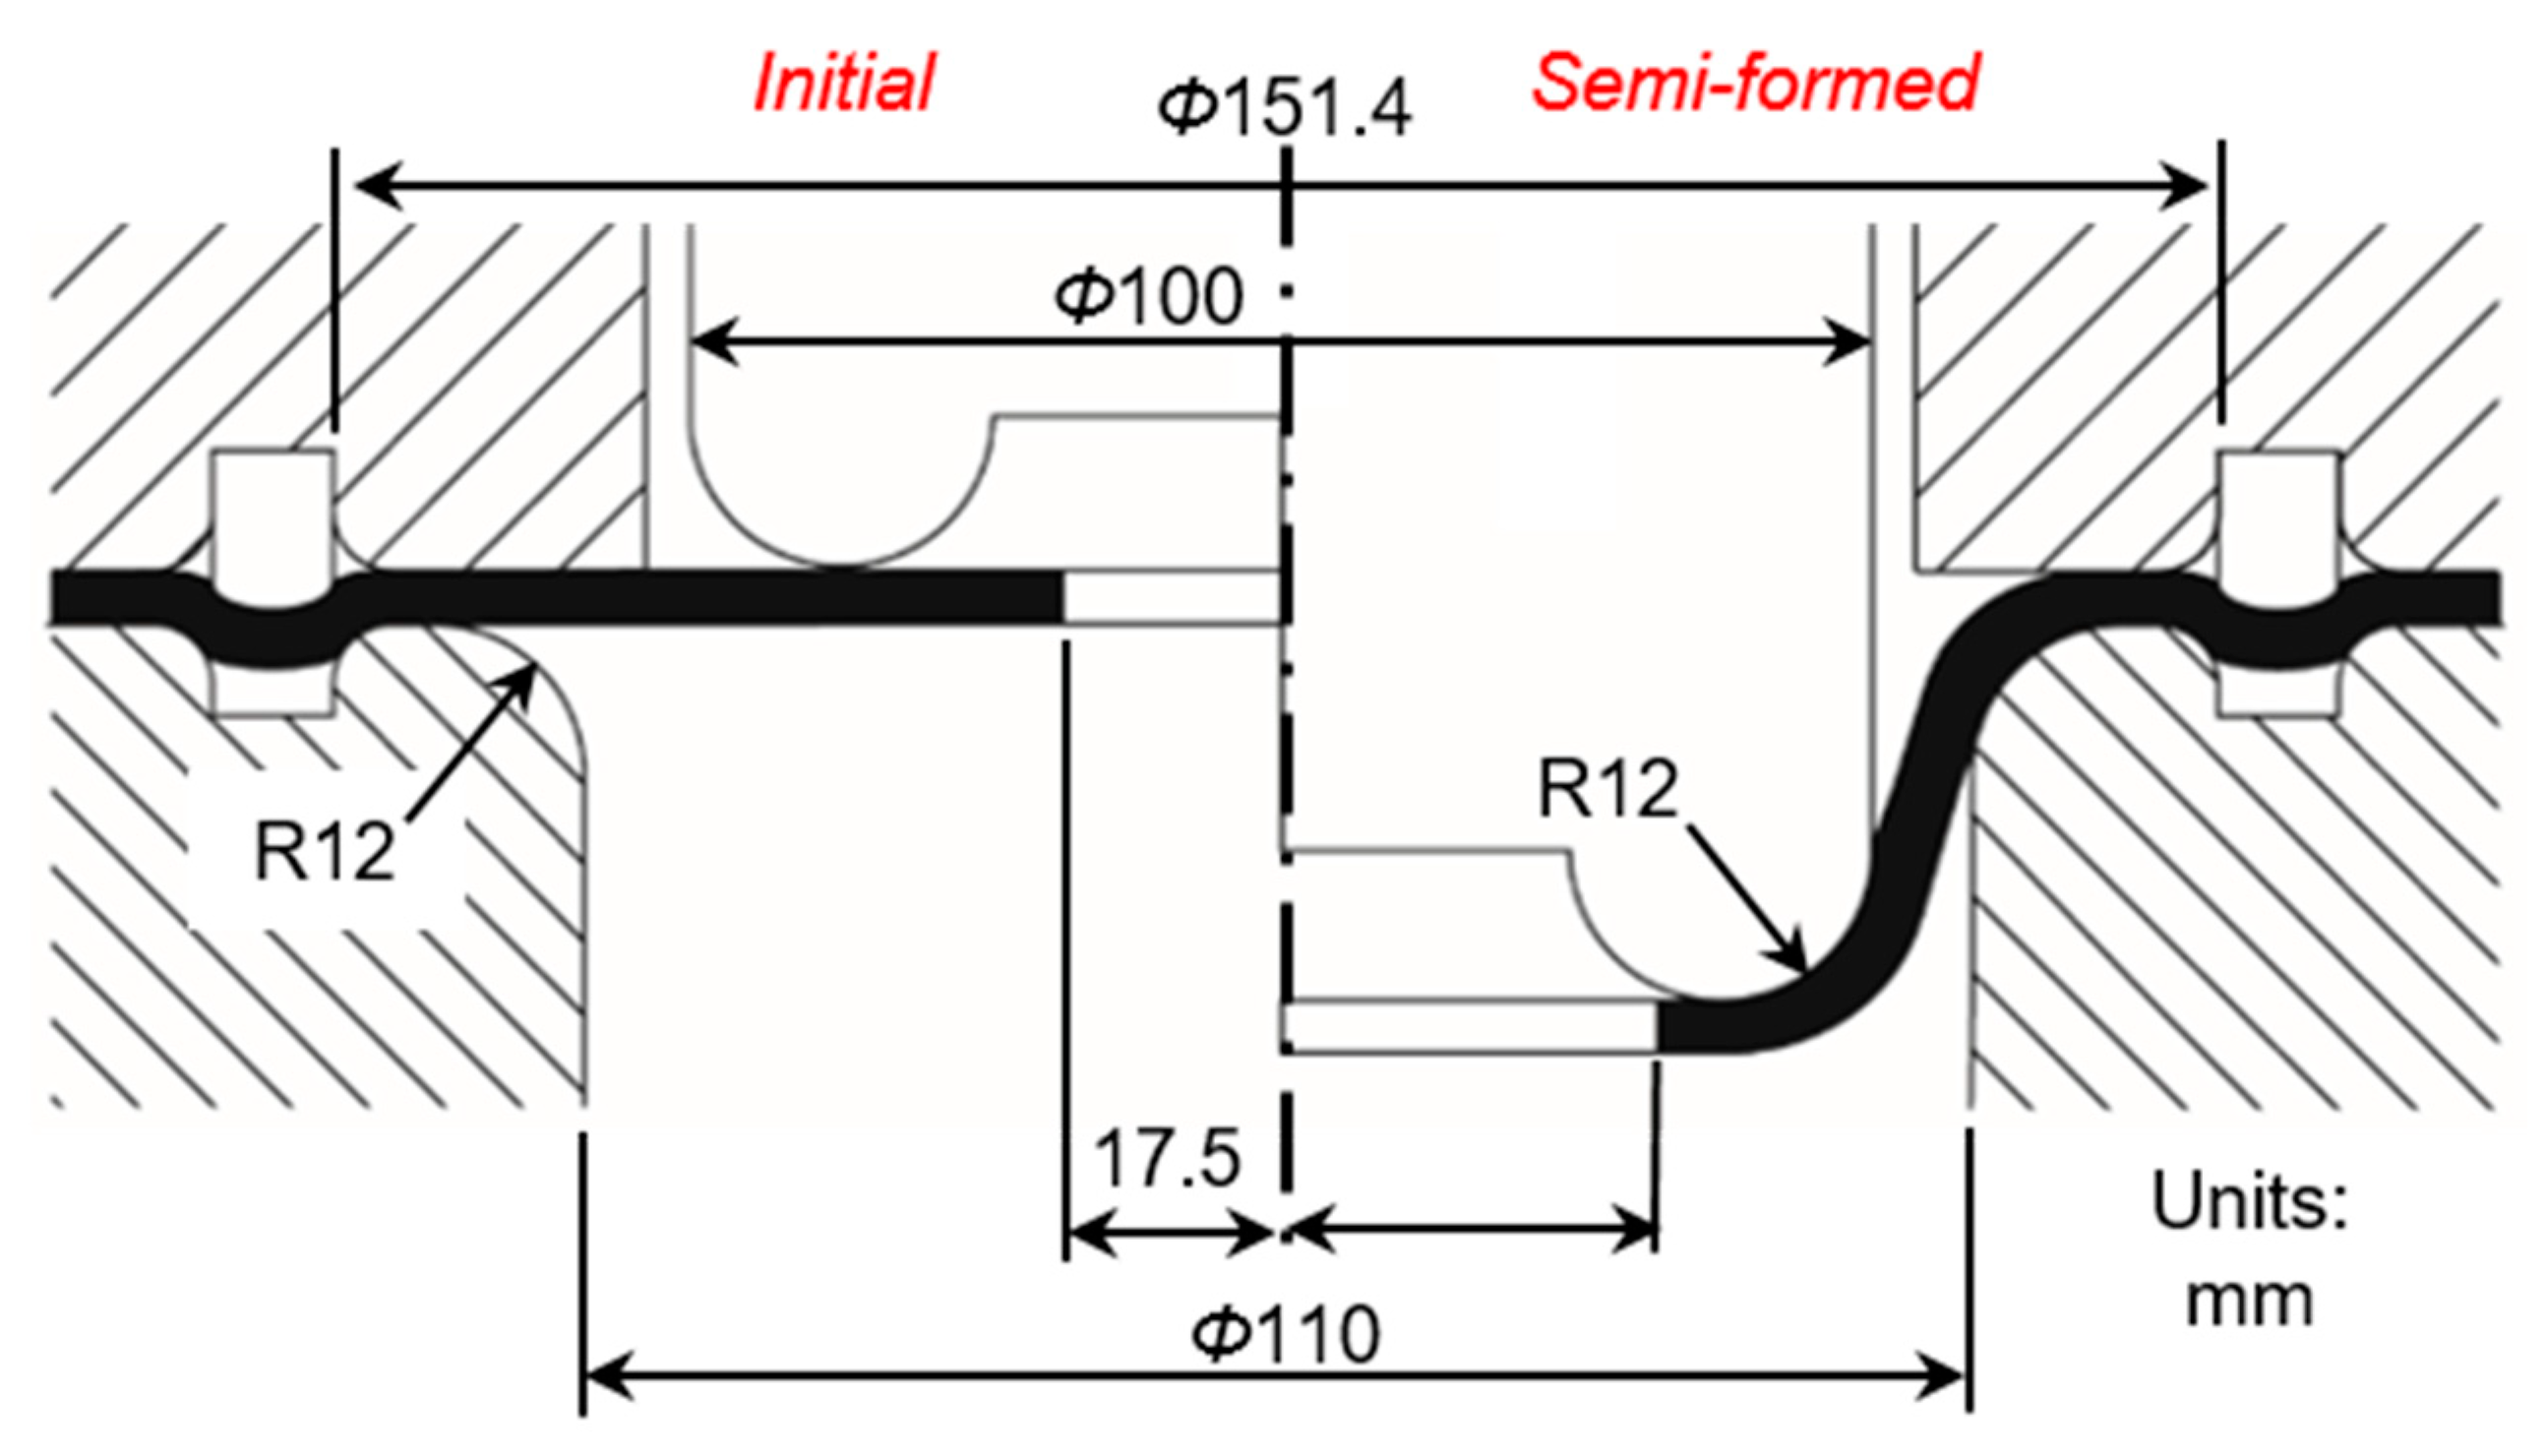
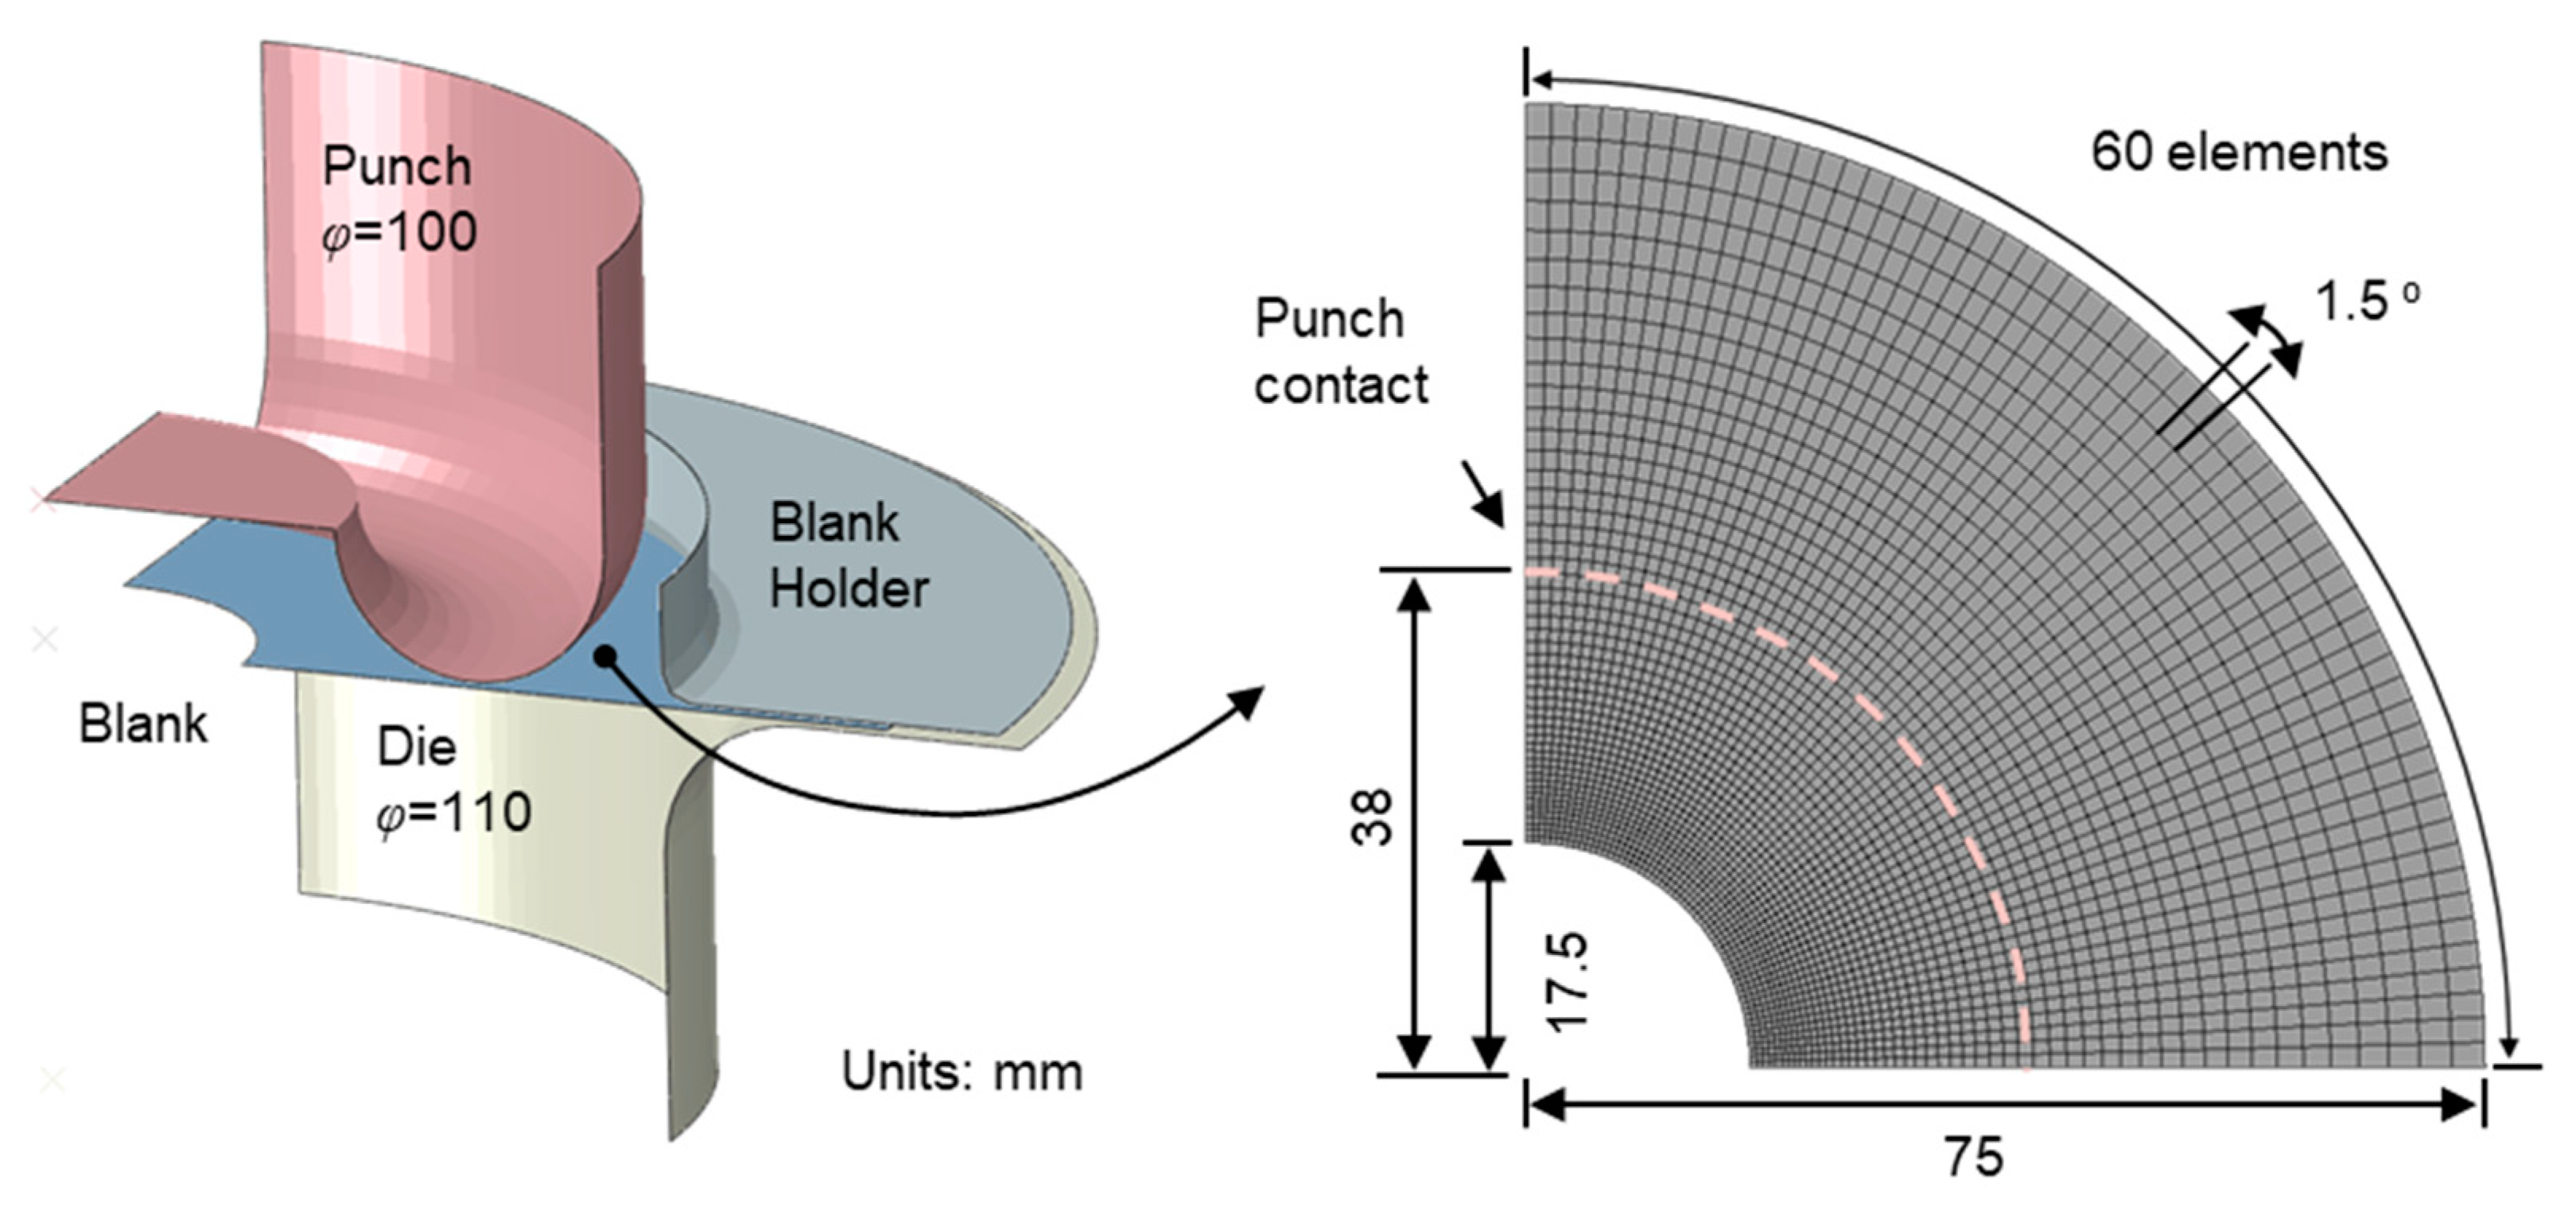
The HE experiment was performed using a specimen with a circular hole of 35 mm diameter. The hole was prepared by end-milling to a good surface finish. The experiment was performed in a fully-instrumented hydraulic press of 260 kN capacity [2]. A flat-headed punch of 100 mm diameter with a 12 mm punch nose-radius expanded the hole as it traveled. To prevent the drawing of the flange and instead promote the expansion of the hole, a lock-ring was used. The tool design is shown in Figure 4.
A stereo-type DIC, i.e., 3D-DIC, system was used to measure the surface strain field throughout the process. Using incompressibility, the in-plane principal strains were then converted to thickness strains throughout the HE experiment. In particular, the thickness strain evolution was reported at different levels of punch displacement from a hoop with a 40 mm initial diameter, i.e., 2.5 mm inland from the hole edge, to avoid problematic correlation near the hole edge.
Detailed descriptions of the experimental set-up, procedure, and findings have been reported elsewhere [2]. Here, for completeness it suffices to summarize the main findings. The punch force-displacement was almost linear, with a sudden drop indicating the occurrence of rupture. The continuous monitoring of the specimen by the stereo-type DIC throughout HE revealed that the initially circular hole progressively became out-of-round, and that the strain fields varied along the circumference, reflecting the anisotropy of the sheet. To that effect, a two-fold symmetric pattern appeared early on and progressively intensified throughout the HE experiment. In this AA6022-T4 specimen, the greatest strain development occurred at around ±45° and ±135° from the RD. The maximum circumferential strain at the onset of rupture was 0.37, which is significantly higher that the uniform elongation in uniaxial tension (~0.18). The corresponding true thickness strain was −0.28 at that location. The reason that these strains were significantly larger than those experienced in uniaxial tension, even though uniaxial tension conditions prevail at the hole edge, is that in HE each concentric “ring” of the sheet is supported by another, less strained one, further away from the hole. The strain fields also varied in the radial direction, changing from uniaxial tension (at the hole circumference) to plane-strain to equibiaxial tension (at the punch nose-radius).
3.2. Finite Element Analysis
To investigate the effect of plastic anisotropy on the HE behavior, a FE simulation was performed using an Abaqus/Standard 2019 (implicit solver). The same tooling with the experiment (Figure 4), but in a quarter size, was modeled using non-deformable, analytical rigid body elements. The blank was constructed using deformable, four-node shell elements with reduced integration (S4R), for which one element every 1.5° was assigned along the hole circumference. Nine integration points were applied through the thickness direction based on a sensitivity evaluation [18]. The tools and the meshed blank used for the FE simulation are shown in Figure 5. Surface-to-surface contact was assumed for all contacts with the blank, and the Coulomb friction law was applied with a constant coefficient = 0.22 [2]. Constitutive models for elasto-plastic material behavior were implemented into a user-defined material subroutine (UMAT) [36], i.e., Hooke’s law, Yld2000-2d anisotropic yield function, and the Voce isotropic strain hardening law.
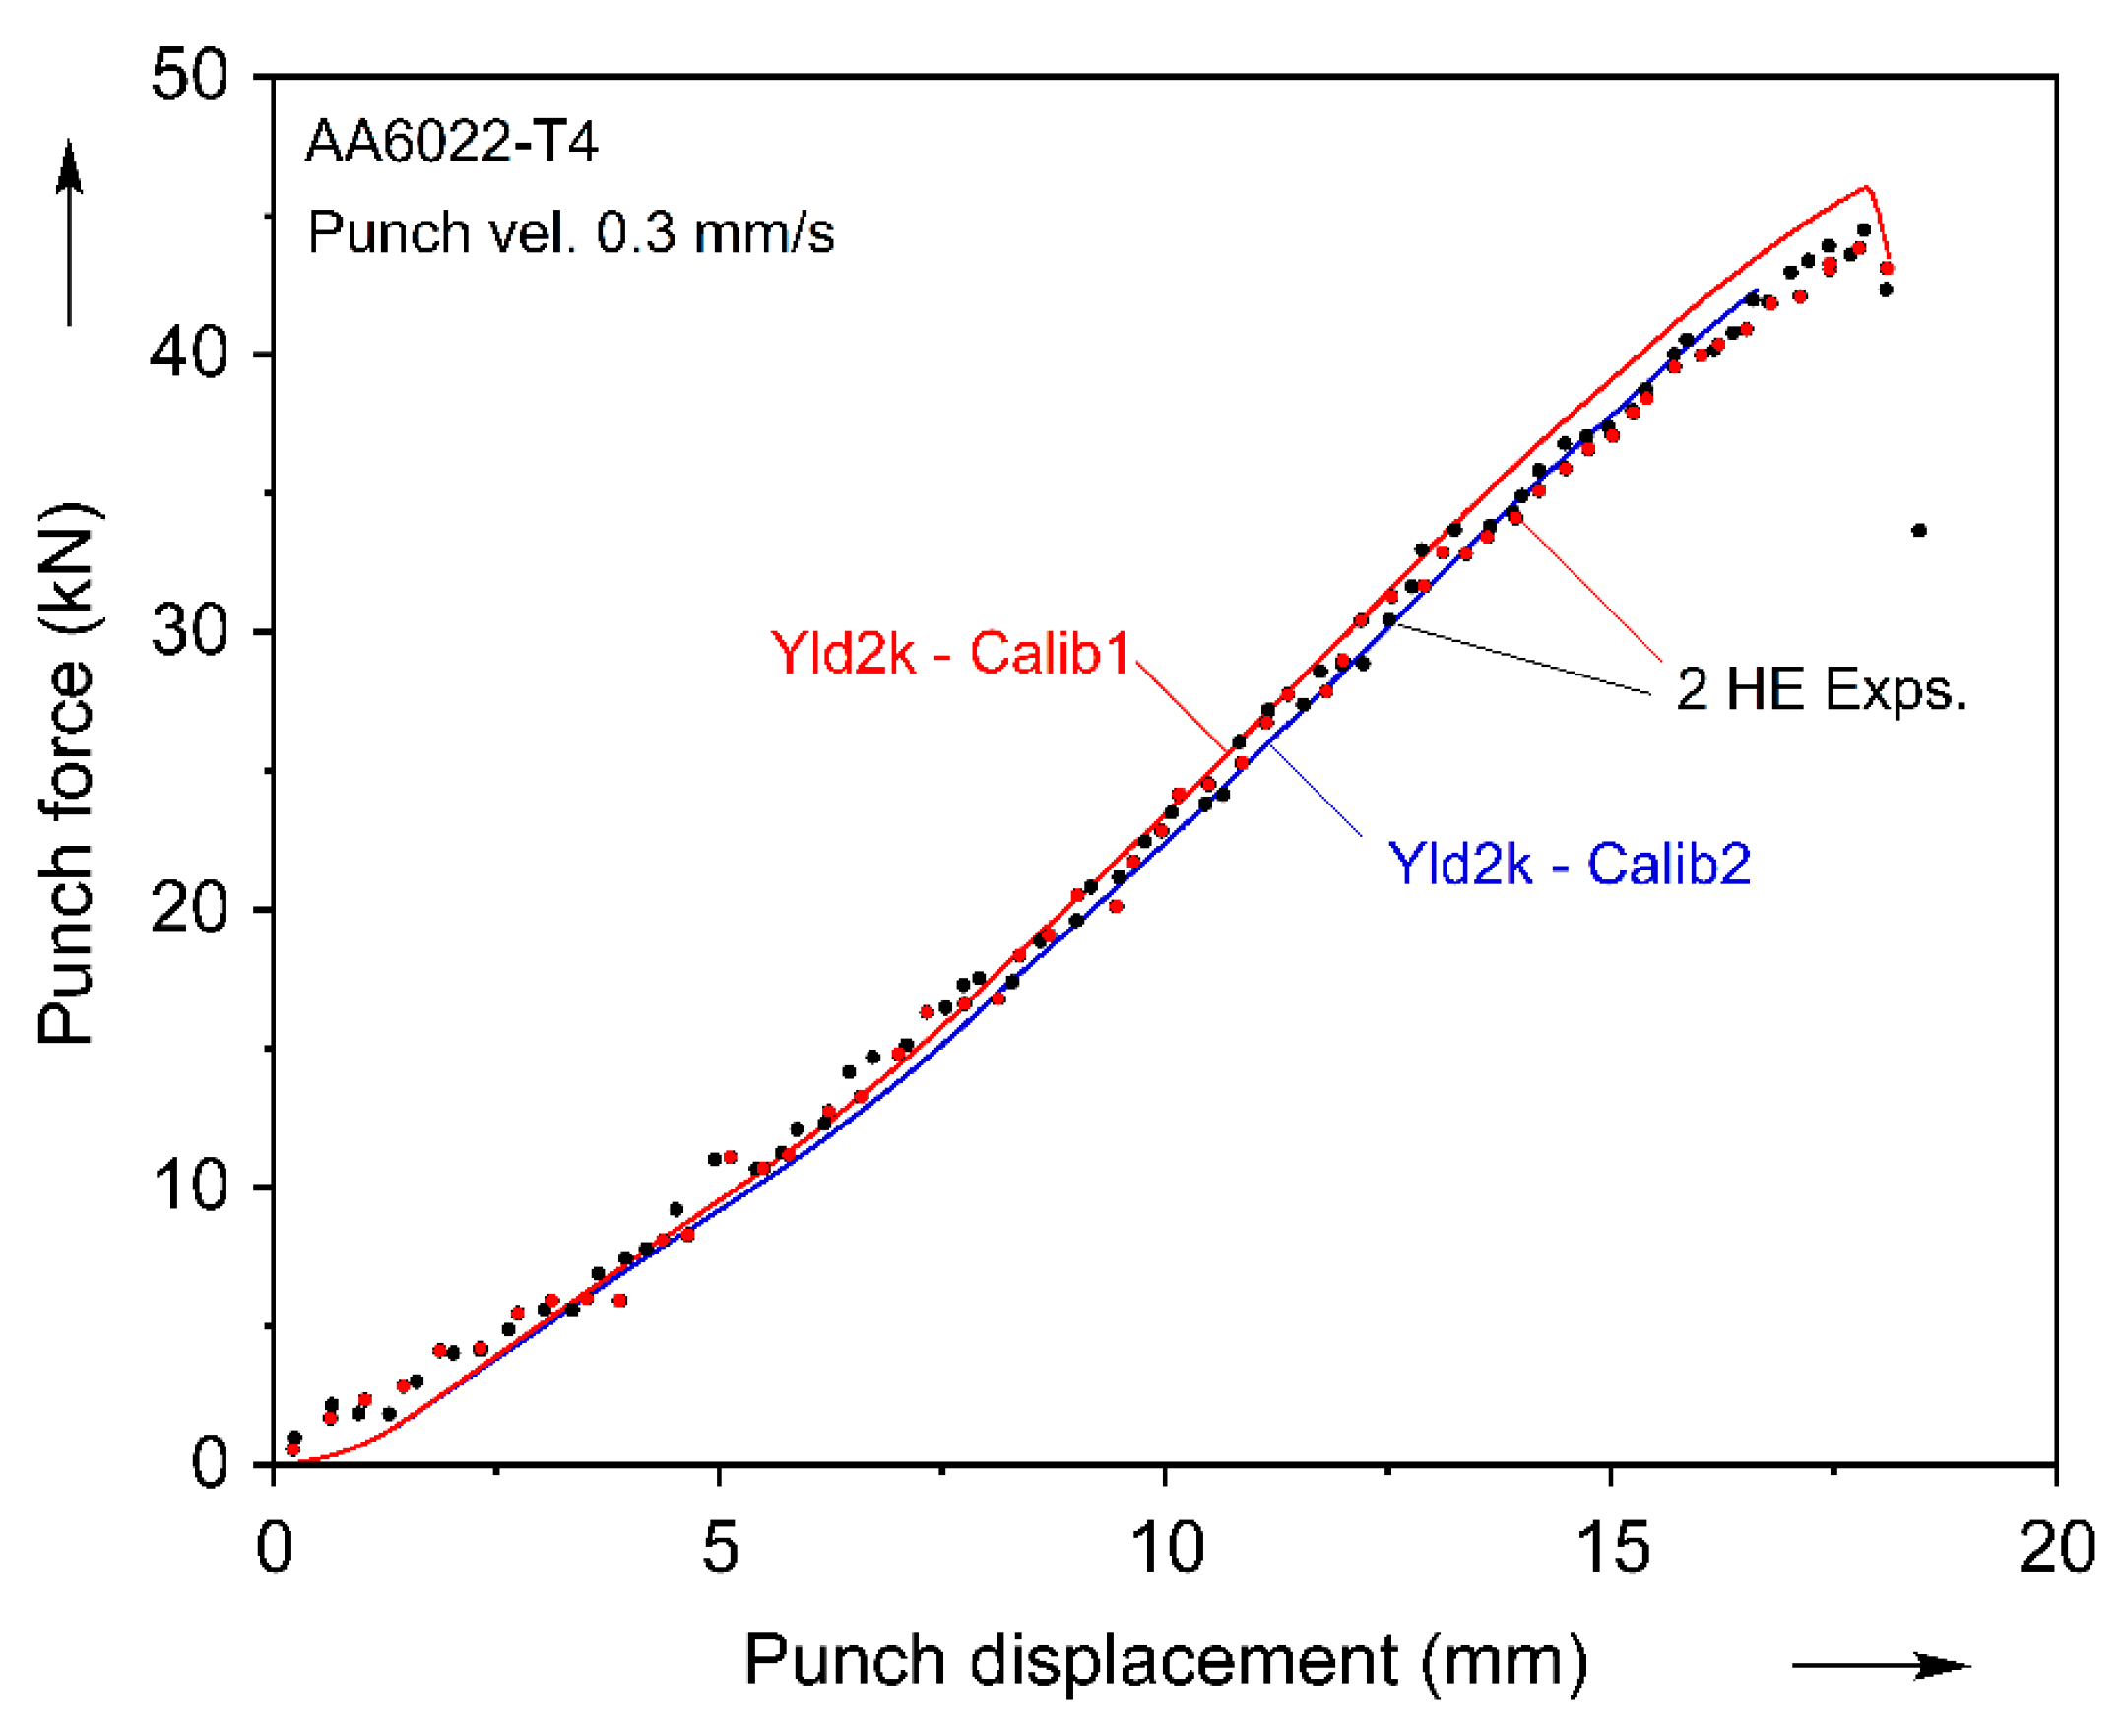
The simulation results with Calib1 and Calib2 were compared with the experiment regarding the punch force-displacement curve and the thickness strain variation around the hole. The former, force-displacement, is shown in Figure 6 with two experiments in black and red dots, with Calib1 in a blue solid line and Calib2 in a red solid line. The force level in Calib2 was slightly higher than in Calib1, but both predictions agreed reasonably well with the experimental force-displacement curve. This indicated that the plastic anisotropy did not have a significant effect on the structural behavior, such as force-displacement, in the HE simulation, and is in concert with our earlier findings in a variety of problems [2,28,37,38,39].
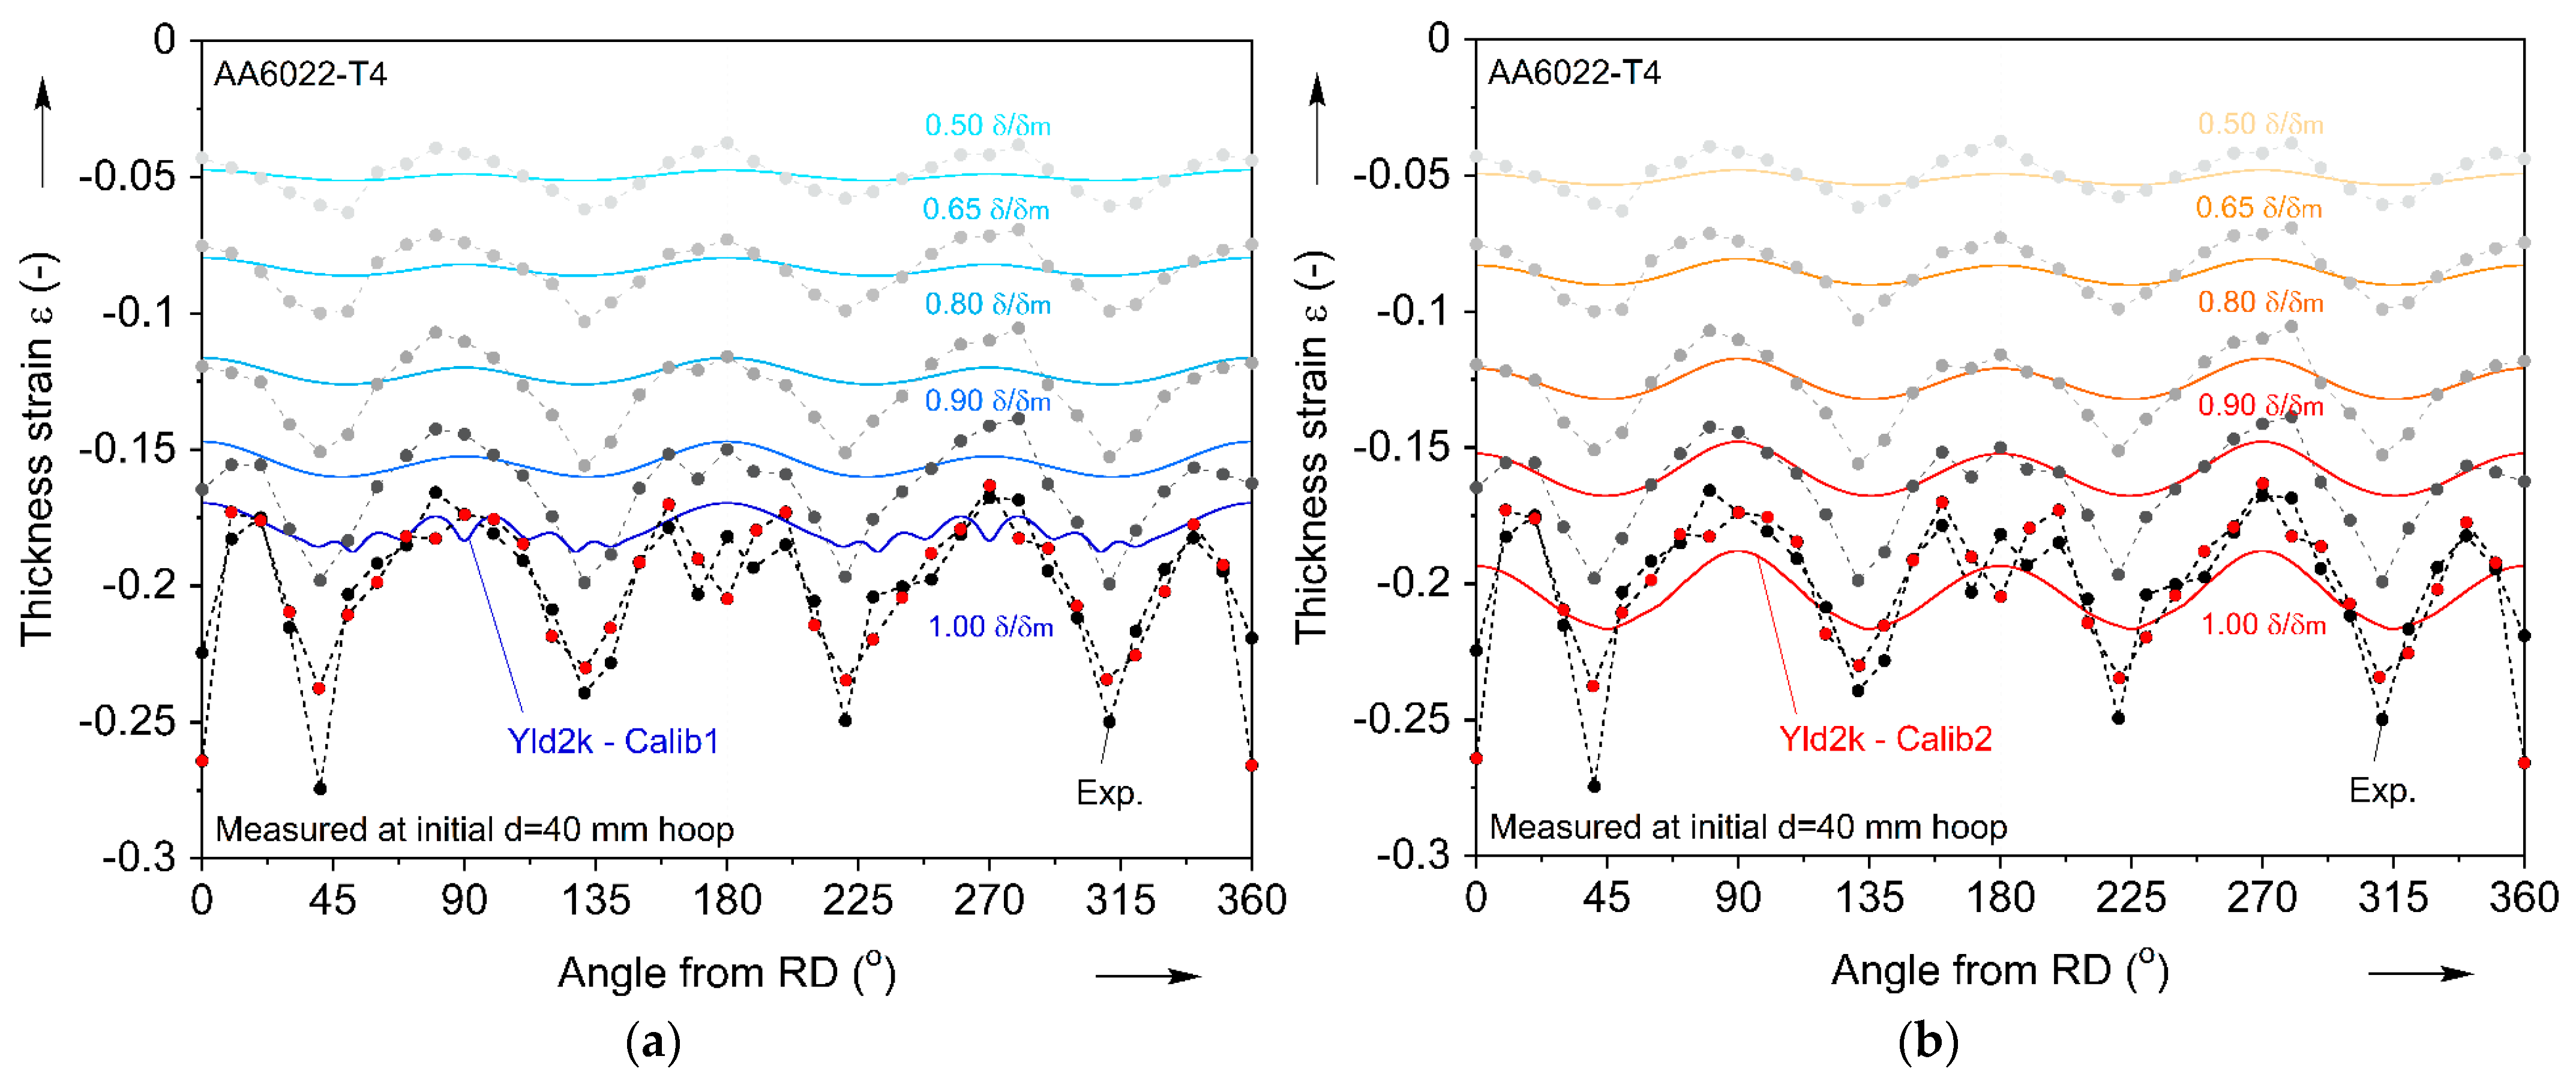
In contrast, the strain variation near the hole periphery showed a much higher sensitivity to the specifics of the description of plastic anisotropy. Figure 7a,b presents the thickness strain variation at different levels of punch displacement , i.e., = 0.5, 0.65, 0.8, 0.9, and 1, where is the punch displacement at the onset of fracture, respectively, for Calib1 and Calib2. Included are two experiments, to establish the repeatability of these results (for clarity, only the final strains are shown for the 2nd experiment). For both parameters, the thickness strain variation had the greatest thinning at 45°, which indeed lead to the first rupture in the experiment; furthermore, the average thickness strain at five punch displacement levels was reasonably predicted. Nevertheless, the local accuracy of the thickness strain prediction was significantly improved in Calib2 compared to Calib1. This evidently indicates that the plastic anisotropy near the plane-strain condition plays an important role in the prediction of the thickness strain variation in the HE simulation. This will be further discussed in the following section.
4. Discussion
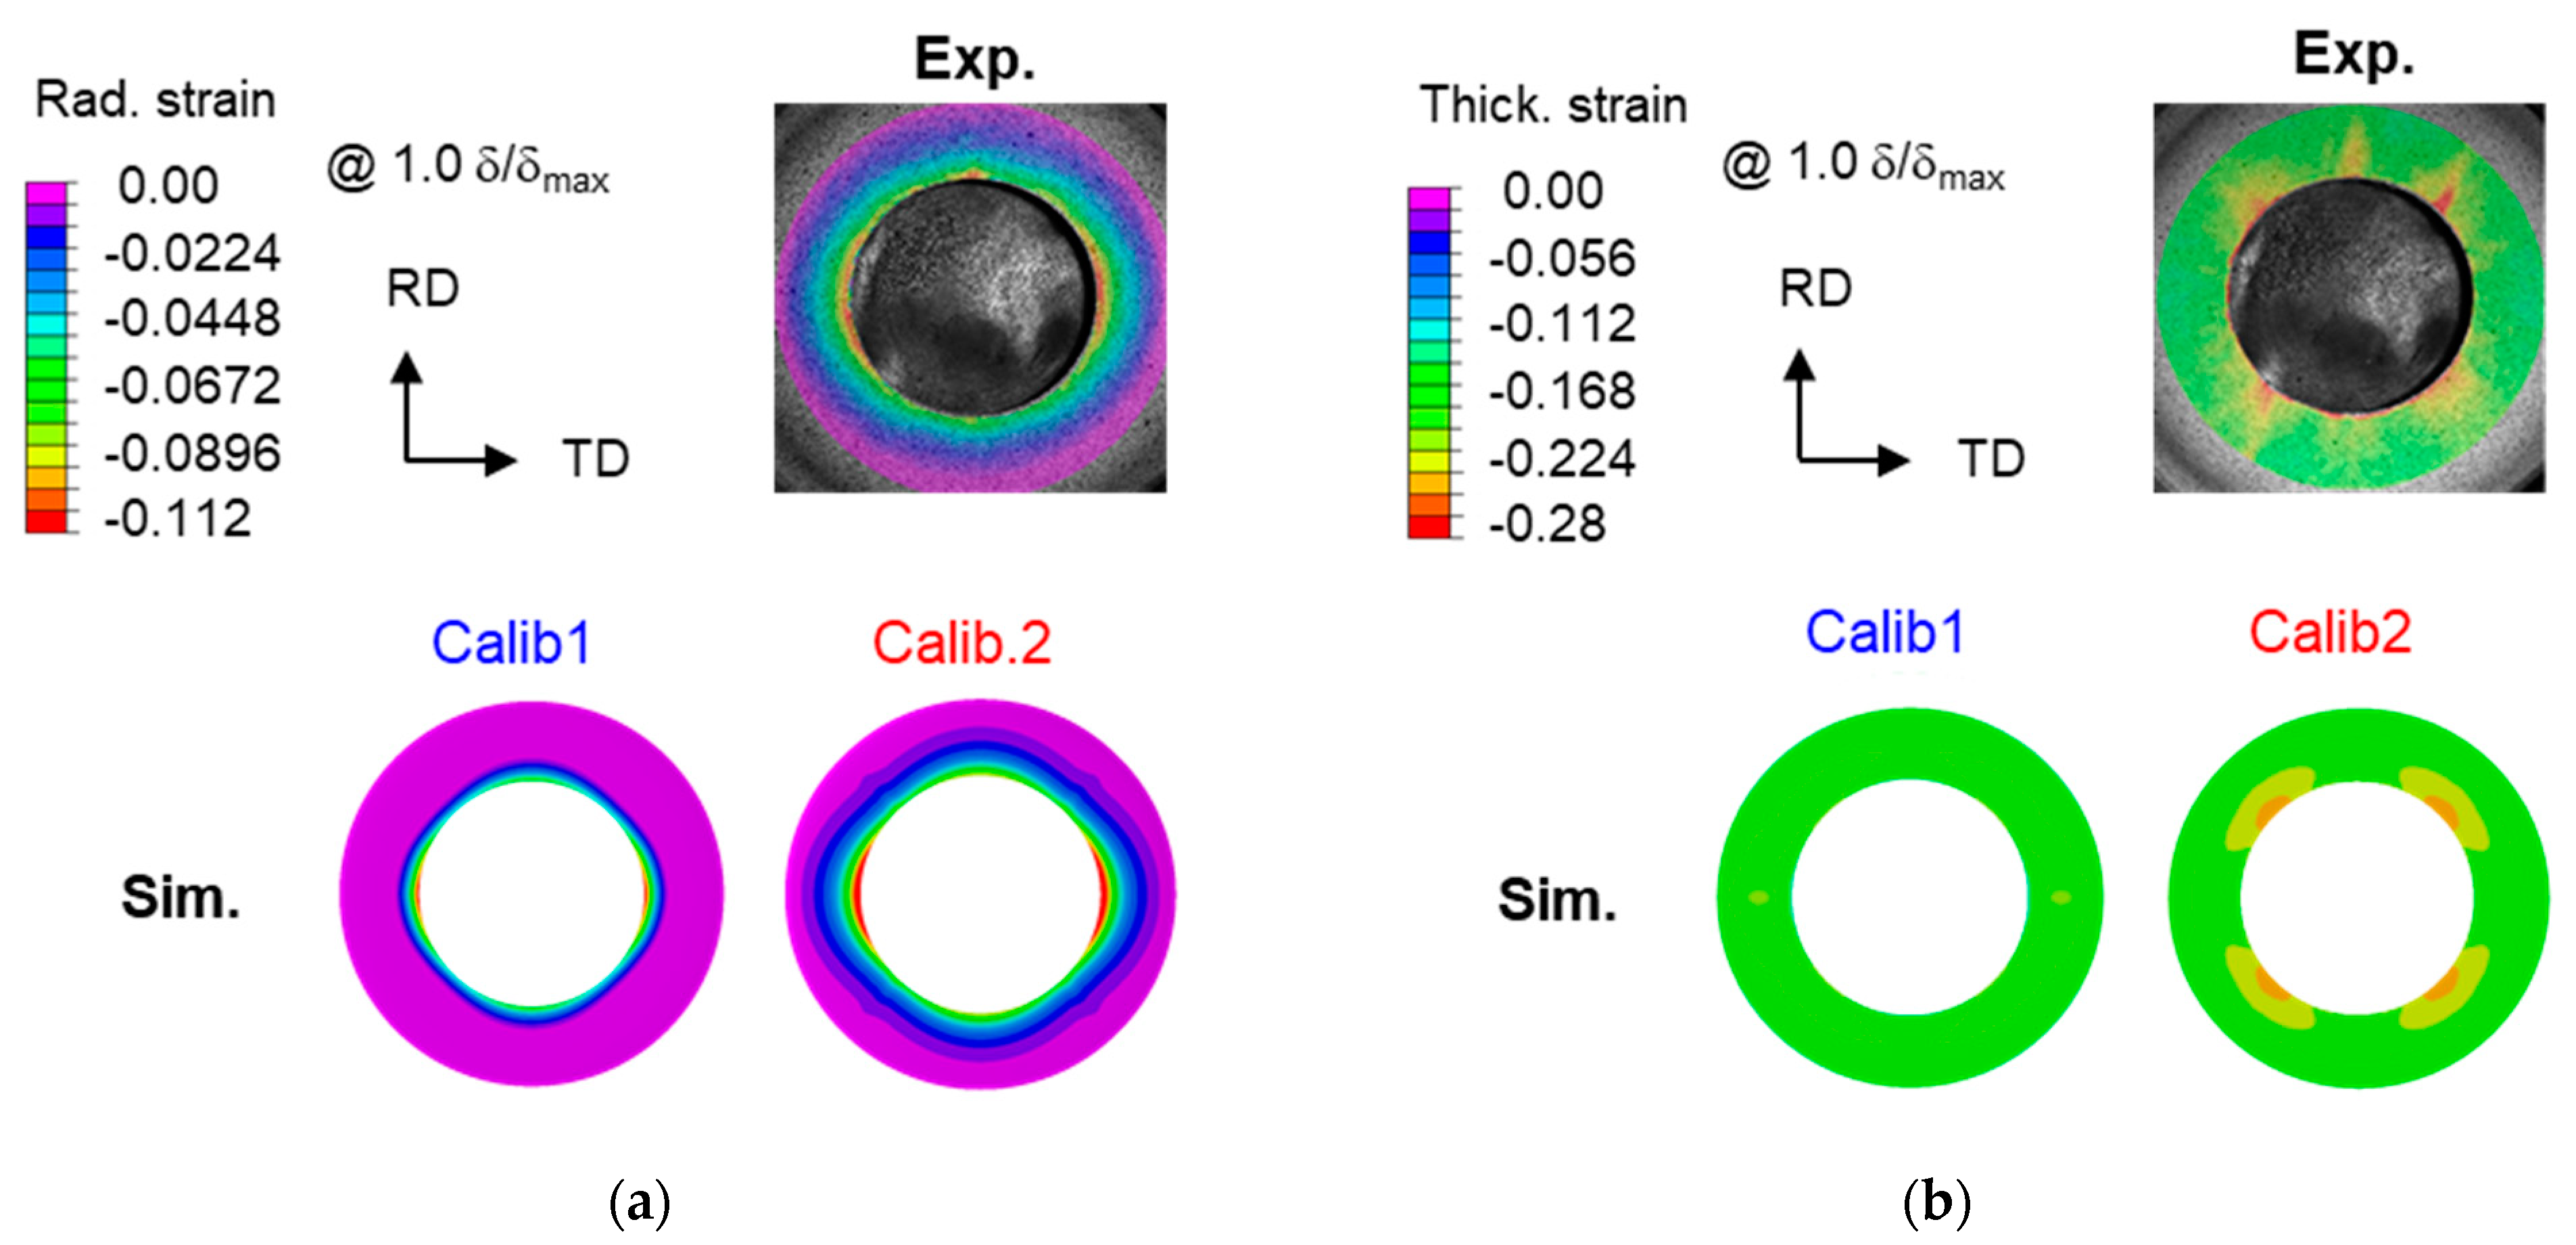
The influence of the accurate description of plastic anisotropy, especially for the plane-strain condition, in the HE simulation is assessed based on the radial (Figure 8a) and thickness (Figure 8b) strain distributions at the onset of fracture. In the radial strain distribution (Figure 8a), the contours for the plane-strain condition, identified in the figure at the boundary of the purple and blue colors, are observed to exist at different locations for Calib1 and Calib2: in Calib1, this location is much closer to the hole where the material deforms under uniaxial tension, while in Calib2 it is closer to the punch radius.
Considering the poor prediction of Calib1 (see Figure 3 and Figure 7), the proximity of the plane-strain condition to the hole indicates that it can interfere with the uniaxial tension deformation at the edge, much more than in the prediction of Calib2. In other words, an accurate description of the material behavior in biaxial stress states, especially near plane-strain, is important for the accurate prediction of the strain variation around the hole which can lead to the fracture. The thickness strain distribution (Figure 8b) can be understood in the same vein, with the thickness strain variation shown in Figure 4 at : Calib1 predicts a weak variation of the thickness strain along the circumference and, as a result, it doesn’t capture the strain concentration near 45°, while Calib2 predicts the experiment well.
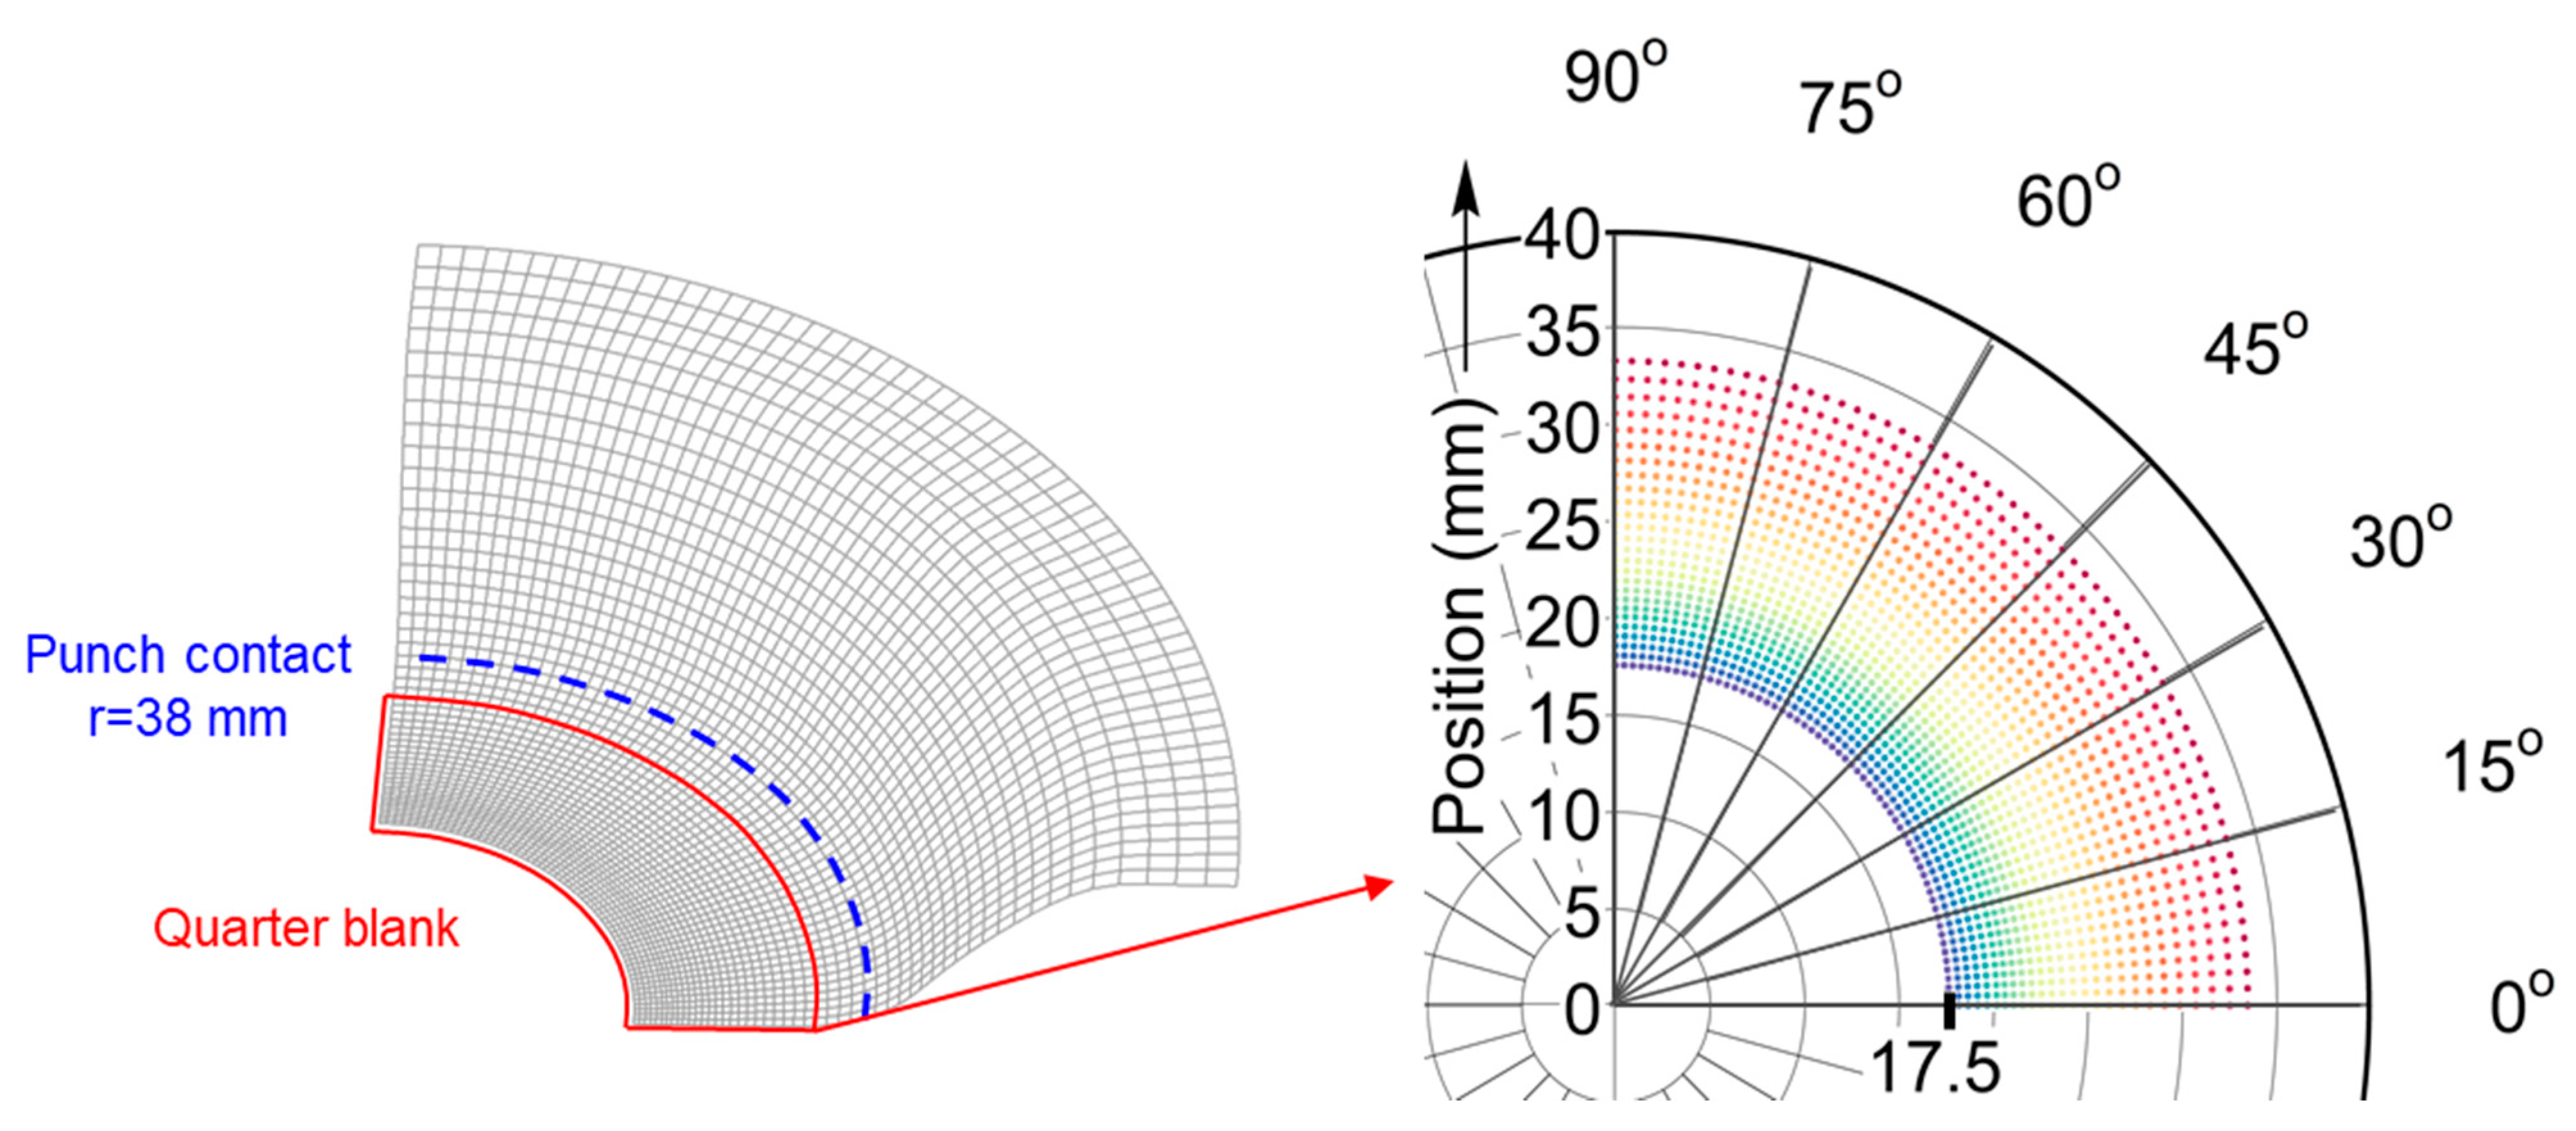
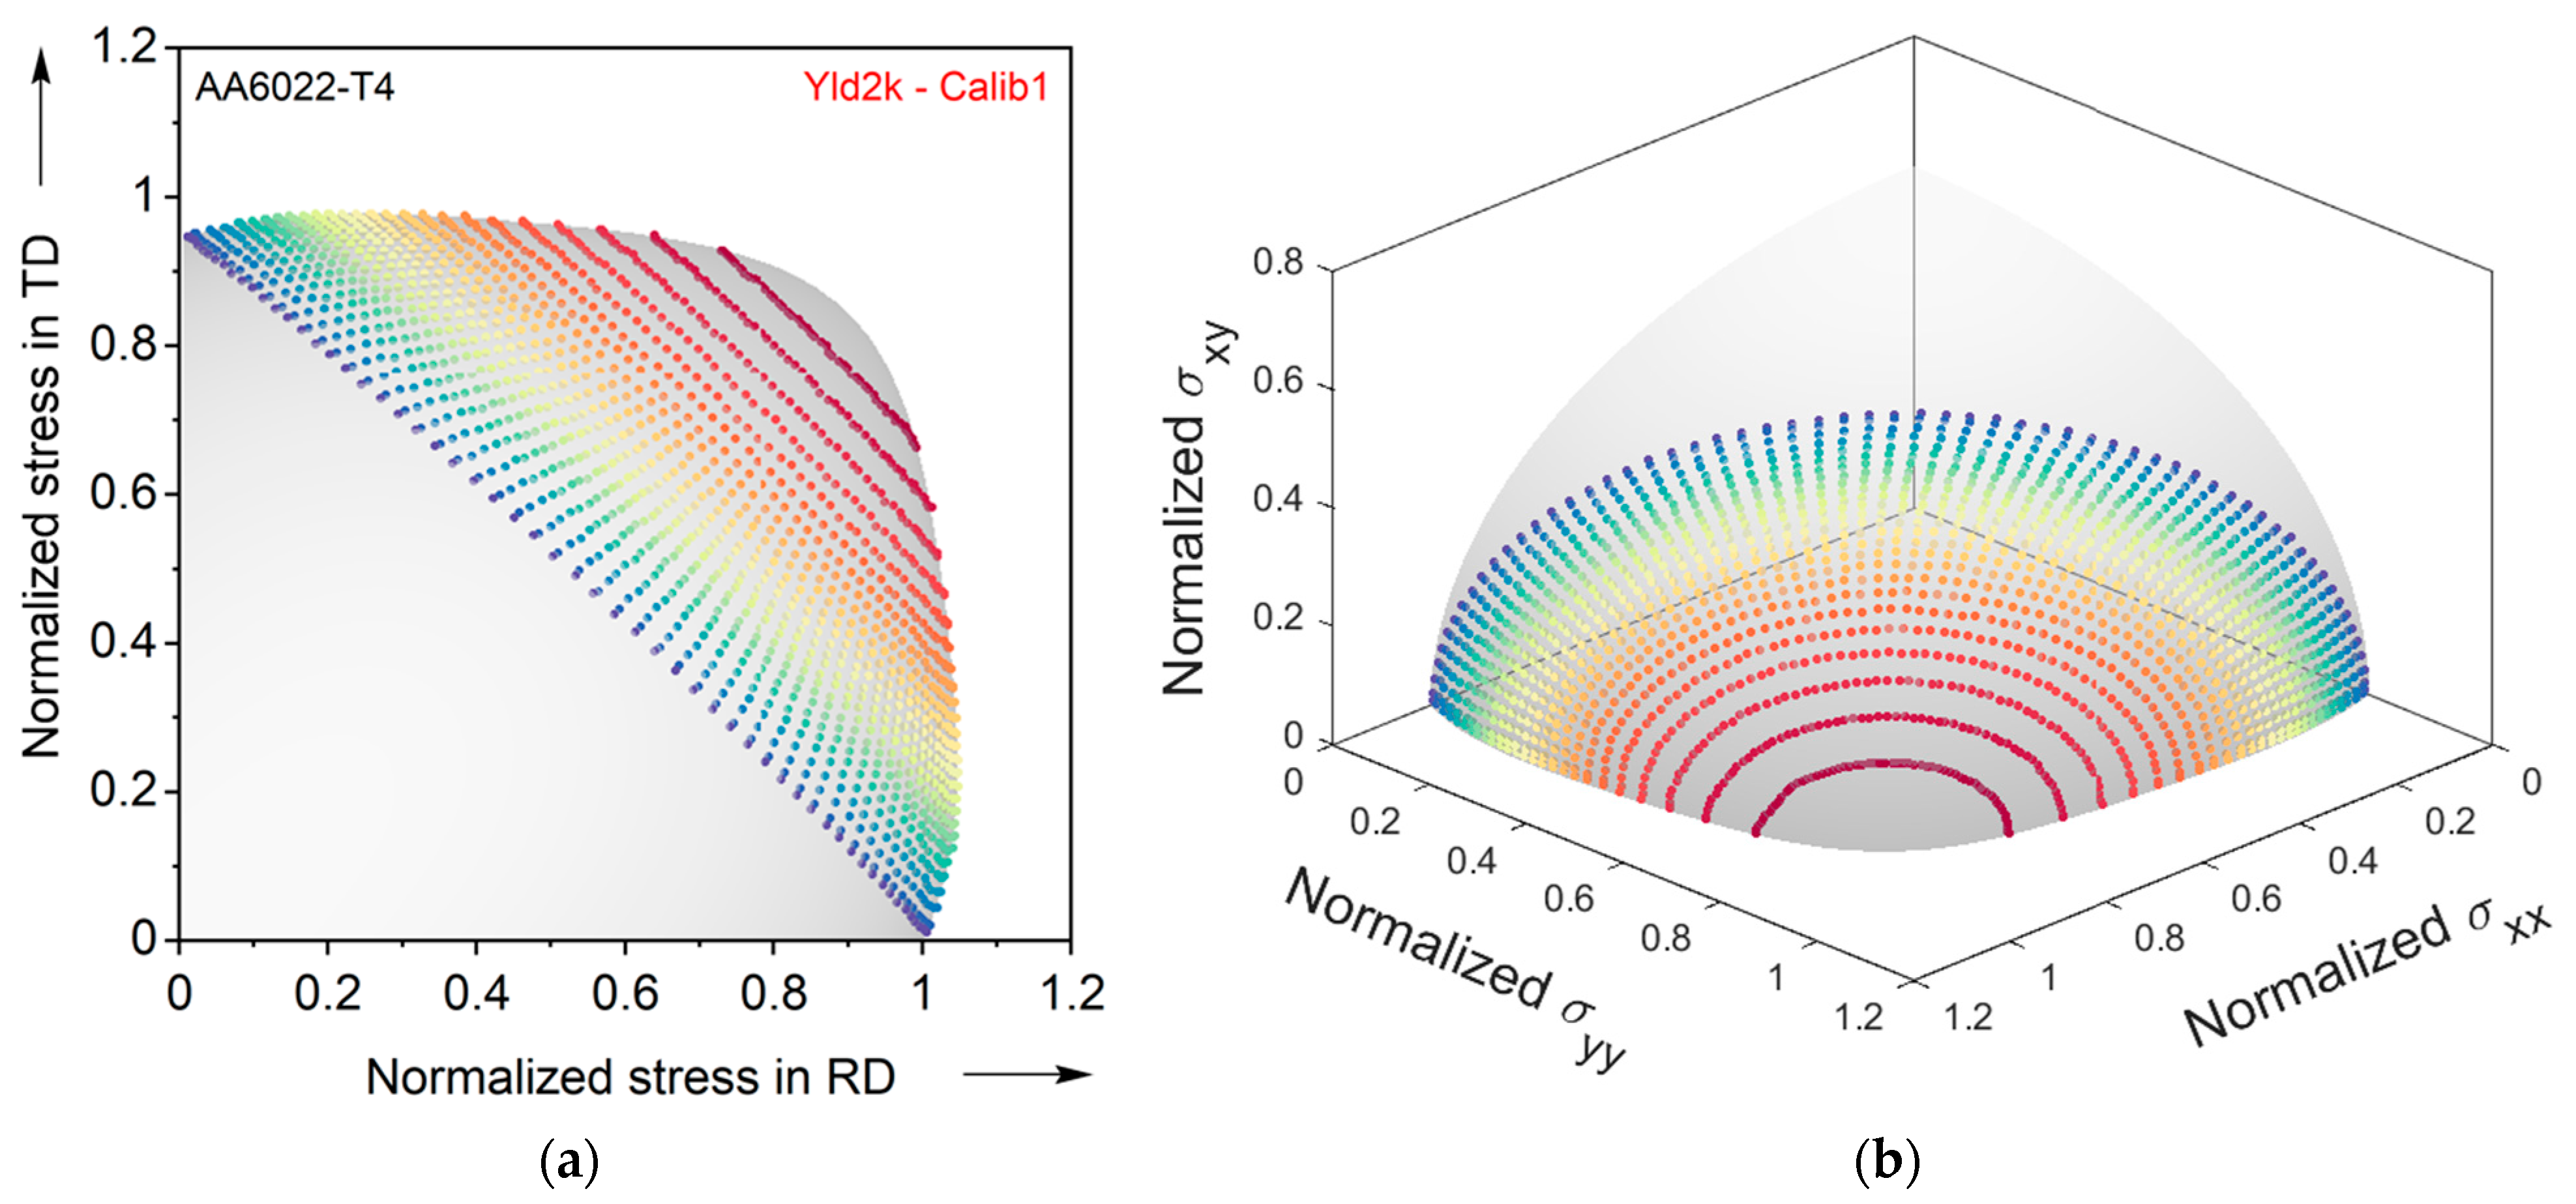
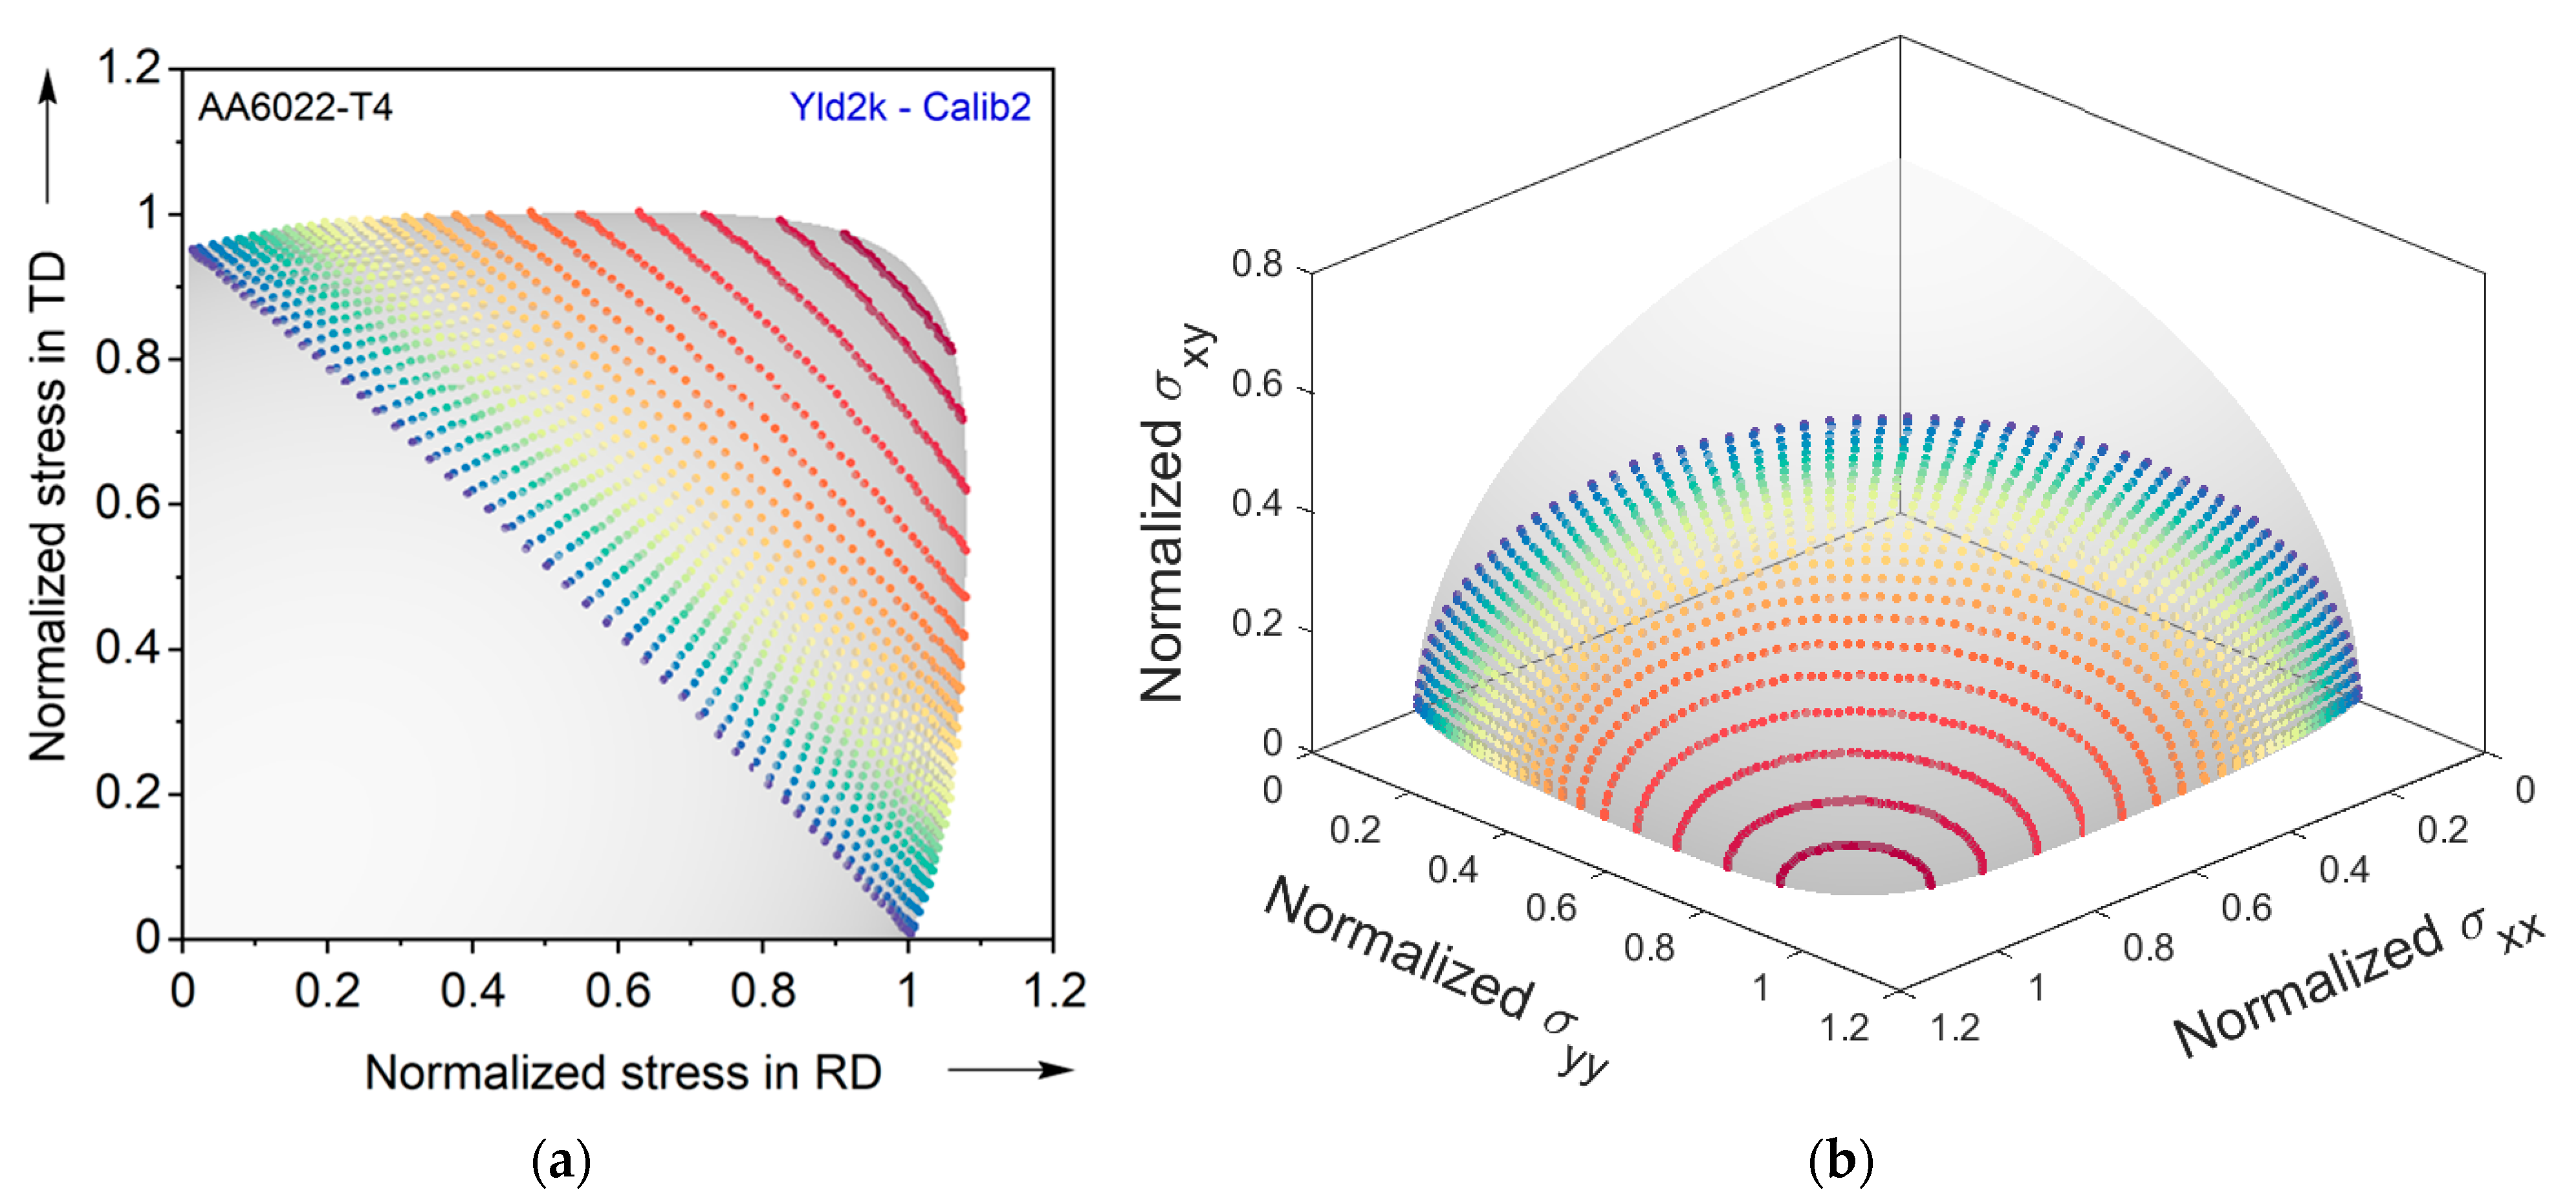
Beyond the strain state, the stress states at the onset of fracture are analyzed in the majority of the flat region of the deforming specimen. Data is extracted from 1586 nodes between the hole edge (r = 17.5 mm) and near the punch contact (r = 33.2 mm) as seen in Figure 9, in which the same color indicates the same radius from the center in the undeformed coordinate. Both Calib1 and Calib2 are plotted in the plane-stress space () and its projection on the plane where = 0 in Figure 10 and Figure 11, respectively. In both cases, the stress states gradually change from uniaxial tension in every orientation between the RD and TD to equibiaxial tension as the radial distance increases from the hole edge to near the punch radius. It should be noted that the stress states beyond uniaxial tension, e.g., simple shear, do not exist in HE, which indicates that the anisotropy in simple shear does not play a critical role in the HE simulation. In this regard, the stress states between uniaxial tension and plane-strain tension in different orientations play the most important role in the parameter calibration in HE analysis. Similar to the observation in Figure 8a, the poorly described plane-strain conditions in Calib1 result in the plane-strain condition being closely located to uniaxial tension (near the yellow dots in Figure 9), in comparison to Calib2 (near the orange dots).
In closing, it should be noted that the HE experiment includes many stress states in the 1st quadrant of the plane stress yield locus. As such, it can be used as a way to inversely identify the constitutive behavior of a given sheet. Exploring this idea is left as future work by the authors.
5. Conclusions
The role of plane-strain condition on thickness strain variation in HE is investigated through numerical simulation using two different material parameter sets of the anisotropic yield function Yld2000-2d. Both parameter sets can capture the anisotropy in uniaxial tension, which is the major stress state along the hole edge. The structural response (i.e., punch force-displacement) is also well-predicted by both sets. However, only Yld2k-Calib2, which is calibrated including the plane-strain tension condition, shows a good agreement with the experiment in the thinning predictions. The comparison emphasizes the importance of a more holistic representation of plastic anisotropy, e.g., by incorporating the plane-strain tension condition, for accurate predictions of hole-expansion simulations.
Author Contributions
J.H.: experiments; material modeling; numerical simulations; analysis of results; manuscript preparation. Y.P.K.: conceptualization; funding acquisition; analysis of results; manuscript preparation. All authors have read and agreed to the published version of the manuscript.
Funding
This work was performed under awards CMMI-1563216 and -1929873 from the U.S. National Science Foundation.
Data Availability Statement
Data is available by request from the authors.
Acknowledgments
The authors specially thank Edmund Chu, formerly of Alcoa, for providing the sheet material. Fruitful discussions with Yumi Choi and Myoung-Gyu Lee of Seoul Nat’l University (Korea), Toshihiko Kuwabara of Tokyo University of Agriculture and Technology (Japan) and Marta Oliveira of University of Coimbra (Portugal) are acknowledged with thanks.
Conflicts of Interest
The authors declare no conflict of interest.
References
- Korkolis, Y.P.; Brownell, B.; Coppieters, S.; Tian, H. Modeling of hole-expansion of AA6022-T4 aluminum sheets with anisotropic non-quadratic yield functions. J. Phys. Conf. Ser. 2016, 734, 32083. [Google Scholar] [CrossRef] [Green Version]
- Ha, J.; Coppieters, S.; Korkolis, Y.P. On the expansion of a circular hole in an orthotropic elastoplastic thin sheet. Int. J. Mech. Sci. 2020, 182, 105706. [Google Scholar] [CrossRef]
- Kuwabara, T.; Hashimoto, K.; Iizuka, E.; Yoon, J.W. Effect of anisotropic yield functions on the accuracy of hole expansion simulations. J. Mater. Process. Technol. 2011, 211, 475–481. [Google Scholar] [CrossRef]
- Taylor, G.I. The formation and enlargement of a circular hole in a thin plastic sheet. Q. J. Mech. Appl. Math. 1948, 1, 103–124. [Google Scholar] [CrossRef] [Green Version]
- Budiansky, B.; Mangasarian, O.L. Plastic Stress Concentration at a Circular Hole in an Infinite Sheet Subjected to Equal Biaxial Tension. J. Appl. Mech. 1960, 27, 59–64. [Google Scholar] [CrossRef]
- Parmar, A.; Mellor, P.B. Plastic expansion of a circular hole in sheet metal subjected to biaxial tensile stress. Int. J. Mech. Sci. 1978, 20, 707–720. [Google Scholar] [CrossRef]
- Hill, R. Theoretical plasticity of textured aggregates. In Mathematical Proceedings of the Cambridge Philosophical Society; Cambridge University Press: Cambridge, UK, 1979; Volume 85, pp. 179–191. [Google Scholar]
- Durban, D. Radial stressing of thin sheets with plastic anisotropy. Int. J. Mech. Sci. 1986, 28, 801–813. [Google Scholar] [CrossRef]
- Durban, D. On two stress concentration problems in plane-stress anisotropic plasticity. Int. J. Solids Struct. 1987, 23, 469–484. [Google Scholar] [CrossRef]
- Durban, D.; Birman, V. On the elasto-plastic stress concentration at a circular hole in an anisotropic sheet. Int. J. Mech. Sci. 1982, 23, 469–484. [Google Scholar] [CrossRef]
- Hosford, W.F. A Generalized Isotropic Yield Criterion. J. Appl. Mech. 1972, 39, 607–609. [Google Scholar] [CrossRef]
- Karafillis, A.P.; Boyce, M.C. A general anisotropic yield criterion using bounds and a transformation weighting tensor. J. Mech. Phys. Solids 1993, 41, 1859–1886. [Google Scholar] [CrossRef]
- Cohen, T.; Masri, R.; Durban, D. Analysis of circular hole expansion with generalized yield criteria. Int. J. Solids Struct. 2009, 46, 3643–3650. [Google Scholar] [CrossRef] [Green Version]
- Hill, R. A Theory of the Yielding and Plastic Flow of Anisotropic Metals. Proc. R. Soc. Lond. A Math. Phys. Eng. Sci. 1948, 193, 281–297. [Google Scholar]
- Barlat, F.; Lian, K. Plastic behavior and stretchability of sheet metals. Part I: A yield function for orthotropic sheets under plane stress conditions. Int. J. Plast. 1989, 5, 51–66. [Google Scholar] [CrossRef]
- Barlat, F.; Brem, J.C.; Yoon, J.W.; Chung, K.; Dick, R.E.; Lege, D.J.; Pourboghrat, F.; Choi, S.-H.; Chu, E. Plane stress yield function for aluminum alloy sheets—Part 1: Theory. Int. J. Plast. 2003, 19, 1297–1319. [Google Scholar] [CrossRef]
- Ha, J.; Dirian, M.; Dunn, C.; Korkolis, Y.P. Failure of AA6022-T4 sheets in hole-expansion after uniaxial prestrain. In AIP Conference Proceedings; AIP Publishing LLC: College Park, MD, USA, 2019; Volume 2113, p. 180005. [Google Scholar]
- Lee, J.-Y.; Lee, K.-J.; Lee, M.-G.; Kuwabara, T.; Barlat, F. Numerical modeling for accurate prediction of strain localization in hole expansion of a steel sheet. Int. J. Solids Struct. 2019, 156–157, 107–118. [Google Scholar] [CrossRef]
- Worswick, M.J.; Finn, M.J. The numerical simulation of stretch flange forming. Int. J. Plast. 2000, 16, 701–720. [Google Scholar] [CrossRef]
- Chung, K.; Ma, N.; Park, T.; Kim, D.; Yoo, D.; Kim, C. A modified damage model for advanced high strength steel sheets. Int. J. Plast. 2011, 27, 1485–1511. [Google Scholar] [CrossRef]
- Kuwabara, T.; Mori, T.; Asano, M.; Hakoyama, T. Material modeling of 6016-O and 6016-T4 aluminum alloy sheets and application to hole expansion forming simulation. Int. J. Plast. 2017, 93, 164–186. [Google Scholar] [CrossRef]
- Hakoyama, T.; Coppieters, S.; Kuwabara, T. Hole expansion forming analysis of mild steel sheet using a material model based on crystal plasticity. In AIP Conference Proceedings; AIP Publishing LLC: College Park, MD, USA, 2019; Volume 2113, p. 160005. [Google Scholar] [CrossRef]
- Kuwabara, T.; Ichikawa, K. Hole expansion simulation considering the differential hardening of a sheet metal. Rom. J. Tech. Sci. Appl. Mech. 2015, 60, 63–81. [Google Scholar]
- Oliveira, M.C.; Neto, D.M.; Alves, J.L.; Menezes, L.F. Study on the influence of the yield surface shape in the hole expansion test. IOP Conf. Ser. Mater. Sci. Eng. 2020, 967, 012085. [Google Scholar] [CrossRef]
- Logan, R.W.; Hosford, W.F. Upper-bound anisotropic yield locus calculations assuming <111>-pencil glide. Int. J. Mech. Sci. 1980, 22, 419–430. [Google Scholar] [CrossRef] [Green Version]
- Ha, J.; Baral, M.; Korkolis, Y.P. Plastic anisotropy and ductile fracture of bake-hardened AA6013 aluminum sheet. Int. J. Solids Struct. 2018, 155, 123–139. [Google Scholar] [CrossRef]
- Ha, J.; Baral, M.; Korkolis, Y.P. Ductile fracture of an aluminum sheet under proportional loading. J. Mech. Phys. Solids 2019, 132, 103685. [Google Scholar] [CrossRef]
- Tian, H.; Brownell, B.; Baral, M.; Korkolis, Y.P. Earing in cup-drawing of anisotropic Al-6022-T4 sheets. Int. J. Mater. Form. 2017, 10, 329–343. [Google Scholar] [CrossRef]
- Baral, M.; Ha, J.; Korkolis, Y.P. Plasticity and ductile fracture modeling of an Al–Si–Mg die-cast alloy. Int. J. Fract. 2019, 216, 101–121. [Google Scholar] [CrossRef]
- Baral, M.; Hama, T.; Knudsen, E.; Korkolis, Y.P. Plastic deformation of commercially-pure titanium: Experiments and modeling. Int. J. Plast. 2018, 105, 164–194. [Google Scholar] [CrossRef]
- Dick, C.P.; Korkolis, Y.P. Anisotropy of thin-walled tubes by a new method of combined tension and shear loading. Int. J. Plast. 2015, 71, 87–112. [Google Scholar] [CrossRef] [Green Version]
- Coppieters, S.; Kuwabara, T. Identification of Post-Necking Hardening Phenomena in Ductile Sheet Metal. Exp. Mech. 2014, 54, 1355–1371. [Google Scholar] [CrossRef] [Green Version]
- Coppieters, S.; Cooreman, S.; Sol, H.; Van Houtte, P.; Debruyne, D. Identification of the post-necking hardening behaviour of sheet metal by comparison of the internal and external work in the necking zone. J. Mater. Process. Technol. 2011, 211, 545–552. [Google Scholar] [CrossRef]
- Korkolis, Y.P.; Barlat, F.; Kuwabara, T. Simplified representations of multiaxial test results in plasticity. In Proceedings of the 5th International Conference on Material Modeling (ICMM5), Rome, Italy, 14–16 June 2017. [Google Scholar]
- Ha, J.; Baral, M.; Korkolis, Y. Ductile fracture of an Al-Si-Mg die-casting aluminum alloy. Procedia Eng. 2017, 207, 2024–2029. [Google Scholar] [CrossRef]
- 3DS Simulia. Abaqus User Manual; Dassault Systèmes Simulia Corp.: Providence, RI, USA, 2019. [Google Scholar]
- Giagmouris, T.; Kyriakides, S.; Korkolis, Y.P.; Lee, L.-H. On the localization and failure in aluminum shells due to crushing induced bending and tension. Int. J. Solids Struct. 2010, 47, 2680–2692. [Google Scholar] [CrossRef] [Green Version]
- Korkolis, Y.P.; Kyriakides, S. Hydroforming of anisotropic aluminum tubes: Part I experiments. Int. J. Mech. Sci. 2011, 53, 75–82. [Google Scholar] [CrossRef]
- Korkolis, Y.P.; Kyriakides, S. Hydroforming of anisotropic aluminum tubes: Part II analysis. Int. J. Mech. Sci. 2011, 53, 83–90. [Google Scholar] [CrossRef]
Figure 1.
Comparison of the experiment and the predictions of Calib1 and Calib2 for the normalized flow stresses and r-values in uniaxial tension.
Figure 1.
Comparison of the experiment and the predictions of Calib1 and Calib2 for the normalized flow stresses and r-values in uniaxial tension.

Figure 2.
Yield loci predicted by Yld2000-2d using Calib1 and Calib2 parameters, and by von Mises. Marked are the plane-strain locations in the rolling direction (RD), 45°, and transverse direction (TD). For Calib1, these conditions are predicted by the model while for Calib2 they are experimentally characterized. Note that the 45° data are projections onto the zero shear stress plane.

Figure 3.
Assessment of plastic anisotropy prediction for (a) normalized flow stress and (b) normals to the yield locus.
Figure 3.
Assessment of plastic anisotropy prediction for (a) normalized flow stress and (b) normals to the yield locus.

Figure 4.
Tool geometry for the hole-expansion experiment.

Figure 5.
Finite element model of one quarter of the problem and the blank mesh for the hole-expansion simulation.
Figure 5.
Finite element model of one quarter of the problem and the blank mesh for the hole-expansion simulation.

Figure 6.
Comparison of the experimental and predicted punch force-displacement curves. Two experiments are shown, and the experimental data is decimated for clarity.
Figure 6.
Comparison of the experimental and predicted punch force-displacement curves. Two experiments are shown, and the experimental data is decimated for clarity.

Figure 7.
Evolution of thickness strain variation during the hole-expansion experiment. Included are the predictions from (a) Calib1 and (b) Calib2 with blue and red solid lines, as well as two experiments with solid dots (for one experiment, only the final strains are shown).
Figure 7.
Evolution of thickness strain variation during the hole-expansion experiment. Included are the predictions from (a) Calib1 and (b) Calib2 with blue and red solid lines, as well as two experiments with solid dots (for one experiment, only the final strains are shown).

Figure 8.
Strain distribution at the onset of fracture along the (a) radial and (b) thickness direction. In (a), note that marked in purple is the entire positive strain range (ε > 0), as well as zero strain, i.e., plane-strain (ε = 0). The color bars are identical for both experiments and simulations.

Figure 9.
Color-coded identification of the output points of the mesh of the blank for the analysis of stress states in hole-expansion.
Figure 9.
Color-coded identification of the output points of the mesh of the blank for the analysis of stress states in hole-expansion.

Figure 10.
Predicted stress states for Calib1. (a) First quadrant of the plane-stress yield locus in the plane with = 0, and (b) fully-3D view. The colors correspond to the locations identified in Figure 9.
Figure 10.
Predicted stress states for Calib1. (a) First quadrant of the plane-stress yield locus in the plane with = 0, and (b) fully-3D view. The colors correspond to the locations identified in Figure 9.

Figure 11.
Predicted stress states for Calib2. (a) First quadrant of the plane-stress yield locus in the plane with = 0, and (b) fully-3D view. The colors correspond to the locations identified in Figure 9.
Figure 11.
Predicted stress states for Calib2. (a) First quadrant of the plane-stress yield locus in the plane with = 0, and (b) fully-3D view. The colors correspond to the locations identified in Figure 9.


Table 1.
Summary of mechanical properties [2].
Table 1.
Summary of mechanical properties [2].
| Elastic Properties | |||||||
|---|---|---|---|---|---|---|---|
| Young’s Modulus | E = 70 GPa | Poisson’s Ratio | ν = 0.3 | ||||
| Anisotropic Plastic Properties (Wp = 20 MJ/m3) | |||||||
| Uniaxial tension | RD | 30° | 60° | 90° | |||
| 1.000 | 1.016 | 0.976 | 0.954 | ||||
| r-value | 0.793 | 0.465 | 0.352 | 0.510 | |||
| Plane-strain tension | RD | 45° | 90° | ||||
| 1.096 | 1.019 | 0.978 | |||||
Table 2.
Yld2000-2D parameters for Calib1 and Calib2.
| m = 8 | ||||||||
|---|---|---|---|---|---|---|---|---|
| Calib1 | 0.970 | 1.054 | 1.253 | 1.128 | 1.065 | 1.253 | 0.940 | 0.909 |
| Calib2 | 0.968 | 1.022 | 1.067 | 1.091 | 1.014 | 0.977 | 0.914 | 1.064 |
Publisher’s Note: MDPI stays neutral with regard to jurisdictional claims in published maps and institutional affiliations. |
© 2021 by the authors. Licensee MDPI, Basel, Switzerland. This article is an open access article distributed under the terms and conditions of the Creative Commons Attribution (CC BY) license (http://creativecommons.org/licenses/by/4.0/).
Share and Cite
MDPI and ACS Style
Ha, J.; Korkolis, Y.P. Hole-Expansion: Sensitivity of Failure Prediction on Plastic Anisotropy Modeling. J. Manuf. Mater. Process. 2021, 5, 28. https://doi.org/10.3390/jmmp5020028
AMA Style
Ha J, Korkolis YP. Hole-Expansion: Sensitivity of Failure Prediction on Plastic Anisotropy Modeling. Journal of Manufacturing and Materials Processing. 2021; 5(2):28. https://doi.org/10.3390/jmmp5020028
Chicago/Turabian StyleHa, Jinjin, and Yannis P. Korkolis. 2021. "Hole-Expansion: Sensitivity of Failure Prediction on Plastic Anisotropy Modeling" Journal of Manufacturing and Materials Processing 5, no. 2: 28. https://doi.org/10.3390/jmmp5020028