Article

The Prognostic Model of Pre-Treatment Complete Blood Count (CBC) for Recurrence in Early Cervical Cancer

1
Division of Gynecologic Oncology, Department of Obstetrics and Gynecology, Samsung Medical Center, Sungkyunkwan University School of Medicine, 81 Irwon-Ro, Gangnam-gu, Seoul 06351, Korea
2
Division of Tumor Immunology, Center for Gynecologic Center, and Center for Clinical Trials, Research Institute and Hospital and Cancer Control and Policy, Graduate School of Cancer Science and Policy, National Cancer Center, Goyang 10408, Korea
3
Department of Obstetrics and Gynecology, Korea Cancer Center Hospital, Korea Institute of Radiological and Medical Sciences, Seoul 01812, Korea
4
Department of Obstetrics and Gynecology, University of Ulsan College of Medicine, Asan Medical Center, Seoul 05505, Korea
5
Medical Treatment Division, Gwangjin-gu Health Center, Seoul 05026, Korea
6
Department of Obstetrics & Gynecology, CHA Gangnam Medical Center, CHA University, Seoul 06135, Korea
7
Department of Obstetrics and Gynecology, Seoul National University Bundang Hospital, Seongnam 13620, Korea
8
Department of Obstetrics and Gynecology, Kyung Hee University Hospital at Gangdong, Kyung Hee University School of Medicine, Seoul 05278, Korea
9
Department of Obstetrics and Gynecology, CHA Ilsan Medical Center, CHA University, Seoul 10414, Korea
*
Author to whom correspondence should be addressed.
J. Clin. Med. 2020, 9(9), 2960; https://doi.org/10.3390/jcm9092960
Submission received: 10 August 2020 / Revised: 6 September 2020 / Accepted: 10 September 2020 / Published: 13 September 2020
(This article belongs to the Special Issue Screening and Tests for Gynecologic Cancer)

Abstract

:
The aim of the present study was to investigate the prognostic role of the pre-treatment complete blood count (CBC) profile as a predictive marker of survival, recurrence, and death in early stage squamous cell carcinoma and adenocarcinoma of the cervix. The pre-treatment CBC profiles of the patients from nine tertiary medical centers in South Korea who were treated surgically for early stage cervical cancer were reviewed. Statistical models by the Akaike’s information criterion (AIC) were developed using CBC profiles to calculate individuals’ risk scores for clinical outcomes. A total of 1443 patients were included in the study and the median follow-up was 63.7 months with a range of 3–183 months. Univariate analyses identified the components of CBC that were significantly related to clinical outcomes including white blood cell (WBC), hemoglobin, neutrophil, and platelet levels. The models developed using CBC profiles and the conventional clinical predictive factors provided individuals’ risk scores that were significantly better in predicting clinical outcomes than the models using the conventional clinical predictive factors alone. Pre-treatment CBC profiles including WBC, hemoglobin, neutrophil, lymphocyte, and platelet levels were found to be a potential biomarker for survival prognosis in early cervical cancer.

1. Introduction

Cervical cancer is the second most common malignancy in females worldwide and the leading cause of cancer-related deaths among women, especially in developing countries. In the year 2012, about 500,000 new cervical cancer cases were diagnosed, and 275,000 deaths were estimated to occur of this malignancy globally [1,2]. Patients with cervical cancer are prone to develop pelvic recurrence or distant metastasis. A 10–20% recurrence rate has been reported following primary surgery or radiotherapy in women with stage IB–IIA cervical cancer with no evidence of lymph node involvement; while up to 70% of patients with nodal metastases were reported to relapse [3,4,5,6]. It is therefore critical to define reliable prognostic factors that may help identify patients at high risk of recurrence. Furthermore, identifying patients who would not benefit from the current treatment modalities would allow physicians to offer them the opportunity to receive other types of treatment. The FIGO (International Federation of Gynecology and Obstetrics) staging system is one of the most commonly used predictors for survivals, and often determines patients’ treatment plans in the current clinical settings [7]. However, because it is based on clinical evaluation of the anatomic extent; the correlation between the FIGO staging and final histopathologic classification is not always accurate. The error rate is about 25% in patients with early stages (≤IIA) while it is 65% to 90% in patients with advanced stages (≥IIB) [8]. Hence, it is necessary to improve the FIGO staging system for more accurate prognosis in cervical cancer, thereby, allowing beneficial individualized treatment.
A large number of translational research studies have revealed an association of various molecular biomarkers with clinical outcome in cervical cancer. Among them are peripheral blood cells. This association between clinical outcome and pre-treatment peripheral blood profile such as leukocytes, neutrophils, lymphocytes, and platelets has been observed not only in cervical cancer but also in other types of cancers as well. In addition, systemic-inflammation-based scores such as the Glasgow prognostic score (GPS), neutrophil lymphocyte ratio (NLR), and platelet lymphocyte ratio (PLR) have also been shown to have prognostic value [9].
In the present study, we retrospectively assessed the association between pre-treatment complete blood count (CBC) and clinical outcome in early cervical cancer patients. Our primary aim was to assess the potential prognostic value of CBC in addition to the FIGO staging system in early cervical cancer patients who underwent operative treatment. The secondary aim was to develop models utilizing these variables to predict patients’ individual clinical outcomes by calculating risk scores. In doing so, we evaluated overall survival, lymphatic recurrence, and hematogenous recurrence separately because each often requires different treatment modalities.

2. Materials and Methods

2.1. Patients

The medical records of the patients with early stage cervical cancer from January 2000 to December 2008 at nine Korean Gynecologic Oncology Group (KGOG) institutes were retrospectively reviewed. Approval from the institutional review board was obtained, and the requirement for informed consent was waived. Patients with pathologically confirmed cervical cancer, a clinical diagnosis of FIGO stage IB–IIA disease, who had undergone radical hysterectomy (type II or III) with pelvic and/or para-aortic lymphadenectomy, were examined. Patients who received neoadjuvant chemotherapy before surgery, those with a history of previous radiation therapy, those with cervical cancer found incidentally after simple hysterectomy, those with rare cell types, and those with metastatic cervical cancers were excluded. Patients who did not have a pre-treatment CBC profile within two weeks prior to their surgery were also excluded from analysis.

2.2. Clinical Management

Cervical cancer was staged according to the FIGO staging system using physical examination, chest radiography, intravenous pyelography, and abdominopelvic computed tomography (APCT) or pelvis magnetic resonance imaging (MRI) findings. Cystoscopy and colonoscopy were performed if bladder or rectal involvement was suspected. Tumor size was determined by clinical palpation or inspection, and in cases without data of clinical tumor size, it was measured using imaging modalities such as APCT or pelvic MRI. The operation records of laparotomy or laparoscopic radical hysterectomy with bilateral pelvic lymphadenectomy, with or without para-aortic lymphadenectomy, were reviewed to determine the appropriateness of the surgical procedure. Pathological reports included the description of histology, depth of stromal invasion (DSI), lymph-vascular space invasion (LVSI), the number of lymph nodes dissected, the number of nodes showing features of malignancy, parametrial involvement, and invasion of the resection margin.
Patients were followed-up according to the guidelines at each institution. The treatment options included no further treatment, radiation alone, concurrent platinum-based chemoradiation, and chemotherapy alone. In brief, adjuvant radiation therapy was started within 4–6 weeks after surgery using the conventional four-field technique. The radiation dose ranged from 40 Grays in 23 fractions to 50.4 Grays in 28 fractions (daily fractions of 1.8–2.0 Grays (5 fractions per week) over 4.5–6.0 weeks). The cisplatin-based concurrent chemotherapy regimens consisted of weekly cisplatin (40 mg/m2) for six cycles or FP (500 mg/m2 5-fluorouracil (FU) + 50 mg/m2 cisplatin) every 3 weeks for three cycles. The systemic chemotherapy regimens consisted of CP (500 mg/m2 cyclophosphamide + 50 mg/m2 cisplatin), FP (500 mg/m2 5-FU + 50 mg/m2 cisplatin), and TP (135 mg/m2 paclitaxel + 75 mg/m2 cisplatin).
At follow-up visits, patients received a physical examination, Pap smear, and serum squamous cell carcinoma (SCC) antigen level monitoring every 3 months for 2 years and then every 6 months for the next 3 years. Chest radiography and imaging modalities such as APCT or positron emission tomography/computed tomography (PET-CT) were performed every 6–12 months for the first 2 years and then annually for the next 3 years. Disease recurrence was defined as the histological presence of tumor cells by biopsy, appearance of new lesions on imaging modalities such as APCT or PET-CT that were suggestive of hematogenous recurrence, or any lymph node greater than 1 cm along the short-axis diameter on the APCT scan. When lymphatic recurrence was suspected, needle biopsy was often performed to confirm the malignant features of the lymph node. When needle biopsy was unavailable, PET-CT was performed to confirm high F-18 fluorodeoxyglucose (FDG) uptake. Hematogenous recurrence was defined as distant recurrence regardless of concurrent lymphatic recurrences.

2.3. Selection of Prognostic Variables for Survival and Recurrence

To identify variables predicting survival and recurrence, the following factors were evaluated: age, body mass index (BMI), FIGO stage, histology, parametrial invasion, LVSI, tumor size, DSI, lymph node metastasis (pelvic and para-aortic), resection margin invasion, pre-treatment CBC results within two weeks prior to the operation, and surgical methods. Disease-free survival (DFS) was defined as the time interval from surgery to the first evidence of recurrence or last follow-up. Overall survival (OS) was described as the time interval from diagnosis to date of death or last follow-up. DFS and OS were estimated using the Kaplan-Meier method. Survival curves were compared using the log-rank test.

2.4. Model Development

A Cox proportional hazards regression analysis was performed on each of the individual factors for DFS, OS, hematogenous recurrence, and lymphatic recurrence to estimate individuals’ risk scores. The Akaike’s information criterion (AIC) using stepwise and best-model options identified the best combinations as predictors. The AIC measures the relative quality of statistical models for a given set of data, thereby providing a means for model selection [10,11,12]. Conditional backward selection was used to select the final variables for constructing the models. This method is frequently used to identify predictive factors for prognosis in clinical research [13]. Hazard ratios (HRs) and 95% confidence intervals (CIs) were estimated.

2.5. Concordance Index (C-Index) Calculation

The predictive accuracy of the model was estimated by the concordance index (C-index). A C-index close to 1.0 reflects a model with near-perfect discrimination. In contrast, an index of 0.5 indicates that the model is capable of nothing better than random predictions [14]. The C-index of clinical outcome was calculated with the conventional clinical predictive factors including histologic tumor type, FIGO stage, DSI, lymph node metastasis, and parametrial invasion. The C-index was again calculated with the above variables and the pre-treatment CBC profiles added. These included hemoglobin, platelet, lymphocyte, neutrophil, NLR, and PLR. The two types of C-index were compared in each clinical outcome. Cross validation based on bootstrap resampling resulted in ranges of C-index. This analysis was performed with the patients who did not have any missing clinical data or pre-treatment CBC profile.

2.6. Statistical Analysis

Statistical analysis was performed using R 3.5.0. (R Foundation for Statistical Computing, Vienna, Austria; http://www.R-project.org/). A p-value of less than 0.05 was considered significant.

3. Results

3.1. Patient Characteristics and Univariate Analysis of Pre-Treatment CBC

From a database of 1553 patients, 1443 patients satisfied the eligibility criteria. Descriptive statistics of the patients are described in Table 1. During the median follow-up period of 63.7 months (range: 3.0–183.3 months), 134 patients experienced recurrences and 72 cancer-related deaths occurred. Among the 1443 patients, 675 patients received adjuvant treatment after surgery. Univariate analysis indicated that hemoglobin and platelet levels were related to overall recurrence (DFS) (Supplementary Table S1). When analyzed separately by the types of recurrence, platelet levels were shown to have an association with hematogenous recurrence (Supplementary Table S2).

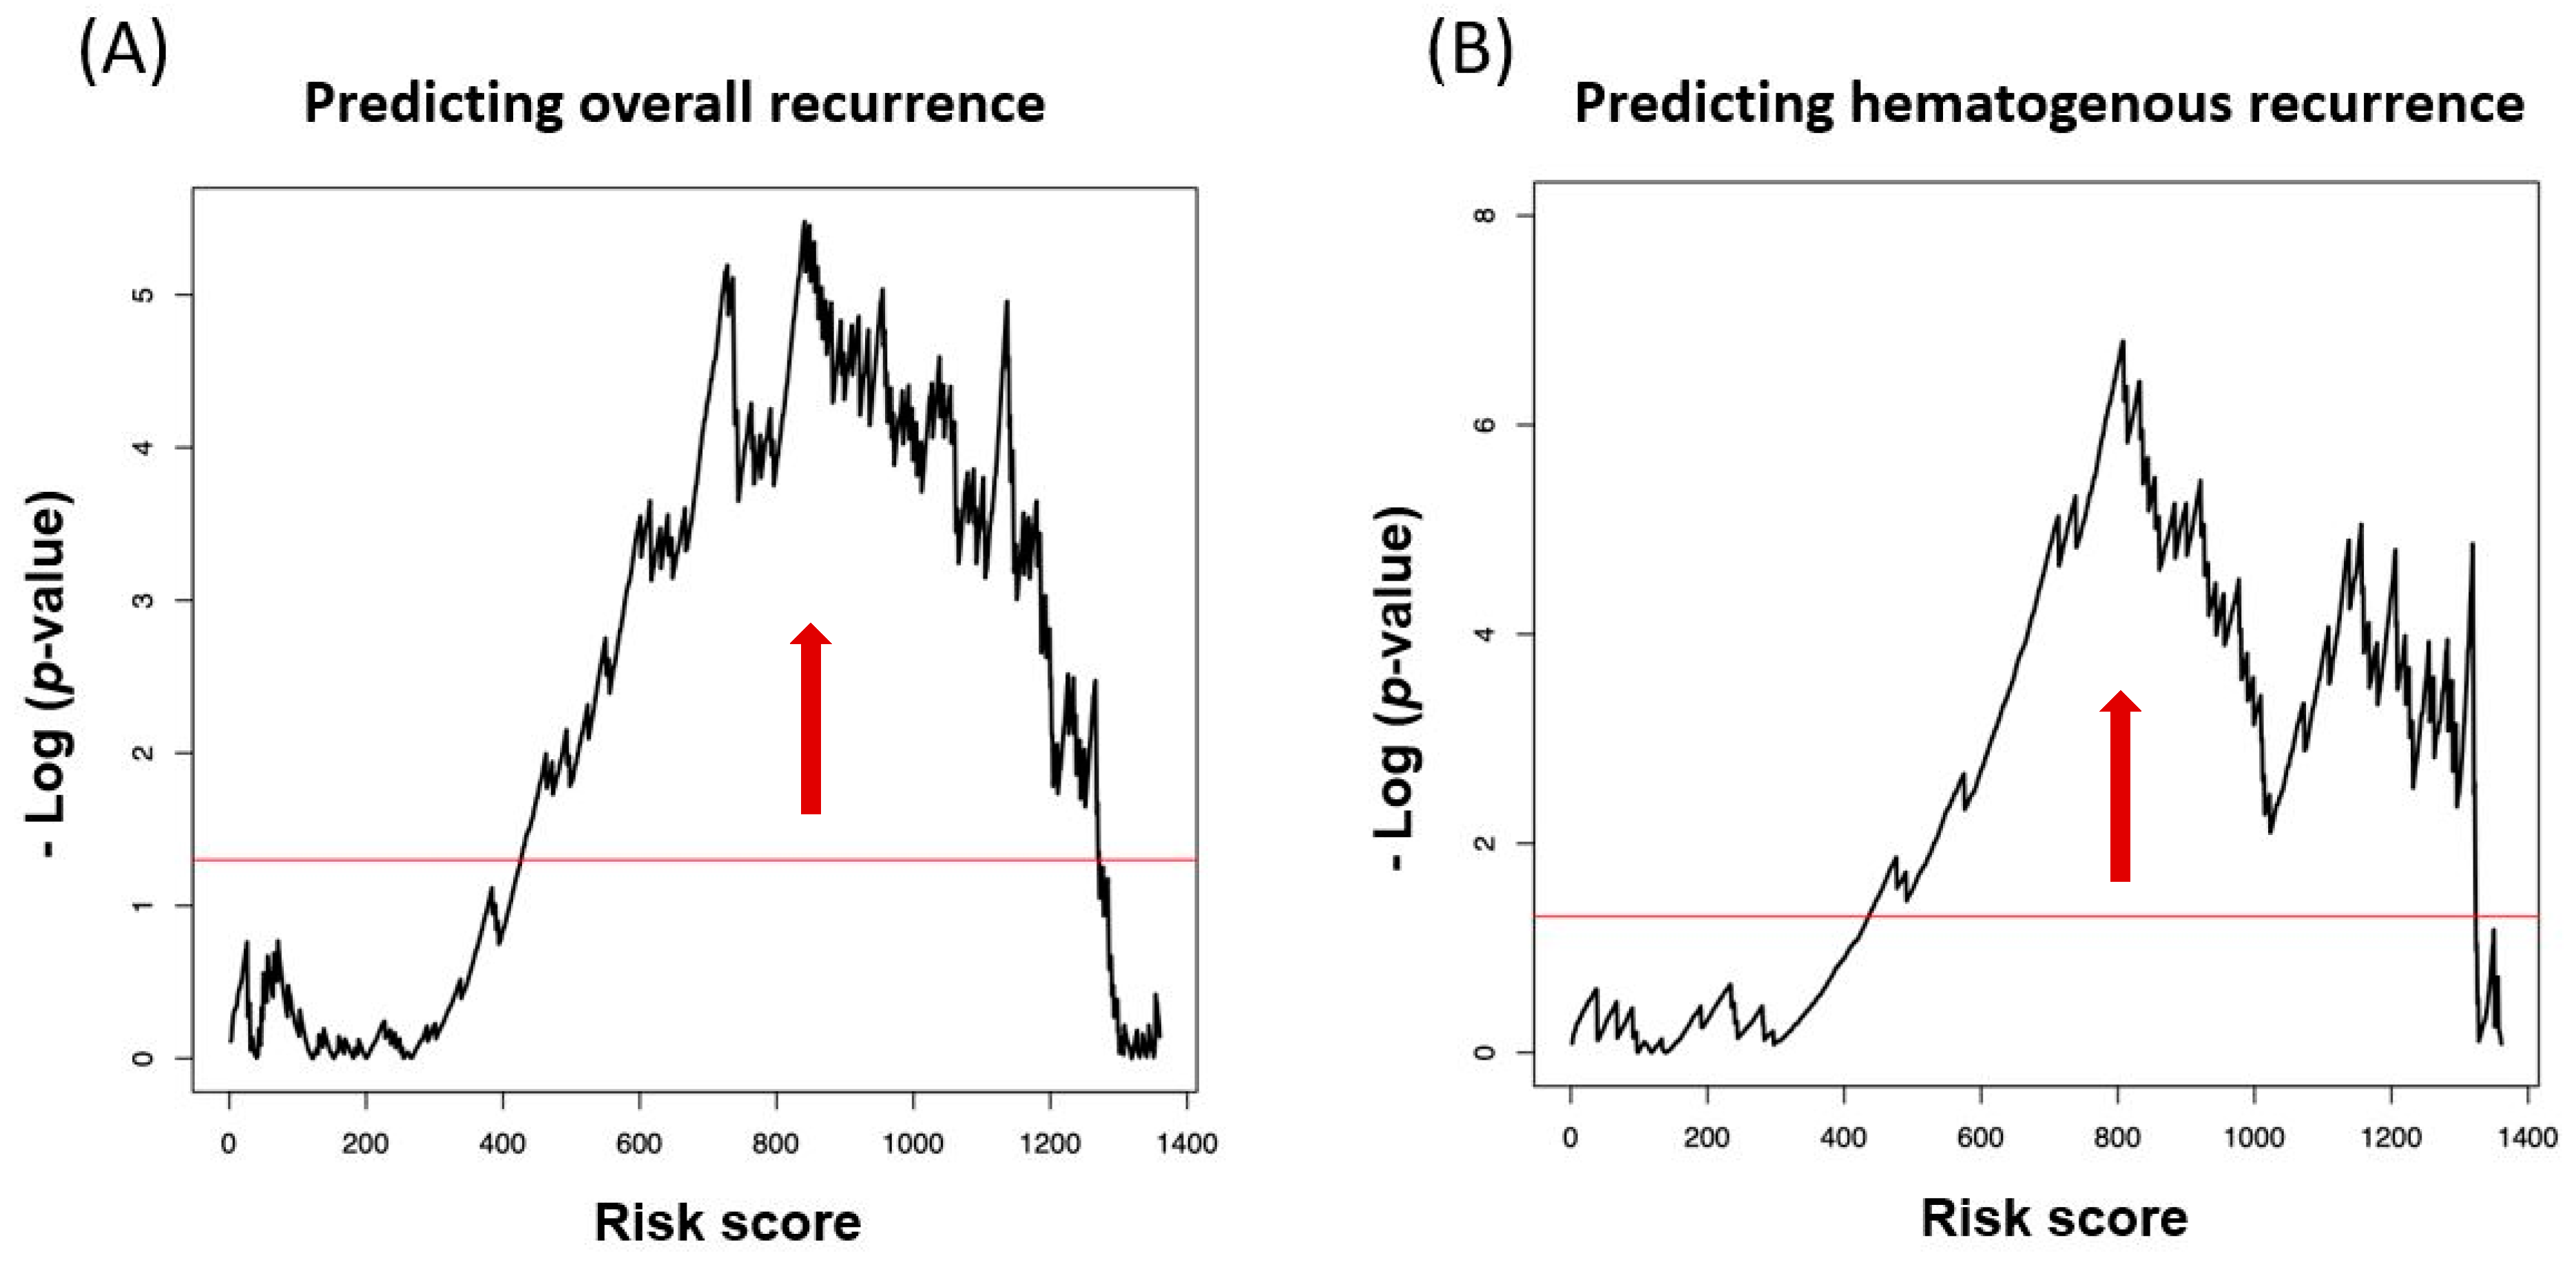
3.2. Model Development

The models to calculate risk scores for clinical outcomes were developed by the AIC using stepwise and best-model options with pre-treatment CBC. The multivariate regression analysis revealed that lymphocyte and platelet levels were significantly related to overall recurrence (DFS) (Table 2) while white blood cell (WBC), neutrophil, and platelet levels were associated with hematogenous recurrence (Table 3). The AIC models were established based upon the results of multivariate analysis. For example, the model to predict overall recurrence (DFS) included lymphocyte and platelet levels as following: RS (risk score) = (0.029 × Platelet) – (0.299 × Lymphocyte). The same calculations were conducted to build models to predict hematogenous recurrence: RS = (0.507 × Neutrophil) + (0.048 × Platelet) – (0.505 × WBC). We were not able to build a model to predict lymphatic recurrence because no variables showed statistically significant association with it.
The calculated risk scores predicted recurrence (overall and hematogenous) with good performance. Negative log (p-value) of log rank test showed significance (area over the red line) for most cutoff points (Figure 1).

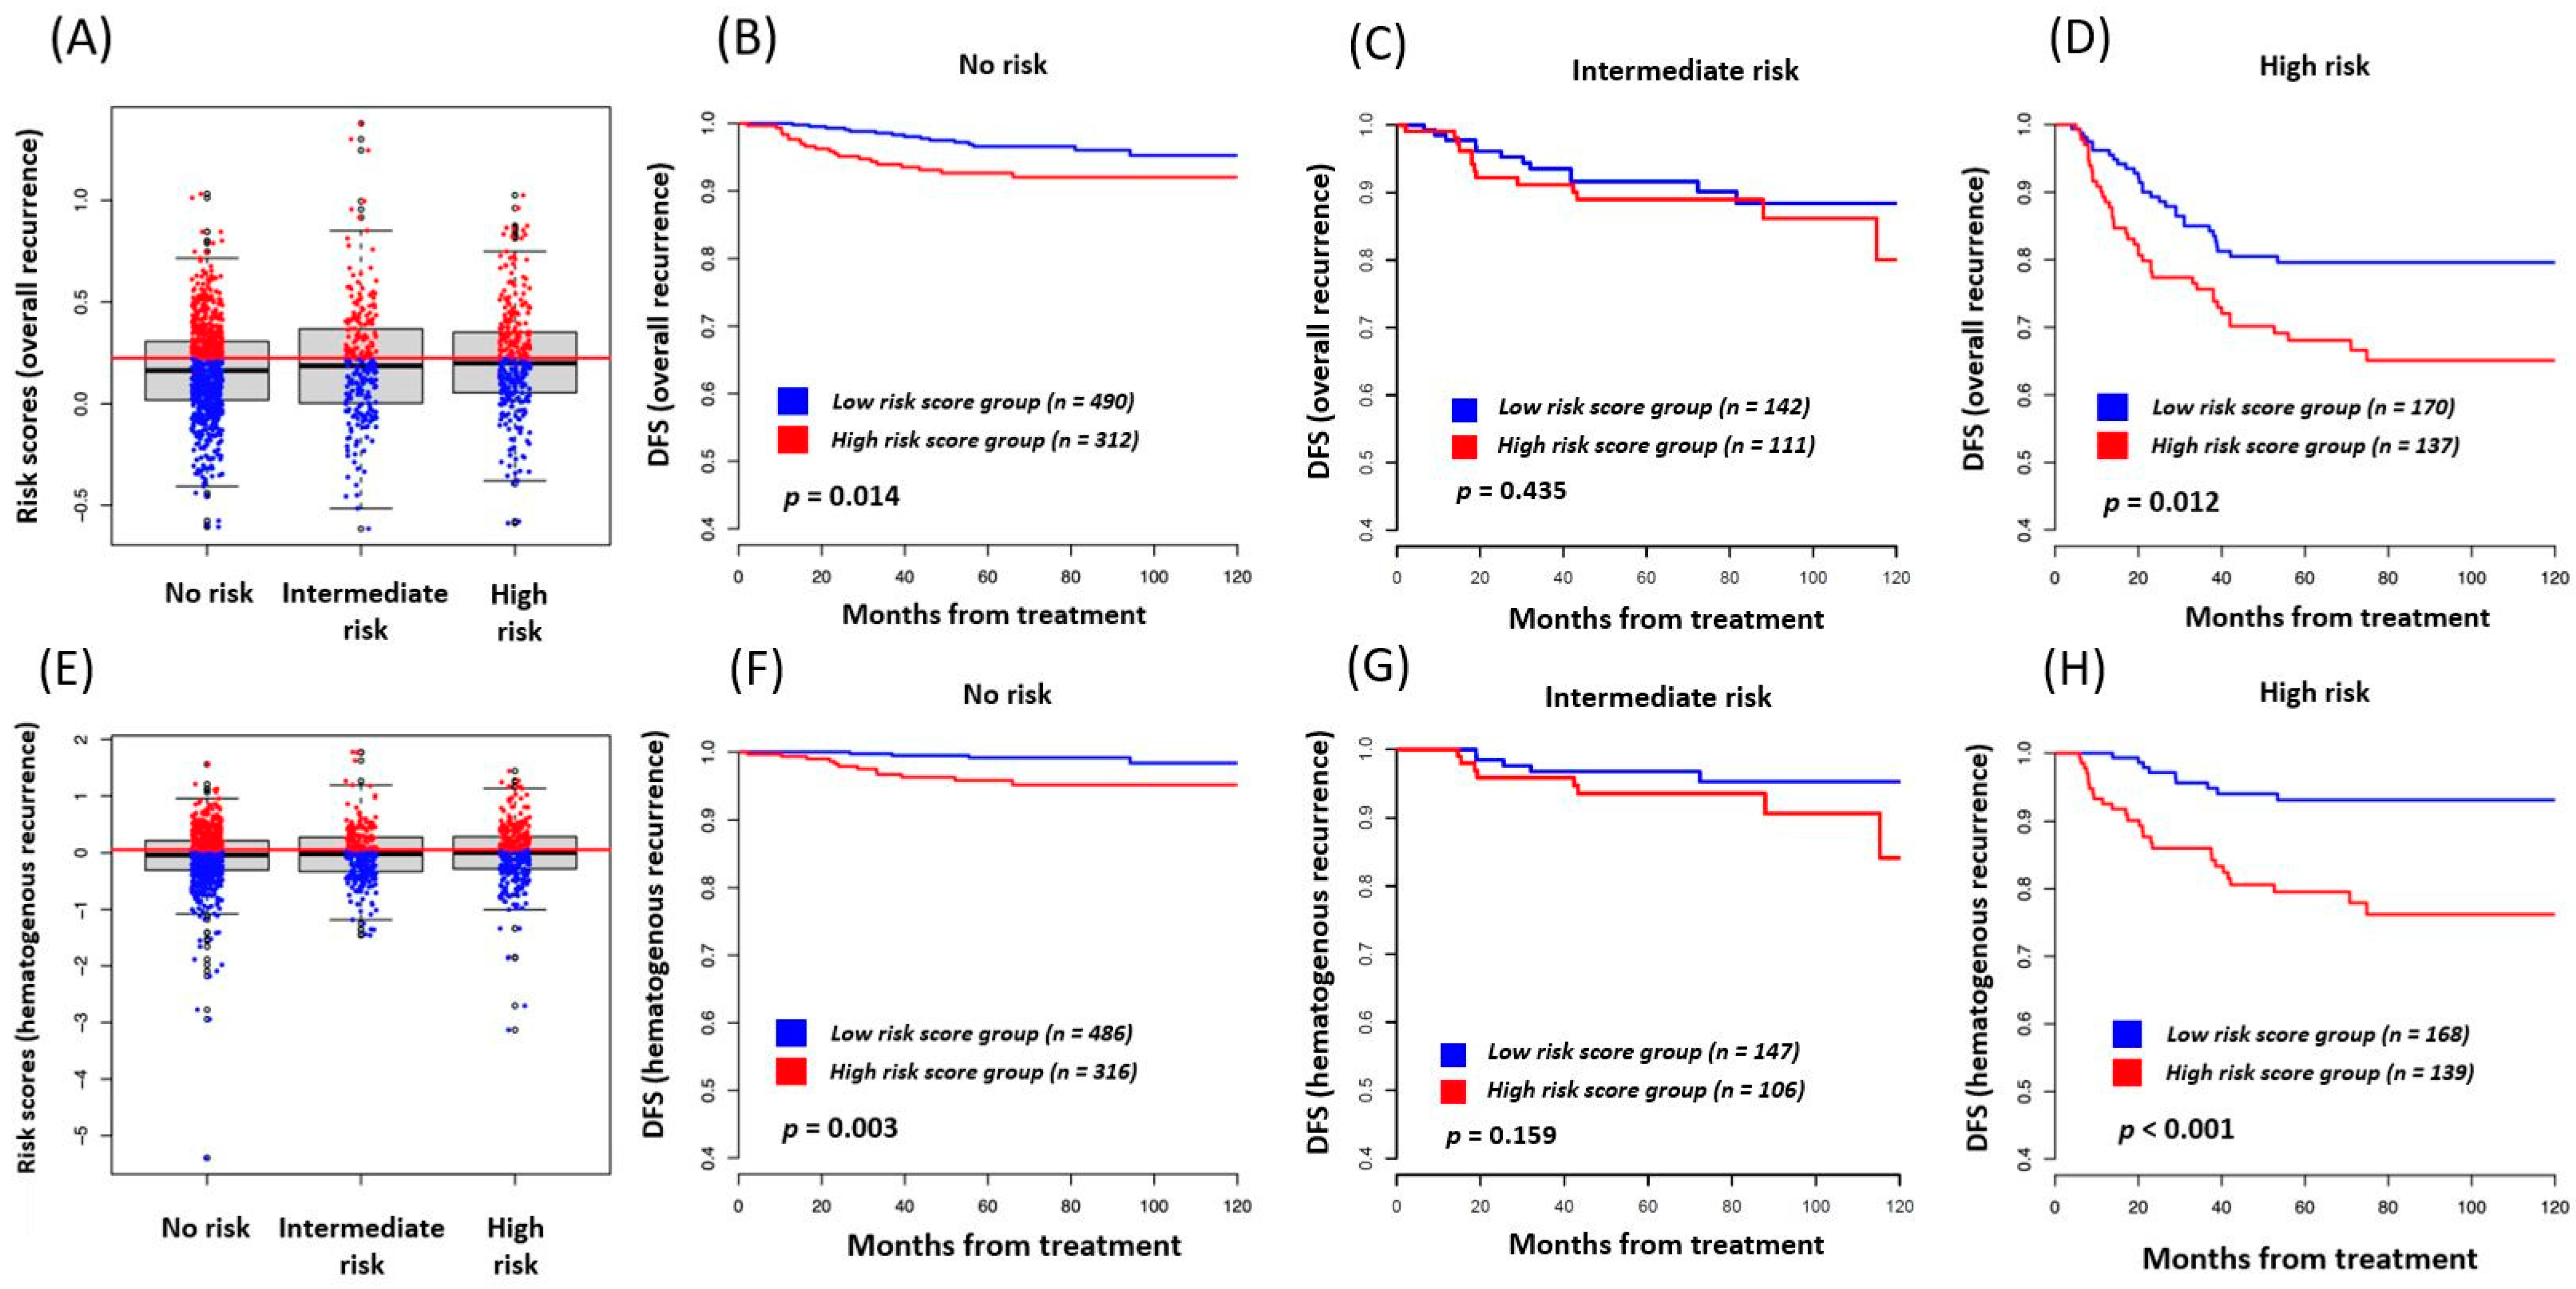
3.3. Risk Score as a Prognostic Marker in Each Traditional Risk Subgroup

Further subgroup analyses of risk scores for predicting each clinical outcome were conducted. The patients were categorized into one of three groups—no risk, intermediate risk, and high risk for recurrence. Intermediate risk factors for recurrent disease included (1) large tumor size (greater than 2 cm in diameter), (2) cervical stromal invasion to the middle or deep one-third, and (3) lymph-vascular space invasion. High risk factors for recurrent disease included (1) positive or close margins (less than 5 mm), (2) positive lymph nodes, and (3) microscopic parametrial involvement.
The risk scores of the patients according to the above classifications are box-plotted in Figure 2A. The DFS of the patients without traditional risk factors was divided into two according to their risk scores calculated by the built model. It was performed by dichotomizing the patients at the lowest p-value (indicated by the red vertical arrows in Figure 1), and they were named as the low-risk-score group and the high-risk-score group accordingly. The two groups were prognostically different in Kaplan–Meier curves (Figure 2B). The same analysis was conducted for the patients with intermediate- and high-risk groups in Figure 2C,D. The risk groups created by the CBC-based models further predicted DFS with a large difference in survival in the patients with no risk factors and high risk factors. The analysis did not show significant differences in the patients with intermediate risk factors. The same analyses were performed for predicting hematogenous recurrence, and they are described in Figure 2E–H, demonstrating similar patterns.

3.4. Concordance Index (C-Index) Calculation

When pre-treatment CBC profiles were added to the conventional clinical variables to predict clinical outcomes, the C-index values increased significantly for predicting overall recurrence and overall survival (Figure 3A,B). However, the addition of pre-treatment CBC profiles to the conventional clinical variables for predicting hematogenous recurrence did not contribute any statistically significant increase in predictive ability.

4. Discussion

The present study showed that WBC, hemoglobin, lymphocyte, and platelet levels measured pre-operatively have predictive value for prognosis in early cervical cancer. These variables allowed us to build models based on stepwise and backward reducing methods (Akaike’s information criterion, AIC) and to calculate each individual’s risk scores for predicting overall recurrence, hematogenous recurrence, lymphatic recurrence, and overall survival. The discriminatory capacities of the models were statistically sufficient to identify subsets of patients who were at high risk for poor clinical outcomes, and these predictions were in accordance with other already known prognostic factors in early cervical cancer, i.e., the FIGO stages.
Pre-treatment CBC has become one of the predictors of prognosis in many types of solid cancers. These include colorectal cancer, hepatocellular carcinoma, pancreatic carcinoma, and breast cancer [15,16,17,18]. This prognostic value has also been observed in gynecologic malignancies including ovarian cancer, endometrial cancer, and cervical cancer [19,20,21]. Although variations exist in the results of previous studies, they can be summarized as following: (1) high levels of pre-operative WBC predict poor prognosis, (2) high levels of pre-operative monocyte count predict poor prognosis, (3) low levels of pre-operative lymphocyte count predict poor prognosis, (4) high levels of pre-operative platelet count predict poor prognosis, and (5) low levels of pre-operative hemoglobin predict poor prognosis.
The exact biologic mechanisms by which peripheral blood cells interact with tumor progression and metastasis are still under investigation. However, many clinical reviews and experimental reports are accumulating to implicate that it comprises a cascade of steps that involve the interaction between the tumor and the host-derived stromal microenvironment, which includes factors that support angiogenesis and inflammation [22,23]. Increased WBC is caused by the upregulated production of hematopoietic growth factors, including granulocyte colony-stimulating factor (G-CSF), interleukin (IL)-1, IL-6, and tumor necrosis factor (TNF)-alpha [24,25,26,27,28]. Among these cytokines, G-CSF plays a crucial role in granulopoiesis by stimulating the proliferation, survival, and neutrophilic differentiation of hematopoietic progenitor cells [29]. It was reported that G-CSF is produced by tumor cells themselves, and an increasing number of studies have reported that G-CSF-producing malignancies including cervical cancer were associated with a poor clinical outcome [30,31,32,33]. Increased neutrophils have been considered to be the primary source of circulating vascular endothelial growth factor, which play a critical role in tumor-associated angiogenesis. It produces inflammatory cytokines such as TNF-alpha and IL-1 and provides a favorable microenvironment for tumor [34]. Decreased lymphocytes exert an adverse effect in cancer-specific immune response [35]. It has been shown that an increased infiltration of lymphocytes into tumor tissue is associated with good prognosis [36]. Conversely, decreased lymphocytes represent low immune competence of the host in tumor environment. Low hemoglobin represents hypoxic tissue conditions. Hypoxia confers resistance to ionizing radiation as well as to many anticancer drugs and triggers proteome and genomic changes that induce tumor progression [37,38,39,40]. The increase in platelet counts is due to tumor-secreted cytokines that play a role in stimulating megakaryocyte growth and thrombopoiesis. IL-6, in particular, acting as an autocrine growth factor, is overproduced in a variety of malignancies [41]. Platelets also enhance tumor metastasis by expressing immunoregulatory proteins including the glucocorticoid-induced TNF-related protein to protect tumor cells from the host’s immune system [42,43,44].
In our study, we were able to develop statistical models to calculate each patient’s risk scores for recurrence. The risk of recurrence in a patient exists as a continuous spectrum influenced by multiple, interrelated elements. This may explain why individual pathologic features or varying combinations of such features had diverse predictive values among different investigators. In contrast to traditional prognostic systems, which allocate patients into discrete risk groups, a statistical predictive model such as the one developed in the present study can generate a numerical probability of a clinical outcome. In recent years, statistical prediction models have been developed across many other types of cancer [45,46,47,48,49]. These are becoming widely used for cancer prognosis because of their ability to provide a single numerical estimate of the probability of an event, such as death or recurrence, that is tailored to the profile of an individual patient [50]. It is not surprising that the predictive model performs better than the staging system because it is better able to account for heterogeneity in tumor and patient characteristics. Considering the fact that the C-index of the Gail model, one of the most widely used risk assessment tools for predicting breast cancer, is 0.67, the increase of C-index shown in the present study by the addition of CBC profiles to the conventional clinical factors in cervical cancer is noteworthy. Another potential benefit of the predictive statistical model is that it is readily modifiable by adding other prognostic factors. Therefore, the models developed in the present study may aid clinicians in determining more aggressive treatment methods for those who acquire high risk scores for poor clinical outcomes.
The present study carries the following limitations. First it is a retrospective study. This structure of the study does not exclude the possibility that the prognosis was affected by different therapeutic strategies such as the types of hysterectomy or types of adjuvant therapies. A well-designed, prospective study with a larger number of patients with cervical cancer who underwent radical surgery is needed. Second, C-reactive protein (CRP), an inflammatory marker, was not evaluated in the present study. Many authors have observed an association between elevated serum CRP levels and poor prognosis in cancers such as colorectal [51,52], lung [53], and head and neck cancers [54,55]. It would be more useful if models for predicting clinical outcomes in cervical cancer were developed not only with CBC profiles but also with other potential biomarkers such as CRP. Third, differences may exist in host’s immune condition between human papillomavirus (HPV)-negative cervical cancer patients and HPV-positive cervical cancer patients. Some heterogeneity may be found in this study because we included cervical cancer patients both with and without HPV infection.
In conclusion, we have shown that pre-treatment CBC can be utilized in addition to the existing clinical predictive factors to develop better statistical models in early cervical cancer. We believe that our results suggest that it is possible to identify high-risk patients who would not benefit from conventional treatment by performing a simple blood test, providing the physician the opportunity to offer patients other types of individualized treatment options.

Supplementary Materials

The following are available online at https://www.mdpi.com/2077-0383/9/9/2960/s1, Table S1. Univariate analysis of disease-free survival by the Cox proportional hazard model. Table S2. Univariate analysis of hematogenous recurrence by the Cox proportional hazard model.

Author Contributions

The present study was designed, directed, and coordinated by C.H.C., as the principal investigator. C.H.C. provided conceptual and technical guidance for all aspects of the project. C.H.C. planned and performed the analyses of the data. The manuscript was written by J.J.N. and commented on by all authors. M.C.L., M.-H.K., Y.H.K., E.S.S., S.J.S., D.H.S., J.-M.L., and C.L. provided data for analyses. All the authors meet the recommendations for the conduct, reporting, editing, and publication of scholarly work in medical journals provided by the International Committee of Medical Journal Editors. All authors have read and agree to the published version of the manuscript.

Funding

The authors of this publication do not have any sources of research funding.

Conflicts of Interest

The authors of this publication disclose that there are no relevant financial, personal, political, intellectual, or religious interests to declare. The terms of this arrangement have been reviewed and approved by Samsung Medical Center in accordance with its policy on objectivity in research.

References

  1. Torre, L.A.; Bray, F.; Siegel, R.L.; Ferlay, J.; Lortet-Tieulent, J.; Jemal, A. Global cancer statistics, 2012. CA Cancer J. Clin. 2015, 65, 87–108. [Google Scholar] [CrossRef] [PubMed] [Green Version]
  2. Gray, H.J. Primary Management of Early Stage Cervical Cancer (IA1-IB) and Appropriate Selection of Adjuvant Therapy. J. Natl. Compr. Cancer Netw. 2008, 6, 47–52. [Google Scholar] [CrossRef] [PubMed]
  3. Delgado, G.; Bundy, B.; Zaino, R.; Sevin, B.-U.; Creasman, W.T.; Major, F. Prospective surgical-pathological study of disease-free interval in patients with stage IB squamous cell carcinoma of the cervix: A Gynecologic Oncology Group study. Gynecol. Oncol. 1990, 38, 352–357. [Google Scholar] [CrossRef]
  4. Zaino, R.J.; Ward, S.; Delgado, G.; Bundy, B.; Gore, H.; Fetter, G.; Ganjei, P.; Frauenhofer, E. Histopathologic predictors of the behavior of surgically treated stage IB squamous cell carcinoma of the cervix. A gynecologic oncology group study. Cancer 1992, 69, 1750–1758. [Google Scholar] [CrossRef]
  5. Burghardt, E.; Baltzer, J.; Tulusan, A.H.; Haas, J.; Baker, J. Results of surgical treatment of 1028 cervical cancers studied with volumetry. Cancer 1992, 70, 648–655. [Google Scholar] [CrossRef]
  6. Stehman, F.B.; Bundy, B.N.; DiSaia, P.J.; Keys, H.M.; Larson, J.E.; Fowler, W.C. Carcinoma of the cervix treated with radiation therapy I. A multi-variate analysis of prognostic variables in the gynecologic oncology group. Cancer 1991, 67, 2776–2785. [Google Scholar] [CrossRef]
  7. Pecorelli, S. Revised FIGO staging for carcinoma of the vulva, cervix, and endometrium. Int. J. Gynecol. Obstet. 2009, 105, 103–104. [Google Scholar] [CrossRef]
  8. Bipat, S.; Glas, A.S.; Van Der Velden, J.; Zwinderman, A.H.; Bossuyt, P.M.M.; Stoker, J. Computed tomography and magnetic resonance imaging in staging of uterine cervical carcinoma: A systematic review. Gynecol. Oncol. 2003, 91, 59–66. [Google Scholar] [CrossRef]
  9. McMillan, D.C. Systemic inflammation, nutritional status and survival in patients with cancer. Curr. Opin. Clin. Nutr. Metab. Care 2009, 12, 223–226. [Google Scholar] [CrossRef] [Green Version]
  10. Akaike, H. A new look at the statistical model identification. IEEE Trans. Automat. Control 1974, 19, 716–722. [Google Scholar] [CrossRef]
  11. Harrell, F.E., Jr.; Lee, K.L.; Mark, D.B. Multivariable prognostic models: Issues in developing models, evaluating assumptions and adequacy, and measuring and reducing errors. Stat Med. 1996, 15, 361–387. [Google Scholar] [CrossRef]
  12. Moons, K.G.; Altman, D.G.; Reitsma, J.B.; Ioannidis, J.P.; Macaskill, P.; Steyerberg, E.W.; Vicker, A.J.; Ransohoff, D.F.; Collins, G.S. Transparent reporting of a multivariable prediction model for individual prognosis or diagnosis. (TRIPOD): Explanation and elaboration. Ann. Intern. Med. 2015, 162, W1–W73. [Google Scholar] [CrossRef] [PubMed] [Green Version]
  13. Chen, S.-H.; Wan, Q.-S.; Zhou, D.; Wang, T.; Hu, J.; He, Y.-T.; Yuan, H.-L.; Wang, Y.-Q.; Zhang, K.-H. A Simple-to-Use Nomogram for Predicting the Survival of Early Hepatocellular Carcinoma Patients. Front. Oncol. 2019, 9, 584. [Google Scholar] [CrossRef] [PubMed]
  14. Gönen, M.; Heller, G. Concordance probability and discriminatory power in proportional hazards regression. Biometrika 2005, 92, 965–970. [Google Scholar] [CrossRef]
  15. Shirai, Y.; Shiba, H.; Sakamoto, T.; Horiuchi, T.; Haruki, K.; Fujiwara, Y.; Futagawa, Y.; Ohashi, T.; Yanaga, K. Preoperative platelet to lymphocyte ratio predicts outcome of patients with pancreatic ductal adenocarcinoma after pancreatic resection. Surgery 2015, 158, 360–365. [Google Scholar] [CrossRef]
  16. Krenn-Pilko, S.; Langsenlehner, U.; Thurner, E.-M.; Stojakovic, T.; Pichler, M.; Gerger, A.; Kapp, K.S.; Langsenlehner, T. The elevated preoperative platelet-to-lymphocyte ratio predicts poor prognosis in breast cancer patients. Br. J. Cancer 2014, 110, 2524–2530. [Google Scholar] [CrossRef] [Green Version]
  17. Okamura, Y.; Ashida, R.; Ito, T.; Sugiura, T.; Mori, K.; Uesaka, K. Preoperative Neutrophil to Lymphocyte Ratio and Prognostic Nutritional Index Predict Overall Survival After Hepatectomy for Hepatocellular Carcinoma. World J. Surg. 2015, 39, 1501–1509. [Google Scholar] [CrossRef]
  18. Moghadamyeghaneh, Z.; Hanna, M.H.; Carmichael, J.C.; Mills, S.D.; Pigazzi, A.; Stamos, M.J. Preoperative Leukocytosis in Colorectal Cancer Patients. J. Am. Coll. Surg. 2015, 221, 207–214. [Google Scholar] [CrossRef] [Green Version]
  19. Barber, E.L.; Rutstein, S.E.; Miller, W.C.; Gehrig, P.A. A preoperative personalized risk assessment calculator for elderly ovarian cancer patients undergoing primary cytoreductive surgery. Gynecol. Oncol. 2015, 139, 401–406. [Google Scholar] [CrossRef] [Green Version]
  20. Njølstad, T.S.; Engerud, H.; Werner, H.M.; Salvesen, H.B.; Trovik, J. Preoperative anemia, leukocytosis and thrombocytosis identify aggressive endometrial carcinomas. Gynecol. Oncol. 2013, 131, 410–415. [Google Scholar] [CrossRef]
  21. Zhang, Y.; Wang, L.; Liu, Y.; Wang, S.; Shang, P.; Gao, Y.; Chen, X. Preoperative Neutrophil-Lymphocyte Ratio Before Platelet-Lymphocyte Ratio Predicts Clinical Outcome in Patients With Cervical Cancer Treated with Initial Radical Surgery. Int. J. Gynecol. Cancer 2014, 24, 1319–1325. [Google Scholar] [CrossRef] [PubMed]
  22. Balkwill, F.; Mantovani, A.; Balkwill, F. Inflammation and cancer: Back to Virchow? Lancet 2001, 357, 539–545. [Google Scholar] [CrossRef]
  23. Coussens, L.M.; Werb, Z. Inflammation and cancer. Nature 2002, 420, 860–867. [Google Scholar] [CrossRef]
  24. Sato, K.; Fujii, Y.; Ono, M.; Nomura, H.; Shizume, K. Production of interleukin 1 alpha-like factor and colony-stimulating factor by a squamous cell carcinoma of the thyroid (T3M-5) derived from a patient with hypercalcemia and leukocytosis. Cancer Res. 1987, 47, 6474–6480. [Google Scholar]
  25. Nasser, S.M.; Choudry, U.H.; Nielsen, G.P.; Ott, M.J. A leukemoid reaction in a patient with a dedifferentiated liposarcoma. Surgery 2001, 129, 765–767. [Google Scholar] [CrossRef] [PubMed]
  26. Watanabe, M.; Ono, K.; Ozeki, Y.; Tanaka, S.; Aida, S.; Okuno, Y. Production of Granulocyte--macrophage Colony-stimulating Factor in a Patient with Metastatic Chest Wall Large Cell Carcinoma. Jpn. J. Clin. Oncol. 1998, 28, 559–562. [Google Scholar] [CrossRef] [PubMed] [Green Version]
  27. Wetzler, M.; Estrov, Z.; Talpaz, M.; Markowitz, A.; Gutterman, J.U.; Kurzrock, R. Granulocyte-macrophage colony-stimulating factor as a cause of paraneoplastic leukaemoid reaction in advanced transitional cell carcinoma. J. Intern. Med. 1993, 234, 417–420. [Google Scholar] [CrossRef] [PubMed]
  28. Qureshi, K.M.; Raman, A.K.; Tan, N.; Fakih, M.G. Leukemoid reaction in pancreatic cancer: A case report and review of the literature. JOP 2006, 7, 631–634. [Google Scholar]
  29. Mabuchi, S.; Matsumoto, Y.; Isohashi, F.; Yoshioka, Y.; Ohashi, H.; Morii, E.; Hamasaki, T.; Aozasa, K.; Mutch, D.G.; Kimura, T. Pretreatment leukocytosis is an indicator of poor prognosis in patients with cervical cancer. Gynecol. Oncol. 2011, 122, 25–32. [Google Scholar] [CrossRef]
  30. Hirasawa, K.; Kitamura, T.; Oka, T.; Matsushita, H. Bladder tumor producing granulocyte colony-stimulating factor and parathyroid hormone related protein. J. Urol. 2002, 167, 2130. [Google Scholar] [CrossRef]
  31. Takahashi, H.; Yasuda, A.; Ochi, N.; Sakamoto, M.; Takayama, S.; Wakasugi, T.; Funahashi, H.; Sawai, H.; Sato, M.; Akamo, Y.; et al. Granulocyte-colony stimulating factor producing rectal cancer. World J. Surg. Oncol. 2008, 6, 70. [Google Scholar] [CrossRef] [Green Version]
  32. Mabuchi, S.; Matsumoto, Y.; Morii, E.; Morishige, K.; Kimura, T. The First 2 Cases of Granulocyte Colony-stimulating Factor Producing Adenocarcinoma of the Uterine Cervix. Int. J. Gynecol. Pathol. 2010, 29, 483–487. [Google Scholar] [CrossRef] [PubMed]
  33. Matsumoto, Y.; Mabuchi, S.; Muraji, M.; Morii, E.; Kimura, T. Squamous Cell Carcinoma of the Uterine Cervix Producing Granulocyte Colony-Stimulating Factor. Int. J. Gynecol. Cancer 2010, 20, 417–421. [Google Scholar] [CrossRef] [PubMed]
  34. Mishalian, I.; Bayuh, R.; Levy, L.; Zolotarov, L.; Michaeli, J.; Fridlender, Z.G. Tumor-associated neutrophils (TAN) develop pro-tumorigenic properties during tumor progression. Cancer Immunol. Immunother. 2013, 62, 1745–1756. [Google Scholar] [CrossRef] [PubMed]
  35. Märkl, B.; Wieberneit, J.; Kretsinger, H.; Mayr, P.; Anthuber, M.; Arnholdt, H.M.; Schenkirsch, G. Number of Intratumoral T Lymphocytes Is Associated With Lymph Node Size, Lymph Node Harvest, and Outcome in Node-Negative Colon Cancer. Am. J. Clin. Pathol. 2016, 145, 826–883. [Google Scholar] [CrossRef] [PubMed]
  36. Noble, F.; Mellows, T.; Matthews, L.H.M.; Bateman, A.C.; Harris, S.; Underwood, T.J.; Byrne, J.P.; Bailey, I.S.; Sharland, D.M.; Kelly, J.J.; et al. Tumour infiltrating lymphocytes correlate with improved survival in patients with oesophageal adenocarcinoma. Cancer Immunol. Immunother. 2016, 65, 651–662. [Google Scholar] [CrossRef]
  37. Vaupel, P.; Höckel, M.; Mayer, A. Detection and Characterization of Tumor Hypoxia Using pO2 Histography. Antioxid. Redox Signal. 2007, 9, 1221–1236. [Google Scholar] [CrossRef]
  38. Harris, A.L. Hypoxia—A key regulatory factor in tumour growth. Nat. Rev. Cancer 2002, 2, 38–47. [Google Scholar] [CrossRef]
  39. Semenza, G.L. Targeting HIF-1 for cancer therapy. Nat. Rev. Cancer 2003, 3, 721–732. [Google Scholar] [CrossRef]
  40. Semenza, G.L. Hypoxia-inducible factors: Mediators of cancer progression and targets for cancer therapy. Trends Pharmacol. Sci. 2012, 33, 207–214. [Google Scholar] [CrossRef] [Green Version]
  41. Menczer, J. Preoperative elevated platelet count and thrombocytosis in gynecologic malignancies. Arch. Gynecol. Obstet. 2017, 295, 9–15. [Google Scholar] [CrossRef] [PubMed]
  42. Feng, J.-F.; Huang, Y.; Lu, W.S.; Chen, Q.X. Preoperative platelet count in esophageal squamous cell carcinoma: Is it a prognostic factor? Langenbeck’s Arch. Surg. 2013, 398, 1115–1122. [Google Scholar] [CrossRef]
  43. Müller, B.G.; De Aretxabala, X.; Domingo, M.G. A Review of Recent Data in the Treatment of Gallbladder Cancer: What We Know, What We Do, and What Should Be Done. Am. Soc. Clin. Oncol. Educ. Book 2014, e165–e170. [Google Scholar] [CrossRef] [PubMed] [Green Version]
  44. Placke, T.; Kopp, H.-G.; Salih, H.R. Modulation of Natural Killer Cell Anti-Tumor Reactivity by Platelets. J. Innate Immun. 2011, 3, 374–382. [Google Scholar] [CrossRef] [PubMed]
  45. Bochner, B.H.; Kattan, M.W.; Vora, K.C. Postoperative Nomogram Predicting Risk of Recurrence after Radical Cystectomy for Bladder Cancer. J. Clin. Oncol. 2006, 24, 3967–3972. [Google Scholar]
  46. Steyerberg, E.W.; Roobol, M.; Kattan, M.W.; Van Der Kwast, T.; De Koning, H.; Schroder, F. Prediction of Indolent Prostate Cancer: Validation and Updating of a Prognostic Nomogram. J. Urol. 2007, 177, 107–112. [Google Scholar] [CrossRef]
  47. Wierda, W.G.; O’Brien, S.; Wang, X.; Faderl, S.; Ferrajoli, A.; Do, K.-A.; Cortes, J.; Thomas, D.; Garcia-Manero, G.; Koller, C.; et al. Prognostic nomogram and index for overall survival in previously untreated patients with chronic lymphocytic leukemia. Blood 2007, 109, 4679–4685. [Google Scholar] [CrossRef]
  48. Alran, S.; Institut Curie Breast Cancer Study Group; De Rycke, Y.; Fourchotte, V.; Charitansky, H.; Laki, F.; Falcou, M.C.; Benamor, M.; Fréneaux, P.; Salmon, R.J.; et al. Validation and Limitations of Use of a Breast Cancer Nomogram Predicting the Likelihood of Non–Sentinel Node Involvement After Positive Sentinel Node Biopsy. Ann. Surg. Oncol. 2007, 14, 2195–2201. [Google Scholar]
  49. Karakiewicz, P.I.; Briganti, A.; Chun, F.K.-H.; Trinh, Q.-D.; Perrotte, P.; Ficarra, V.; Cindolo, L.; De La Taille, A.; Tostain, J.; Mulders, P.F.; et al. Multi-Institutional Validation of a New Renal Cancer–Specific Survival Nomogram. J. Clin. Oncol. 2007, 25, 1316–1322. [Google Scholar] [CrossRef]
  50. Iasonos, A.; Schrag, D.; Raj, G.V.; Panageas, K.S. How To Build and Interpret a Nomogram for Cancer Prognosis. J. Clin. Oncol. 2008, 26, 1364–1370. [Google Scholar] [CrossRef]
  51. Gunter, M.J.; Stolzenberg-Solomon, R.Z.; Cross, A.J.; Leitzmann, M.F.; Weinstein, S.; Wood, R.J.; Virtamo, J.; Taylor, P.R.; Albanes, D.; Sinha, R. A Prospective Study of Serum C-Reactive Protein and Colorectal Cancer Risk in Men. Cancer Res. 2006, 66, 2483–2487. [Google Scholar] [CrossRef] [Green Version]
  52. Shiu, Y.-C.; Lin, J.-K.; Huang, C.-J.; Jiang, J.-K.; Wang, L.-W.; Huang, H.-C.; Yang, S.-H. Is C-Reactive Protein a Prognostic Factor of Colorectal Cancer? Dis. Colon Rectum 2008, 51, 443–449. [Google Scholar] [CrossRef] [PubMed]
  53. Siemes, C.; Visser, L.E.; Coebergh, J.-W.W.; Splinter, T.A.; Witteman, J.C.; Uitterlinden, A.G.; Hofman, A.; Pols, H.A.; Stricker, B.H. C-Reactive Protein Levels, Variation in the C-Reactive Protein Gene, and Cancer Risk: The Rotterdam Study. J. Clin. Oncol. 2006, 24, 5216–5222. [Google Scholar] [CrossRef] [PubMed]
  54. Khandavilli, S.D.; Ceallaigh, P.Ó.; Lloyd, C.J.; Whitaker, R. Serum C-reactive protein as a prognostic indicator in patients with oral squamous cell carcinoma. Oral Oncol. 2009, 45, 912–914. [Google Scholar] [CrossRef] [PubMed]
  55. Jablonska, E.; Piotrowski, L.; Grabowska, Z. Serum Levels of IL-lβ, IL-6, TNF-α, sTNF-RI and CRP in Patients with oral cavity cancer. Pathol. Oncol. Res. 1997, 3, 126–129. [Google Scholar] [CrossRef]
Figure 1. (A) Distribution of risk scores calculated by the built models to predict disease-free survival (DFS) and (B) hematogenous recurrence. The red horizontal lines represent the negative log of 0.05. The risk scores distributed above the red lines demonstrate statistical significance. The red vertical arrows indicate the risk scores with the smallest p-values in each model. These risk scores were used to dichotomize high-risk-score group vs. low-risk-score group in further analysis described in Section 3.3.
Jcm 09 02960 g001
Figure 2. (A) Box-plots of risk scores calculated to predict DFS by the built model. Patients were classified according to the conventional risk factors as described in the text (no risk factors, intermediate risk factors, and high risk factors), (B) patients were divided into two groups in each classification according to their calculated risk scores. The Kaplan–Meier analysis of DFS of the patients with no risk factors is represented, (C) Kaplan–Meier analysis of DFS of the patients with intermediate risk factors is represented, (D) Kaplan–Meier analysis of DFS of the patients with high risk factors is represented, (EH) the same analyses were performed to predict hematogenous recurrence, which also demonstrated similar patterns as the analyses for DFS.
Jcm 09 02960 g002
Figure 3. (A) The concordance index (C-index) of overall recurrence, (B) overall survival, and (C) hematogenous recurrence calculated each by the known prognostic factors only and the known prognostic factors with CBC profiles added. The yellow boxes-and-whiskers represent the C-index calculated by the known prognostic factors only and the green boxes-and-whiskers represent the C-index calculated by the known prognostic factors with CBC profiles added. The blue dotted lines represent the C-index value of 0.5, scores under which indicate that the model is no better than chance results. Cross validation based on bootstrap resamplinggenerated ranges of C-index represented in each figure.
Jcm 09 02960 g003
Table 1. Descriptive statistics of the patients.
Total (N = 1443)
Age (years)48(41–57)
 FIGO stage
 IB1/IIA1274(88.3%)
 IB2167(11.6%)
 Missing data2(0.1%)
Histology
 Squamous cell carcinoma1089(75.5%)
 Adenocarcinoma277(19.2%)
 Adenosquamous carcinoma75(5.2%)
 Missing data2(0.1%)
Lymphovascular space invasion
 Negative791(54.8%)
 Positive562(38.9%)
 Missing data90(6.2%)
Depth of stromal invasion
 Superficial 1/3445(30.8%)
 Middle 1/3380(26.3%)
 Deeper 1/3577(40.0%)
 Missing data41(2.8%)
Depth of stromal invasion
 Superficial 1/2642(44.5%)
 Deeper 1/2758(52.5%)
 Missing data43(3.0%)
Lymph node metastasis
 No lymph node metastasis1177(81.6%)
 Pelvic lymph node metastasis239(16.6%)
 Para-aortic lymph node metastasis22(1.5%)
 Missing data5(0.3%)
Parametrial invasion
 Negative1323(91.7%)
 Positive116(8.0%)
 Missing data4(0.3%)
Resection margin free
 Resection margin negative1381(95.7%)
 Resection margin (carcinoma in situ)16(1.1%)
 Resection margin (cancer)44(3.0%)
 Missing data2(0.1%)
Tumor size (cm)2.7(1.6–4.0)
White blood cell (×1000 cells/mm3)6.2(5.2–7.5)
Lymphocyte (×10%)1.9(1.5–2.3)
Monocyte (×10%)0.4(0.3–0.5)
Neutrophil (×1000 cells/mm2)3.6(2.7–4.6)
Glucose (milligrams/deciliter)100.0(91.0–111.0)
Hemoglobin (grams/deciliter)12.7(11.8–13.4)
Platelet (×10,000 cells/mm2)25.2(21.5–29.8)
Neutrophil-lymphocyte ratio (NLR)1.9(1.4–2.6)
Platelet-lymphocyte ratio (PLR)13.5(10.6–17.0)
FIGO: International Federation of Gynecology and Obstetrics.
Table 2. Results of multivariate analysis to predict overall recurrence (disease free survival, DFS).
Hazard Ratio95% Confidence Intervalp-Value
Lower LimitUpper Limit
Lymphocyte0.740.550.990.046
Platelet1.031.011.050.009
Table 3. Results of multivariate analysis to predict hematogenous recurrence.
Hazard Ratio95% Confidence Intervalp-Value
Lower LimitUpper Limit
WBC §0.600.410.880.010
Neutrophil1.661.112.490.014
Platelet1.051.021.080.002
§ WBC: white blood cell.

