Article

Tumor Immune Microenvironment Clusters in Localized Prostate Adenocarcinoma: Prognostic Impact of Macrophage Enriched/Plasma Cell Non-Enriched Subtypes

1
Department of Radiation Oncology, University of Michigan, Ann Arbor, MI 48104, USA
2
Department of Urology, Northwestern University, Chicago, IL 60611, USA
3
Department of Radiation Oncology, UCSF, San Francisco, CA 94143, USA
4
Veterans Affair Ann Arbor Healthcare System, University of Michigan, Ann Arbor, MI 48104, USA
*
Author to whom correspondence should be addressed.
These authors contributed equally to this manuscript.
J. Clin. Med. 2020, 9(6), 1973; https://doi.org/10.3390/jcm9061973
Submission received: 27 May 2020 / Revised: 11 June 2020 / Accepted: 23 June 2020 / Published: 24 June 2020
(This article belongs to the Special Issue Advances in the Diagnosis and Treatment for Prostate Cancer)

Abstract

:
Background: Prostate cancer (PCa) is characterized by significant heterogeneity in its molecular, genomic, and immunologic characteristics. Methods: Whole transcriptome RNAseq data from The Cancer Genome Atlas of prostate adenocarcinomas (n = 492) was utilized. The immune microenvironment was characterized using the CIBERSORTX tool to identify immune cell type composition. Unsupervised hierarchical clustering was performed based on immune cell type content. Analyses of progression-free survival (PFS), distant metastases, and overall survival (OS) were performed using Kaplan–Meier estimates and Cox regression multivariable analyses. Results: Four immune clusters were identified, largely defined by plasma cell, CD4+ Memory Resting T Cells (CD4 MR), and M0 and M2 macrophage content (CD4 MRHighPlasma CellHighM0LowM2Mid, CD4 MRLowPlasma CellHighM0LowM2Low, CD4 MRHighPlasma CellLowM0HighM2Low, and CD4 MRHighPlasma CellLowM0LowM2High). The two macrophage-enriched/plasma cell non-enriched clusters (3 and 4) demonstrated worse PFS (HR 2.24, 95% CI 1.46–3.45, p = 0.0002) than the clusters 1 and 2. No metastatic events occurred in the plasma cell enriched, non-macrophage-enriched clusters. Comparing clusters 3 vs. 4, in patients treated by surgery alone, cluster 3 had zero progression events (p < 0.0001). However, cluster 3 patients had worse outcomes after post-operative radiotherapy (p = 0.018). Conclusion: Distinct tumor immune clusters with a macrophage-enriched, plasma cell non-enriched phenotype and reduced plasma cell enrichment independently characterize an aggressive phenotype in localized prostate cancer that may differentially respond to treatment.

1. Introduction

Globally, there were 358,989 deaths from prostate cancer (PCa) in 2018, and there are expected to be 378,553 deaths from PCa in 2020 [1,2]. Despite the largely favorable survival rates for non-metastatic patients, the disease is characterized by an important heterogeneity from molecular, genomic and ultimately clinical standpoints [3,4,5]. Historically, standard clinicopathological factors including prostatic specific antigen (PSA), T category, Gleason score, and various combinations of these factors have been used for risk stratification and management decisions. Yet, increasing evidence has shown that these parameters are not accurate prognosticators for patients with newly diagnosed PCa [6,7]. There remains a need to develop more effective risk-stratification tools and predictive biomarkers to guide treatment. The advent of rapid sequencing technologies has opened the door across oncology to more precise targeting of treatment modalities tailored to specific patient subgroups.
The tumor immune microenvironment (TIME) has been shown to have prognostic significance and implications for therapeutic response in many different cancers [8,9,10]. The heterogeneity of tumors’ molecular and cellular composition is exacerbated during the progression of the cancer, creating complexity in the cellular and noncellular components of the tumor niche—the tumor microenvironment (TME). This complexity may relate to spatial and temporal phenomena, polarization of cellular phenotypes due to plasticity, and genomic or epigenomic instability [11,12]. Cell types across the immune system may be found within the TIME, but depending on varying molecular signals, the same immune cell type may promote or inhibit tumor progression [13,14]. This implies the multifactorial nature of the TIME, involving the interplay between antigen presentation, immune activation and immune suppression.
Cancer cells with inherent genetic instability form abnormal proteins that have not been previously recognized by the immune system, and these proteins become immunogenic antigens (neoantigens) that can trigger CD8+ T-cell responses via macrophage presentation or spontaneously. Cancer cells that present immunogenic neoantigens are eliminated from the host through the process of immune surveillance [15]. Cancers then promote an immune-suppressive TIME in which immune-suppressing cells, including tumor-associated macrophages (TAMs), regulatory T (Treg) cells, and MDSCs exist. Although prognostic implications of TIME composition have been demonstrated for breast, lung, liver, pancreatic, gastrointestinal cancers, and malignant melanoma [16], in PCa there is emerging data for the heterogeneous impact of specific cell types [17]. Given the complex interplay of the immunologic composition, we sought to characterize the presentation and clinical outcomes of discrete immune clusters in localized PCa, and to test whether these TIME subtypes inform prognosis.

2. Experimental Section

2.1. Study Design

We conducted a retrospective analysis of patients with histological diagnosis of prostate adenocarcinoma (PRAD) in the TCGA database. Samples came from institutions across Australia, Brazil, Canada, Georgia, Germany, Moldova, Romania, Russia, the United States, Vietnam, and Yemen. Each patient with clinical and genomic data was independently reviewed by two authors (N.K.J. and M.W.F.). Patients with metastatic disease at the time of diagnosis were not included in the study.

2.2. Clustering Based on Immune Cell Subpopulations

The CIBERSORT “in silico flow cytometry” tool was used to quantify the relative levels of distinct immune cell types in the TCGA PRAD dataset [18]. A mixture file containing the RNA Seq by Expression Maximization (RSEM) gene expression data from the samples in the TCGA PRAD dataset was downloaded from the cBioPortal and formatted according to the guidelines outlined in the CIBERSORT manual [19,20]. The LM22 signature genes file was used as a reference point for comparison. LM22 contains 547 genes that accurately distinguish 22 mature human hematopoietic populations and activation states, including seven T cell types, naïve and memory B cells, plasma cells, NK cells and myeloid subsets. The LM22 file was constructed from the gene expression profiles of those cell types measured on Affy U133A/Plus2 and Illumina Expression BeadChip (HumanHT-12 v4) platforms. By default, CIBERSORT estimates the relative fraction of each cell type in the sample, such that the sum of all relative fractions for each of the 22 cell subsets is equal to 1 for the sample. Designations of “High” and “Low” were created using median expression values based on the relative fractions of each cell type in the total cohort. CIBERSORT was also used to produce a quantitative score that measures the overall abundance of each cell type. The absolute immune fraction score was compared across cell types and samples.
The package “ComplexHeatmap” was downloaded from Bioconductor [21]. Unsupervised hierarchical clustering was performed by sample rather than by cell type. The clustering distance metric was set to maximum distance between rows, and the clustering method was the Ward’s minimum variance. The dataset was divided into four clusters based on visual interpretation of the immune cell subpopulation distribution, minimizing intracluster heterogeneity. Sample IDs corresponding to each cluster were extracted for further analysis.

2.3. Survival Analysis of Clusters

The primary outcome in our analysis was progression-free survival (PFS), defined as the time from pathologic diagnosis to the first occurrence of a new tumor, including biochemical recurrence (BCR), locoregional recurrence (LRR), distant metastases (DM), or death. Overall survival (OS) was also evaluated and defined as the time from pathologic diagnosis to death or loss to follow-up, as defined by the TCGA study group. Treatment details including timing and dose of radiation was obtained from the Firebrowse web tool [22]. Patients still alive were censored at the time of last follow-up. Each endpoint was assessed using the Kaplan–Meier method, and survival curves were compared using the Mantel–Cox log-rank test. Survival analysis was carried out using the survminer R package (R Foundation for Statistical Computing Version 3.6.2, Vienna, Austria) [23]. Log-rank p-value and risk tables are displayed on each chart.

2.4. Retrieving Raw Count Data

The “TCGAbiolinks” package was downloaded from Bioconductor [24,25,26]. The GDC query function was used to retrieve Illumina HiSeq RNA data from primary tumors in the TCGA PRAD dataset and the data were downloaded using the GDCdownload function. Raw count data were normalized, and low count genes were filtered according to the default 25% quantile across all samples. The table of normalized and filtered raw count data was extracted for use in downstream analysis.

2.5. Statistical Analysis

Clinical, pathologic, and molecular characteristics were compared between clusters using statistical methods in R using a chi-square test. The Kaplan–Meier method was used to compare endpoints across clusters with the log-rank test. To determine the influence of immunologic and clinicopathologic covariates on PFS, a multivariable Cox regression analysis was performed. Statistical significance was set at p < 0.05.

3. Results

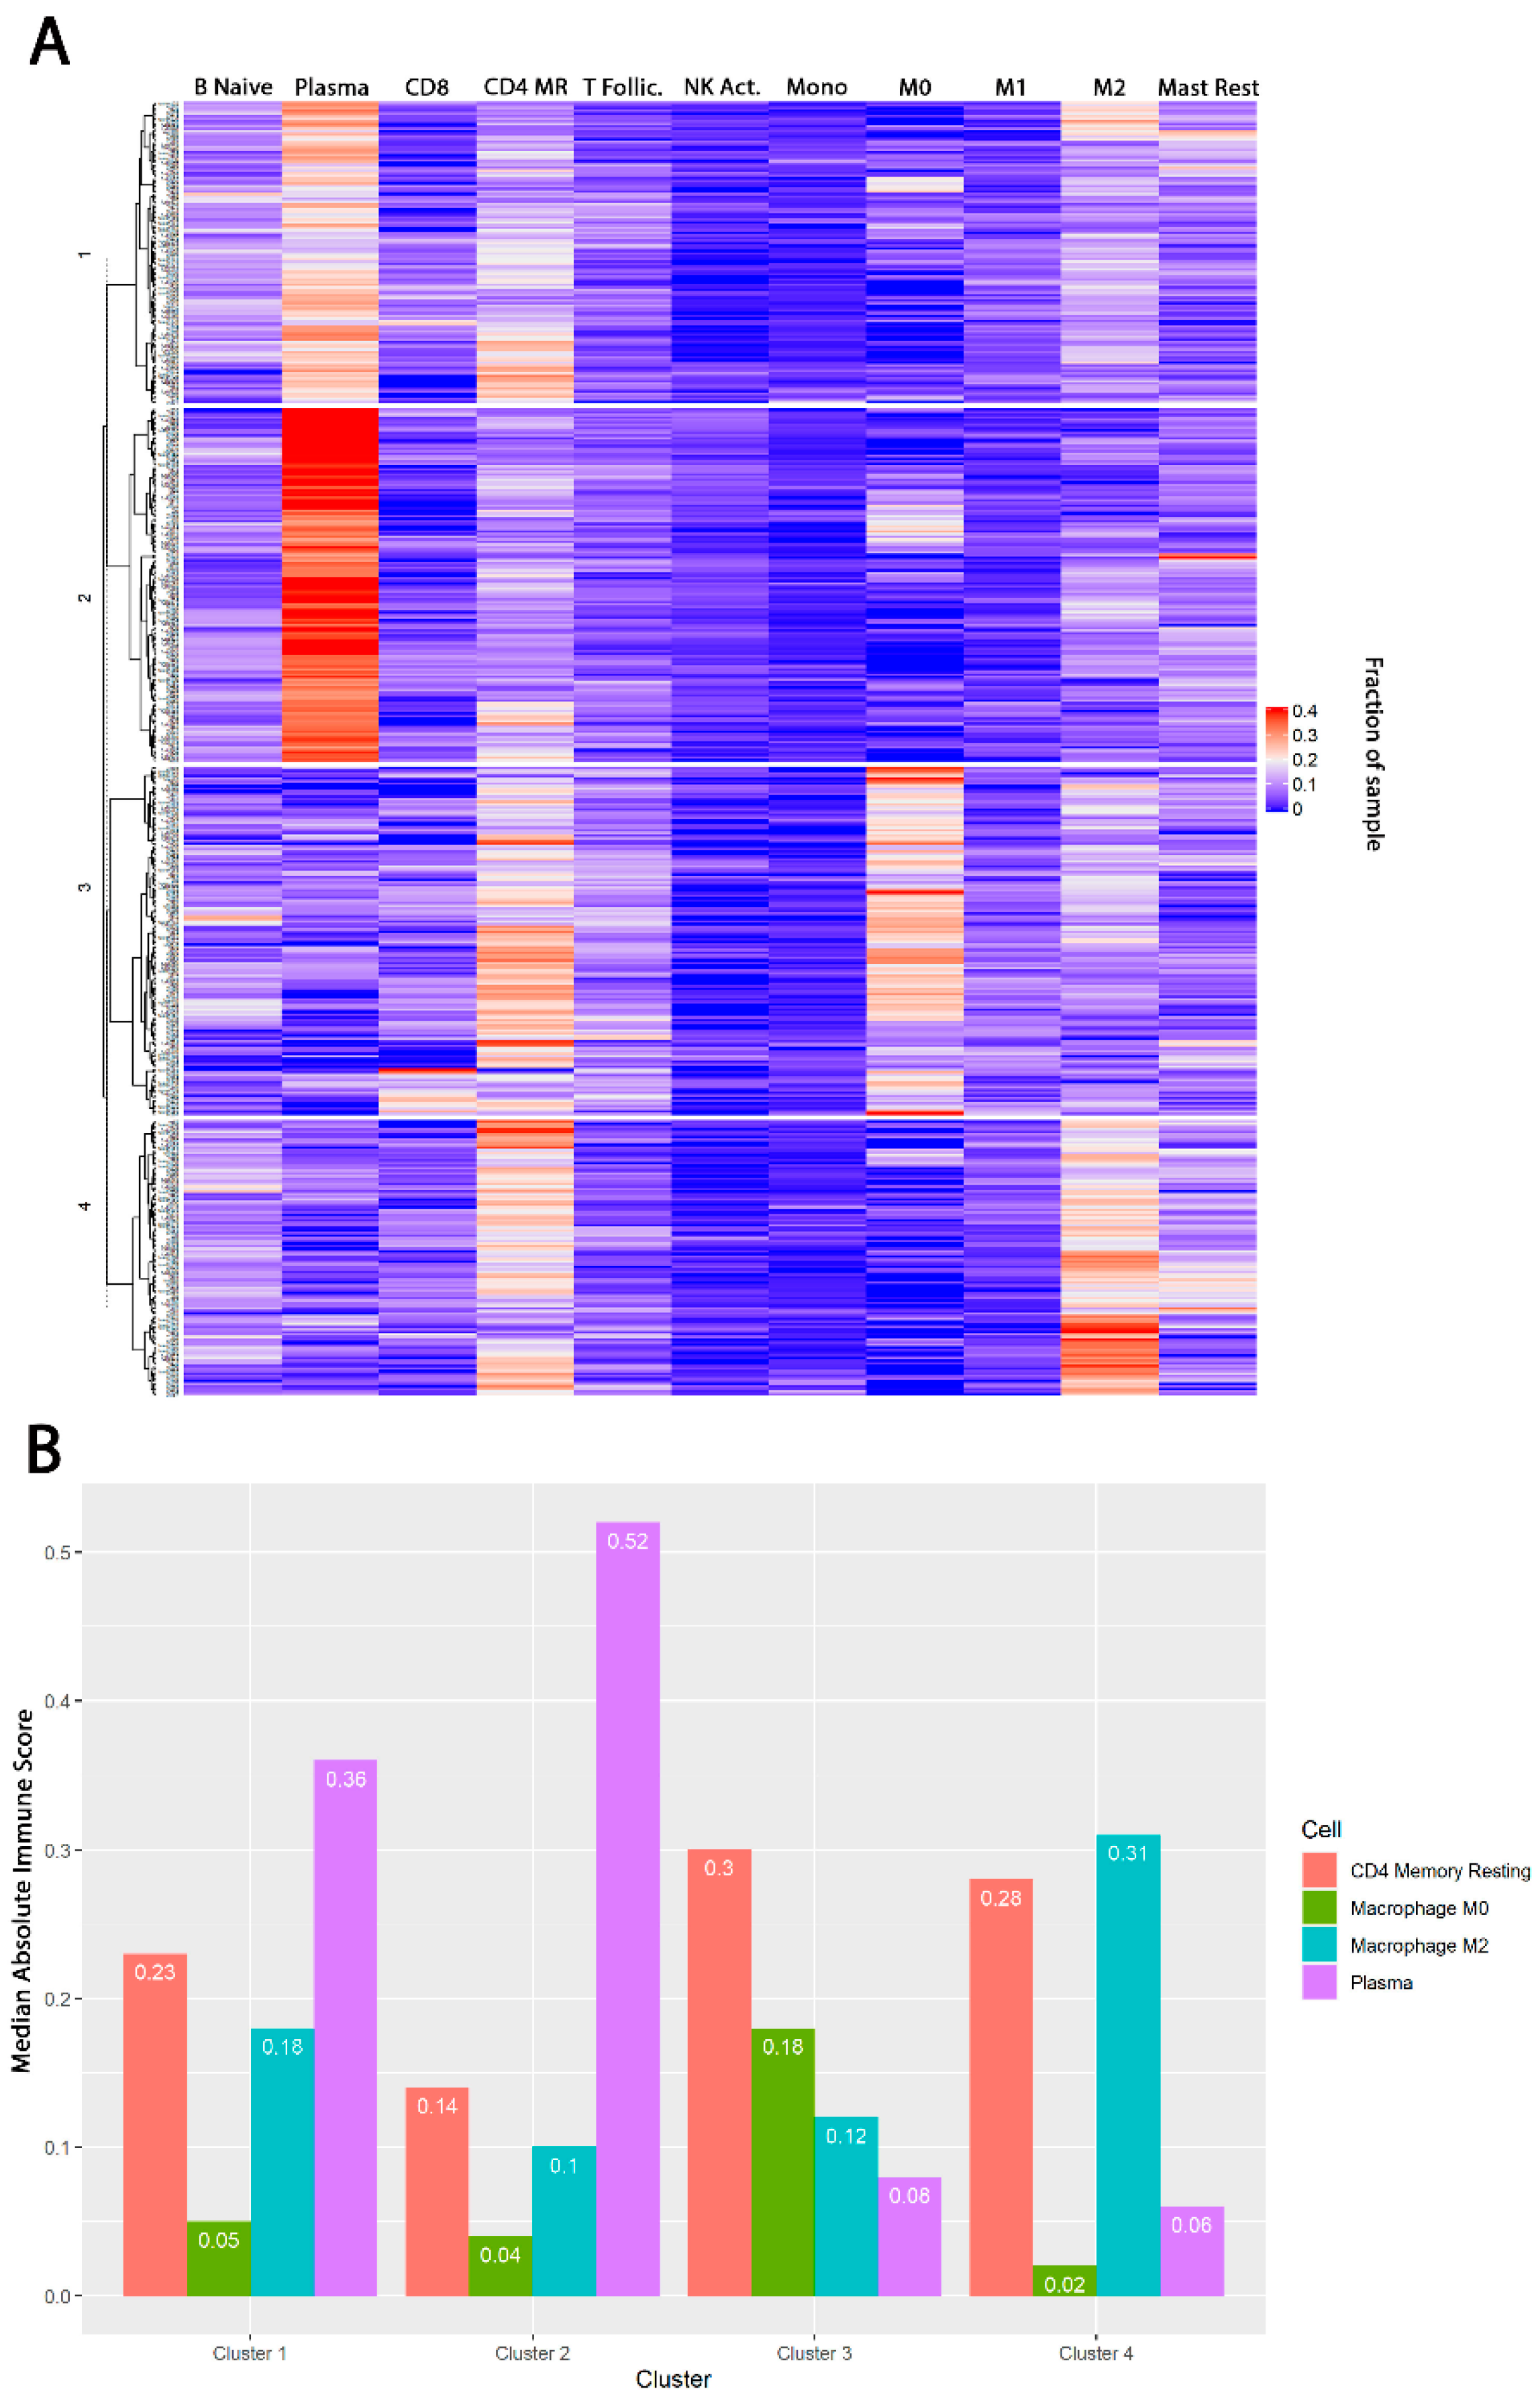
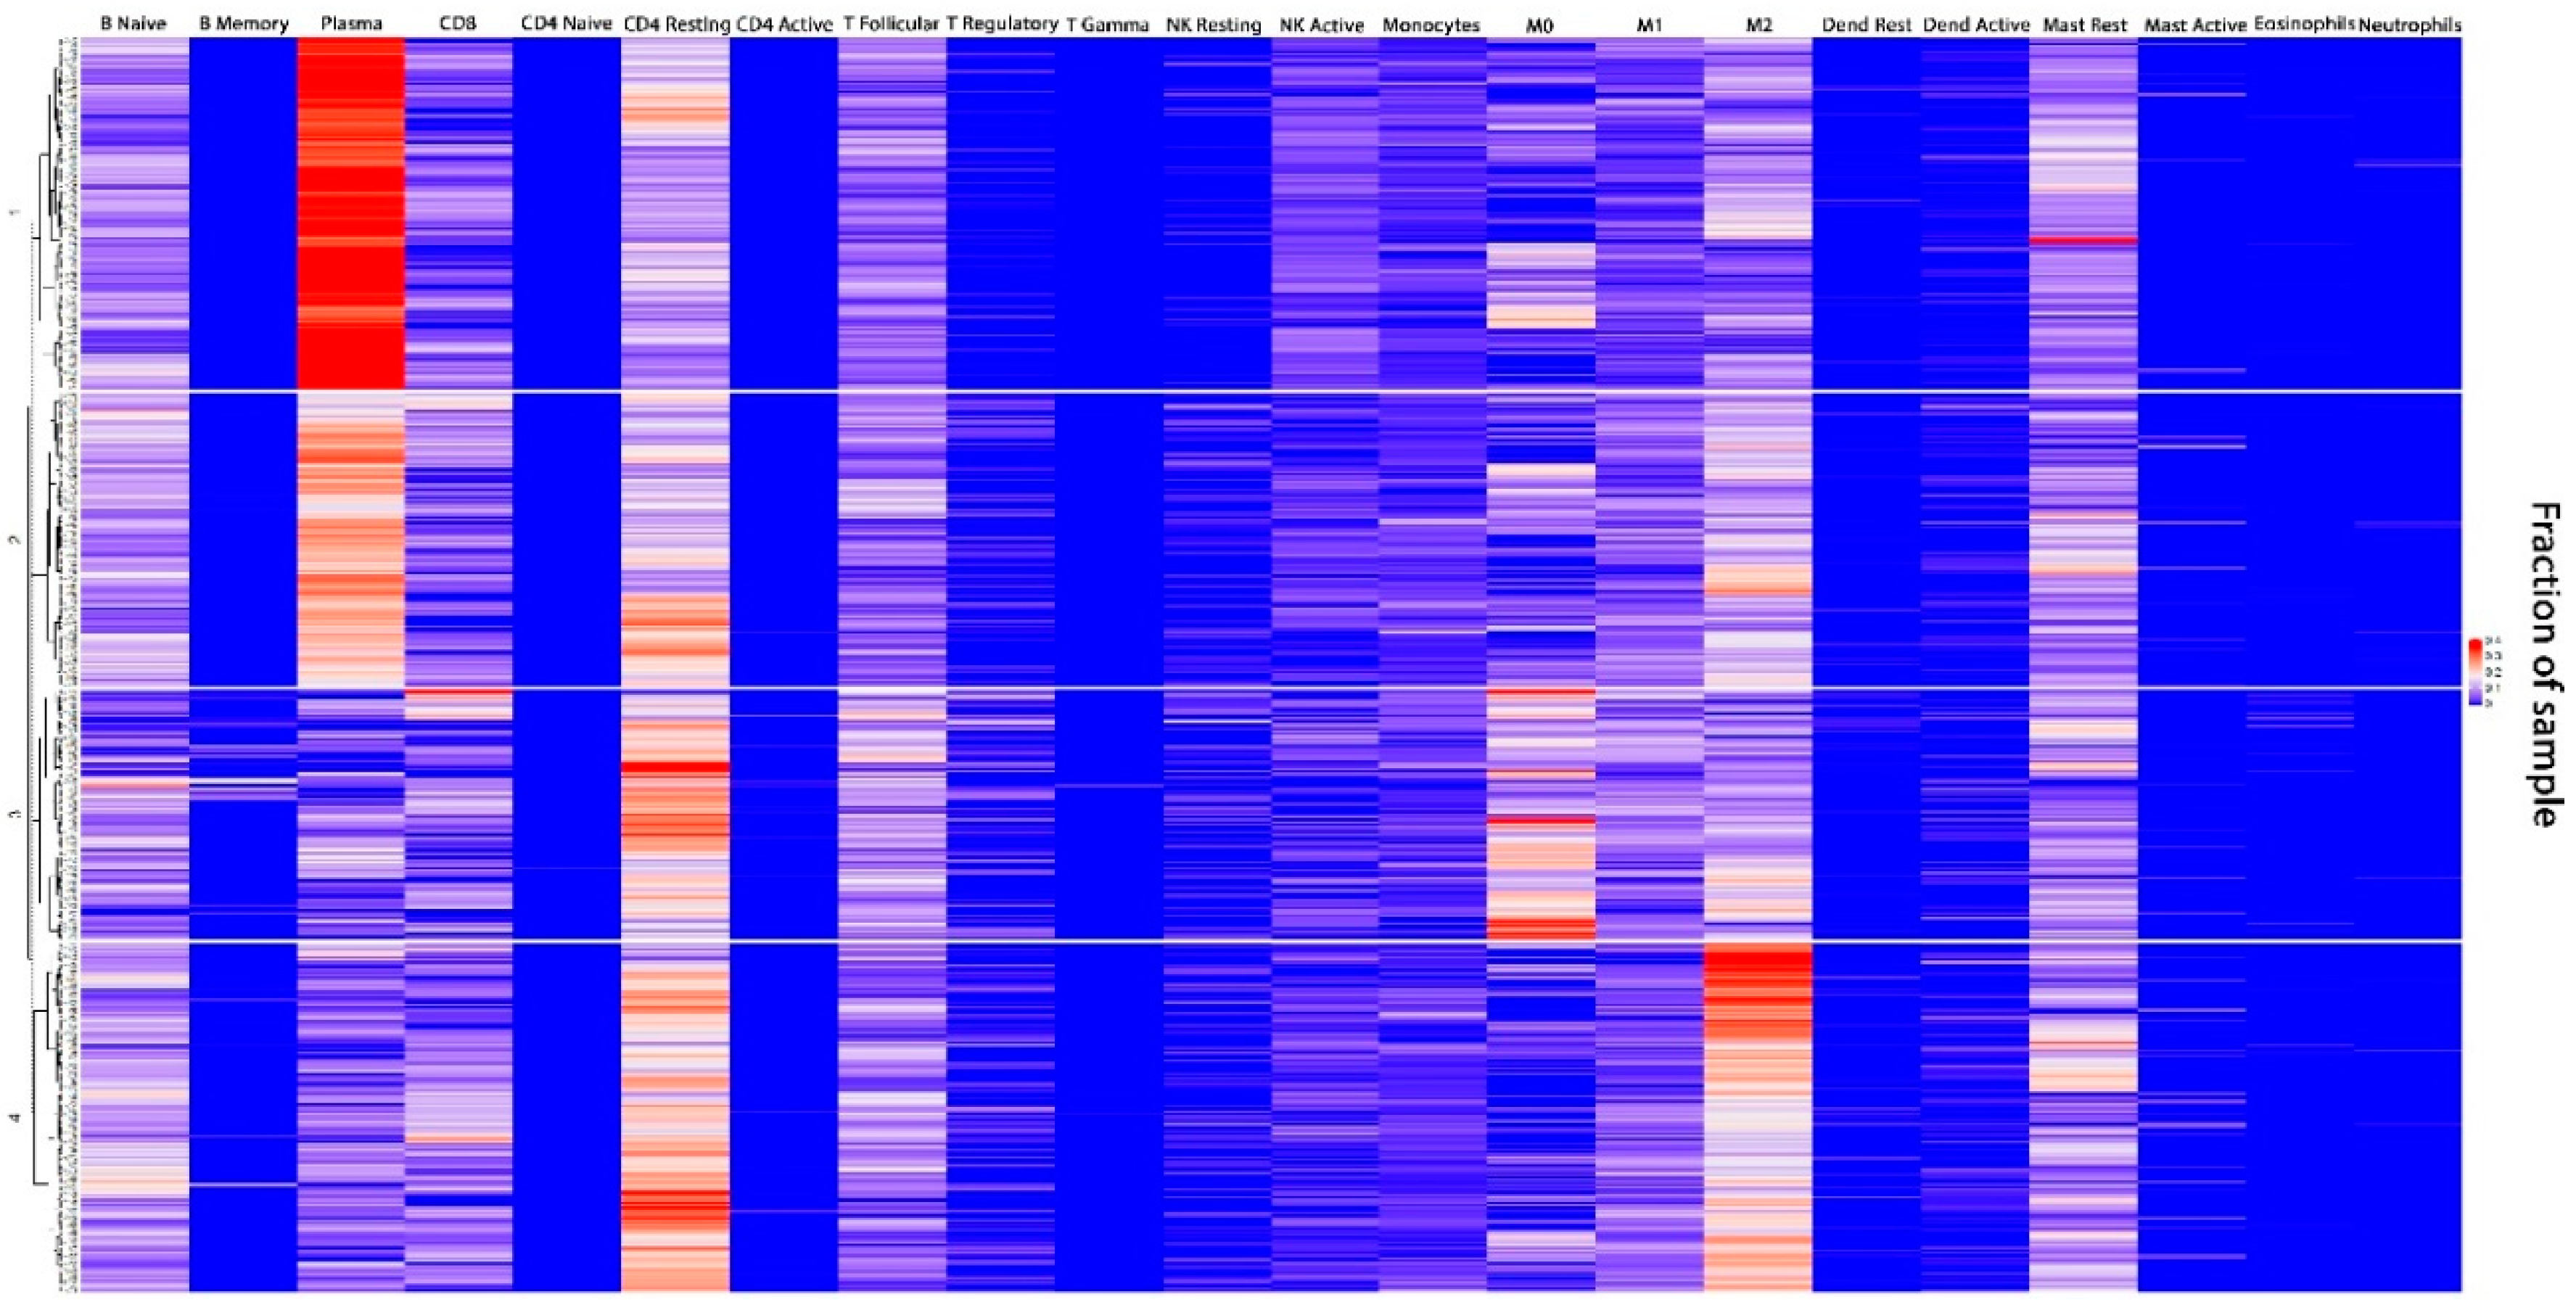
3.1. TIME Clustering

Patients were divided into four distinct clusters based on the relative fractions of immune cell subsets within the TIME; 139 (28.0%) patients were grouped into cluster 1 (CD4 Memory Resting T cell [CD4 MR]HighPlasma CellHighM0LowM2Mid), 115 (23.2%) in cluster 2 (CD4 MRLowPlasma CellHighM0LowM2Low), 112 (22.6%) in cluster 3 CD4 MRHighPlasma CellLowM0HighM2Low), and 126 (25.4%) into cluster 4 (CD4 MRHighPlasma CellLowM0LowM2High) (Figure 1A). The absolute immune cell infiltration in each cluster was determined by the CIBERSORT absolute immune score output and displayed in Figure 1B. Pairwise t-tests were conducted to confirm significant differences between cell types between clusters (Table A1). All clusters demonstrated significantly different levels of each type of immune cell infiltrate (p < 0.05) except for M0 macrophages in clusters 1 versus 2 (p = 0.937) and CD4 MR in clusters 3 vs 4 (p = 0.46). Only immune cell subsets with non-zero median expression were displayed in Figure 1. Full unsupervised hierarchical clustering for 22 immune cell subsets can be visualized in Figure A1.

3.2. Baseline Demographic and Treatment Details by TIME Cluster

Complete demographic variables by cluster can be seen in Table 1. Patients in the macrophage enriched/plasma cell non-enriched clusters (3 and 4) had higher rates of Gleason 8–10 (25%, 29%, 52%, and 60% for clusters 1–4), high risk disease (30%, 34%, 46%, 48% for clusters 1–4), and older age (60, 61, 63, and 65 years old) compared to plasma cell high subtypes (clusters 1 and 2). TMPRSS2:ERG fusion status was similar across clusters, as was predominant tumor location within the prostate gland. Post-operative radiotherapy (adjuvant or salvage) was more common in the macrophage enriched/plasma cell non-enriched clusters (13%, 15%, 25%, 23% for clusters 1–4), as was salvage hormone therapy or chemotherapy (9%, 14%, 22%, 20% for clusters 1–4). Post-operative radiotherapy dose was similar across clusters (66–70 Gy).

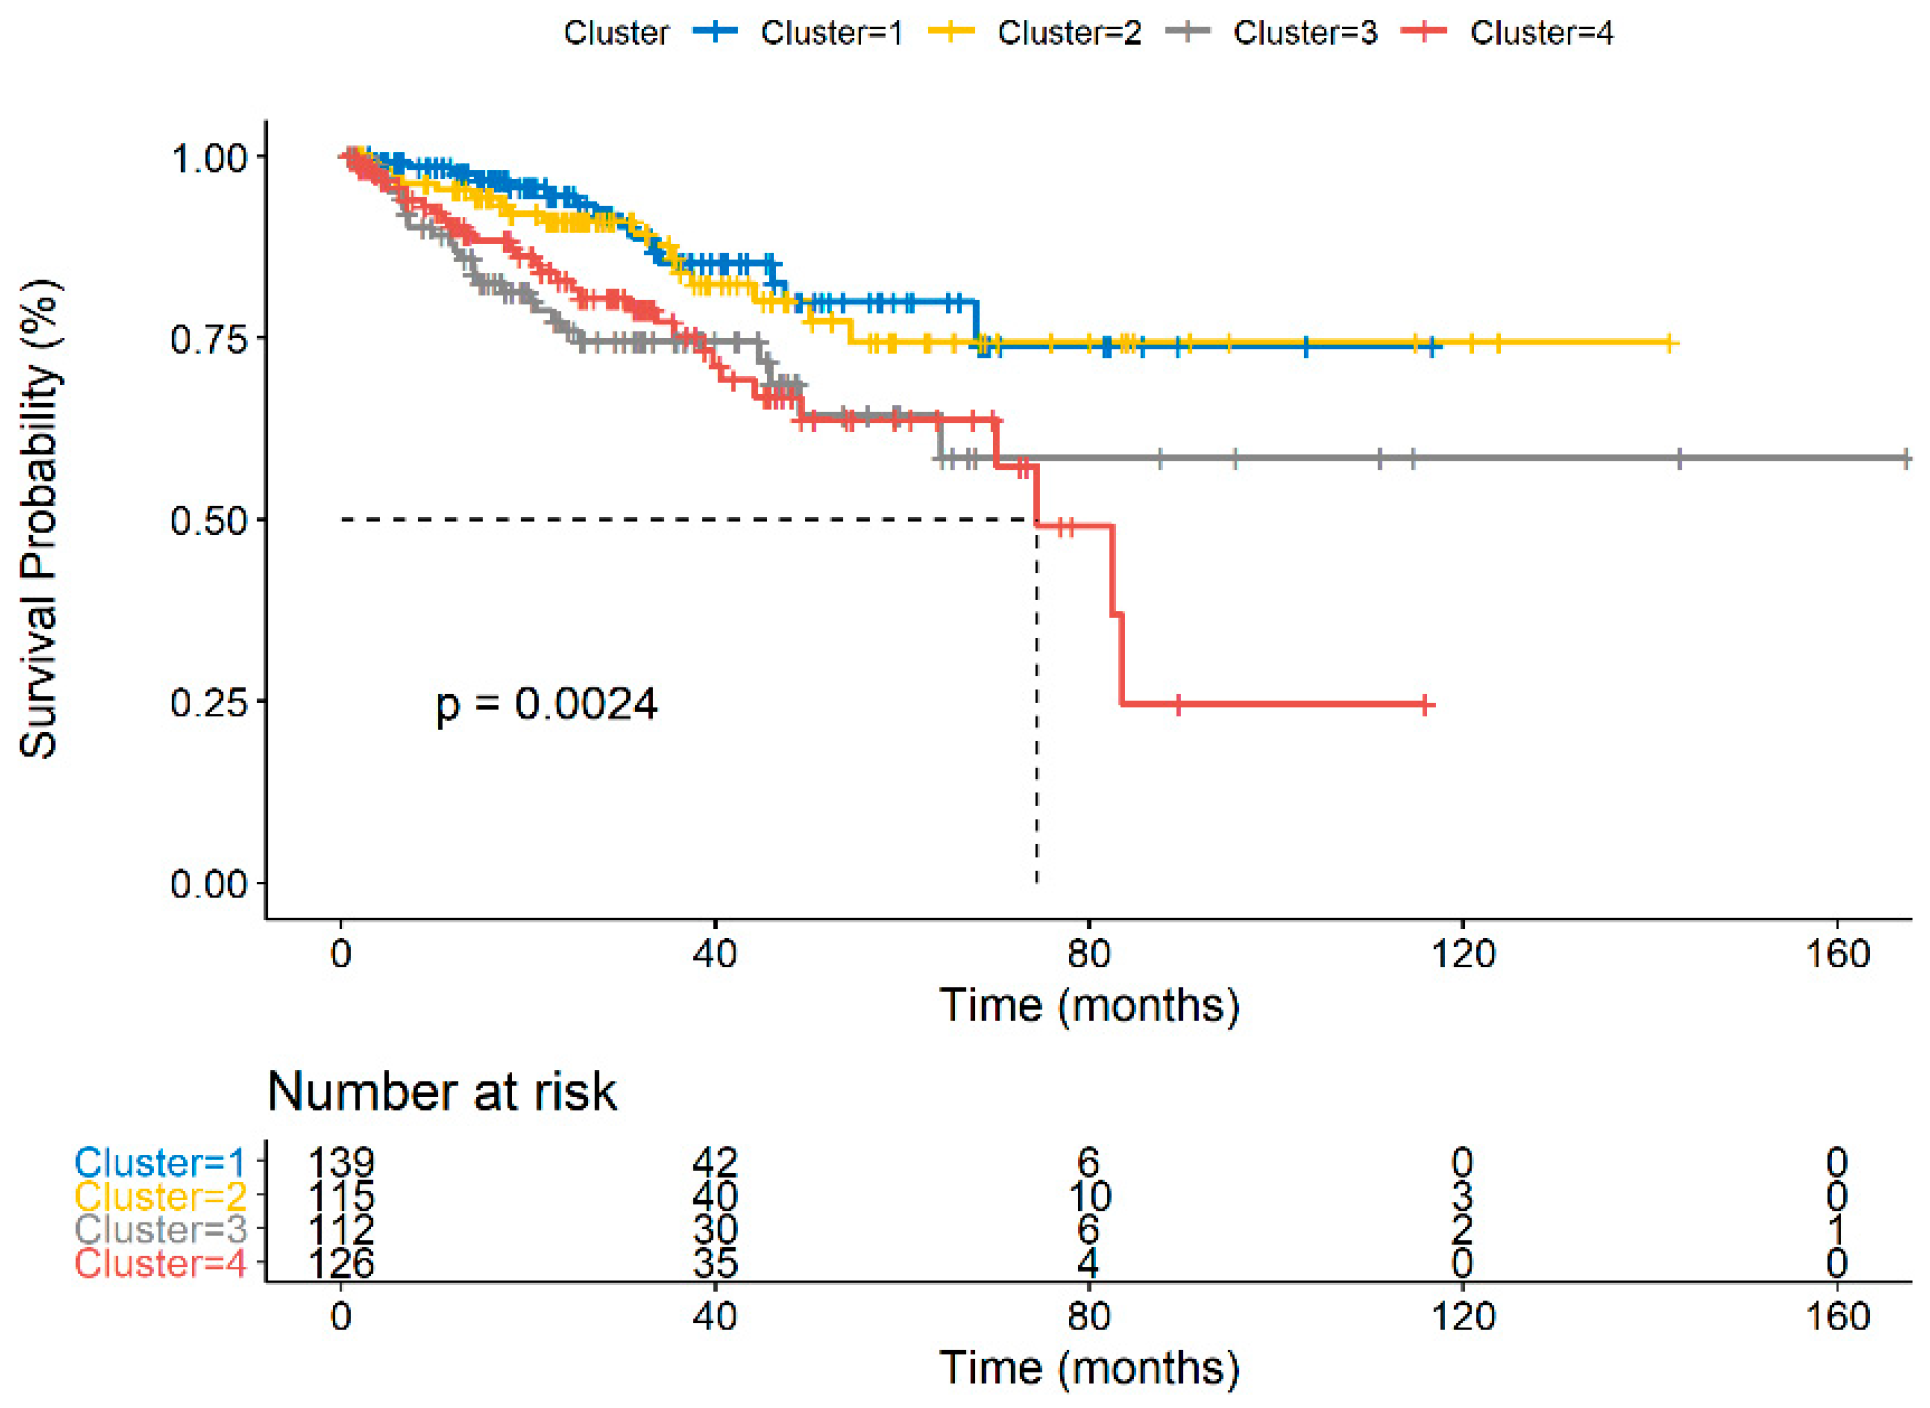
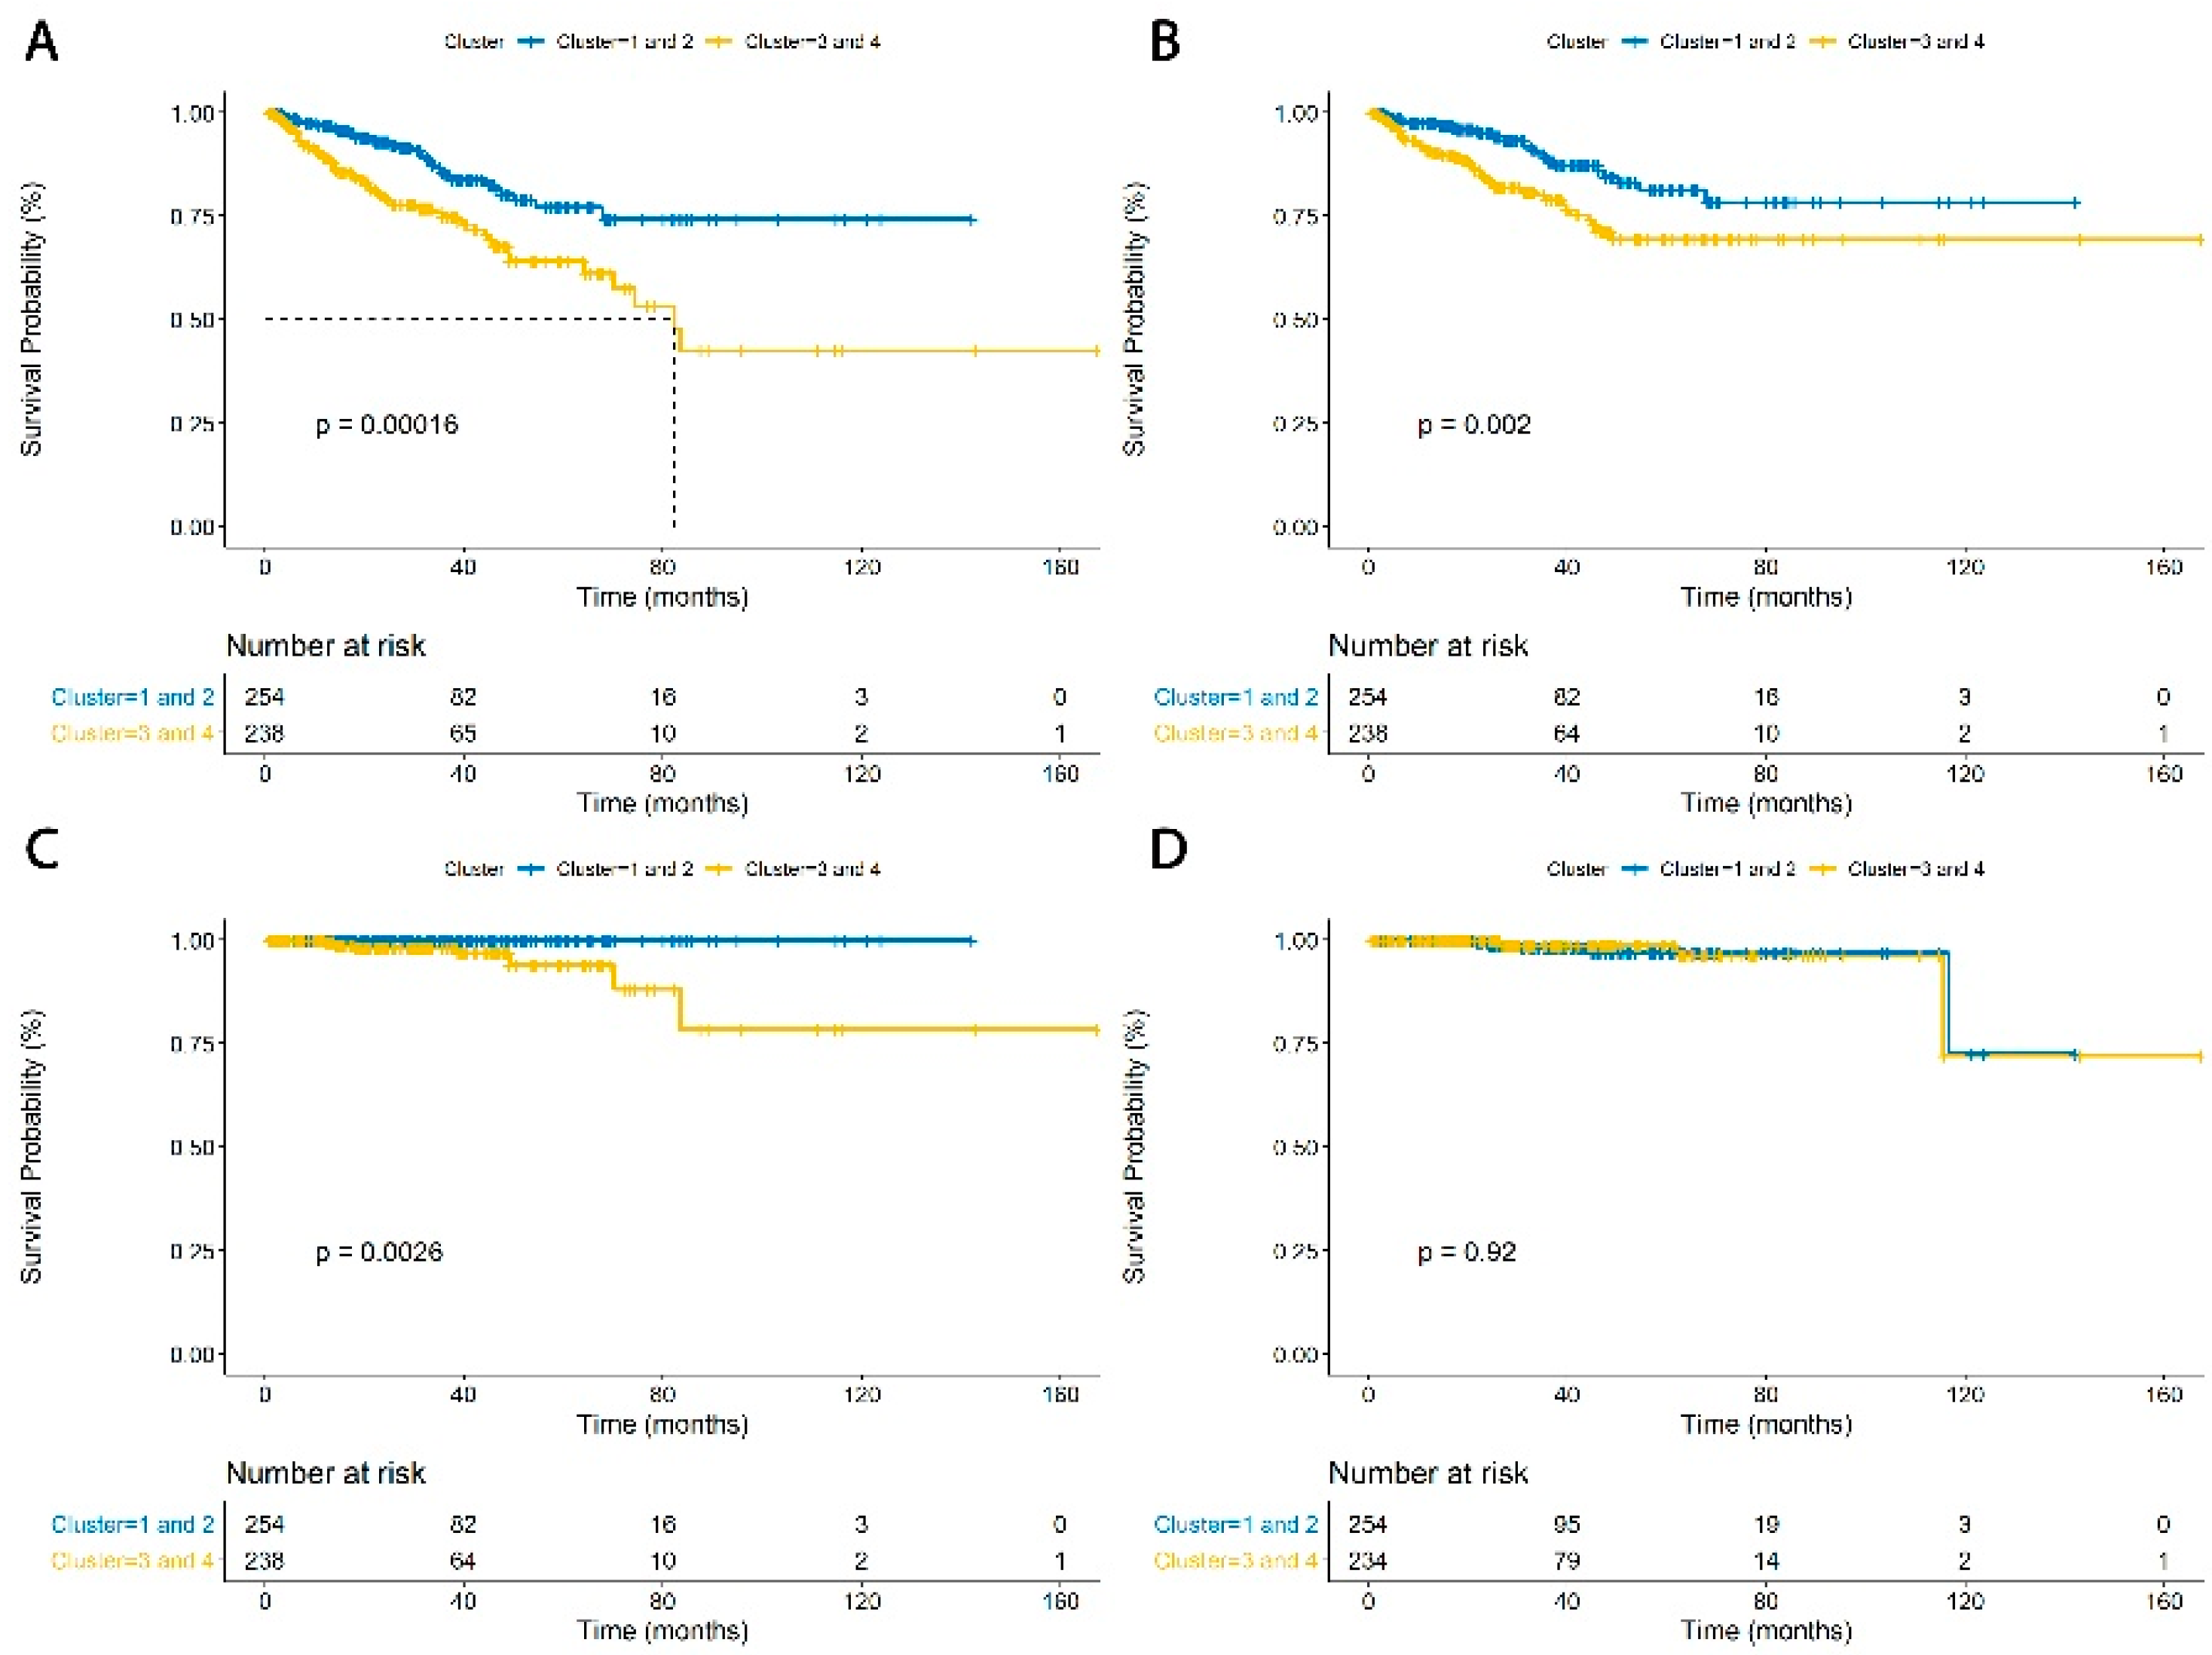
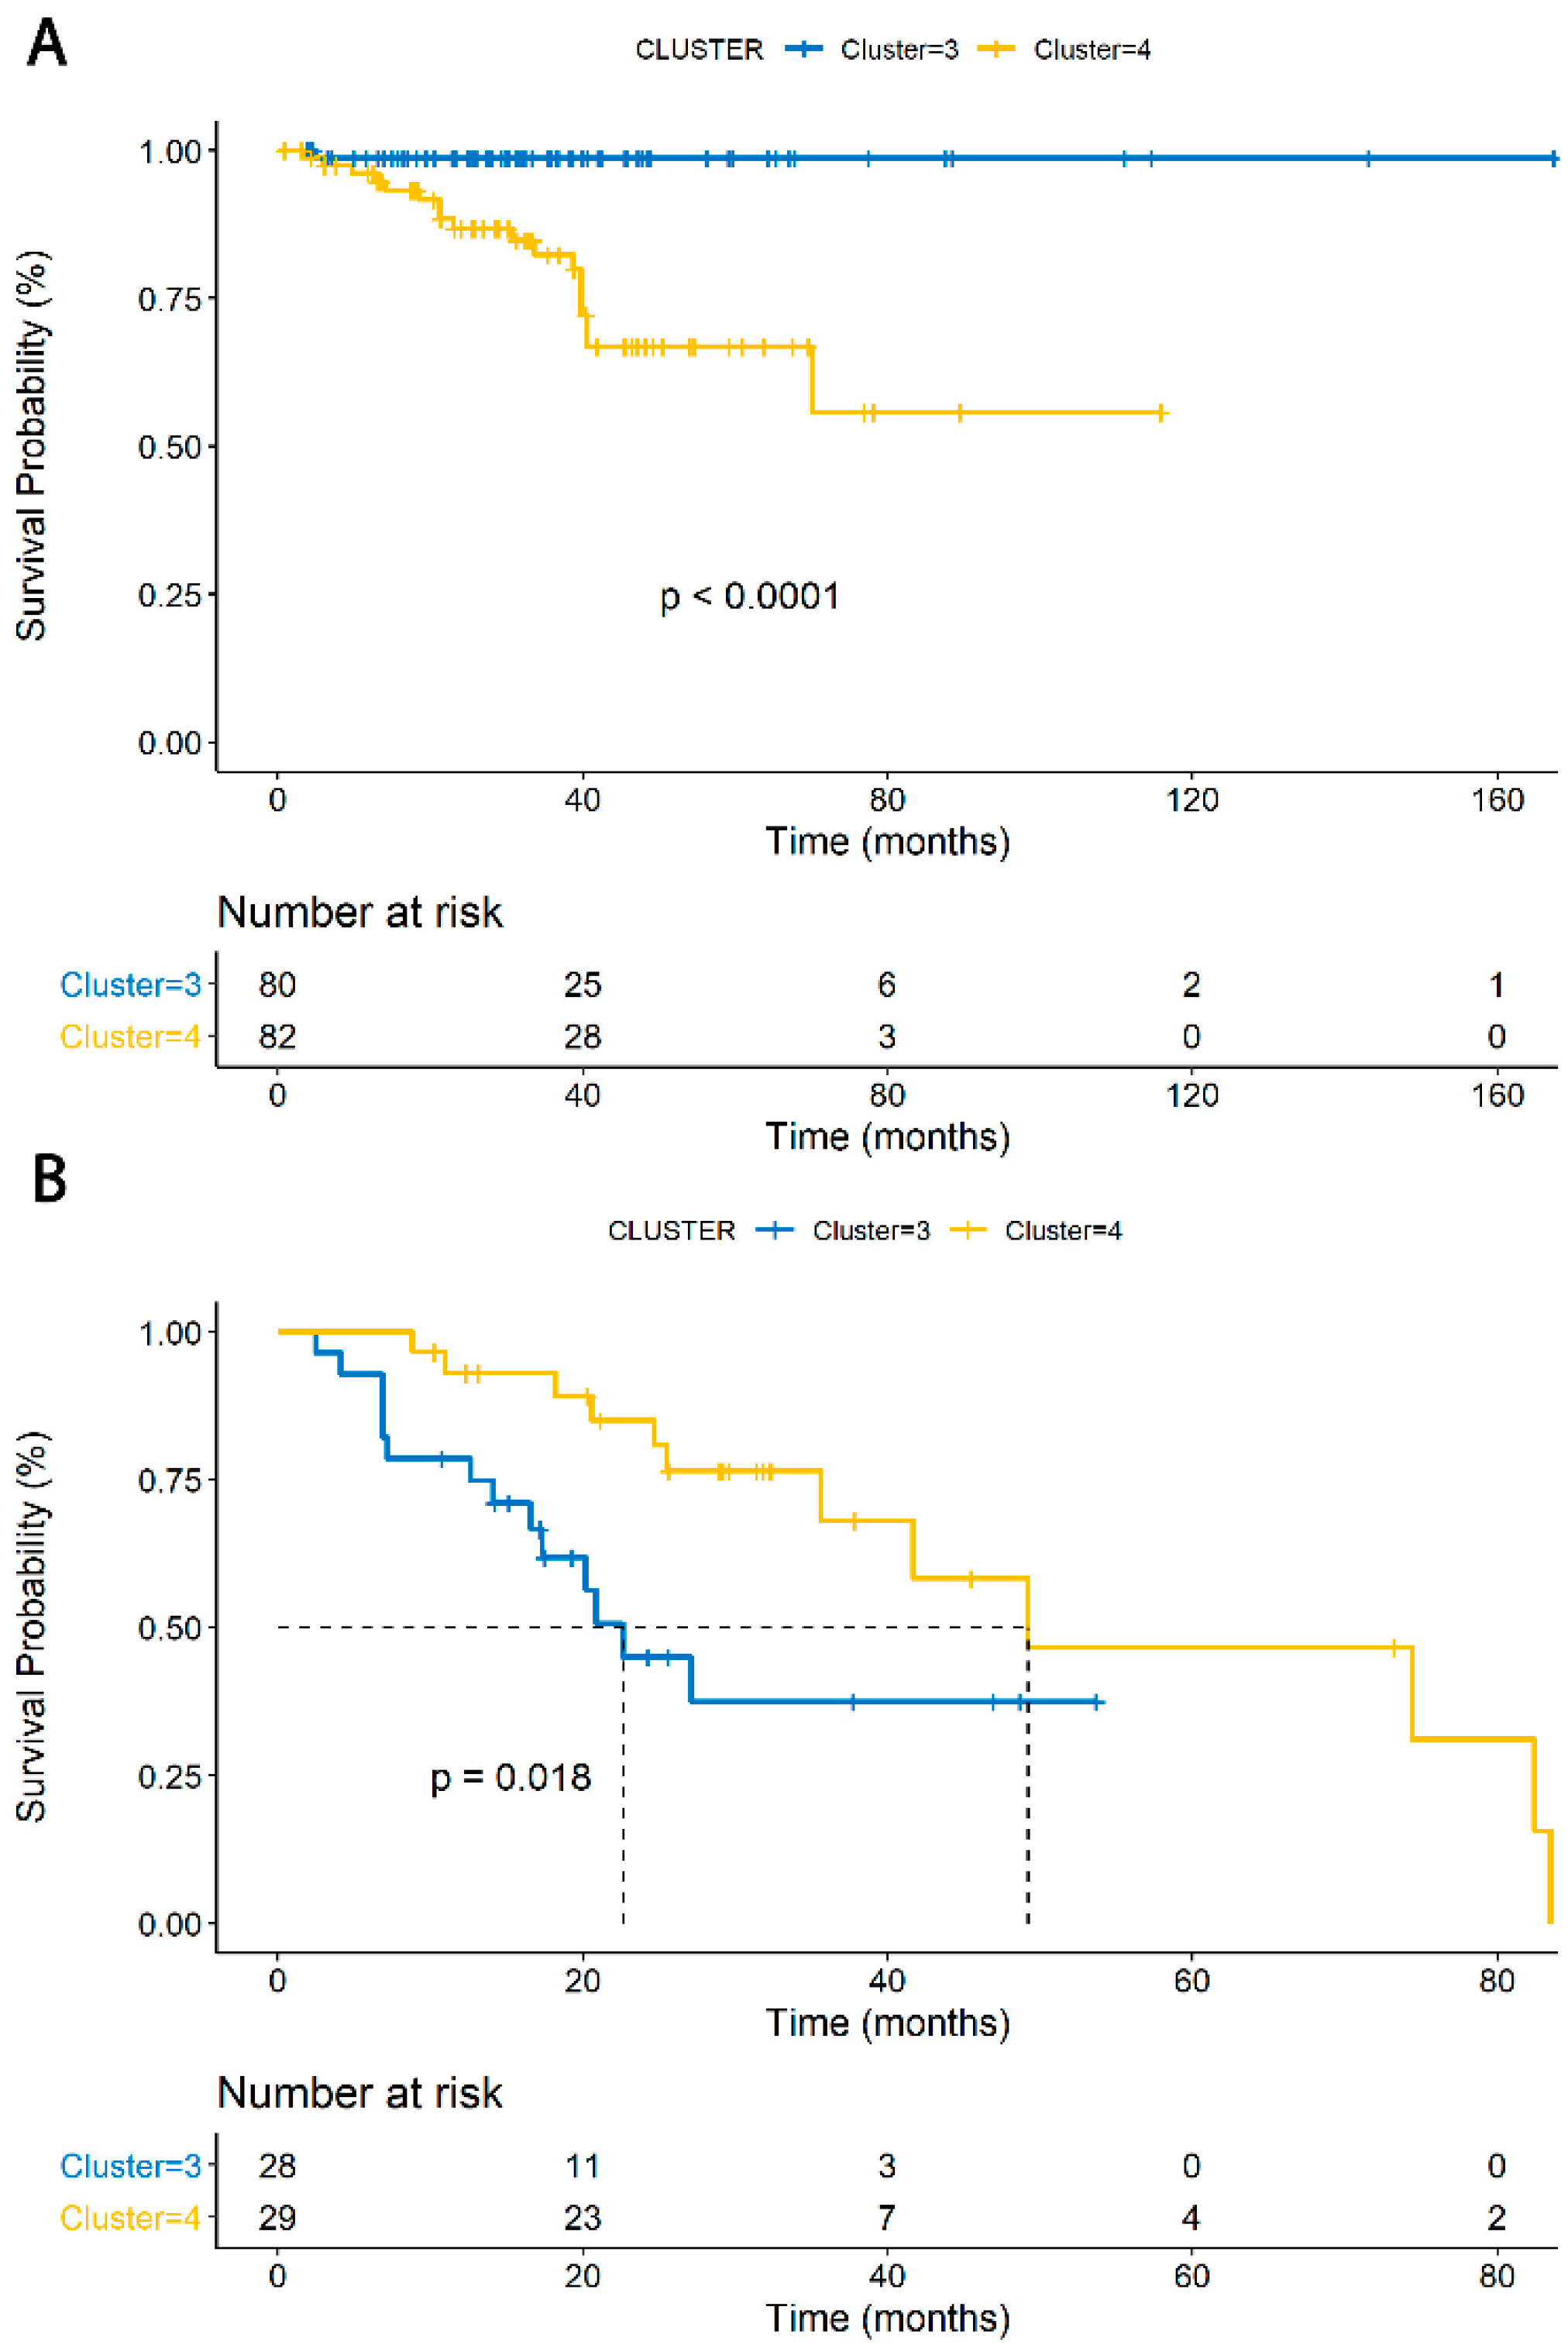
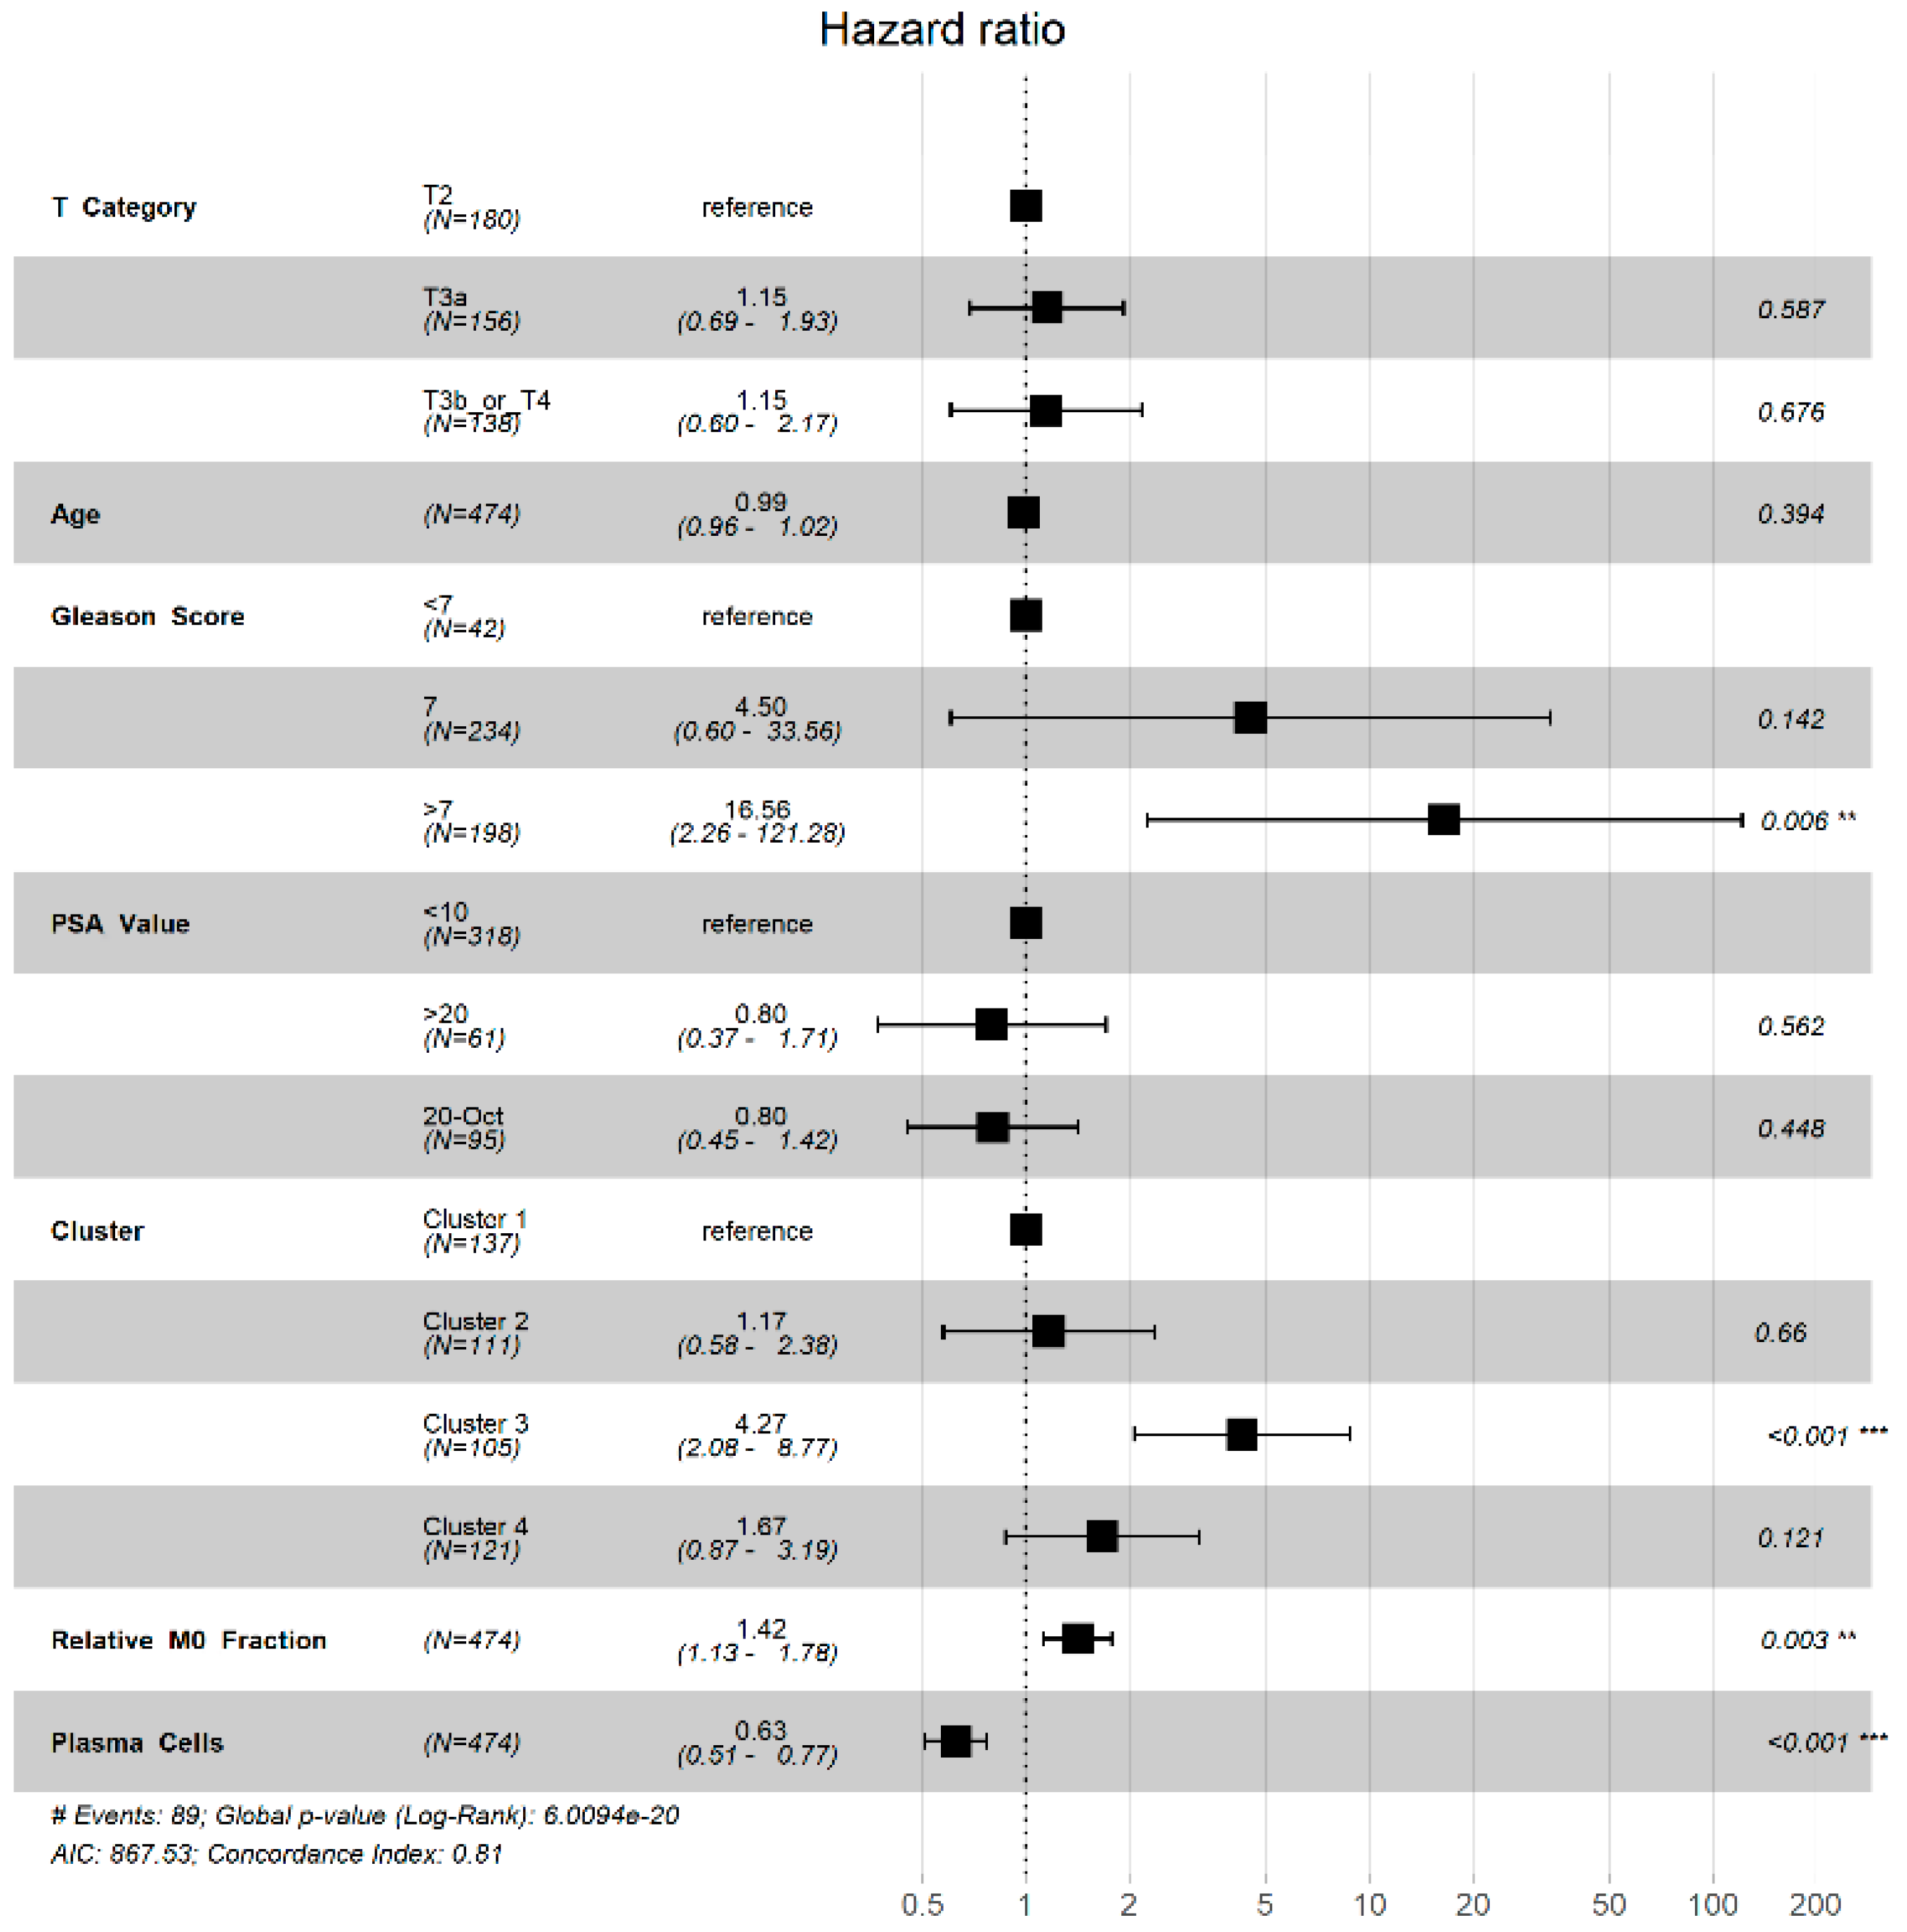
3.3. TIME Cluster Prognostic Effect

The median follow-up time for all patients was 31 months and was similar across clusters (28, 34, 31, and 31 months for clusters 1-4, respectively). Overall, 9 patients (1.8%) had died at the time of this study due to their prostate cancer, and 82 (16.5%) had recurrence of their disease. Of those that recurred, 68 (13.7%) had a BCR, 7 (1.4%) had LRR, and 7 (1.4%) had DM.
The primary endpoint of the study, PFS, was analyzed for each cluster using Kaplan–Meier estimates and compared using the log-rank test. PFS, or median time from pathologic diagnosis to a new tumor event, defined as BCR, LRR, DM, or death was 29.5 months in cluster 1, 30.1 months in cluster 2, 23.1 months in cluster 3, and 26.1 months in cluster 4 (global p-value < 0.0001, Figure 2). The two clusters with the poorest performance in the PRAD cohort were clusters 3 and 4, as demonstrated by pairwise comparisons, both of which uniquely expressed a macrophage-enriched and plasma cell non-enriched phenotype in comparison to clusters 1 and 2.
When clusters 3 and 4 were pooled and compared to clusters 1 and 2, clusters 3 and 4 (macrophage enriched/plasma cell non-enriched) had shorter PFS (HR 2.24, 95% CI 1.46–3.45, p = 0.0002, Figure 3A), increased BCR (HR 2.13, 95% CI 1.30–3.48, p = 0.0026, Figure 3B), DM (all metastatic events occurred only in clusters 3 and 4, p < 0.0001, Figure 3C) and no significant difference in OS (HR 0.932, 95% CI 0.249–3.49, p = 0.917, Figure 3D). These results indicate a poorer PFS and OS in patients who have tumors with macrophage-enriched and plasma cell non-enriched phenotypes.
Subgroup analyses were then performed on clusters 3 and 4. When comparing PFS for only patients receiving surgery in cluster 3 vs. 4, cluster 4 displayed significantly worse PFS (HR 18.1, 95% CI 2.41–135.5, p < 0.0001, Figure 4A). This serves to demonstrate a poor prognosis correlated with M2 macrophages in PRAD. In contrast, when isolating only patients who received surgery and radiation, cluster 3 displayed a poorer prognosis, with median PFS of 29.2 months in cluster 4 and 20 months in cluster 3 (HR 0.37, 95% CI 0.157–0.864, p = 0.0217), Figure 4B). This indicates a correlation between patients with M0-enriched phenotypes and poorer PFS with radiation therapy. A test for interaction revealed no significant interaction for the outcome of PFS in the fitted Cox regression analysis between treatment groups and clusters (p = 0.5640).
After establishing that macrophage-enriched, plasma cell non-enriched PCa offers the poorest prognosis of the immune subpopulations, a multivariable analysis was performed to determine the independent prognostic impact of TIME clusters on PFS (Figure 5). Only patients with complete clinical data were included in the multivariable analysis. Cluster 3 (cluster 1 was reference, HR 4.27, 95% CI 2.08–8.77, p < 0.001) was independently prognostic for the endpoint of PFS. Cluster 4 trended towards also having independently worse prognosis (HR 1.67, 95% CI 0.87–3.19, p = 0.121), but did not reach statistical significance. Relative fraction of M0 macrophages in the tumor sample was independently prognostic for PFS (HR 1.42 per 0.1 unit increase, 95% CI 1.13–1.72, p = 0.019), while an increased relative fraction of plasma cells seemed to demonstrate a protective effect (HR 0.63 per 0.1 unit increase, 95% CI 0.51–0.77, p < 0.001). Tumor-associated macrophages, particularly M0 macrophages, and plasma cells appear to exert significant yet opposite effects on tumor progression and recurrence in PRAD, which converge to create the poor prognosis seen in cluster 3.

4. Discussion

In this retrospective analysis of whole-exome sequenced samples, we characterized the landscape of the TIME in localized PCa and identified four distinct immune clusters that are defined by four cell types. The two clusters (3 and 4) with low plasma cell content and expression of macrophages (M0 and M2, respectively) had worse outcomes compared to the plasma cell enriched clusters (1 and 2). M0 macrophages are plastic cells that can change their phenotype, potentially shifting toward pro-tumor TAMs, under the influence of environmental signals such as radiation damage [27]. In PCa, TAMs and other myeloid subsets are known to constitute up to 70% of tumor immune subsets, and they are known to influence tumor progression through angiogenesis, tumor cell proliferation, control over adaptive immunity, and metastasis formation [28,29,30,31,32,33,34]. Other studies have shown that TAMs confer poor prognosis in prostate cancer, likely through their ability to promote metastasis and progression through the CCL2-CCR2 and CCL22-CCR4 axes [17,35,36,37,38]. For this reason, TAMs have been an attractive target of therapy in cancer patients, and strategies to deplete these cell populations have been investigated in the clinical setting [31,39,40]. However, the reported overall benefit from these therapies has been negative to date [41]. This may be due to the extreme plasticity of these cells, as TAMs may be either pro-tumoral or anti-tumoral, and blunting the pro-tumoral effects may be offset by the depletion of anti-tumoral macrophage populations [41].
In this analysis, an abundance of plasma cells is significantly associated with better prognosis in the TCGA PRAD cohort. A meta-analysis of 21 studies of primary tumors concerning of the role of plasma cells in various cancers recently demonstrated the positive prognostic value of plasma cells in a number of cancer types, including breast, colorectal, lung, ovarian, gastric, hepatocellular, and pancreatic cancers, as well as melanoma [42]. However, this same analysis revealed that the histologic subtype of plasma cells is an important consideration in determining prognosis, a nuance that this analysis may not adequately capture. Another recent study recapitulated these findings, determining through CIBERSORT analysis that plasma cells are significant predictors of favorable survival across solid tumors in general [43]. Our analysis supports the findings of previous studies in classifying plasma cells as significant predictors of favorable prognosis in PRAD.
There is growing interest in immunoradiotherapy. A recent study found PD-L2, a checkpoint inhibitor targeting PD-1, to have significant interaction with predicted radiation therapy response [17]. Another recent study demonstrated that radiation therapy may lead to the polarization of macrophages toward the immunosuppressive, pro-tumoral phenotype [44]. In fact, both in vitro and in vivo experiments have demonstrated that TAMs from irradiated tumors support tumor growth and resistance to radiation therapy [45,46]. Thus, strategies for eliminating or inhibiting macrophages in conjunction with radiation therapy have demonstrated enhanced anti-tumor efficacy [47,48]. One animal study conducted in PCa with CSF1R signaling blockade, and one phase 2 clinical trial with sunitinib, did not show significantly improved results over radiation alone [49,50]. These studies did not account for the noncellular components of the TIME that may have influenced these results. To the authors’ knowledge, there are no therapies targeting plasma cells in prostate cancer. Our analysis demonstrated that within patients receiving post-operative radiotherapy, cluster 3, dominated by M0 macrophages and demonstrating a paucity of plasma cells, especially has suboptimal outcomes. As has been shown in prior literature, M2 macrophages are correlated with poor prognosis in our dataset, evidenced by the poor PFS of cluster 4 compared to clusters 1 and 2, and compared to cluster 3 in the surgery-only cohort. The M0 macrophage has long been thought to be a bystander in cancer, however we propose a potential role of these cells as harbingers of poor prognosis upon radiation exposure that requires validation. These results support the potential benefit for further research into immunoradiotherapy targeting macrophages and plasma cells in prostate cancer.
Our study is not without limitations. This is a retrospective analysis and is therefore subject to the limitations associated with this exploratory study design. Cell types were approximated through RNAseq algorithms, rather than direct assessment (i.e., immunohistochemistry). The median follow-up in TCGA for PCa is short and the number of events are limited. Thus, smaller effect sizes are likely to not be captured in our analyses.
Our study has built on the previous literature by characterizing immune clusters within localized PCa [17]. Additionally, by characterizing the aggressive nature of macrophage-enriched/plasma cell non-enriched PCa, particularly the prognostic impact of M0 (undifferentiated) macrophages, these results shed light on a potential risk stratification tool and rational subgroups in which to test TIME-based treatment strategies.

Author Contributions

Conceptualization, N.K.J., M.W.F., S.S., R.J., M.D.G., R.T.D., W.C.J., A.B.W., E.M.S., S.G.Z., F.Y.F., I.E.N, D.E.S.; methodology, N.K.J., M.W.F., S.S., R.J., M.D.G., R.T.D., W.C.J., A.B.W., E.M.S., S.G.Z., F.Y.F., I.E.N, D.E.S.; software, R Foundation for Statistical Computing, V 3.6.2, Venice, Austria; validation, N.K.J., M.W.F., S.S., R.J., I.E.N., D.E.S.; formal analysis, M.W.F. and N.K.J.; investigation, N.K.J. and M.W.F.; resources, N.K.J., M.W.F., D.E.S.; data curation, N.K.J. and M.W.F.; writing—original draft preparation, N.K.J., M.W.F. and S.S.; writing—review & editing, N.K.J., M.W.F., S.S., R.J., M.D.G., R.T.D., W.C.J., A.B.W., E.M.S., S.G.Z., F.Y.F., I.E.N, D.E.S.; visualization, N.K.J., R.J., and M.W.F.; supervision, I.E.N and D.E.S.; project administration, D.E.S.; funding acquisition, N.K.J., D.E.S. All authors have read and agreed to the published version of the manuscript.

Funding

This research was funded the National Institute of Health T35 grant number HL007690-35 (NKJ), P50 CA186786 (DES), and the Prostate Cancer Foundation (D.E.S.).

Conflicts of Interest

The authors declare no conflict of interest except as listed below: Daniel E. Spratt- funding from Janssen, personal fees from Janssen, Blue Earth, AstraZeneca. Felix Y. Feng- personal fees from Astellas, Bayer, BlueEarth Diagnostics, Celgene, Clovis, EMD Serono, Genentech, Janssen, Myovant, Ryovant, and Sanofi, and is a co-founder and has an ownership stake in PFS Genomics, patent applications with Decipher biosciences on molecular signatures in prostate cancer unrelated to this work, for a molecular signature in breast cancer unrelated to this work and licensed to PFS genomics, and with Celgene unrelated to this work. Shuang G. Zhao—patent applications with Decipher biosciences on molecular signatures in prostate cancer unrelated to this work, for a molecular signature in breast cancer unrelated to this work and licensed to PFS genomics, and with Celgene unrelated to this work.

Appendix A

Figure A1. Supplemental heatmap displaying all clustering data for gene signatures in the TCGA PRAD dataset. Due to the unsupervised nature of the clustering the order of clusters 1 and 2 are interchanged from Figure 1, as is much of the intra-cluster ordering. However, the unique identifiers in each cluster remain the same (rows of the heatmap). Abbreviations: CD8, CD8+ T cells; CD4, CD4+ T cells; T gamma, T cells gamma delta; NK, natural killer cells; Dend Rest, resting dendritic cells; Dend Active, activated dendritic cells; Mast Rest, resting mast cells; Mast Active, activated mast cells.
Jcm 09 01973 g0a1
Table A1. Pairwise t-tests comparing each cluster in the TCGA PRAD cohort, divided by cell type.
M2 MacrophagesM0 Macrophages
Cluster123Cluster123
2<0.0001 *NANA20.937NANA
3<0.0001 *0.075 *NA3<0.0001 *<0.0001 *NA
4<0.0001 *<0.0001 *<0.0001 *40.047 *0.045 *<0.0001 *
Plasma CellsCD4 Memory Resting T Cells
Cluster123Cluster123
2<0.0001 *NANA2<0.0001 *NANA
3<0.0001 *<0.0001 *NA3<0.0001 *<0.0001 *NA
4<0.0001 *<0.0001 *0.018 *4<0.0001 *<0.0001 *0.46
* Denotes significance.

References

  1. Global Cancer Observatory. Cancer Today Data Table. Available online: http://gco.iarc.fr/today/online-analysistable?v=2018&mode=cancer&mode_population=continents&population=900&populations=900&key=asr&sex=0&cancer=39&type=0&statistic=5&prevalence=0&population_group=0&ages_group%5B%5D=0&ages_group%5B%5D=17&group_cancer=1&include_nmsc=1&include_nmsc_other=1 (accessed on 1 May 2020).
  2. Bray, F.; Ferlay, J.; Soerjomataram, I.; Siegel, R.L.; Torre, L.A.; Jemal, A. Global cancer statistics 2018: GLOBOCAN estimates of incidence and mortality worldwide for 36 cancers in 185 countries. CA Cancer J. Clin. 2018, 68, 394–424. [Google Scholar] [CrossRef] [PubMed] [Green Version]
  3. Yadav, S.S.; Stockert, J.A.; Hackert, V.; Yadav, K.K.; Tewari, A.K. Intratumor heterogeneity in prostate cancer. Urol. Oncol. 2018, 36, 349–360. [Google Scholar] [CrossRef] [PubMed]
  4. Beerenwinkel, N.; Antal, T.; Dingli, D.; Traulsen, A.; Kinzler, K.W.; Velculescu, V.E.; Vogelstein, B.; Nowak, M.A. Genetic progression and the waiting time to cancer. PLoS Comput. Biol. 2007, 3, e225. [Google Scholar] [CrossRef] [PubMed]
  5. Liu, A.Y.; Roudier, M.P.; True, L.D. Heterogeneity in primary and metastatic prostate cancer as defined by cell surface CD profile. Am. J. Pathol. 2004, 165, 1543–1556. [Google Scholar] [CrossRef] [Green Version]
  6. Ross, A.E.; D’Amico, A.V.; Freedland, S.J. Which, when and why? Rational use of tissue-based molecular testing in localized prostate cancer. Prostate Cancer Prostatic Dis. 2016, 19, 1–6. [Google Scholar] [CrossRef] [PubMed]
  7. Moschini, M.; Spahn, M.; Mattei, A.; Cheville, J.; Karnes, R.J. Incorporation of tissue-based genomic biomarkers into localized prostate cancer clinics. BMC Med. 2016, 14, 67. [Google Scholar] [CrossRef] [Green Version]
  8. Nagarsheth, N.; Wicha, M.S.; Zou, W. Chemokines in the cancer microenvironment and their relevance in cancer immunotherapy. Nat. Rev. Immunol. 2017, 17, 559–572. [Google Scholar] [CrossRef] [Green Version]
  9. Seager, R.J.; Hajal, C.; Spill, F.; Kamm, R.D.; Zaman, M.H. Dynamic interplay between tumour, stroma and immune system can drive or prevent tumour progression. Converg. Sci. Phys. Oncol. 2017, 3. [Google Scholar] [CrossRef]
  10. Roma-Rodrigues, C.; Mendes, R.; Baptista, P.V.; Fernandes, A.R. Targeting Tumor Microenvironment for Cancer Therapy. Int. J. Mol. Sci. 2019, 20, 840. [Google Scholar] [CrossRef] [Green Version]
  11. Stanta, G.; Bonin, S. Overview on Clinical Relevance of Intra-Tumor Heterogeneity. Front. Med. (Lausanne) 2018, 5, 85. [Google Scholar] [CrossRef] [Green Version]
  12. Wang, M.; Zhao, J.; Zhang, L.; Wei, F.; Lian, Y.; Wu, Y.; Gong, Z.; Zhang, S.; Zhou, J.; Cao, K.; et al. Role of tumor microenvironment in tumorigenesis. J. Cancer 2017, 8, 761–773. [Google Scholar] [CrossRef] [PubMed]
  13. Netea-Maier, R.T.; Smit, J.W.A.; Netea, M.G. Metabolic changes in tumor cells and tumor-associated macrophages: A mutual relationship. Cancer Lett. 2018, 413, 102–109. [Google Scholar] [CrossRef] [PubMed]
  14. Hui, L.; Chen, Y. Tumor microenvironment: Sanctuary of the devil. Cancer Lett. 2015, 368, 7–13. [Google Scholar] [CrossRef] [PubMed]
  15. Schreiber, R.D.; Old, L.J.; Smyth, M.J. Cancer immunoediting: Integrating immunity’s roles in cancer suppression and promotion. Science 2011, 331, 1565–1570. [Google Scholar] [CrossRef] [Green Version]
  16. Nishikawa, H.; Sakaguchi, S. Regulatory T cells in cancer immunotherapy. Curr. Opin. Immunol. 2014, 27, 1–7. [Google Scholar] [CrossRef] [PubMed] [Green Version]
  17. Zhao, S.G.; Lehrer, J.; Chang, S.L.; Das, R.; Erho, N.; Liu, Y.; Sjöström, M.; Den, R.B.; Freedland, S.J.; Klein, E.A.; et al. The Immune Landscape of Prostate Cancer and Nomination of PD-L2 as a Potential Therapeutic Target. JNCI J. Natl. Cancer Inst. 2019, 111, 301–310. [Google Scholar] [CrossRef]
  18. Newman, A.M.; Steen, C.B.; Liu, C.L.; Gentles, A.J.; Chaudhuri, A.A.; Scherer, F.; Khodadoust, M.S.; Esfahani, M.S.; Luca, B.A.; Steiner, D.; et al. Determining cell type abundance and expression from bulk tissues with digital cytometry. Nat. Biotechnol. 2019, 37, 773–782. [Google Scholar] [CrossRef]
  19. Cerami, E.; Gao, J.; Dogrusoz, U.; Gross, B.E.; Sumer, S.O.; Aksoy, B.A.; Jacobsen, A.; Byrne, C.J.; Heuer, M.L.; Larsson, E.; et al. The cBio cancer genomics portal: An open platform for exploring multidimensional cancer genomics data. Cancer Discov. 2012, 2, 401–404. [Google Scholar] [CrossRef] [Green Version]
  20. Gao, J.; Aksoy, B.A.; Dogrusoz, U.; Dresdner, G.; Gross, B.; Sumer, S.O.; Sun, Y.; Jacobsen, A.; Sinha, R.; Larsson, E.; et al. Integrative analysis of complex cancer genomics and clinical profiles using the cBioPortal. Sci. Signal. 2013, 6, pl1. [Google Scholar] [CrossRef] [Green Version]
  21. Gu, Z.; Eils, R.; Schlesner, M. Complex heatmaps reveal patterns and correlations in multidimensional genomic data. Bioinformatics 2016, 32, 2847–2849. [Google Scholar] [CrossRef] [Green Version]
  22. TCGA Firebrowse. Available online: http://firebrowse.org/ (accessed on 16 February 2020).
  23. Kassambara, A.; Kosinski, M.; Biecek, P.; Fabian, S. Drawing Survival Curves Using ’Ggplot2′. R Package. 2016, 4, 2. [Google Scholar]
  24. Mounir, M.; Lucchetta, M.; Silva, T.C.; Olsen, C.; Bontempi, G.; Chen, X.; Noushmehr, H.; Colaprico, A.; Papaleo, E. New functionalities in the TCGAbiolinks package for the study and integration of cancer data from GDC and GTEx. PLoS Comput. Biol. 2019, 15, e1006701. [Google Scholar] [CrossRef] [PubMed] [Green Version]
  25. Silva, C.T.; Colaprico, A.; Olsen, C.; D’Angelo, F.; Bontempi, G.; Ceccarelli, M.; Noushmehr, H. TCGA Workflow: Analyze cancer genomics and epigenomics data using Bioconductor packages. Research 2016, 5, 1542. [Google Scholar]
  26. Colaprico, A.; Silva, T.C.; Olsen, C.; Garofano, L.; Cava, C.; Garolini, D.; Sabedot, T.; Malta, T.M.; Pagnotta, S.M.; Castiglioni, I.; et al. TCGAbiolinks: An R/Bioconductor package for integrative analysis of TCGA data. Nucleic Acids Res. 2016, 44, e71. [Google Scholar] [CrossRef]
  27. Qiu, S.-Q.; Waaijer, S.J.H.; Zwager, M.C.; de Vries, E.G.E.; van der Vegt, B.; Schröder, C.P. Tumor-associated macrophages in breast cancer: Innocent bystander or important player? Cancer Treat. Rev. 2018, 70, 178–189. [Google Scholar] [CrossRef] [Green Version]
  28. Calcinotto, A.; Spataro, C.; Zagato, E.; Di Mitri, D.; Gil, V.; Crespo, M.; De Bernardis, G.; Losa, M.; Mirenda, M.; Pasquini, E.; et al. IL-23 secreted by myeloid cells drives castration-resistant prostate cancer. Nature 2018, 559, 363–369. [Google Scholar] [CrossRef]
  29. Baer, C.; Squadrito, M.L.; Laoui, D.; Thompson, D.; Hansen, S.K.; Kiialainen, A.; Hoves, S.; Ries, C.H.; Ooi, C.-H.; De Palma, M. Suppression of microRNA activity amplifies IFN-γ-induced macrophage activation and promotes anti-tumour immunity. Nat. Cell Biol. 2016, 18, 790–802. [Google Scholar] [CrossRef]
  30. Bingle, L.; Brown, N.J.; Lewis, C.E. The role of tumour-associated macrophages in tumour progression: Implications for new anticancer therapies. J. Pathol. 2002, 196, 254–265. [Google Scholar] [CrossRef]
  31. Guerriero, J.L.; Sotayo, A.; Ponichtera, H.E.; Castrillon, J.A.; Pourzia, A.L.; Schad, S.; Johnson, S.F.; Carrasco, R.D.; Lazo, S.; Bronson, R.T.; et al. Class IIa HDAC inhibition reduces breast tumours and metastases through anti-tumour macrophages. Nature 2017, 543, 428–432. [Google Scholar] [CrossRef]
  32. Kaneda, M.M.; Messer, K.S.; Ralainirina, N.; Li, H.; Leem, C.J.; Gorjestani, S.; Woo, G.; Nguyen, A.V.; Figueiredo, C.C.; Foubert, P.; et al. PI3Kγ is a molecular switch that controls immune suppression. Nature 2016, 539, 437–442. [Google Scholar] [CrossRef] [Green Version]
  33. Mantovani, A.; Schioppa, T.; Porta, C.; Allavena, P.; Sica, A. Role of tumor-associated macrophages in tumor progression and invasion. Cancer Metastasis Rev. 2006, 25, 315–322. [Google Scholar] [CrossRef] [PubMed]
  34. Qian, B.-Z.; Pollard, J.W. Macrophage diversity enhances tumor progression and metastasis. Cell 2010, 141, 39–51. [Google Scholar] [CrossRef] [Green Version]
  35. Lissbrant, I.F.; Stattin, P.; Wikstrom, P.; Damber, J.E.; Egevad, L.; Bergh, A. Tumor associated macrophages in human prostate cancer: Relation to clinicopathological variables and survival. Int. J. Oncol. 2000, 17, 445–451. [Google Scholar] [CrossRef]
  36. Izumi, K.; Fang, L.-Y.; Mizokami, A.; Namiki, M.; Li, L.; Lin, W.-J.; Chang, C. Targeting the androgen receptor with siRNA promotes prostate cancer metastasis through enhanced macrophage recruitment via CCL2/CCR2-induced STAT3 activation. EMBO Mol. Med. 2013, 5, 1383–1401. [Google Scholar] [CrossRef]
  37. Lin, T.-H.; Izumi, K.; Lee, S.O.; Lin, W.-J.; Yeh, S.; Chang, C. Anti-androgen receptor ASC-J9 versus anti-androgens MDV3100 (Enzalutamide) or Casodex (Bicalutamide) leads to opposite effects on prostate cancer metastasis via differential modulation of macrophage infiltration and STAT3-CCL2 signaling. Cell Death Dis. 2013, 4, e764. [Google Scholar] [CrossRef]
  38. Maolake, A.; Izumi, K.; Shigehara, K.; Natsagdorj, A.; Iwamoto, H.; Kadomoto, S.; Takezawa, Y.; Machioka, K.; Narimoto, K.; Namiki, M.; et al. Tumor-associated macrophages promote prostate cancer migration through activation of the CCL22-CCR4 axis. Oncotarget 2017, 8, 9739–9751. [Google Scholar] [CrossRef] [Green Version]
  39. Pienta, K.J.; Machiels, J.-P.; Schrijvers, D.; Alekseev, B.; Shkolnik, M.; Crabb, S.J.; Li, S.; Seetharam, S.; Puchalski, T.A.; Takimoto, C.; et al. Phase 2 study of carlumab (CNTO 888), a human monoclonal antibody against CC-chemokine ligand 2 (CCL2), in metastatic castration-resistant prostate cancer. Investig. New Drugs 2013, 31, 760–768. [Google Scholar] [CrossRef] [PubMed]
  40. Ries, C.H.; Cannarile, M.A.; Hoves, S.; Benz, J.; Wartha, K.; Runza, V.; Rey-Giraud, F.; Pradel, L.P.; Feuerhake, F.; Klaman, I.; et al. Targeting tumor-associated macrophages with anti-CSF-1R antibody reveals a strategy for cancer therapy. Cancer Cell 2014, 25, 846–859. [Google Scholar] [CrossRef] [Green Version]
  41. Mantovani, A.; Marchesi, F.; Malesci, A.; Laghi, L.; Allavena, P. Tumour-associated macrophages as treatment targets in oncology. Nat. Rev. Clin. Oncol. 2017, 14, 399–416. [Google Scholar] [CrossRef] [PubMed]
  42. Wouters, M.C.A.; Nelson, B.H. Prognostic Significance of Tumor-Infiltrating B Cells and Plasma Cells in Human Cancer. Clin. Cancer Res. 2018, 24, 6125–6135. [Google Scholar] [CrossRef] [Green Version]
  43. Gentles, A.J.; Newman, A.M.; Liu, C.L.; Bratman, S.V.; Feng, W.; Kim, D.; Nair, V.S.; Xu, Y.; Khuong, A.; Hoang, C.D.; et al. The prognostic landscape of genes and infiltrating immune cells across human cancers. Nat. Med. 2015, 21, 938–945. [Google Scholar] [CrossRef] [PubMed]
  44. Shi, X.; Shiao, S.L. The role of macrophage phenotype in regulating the response to radiation therapy. Transl. Res. 2018, 191, 64–80. [Google Scholar] [CrossRef] [PubMed]
  45. Tsai, C.-S.; Chen, F.-H.; Wang, C.-C.; Huang, H.-L.; Jung, S.-M.; Wu, C.-J.; Lee, C.-C.; McBride, W.H.; Chiang, C.-S.; Hong, J.-H. Macrophages from irradiated tumors express higher levels of iNOS, arginase-I and COX-2, and promote tumor growth. Int. J. Radiat. Oncol. Biol. Phys. 2007, 68, 499–507. [Google Scholar] [CrossRef]
  46. Milas, L. Tumor bed effect in murine tumors: Relationship to tumor take and tumor macrophage content. Radiat. Res. 1990, 123, 232–236. [Google Scholar] [CrossRef]
  47. De Palma, M.; Lewis, C.E. Macrophage regulation of tumor responses to anticancer therapies. Cancer Cell 2013, 23, 277–286. [Google Scholar] [CrossRef] [Green Version]
  48. Hughes, R.; Qian, B.-Z.; Rowan, C.; Muthana, M.; Keklikoglou, I.; Olson, O.C.; Tazzyman, S.; Danson, S.; Addison, C.; Clemons, M.; et al. Perivascular M2 Macrophages Stimulate Tumor Relapse after Chemotherapy. Cancer Res. 2015, 75, 3479–3491. [Google Scholar] [CrossRef] [Green Version]
  49. Xu, J.; Escamilla, J.; Mok, S.; David, J.; Priceman, S.; West, B.; Bollag, G.; McBride, W.; Wu, L. CSF1R signaling blockade stanches tumor-infiltrating myeloid cells and improves the efficacy of radiotherapy in prostate cancer. Cancer Res. 2013, 73, 2782–2794. [Google Scholar] [CrossRef] [Green Version]
  50. Armstrong, A.J.; Halabi, S.; Healy, P.; Lee, W.R.; Koontz, B.F.; Moul, J.W.; Mundy, K.; Creel, P.; Wood, S.; Davis, K.; et al. A phase 2 multimodality trial of docetaxel/prednisone with sunitinib followed by salvage radiation therapy in men with PSA recurrent prostate cancer after radical prostatectomy. Prostate Cancer Prostatic Dis. 2016, 19, 100–106. [Google Scholar] [CrossRef]
Figure 1. Panel (A) displays the clusters of immune populations in the PRAD (prostate adenocarcinoma) TCGA dataset. The columns display the individual immune cells represented in each column, while the rows display the unique identifiers within each cluster. CD4 MR represents CD4 Memory Resting T cells. Cluster 1 is CD4 MRHighPlasma CellHighM0LowM2Mid. Cluster 2 is CD4 MRLowPlasma CellHighM0LowM2Low. Cluster 3 is CD4 MRHighPlasma CellLowM0HighM2Low. Cluster 4 is CD4 MRHighPlasma CellLowM0LowM2High. Panel (B) displays the median cell infiltration, derived from CIBERSORT absolute immune fraction, for the most prominent cell types in the TCGA PRAD database by cluster. Abbreviations: T follic, T follicular helper T cells; NK Act, activated natural killer cells; Mast Rest, resting mast cells.
Jcm 09 01973 g001
Figure 2. Figure 2 demonstrates the Kaplan–Meier curve for progression-free survival for each of the clusters in the TCGA PRAD cohort. Clusters are color coded, with a legend at the top of the figure. Number at risk at various time points is displayed at the bottom of the figure. Pairwise log-rank comparisons were conducted for each of the curves listed, and results displayed within the figure.
Jcm 09 01973 g002
Figure 3. Panel (A) demonstrates the Kaplan–Meier curve for progression-free survival for grouped clusters 1 and 2 versus grouped clusters 3 and 4 (HR 2.243, 95% CI 1.458–3.450, p = 0.0002). (B) Biochemical recurrence (HR 2.128, 95% CI 1.302–3.479, p = 0.0026). (C) Distant metastasis (all events occurred in clusters 3 and 4, p < 0.0001). (D) Overall survival (HR 0.9319, 95% CI 0.2488–3.49, p = 0.917).
Jcm 09 01973 g003
Figure 4. Panel (A) demonstrates progression-free survival for only patients receiving surgery in cluster 3 vs. 4, with cluster 4 displaying significantly worse progression-free survival (HR 18.1, 95% CI 2.41–135.5, p < 0.0001). Panel (B) displays progression-free survival for patients receiving both surgery and radiation in cluster 3 vs. 4, with cluster 3 displaying significantly worse progression-free survival (log-rank p = 0.018; HR 0.368, 95% CI 0.1568–0.8642, p = 0.0217). The Kaplan–Meier curves are color-coded, with figure legends at the top of each panel.
Jcm 09 01973 g004
Figure 5. Multivariable analysis with hazard ratio (HR) represented in a Forest plot adjusting for age, pathologic T-stage, Gleason score, baseline PSA value, cluster, and fractions of predominant cells, including M0 macrophages and plasma cells. Clusters, cell types, and clinical risk factors are located in the left column, while hazard ratio calculations are located in the right column. ‘**’ denotes significance, 0.001 > p > 0.05, and ‘***’ denotes significance, p < 0.001.
Jcm 09 01973 g005
Table 1. Demographic and treatment data for all patients in the TCGA PRAD cohort, divided by cluster.
Cluster 1 (n = 139)Cluster 2 (n = 115)Cluster 3 (n = 112)Cluster 4 (n = 126)
Median Age (years)59.961.162.564.7
Median PSA (IQR)7.2 (5.0–11.6)7.6 (5.6–9.9)7.5 (4.8–12.1)7.5 (5.0–11.3)
Gleason Score
≤620 (14.4%)10 (8.7%)6 (5.4%)8 (6.3%)
784 (60.4%)72 (62.6%)46 (41.4%)41 (32.5%)
8-1035 (25.2%)33 (28.7%)58 (51.8%)75 (59.5%)
Pathologic T category
pT253 (38.1%)46 (40.0%)38 (33.9%)46 (36.5%)
pT3a53 (38.1%)36 (31.3%)31 (27.7%)38 (30.2%)
pT3b28 (20.1%)32 (27.8%)35 (31.3%)35 (27.8%)
pT44 (2.9%)04 (3.6%)2 (1.6%)
Risk Group
Low14 (10.1%)5 (4.3%)3 (2.7%)7 (5.6%)
Intermediate74 (53.2%)66 (57.4%)42 (37.5%)38 (30.2%)
High42 (30.2%)39 (33.9%)51 (45.5%)60 (47.6%)
Zone of Origin
Peripheral26 (18.7%)37 (32.2%)30 (26.8%)42 (33.3%)
Central1 (0.7%)01 (0.9%)2 (1.6%)
Transition2 (1.4%)2 (1.7%)3 (2.7%)1 (0.8%)
Multiple32 (23.0%)22 (19.1%)32 (28.6%)41 (32.5%)
TMPRSS2:ERG Fusion
Wild-Type91 (65.5%)66 (57.4%)71 (63.4%)84 (66.7%)
Fusion47 (33.8%)48 (41.7%)40 (35.7%)42 (33.3%)
Median Follow Up (months)2834.331.230.8
Recurrence
BCR10 (7.2%)15 (13.0%)22 (19.6%)21 (16.7%)
LRR3 (2.2%)01 (0.9%)3 (2.4%)
Metastasis002 (1.8%)5 (4.0%)
Death2 (1.4%)3 (2.6%)3 (2.7%)1 (0.8%)
Radiation
Adjuvant11 (7.9%)12 (10.4%)19 (17.0%)21 (16.7%)
Salvage7 (5.0%)5 (4.3%)9 (8.0%)8 (6.3%)
Median Dose (Gy)66.667.57066
Median Fractions33.5353534
Salvage Systemic Therapy13 (9.3%)16 (13.9%)25 (22.3%)25 (19.9%)
Abbreviations: PSA, prostate-specific antigen; IQR, interquartile range; BCR, biochemical recurrence; LRR, locoregional recurrence.

