C3d-Positive Preformed DSAs Tend to Persist and Result in a Higher Risk of AMR after Kidney Transplants

 ,
,
Abstract
:1. Introduction
2. Materials and Methods
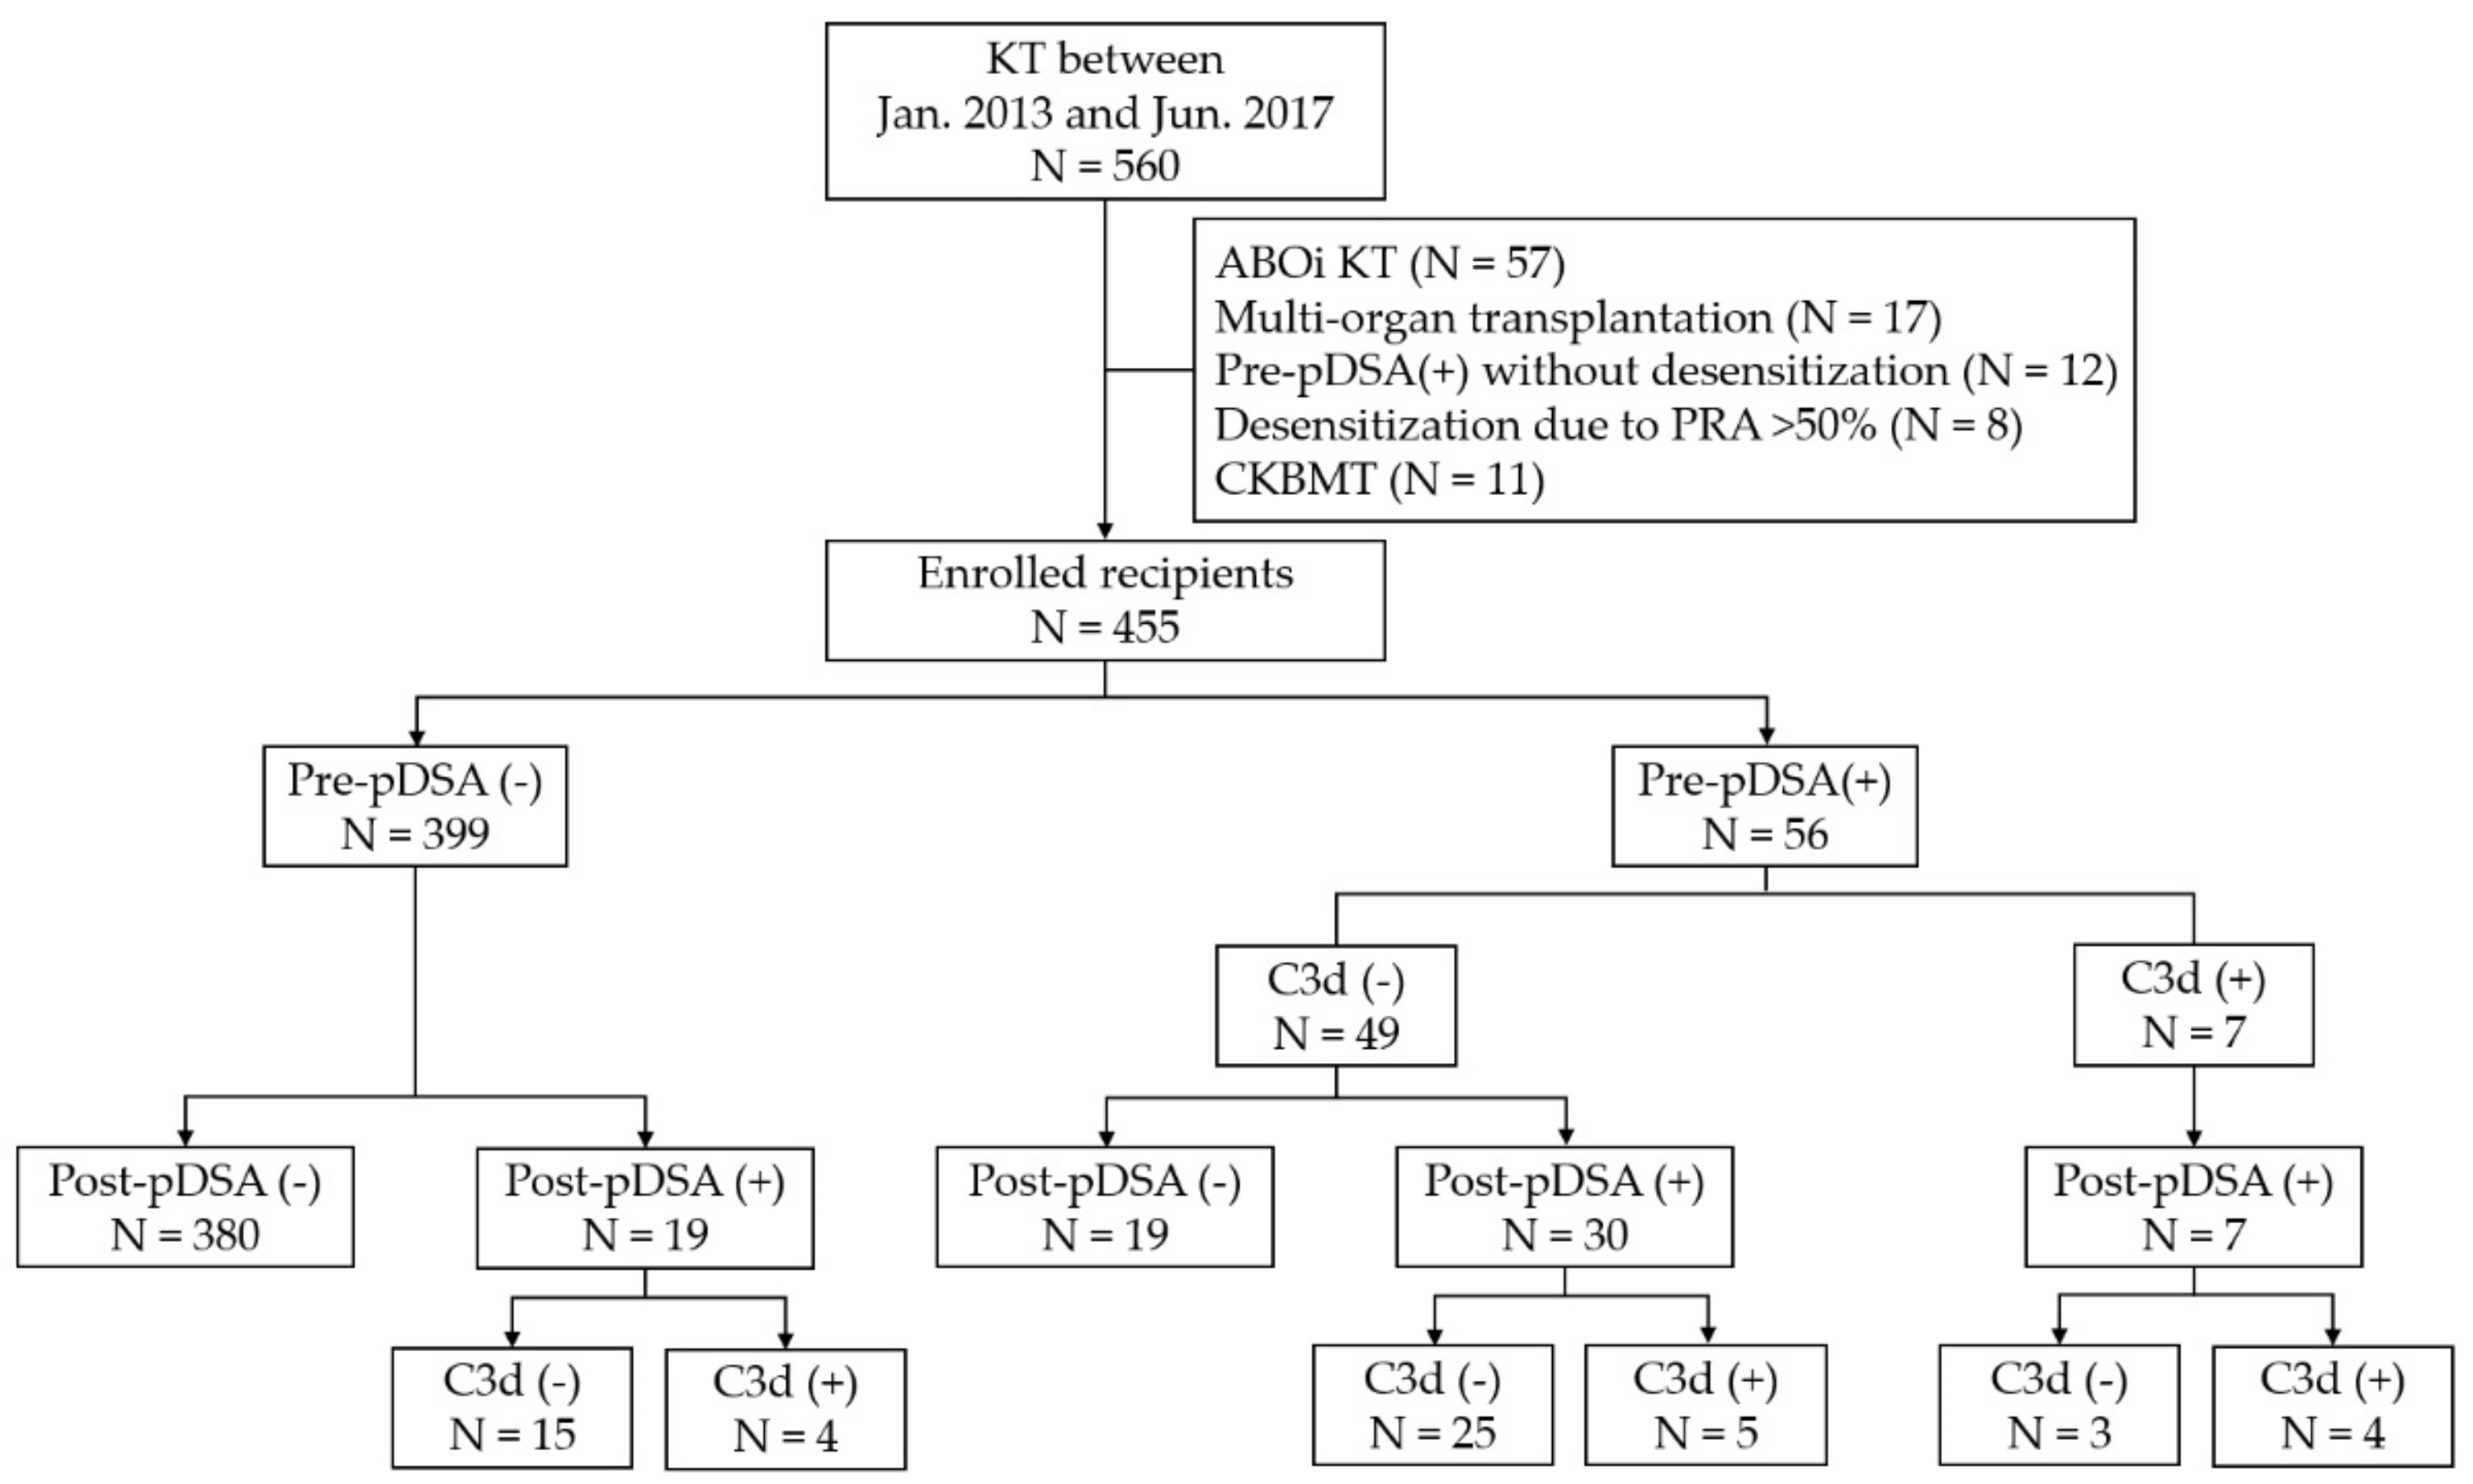
2.1. Study Population
2.2. Desensitization and Immunosuppression
2.3. Immunologic Assays
2.4. Data Collection and Statistical Methods
2.4.1. Recipient Characteristics
2.4.2. HLA Antibody Characterization
2.4.3. Clinical Outcome
2.4.4. Statistical Software
3. Results
3.1. Recipient Characteristics
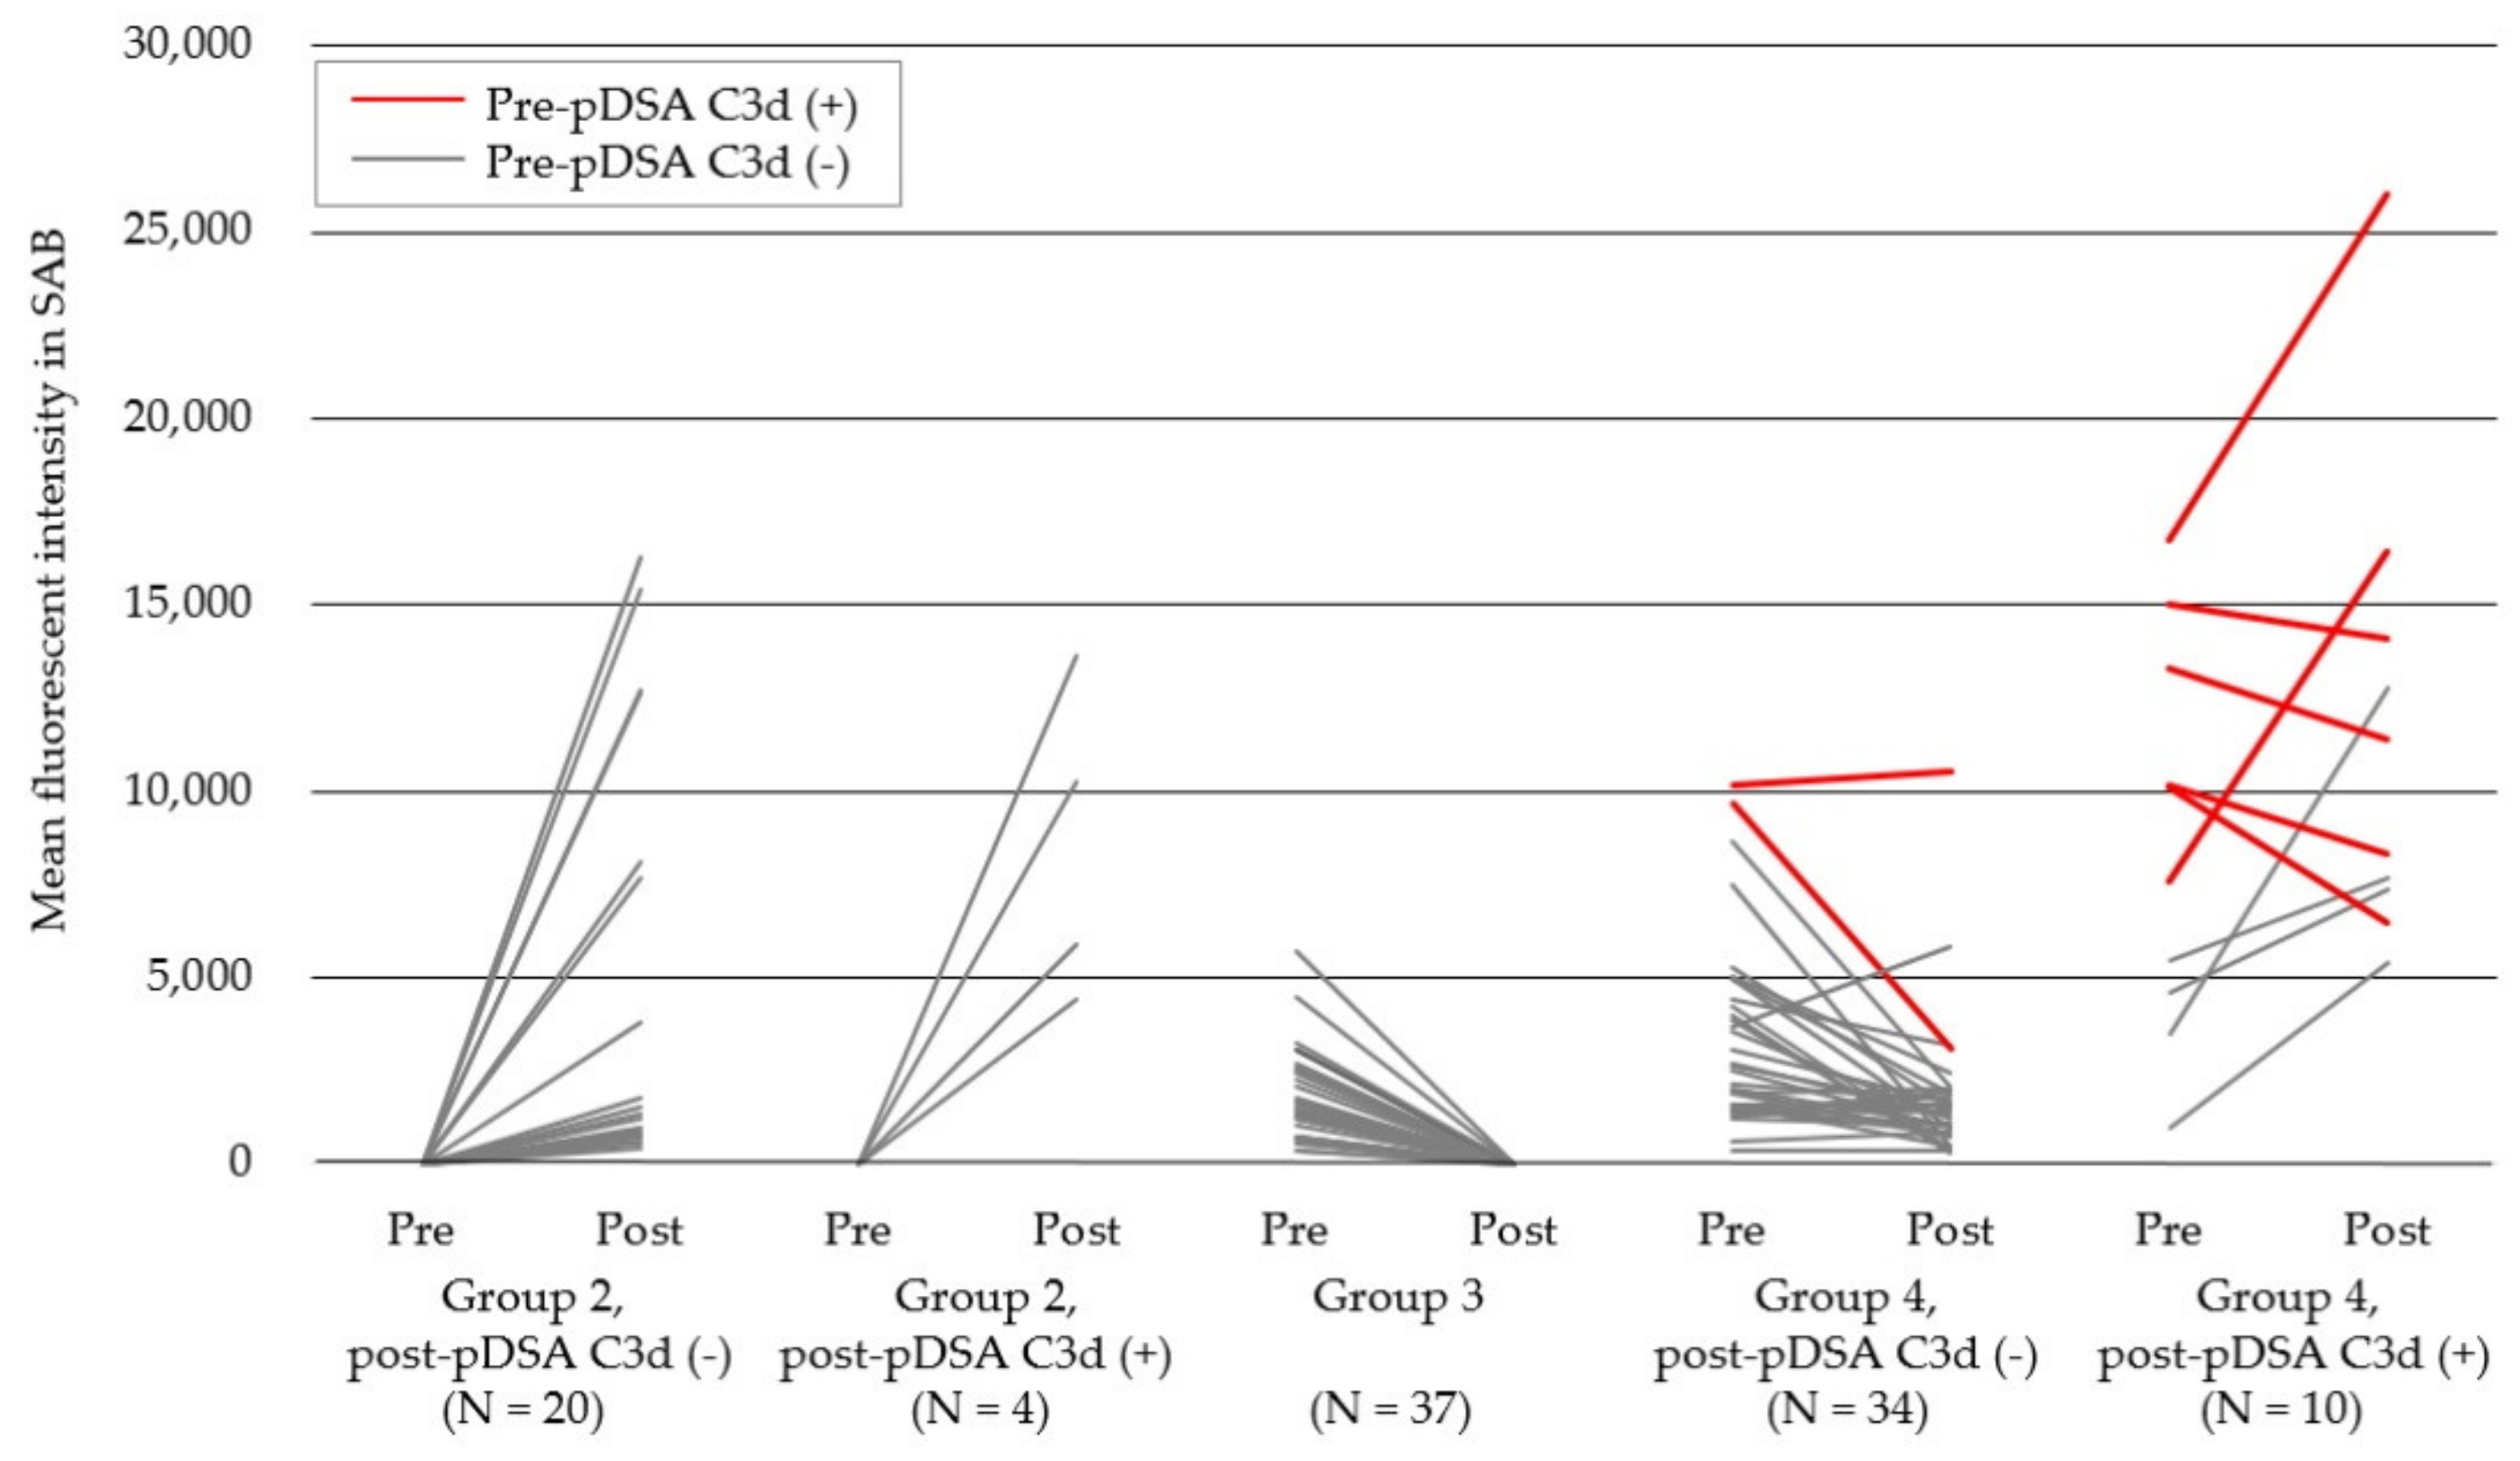
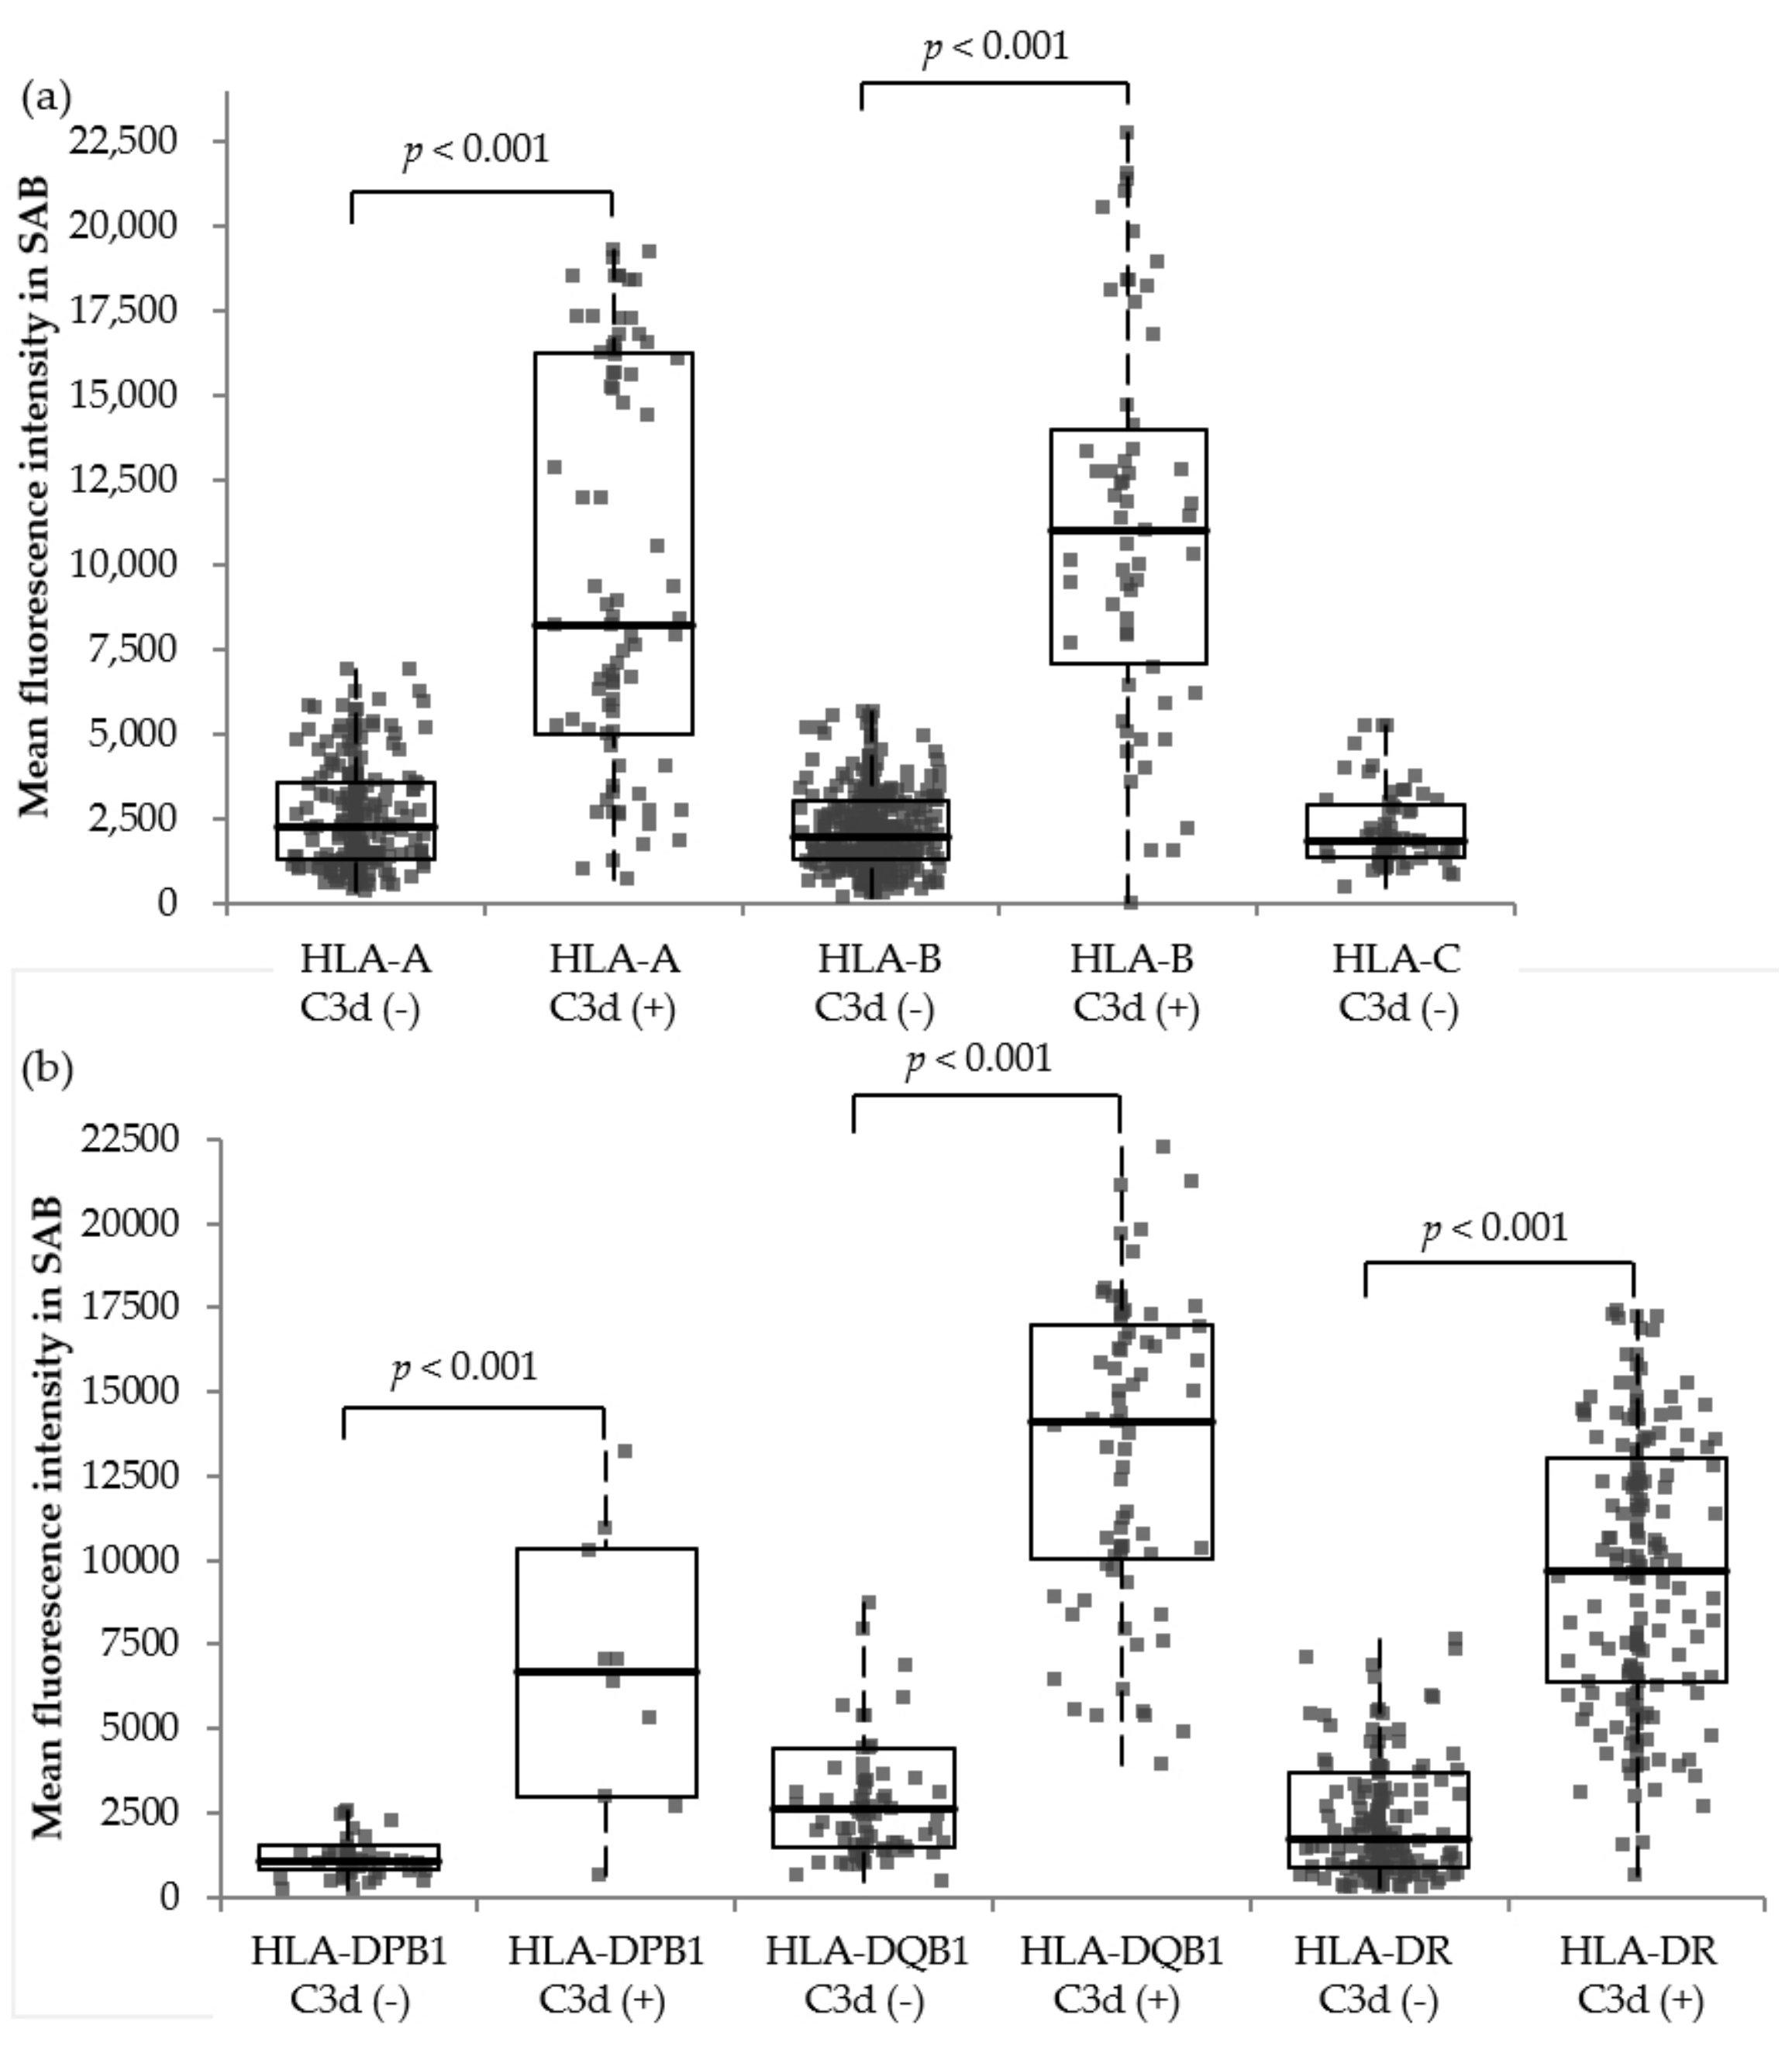
3.2. HLA Antibody Characteristics, Including Complement Binding Capacities
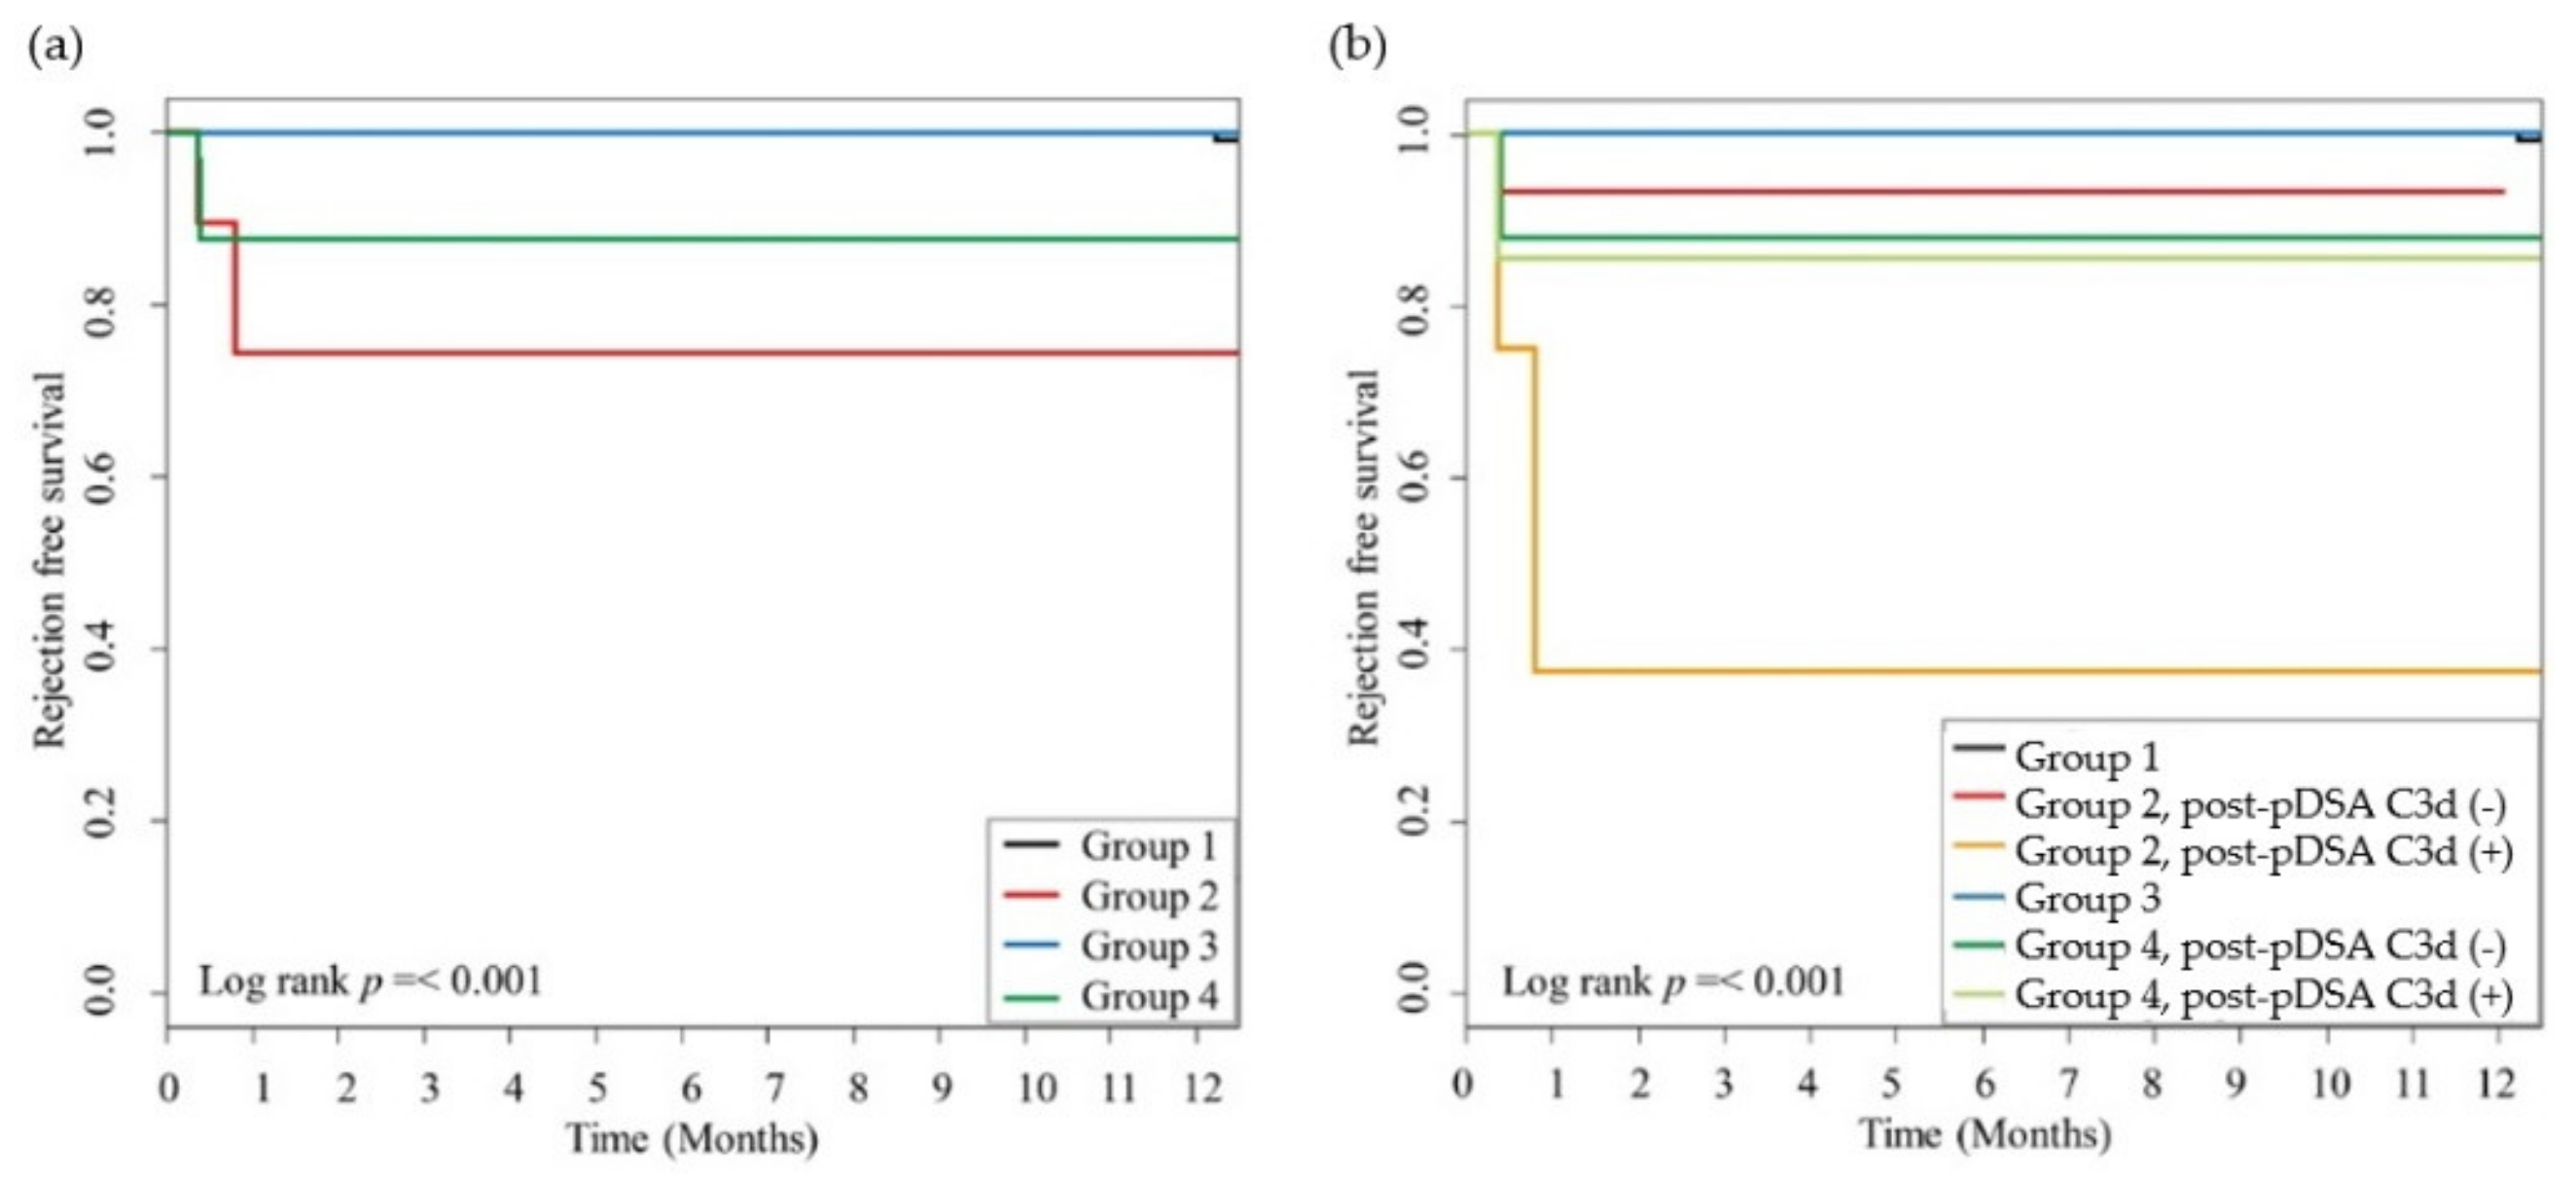
3.3. Rejection Episodes and Graft Function
4. Discussion
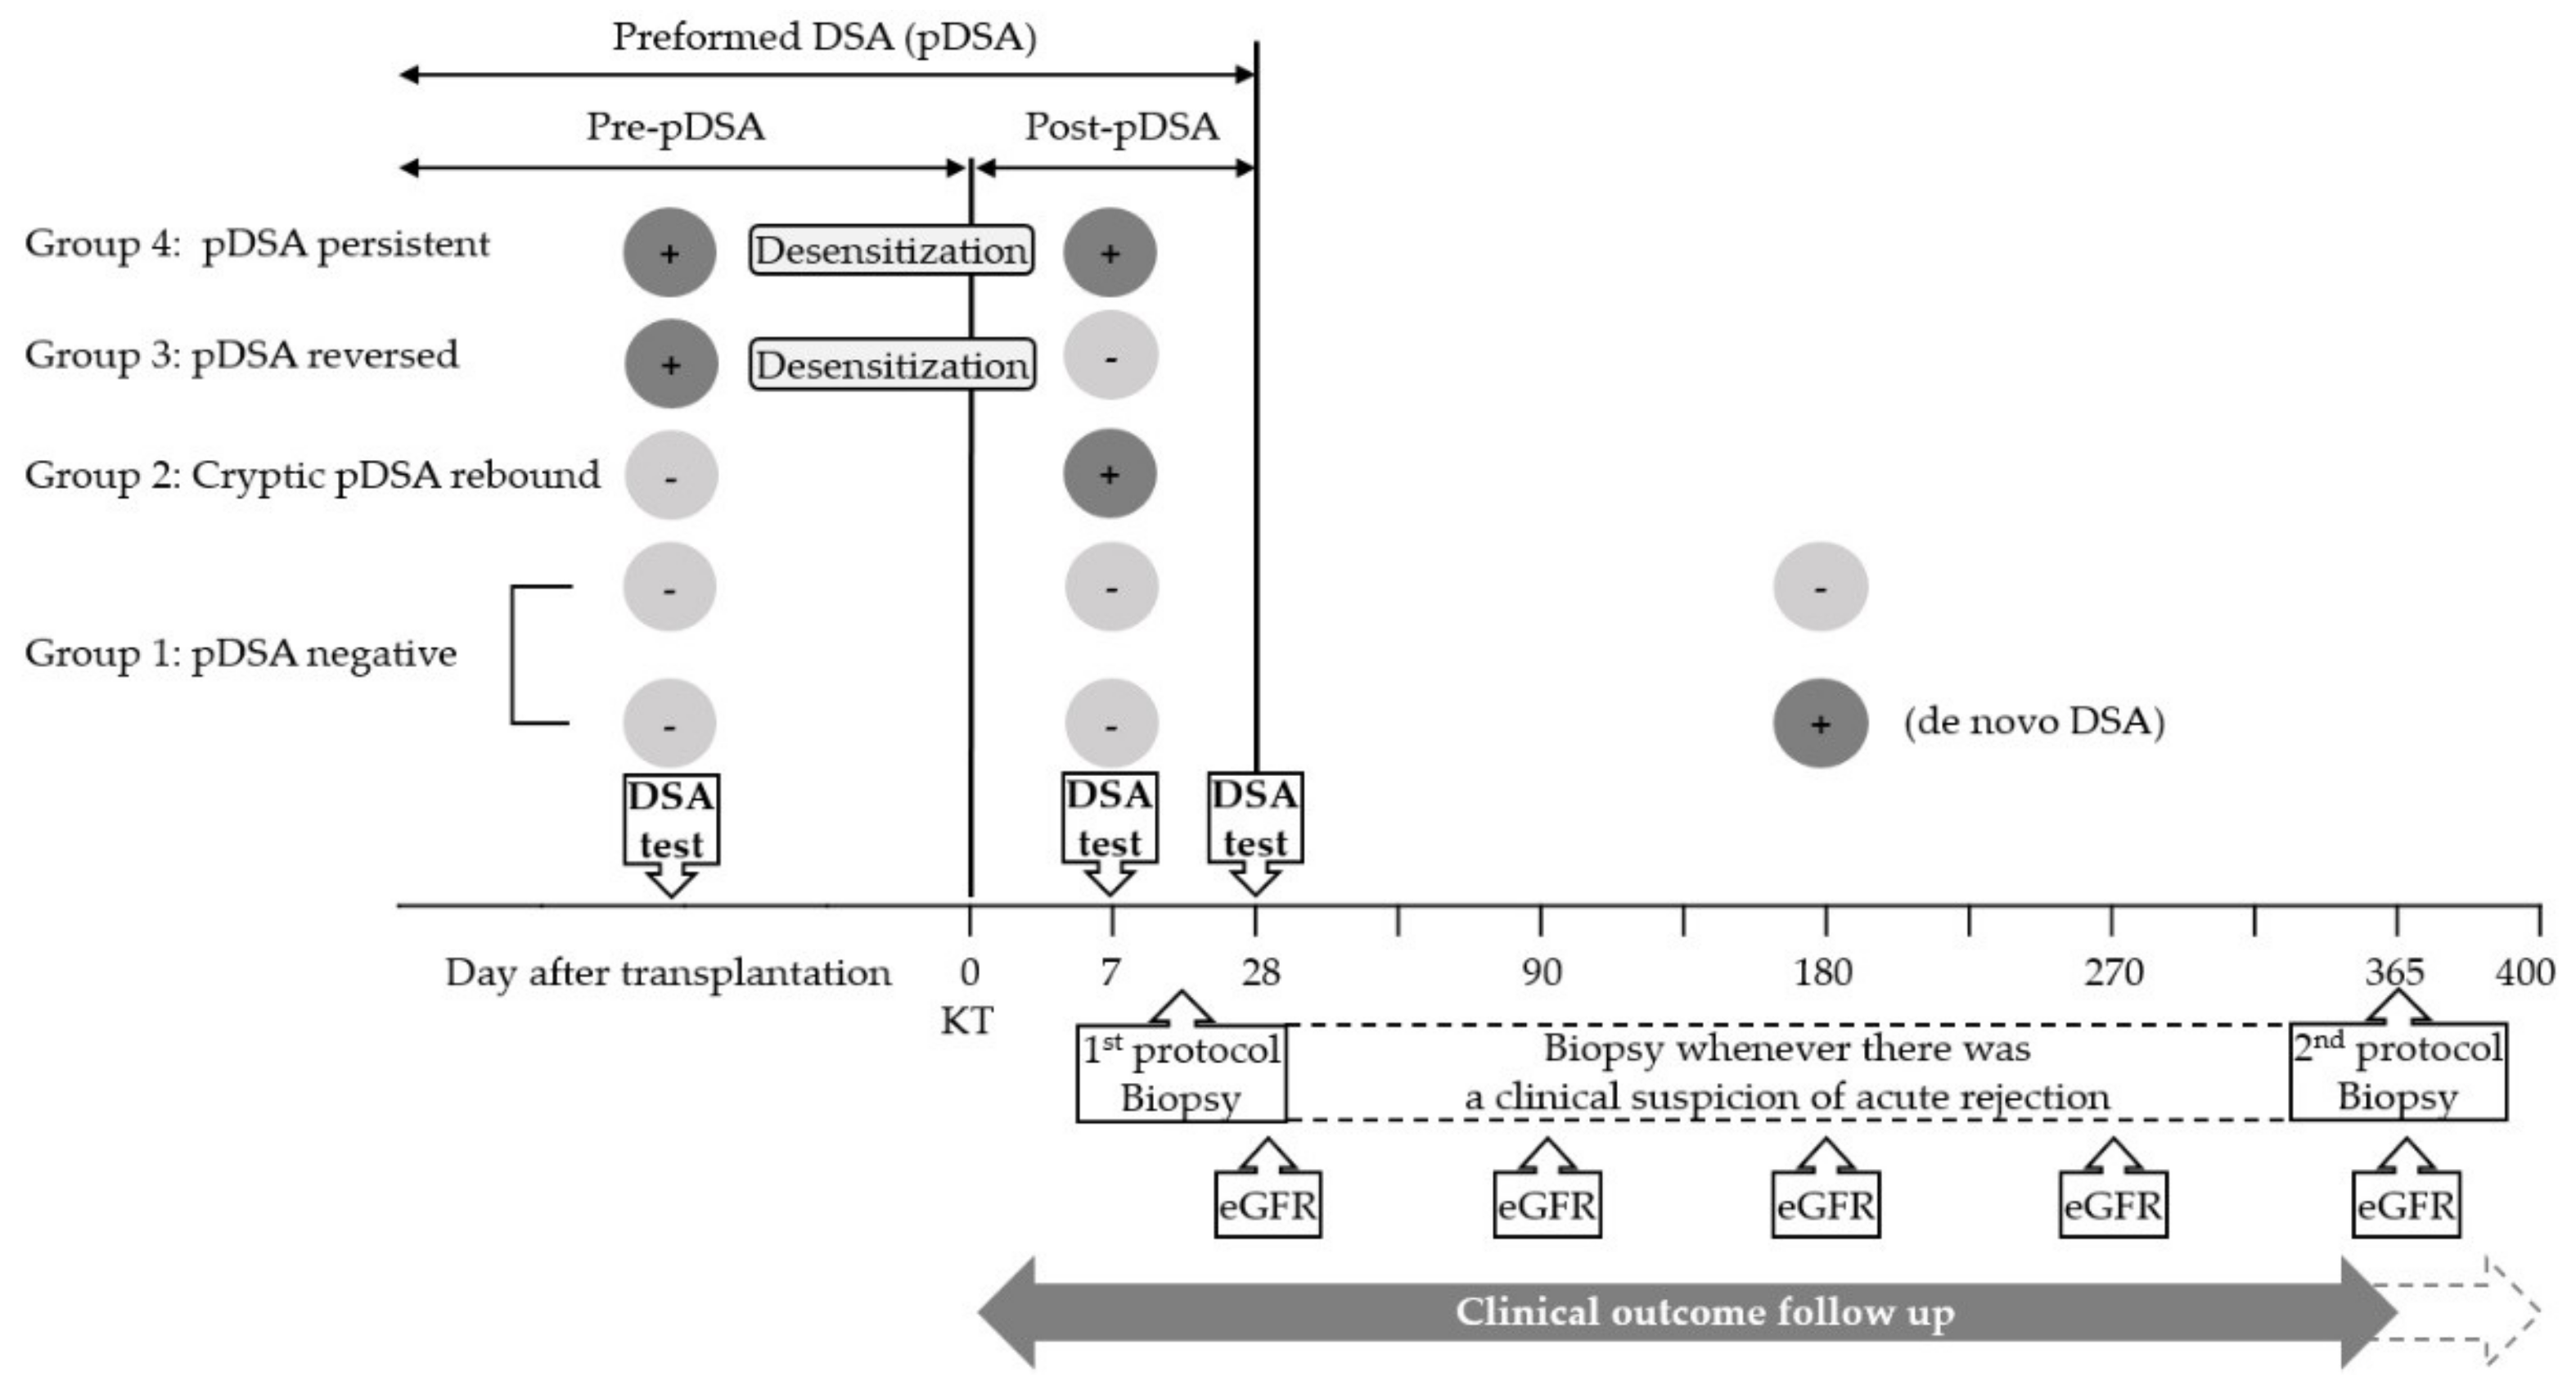
4.1. Cryptic DSAs
4.2. Persistent pDSAs
4.3. Complement-Binding Capacities and Clinical Outcome
5. Conclusions
Supplementary Materials
Author Contributions
Funding
Acknowledgments
Conflicts of Interest
References
- Montgomery, R.A.; Lonze, B.E.; King, K.E.; Kraus, E.S.; Kucirka, L.M.; Locke, J.E.; Warren, D.S.; Simpkins, C.E.; Dagher, N.N.; Singer, A.L. Desensitization in hla-incompatible kidney recipients and survival. N. Engl. J. Med. 2011, 365, 318–326. [Google Scholar] [CrossRef] [PubMed] [Green Version]
- Sicard, A.; Ducreux, S.; Rabeyrin, M.; Couzi, L.; McGregor, B.; Badet, L.; Scoazec, J.Y.; Bachelet, T.; Lepreux, S.; Visentin, J.; et al. Detection of c3d-binding donor-specific anti-hla antibodies at diagnosis of humoral rejection predicts renal graft loss. J. Am. Soc. Nephrol. 2015, 26, 457–467. [Google Scholar] [CrossRef] [PubMed] [Green Version]
- Comoli, P.; Cioni, M.; Tagliamacco, A.; Quartuccio, G.; Innocente, A.; Fontana, I.; Trivelli, A.; Magnasco, A.; Nocco, A.; Klersy, C. Acquisition of c3d-binding activity by de novo donor-specific hla antibodies correlates with graft loss in nonsensitized pediatric kidney recipients. Am. J. Transp. 2016, 16, 2106–2116. [Google Scholar] [CrossRef] [PubMed] [Green Version]
- Kovandova, B.; Slavcev, A.; Sekerkova, Z.; Honsova, E.; Trunecka, P. Antibody-mediated rejection after liver transplantation-relevance of c1q and c3d-binding antibodies. HLA 2018, 92, 34–37. [Google Scholar] [CrossRef]
- Lee, D.R.; Kim, B.C.; Kim, J.P.; Kim, I.G.; Jeon, M.Y. C3d-binding donor-specific hla antibody is associated with a high risk of antibody-mediated rejection and graft loss in stable kidney transplant recipients: A single-center cohort study. Transp. Proc. 2018, 50, 3452–3459. [Google Scholar] [CrossRef]
- Pelletier, R.P.; Balazs, I.; Adams, P.; Rajab, A.; DiPaola, N.R.; Henry, M.L. Clinical utility of c3d binding donor-specific anti-human leukocyte antigen antibody detection by single antigen beads after kidney transplantation-a retrospective study. Transp. Int. 2018, 31, 424–435. [Google Scholar] [CrossRef] [Green Version]
- Claisse, G.; Absi, L.; Cognasse, F.; Alamartine, E.; Mariat, C.; Maillard, N. Relationship between mean fluorescence intensity and c1q/c3d-fixing capacities of anti-hla antibodies. Hum. Immunol. 2017, 78, 336–341. [Google Scholar] [CrossRef]
- Calp-Inal, S.; Ajaimy, M.; Melamed, M.L.; Savchik, C.; Masiakos, P.; Colovai, A.; Akalin, E. The prevalence and clinical significance of c1q-binding donor-specific anti-hla antibodies early and late after kidney transplantation. Kidney Int. 2016, 89, 209–216. [Google Scholar] [CrossRef] [Green Version]
- Wiebe, C.; Nickerson, P. Posttransplant monitoring of de novo human leukocyte antigen donor-specific antibodies in kidney transplantation. Curr. Opin. Organ Transp. 2013, 18, 470–477. [Google Scholar] [CrossRef]
- Wiebe, C.; Gibson, I.; Blydt-Hansen, T.; Karpinski, M.; Ho, J.; Storsley, L.; Goldberg, A.; Birk, P.; Rush, D.; Nickerson, P. Evolution and clinical pathologic correlations of de novo donor-specific hla antibody post kidney transplant. Am. J. Transp. 2012, 12, 1157–1167. [Google Scholar] [CrossRef]
- Lee, K.W.; Park, J.B.; Cho, C.W.; Lee, N.; Yoo, H.; Kim, K.; Park, H.; Kang, E.S.; Huh, W.; Kim, S. The impact of donor-specific anti-human leukocyte antigen (hla) antibody rebound on the risk of antibody mediated rejection in sensitized kidney transplant recipients. Ann. Transp. 2017, 22, 166–176. [Google Scholar] [CrossRef] [PubMed]
- Solez, K.; Racusen, L.C. The banff classification revisited. Kidney Int. 2013, 83, 201–206. [Google Scholar] [CrossRef] [PubMed] [Green Version]
- Zhang, R. Donor-specific antibodies in kidney transplant recipients. Clin. J. Am. Soc. Nephrol. 2018, 13, 182–192. [Google Scholar] [CrossRef] [PubMed]
- Hirai, T.; Furusawa, M.; Omoto, K.; Ishida, H.; Tanabe, K. Analysis of predictive and preventive factors for de novo dsa in kidney transplant recipients. Transplantation 2014, 98, 443–450. [Google Scholar] [CrossRef] [PubMed]
- Heilman, R.L.; Nijim, A.; Desmarteau, Y.M.; Khamash, H.; Pando, M.J.; Smith, M.L.; Chakkera, H.A.; Huskey, J.; Valdez, R.; Reddy, K.S. De novo donor-specific human leukocyte antigen antibodies early after kidney transplantation. Transplantation 2014, 98, 1310–1315. [Google Scholar] [CrossRef] [PubMed]
- King, C.S.; Cochrane, A.B. The impact of early de novo donor-specific antibodies on lung transplant outcomes: Is timing everything? J. Heart Lung Transp. 2016, 35, 1057–1058. [Google Scholar] [CrossRef] [PubMed]
- Kimball, P.M.; Baker, M.A.; Wagner, M.B.; King, A. Surveillance of alloantibodies after transplantation identifies the risk of chronic rejection. Kidney Int. 2011, 79, 1131–1137. [Google Scholar] [CrossRef] [Green Version]
- Marfo, K.; Ajaimy, M.; Colovai, A.; Kayler, L.; Greenstein, S.; Lubetzky, M.; Gupta, A.; Kamal, L.; de Boccardo, G.; Masiakos, P.; et al. Pretransplant immunologic risk assessment of kidney transplant recipients with donor-specific anti-human leukocyte antigen antibodies. Transplantation 2014, 98, 1082–1088. [Google Scholar] [CrossRef]
- Redondo-Pachon, D.; Perez-Saez, M.J.; Mir, M.; Gimeno, J.; Llinas, L.; Garcia, C.; Hernandez, J.J.; Yelamos, J.; Pascual, J.; Crespo, M. Impact of persistent and cleared preformed hla dsa on kidney transplant outcomes. Hum. Immunol. 2018, 79, 424–431. [Google Scholar] [CrossRef] [Green Version]
- Lefaucheur, C.; Viglietti, D.; Bentlejewski, C.; van Huyen, J.-P.D.; Vernerey, D.; Aubert, O.; Verine, J.; Jouven, X.; Legendre, C.; Glotz, D. Igg donor-specific anti-human hla antibody subclasses and kidney allograft antibody-mediated injury. J. Am. Soc. Nephrol. 2016, 27, 293–304. [Google Scholar] [CrossRef]
- Honger, G.; Hopfer, H.; Arnold, M.L.; Spriewald, B.M.; Schaub, S.; Amico, P. Pretransplant igg subclasses of donor-specific human leukocyte antigen antibodies and development of antibody-mediated rejection. Transplantation 2011, 92, 41–47. [Google Scholar] [CrossRef] [PubMed]
- Loupy, A.; Lefaucheur, C.; Vernerey, D.; Prugger, C.; van Huyen, J.-P.D.; Mooney, N.; Suberbielle, C.; Frémeaux-Bacchi, V.; Méjean, A.; Desgrandchamps, F. Complement-binding anti-hla antibodies and kidney-allograft survival. N. Engl. J. Med. 2013, 369, 1215–1226. [Google Scholar] [CrossRef] [PubMed] [Green Version]
- Bamoulid, J.; Roodenburg, A.; Staeck, O.; Wu, K.; Rudolph, B.; Brakemeier, S.; Halleck, F.; Lehner, L.; Schönemann, C.; Lachmann, N. Clinical outcome of patients with de novo c1q-binding donor-specific hla antibodies after renal transplantation. Transplantation 2017, 101, 2165–2174. [Google Scholar] [CrossRef] [PubMed]
- Malheiro, J.; Santos, S.; Tafulo, S.; Dias, L.; Martins, L.S.; Fonseca, I.; Almeida, M.; Pedroso, S.; Beirão, I.; Castro-Henriques, A. Detection of complement-binding donor-specific antibodies, not igg-antibody strength nor c4d status, at antibody-mediated rejection diagnosis is an independent predictor of kidney graft failure. Transplantation 2018, 102, 1943–1954. [Google Scholar] [CrossRef] [PubMed] [Green Version]
- Yabu, J.M.; Higgins, J.P.; Chen, G.; Sequeira, F.; Busque, S.; Tyan, D.B. C1q-fixing human leukocyte antigen antibodies are specific for predicting transplant glomerulopathy and late graft failure after kidney transplantation. Transplantation 2011, 91, 342–347. [Google Scholar] [CrossRef]
- Fichtner, A.; Süsal, C.; Höcker, B.; Rieger, S.; Waldherr, R.; Westhoff, J.H.; Sander, A.; Opelz, G.; Tönshoff, B. Association of c1q-fixing dsa with late graft failure in pediatric renal transplant recipients. Pediatr. Nephrol. 2016, 31, 1157–1166. [Google Scholar] [CrossRef]
- Bailly, E.; Anglicheau, D.; Blancho, G.; Gatault, P.; Vuiblet, V.; Chatelet, V.; Morelon, E.; Malvezzi, P.; Parissiadis, A.; Tourret, J. Prognostic value of the persistence of c1q-binding anti-hla antibodies in acute antibody-mediated rejection in kidney transplantation. Transplantation 2018, 102, 688–698. [Google Scholar] [CrossRef]
- Malheiro, J.; Tafulo, S.; Dias, L.; Martins, L.S.; Fonseca, I.; Beirão, I.; Castro-Henriques, A.; Cabrita, A. Determining donor-specific antibody c1q-binding ability improves the prediction of antibody-mediated rejection in human leucocyte antigen-incompatible kidney transplantation. Transp. Int. 2017, 30, 347–359. [Google Scholar] [CrossRef]
- Molina, J.; Navas, A.; Agüera, M.-L.; Rodelo-Haad, C.; Alonso, C.; Rodríguez-Benot, A.; Aljama, P.; Solana, R. Impact of preformed donor-specific anti-human leukocyte antigen antibody c1q-binding ability on kidney allograft outcome. Front. Immunol. 2017, 8, 1310. [Google Scholar] [CrossRef] [Green Version]
- Otten, H.G.; Verhaar, M.C.; Borst, H.P.; Hene, R.J.; van Zuilen, A.D. Pretransplant donor-specific hla class-i and -ii antibodies are associated with an increased risk for kidney graft failure. Am. J. Transp. 2012, 12, 1618–1623. [Google Scholar] [CrossRef]
- Crespo, M.; Torio, A.; Mas, V.; Redondo, D.; Pérez-Sáez, M.J.; Mir, M.; Faura, A.; Guerra, R.; Montes-Ares, O.; Checa, M.D. Clinical relevance of pretransplant anti-hla donor-specific antibodies: Does c1q-fixation matter? Transpl. Immunol. 2013, 29, 28–33. [Google Scholar] [CrossRef] [PubMed]
- Lee, H.; Han, E.; Choi, A.-R.; Ban, T.H.; Chung, B.H.; Yang, C.W.; Choi, Y.J.; Oh, E.-J. Clinical impact of complement (c1q, c3d) binding de novo donor-specific hla antibody in kidney transplant recipients. PLoS ONE 2018, 13, e0207434. [Google Scholar] [CrossRef] [PubMed]
- Kim, J.J.; Shaw, O.; Martin, C.; Michaelides, G.; Balasubramaniam, R.; Sebire, N.J.; Mamode, N.; Dorling, A.; Vaughan, R.; Marks, S.D. Clinical risk stratification of paediatric renal transplant recipients using c1q and c3d fixing of de novo donor-specific antibodies. Pediatr. Nephrol. 2018, 33, 167–174. [Google Scholar] [CrossRef] [PubMed] [Green Version]
- Kamburova, E.G.; Wisse, B.W.; Joosten, I.; Allebes, W.A.; Van Der Meer, A.; Hilbrands, L.B.; Baas, M.C.; Spierings, E.; Hack, C.E.; Van Reekum, F.E. Pretransplant c3d-fixing donor-specific anti-hla antibodies are not associated with increased risk for kidney graft failure. J. Am. Soc. Nephrol. 2018, 29, 2279–2285. [Google Scholar] [CrossRef] [PubMed] [Green Version]
- Ko, S.Y.; Lee, W.; Jung, C.W.; Cho, Y. C3d assay in correlation with single antigen bead assay for human leukocyte antigen antibodies. Transp. Proc. 2018, 50, 2354–2358. [Google Scholar] [CrossRef] [PubMed]


| Characteristics | Total | Group 1: pDSA negative | Group 2: Cryptic pDSA rebound | Group 3: pDSA reversed | Group 4: pDSA persistent | p-Value * |
|---|---|---|---|---|---|---|
| Number | 455 | 380 | 19 | 19 | 37 | |
| Age, median (IQR) | 52.0 (43.0–59.0) | 52.0 (42.0–59.0) | 49.0 (40.0–56.3) | 51.0 (44.2–57.7) | 52.0 (48.0–60.0) | 0.635 |
| Sex (male) (%) | 279 (61.3) | 259 (68.2) | 7 (36.8) | 1 (5.3) | 12 (32.4) | <0.001 |
| Dialysis duration, median (IQR) | 810.0 (50.2–2173.7) | 843.5 (51.4–2164.1) | 260.0 (47.3–2107.2) | 172.0 (1.2–1652.7) | 1305.0 (82.7–2428.3) | 0.333 |
| Underlying diseases (%) | ||||||
| DM | 125 (27.5) | 114 (37.1) | 3 (15.8) | 3 (15.8) | 5 (13.5) | 0.034 |
| GN (1 – 3) | 71 (15.6) | 61 (16.1) | 1 (5.3) | 1 (5.3) | 8 (21.6) | |
| IgA | 62 (13.6) | 49 (12.9) | 4 (21.1) | 6 (31.6) | 3 (8.1) | |
| Other | 176 (38.7) | 141 (37.1) | 10 (52.6) | 5 (26.3) | 20 (54.1) | |
| Re-transplantation (%) | 46 (10.1) | 28 (7.4) | 4 (21.1) | 0 (0.0) | 14 (37.8) | <0.001 |
| DDKT (%) | 230 (50.5) | 192 (50.5) | 10 (52.6) | 9 (47.4) | 19 (51.4) | 0.989 |
| Desensitization | ||||||
| RTX | 46 (10.1) | 0 (0.0) | 0 (0.0) | 13 (68.4) | 33 (89.2) | NA |
| RTX + PP | 10 (2.2) | 0 (0.0) | 0 (0.0) | 6 (31.6) | 4 (10.8) | |
| Induction therapy | ||||||
| rATG | 291 (64.0) | 226 (59.5) | 10 (52.6) | 19 (100.0) | 36 (97.3) | NA |
| Basiliximab | 164 (36.0) | 154 (40.5) | 9 (47.4) | 0 (0.0) | 1 (2.7) | |
| Maintenance regimen | ||||||
| CsA + MMF (PD) | 6 (1.3) | 6 (1.6) | 0 (0.0) | 0 (0.0) | 0 (0.0) | NA |
| FK + MMF (PD) | 446 (98.0) | 372 (97.9) | 18 (94.7) | 19 (100) | 37 (100) | |
| Sirolimus/Everolimus combination | 3 (0.7) | 2 (0.5) | 1 (5.3) | 0 (0.0) | 0 (0.0) | |
| Pre-sensitization (PRA %) | ||||||
| Class I | 0.0 (0.0–0.0) | 0.0 (0.0–0.0) | 0.0 (0.0–11.7) | 37.0 (5.4–77.0) | 54.0 (0.0–87.7) | <0.001 |
| Class II | 0.0 (0.0–0.0) | 0.0 (0.0–0.0) | 0.0 (0.0–14.0) | 0.0 (0.0–63.8) | 36.0 (0.0–74.3) | <0.001 |
| HLA mismatches, median (IQR) | 3.0 (2.0–4.0) | 3.0 (2.0–4.0) | 4.0 (2.0–4.0) | 3.0 (2.2–4.8) | 3.0 (2.0–4.0) | 0.642 |
| HLA Classes of pDSA | Group 2: Cryptic pDSA Rebound | Group 3: pDSA Reversed | Group 4: pDSA Persistent | |||
|---|---|---|---|---|---|---|
| Total pDSA | C3d (+) pDSA | Total pDSA | C3d (+) pDSA | Total pDSA | C3d (+) pDSA | |
| Pre-transplantation | 19 | 0 (0.0) | 37 | 7 (18.9) | ||
| Class I only | NA | NA | 13 (68.4) | 0 (0.0) | 13 (35.1) | 0 (0.0) |
| Class II* only | NA | NA | 5 (26.3) | 0 (0.0) | 14 (37.8) | 7 (18.9) |
| Class I + II* | NA | NA | 1 (0.53) | 0 (0.0) | 10 (27.0) | 0 (0.0) |
| Post-transplantation | 19 | 4 (21.1) | 37 | 9 (24.3) | ||
| Class I only | 6 (31.6) | 1 (5.3) | NA | NA | 11 (29.7) | 0 (0.0) |
| Class II* only | 11 (57.9) | 3 (15.8) | NA | NA | 21 (56.8) | 9 (24.3) |
| Class I + II* | 2 (10.5) | 0 (0.0) | NA | NA | 5 (13.5) | 0 (0.0) |
| Total | Group 1: pDSA Negative | Group 2: Cryptic pDSA Rebound | Group 3: pDSA Reversed | Group 4: pDSA Persistent | p-Value* | |||||
|---|---|---|---|---|---|---|---|---|---|---|
| Post-pDSA C3d (-) | Post-pDSA C3d (+) | p-Value | Post-pDSA C3d (-) | Post-pDSA C3d (+) | p-Value | |||||
| Number | 455 | 380 | 15 | 4 | 19 | 28 | 9 | |||
| ACR (%) | 168 (36.9) | 142 (37.4) | 7 (46.7) | 2 (50.0) | 0.906 | 7 (36.8) | 7 (25.0) | 3 (33.3) | 0.624 | 0.479 |
| AMR (%) | 13 (2.9) | 2 (0.5) | 1 (6.7) | 2 (50.0) | 0.035 | 1 (5.3) | 4 (14.3) | 3 (33.3) | 0.204 | < 0.001 |
| Comparison groups | Odds ratio (95% CI) | 95% Confidence limits | p-Value* | Adjusted p-value* | |
|---|---|---|---|---|---|
| Group 1 vs. Group 2 | 35.425 | 5.528 | 227.022 | < 0.001 | 0.001 |
| Group 1 vs. Group 2 C3d (-) | 13.495 | 1.154 | 157.782 | 0.038 | 0.076 |
| Group 1 vs. Group 2 C3d (+) | 188.934 | 17.098 | >999.999 | <0.001 | <0.001 |
| Group 1 vs. Group 3 | 10.496 | 0.909 | 121.203 | 0.060 | 0.358 |
| Group 1 vs. Group 4 | 44.084 | 8.771 | 221.57 | <0.001 | <0.001 |
| Group 1 vs. Group 4 C3d (-) | 31.489 | 5.491 | 180.593 | <0.001 | <0.001 |
| Group 1 vs. Group 4 C3d (+) | 94.467 | 13.275 | 672.252 | <0.001 | <0.001 |
| Group 2 vs. Group 3 | 0.296 | 0.028 | 3.142 | 0.313 | 0.999 |
| Group 2 C3d (-) vs. Group 3 | 0.778 | 0.045 | 13.559 | 0.863 | 0.999 |
| Group 2 C3d (+) vs. Group 3 | 0.056 | 0.003 | 0.923 | 0.044 | 0.088 |
| Group 2 vs. Group 4 | 1.244 | 0.283 | 5.48 | 0.773 | 0.999 |
| Group 2 C3d (-) vs. Group 4 C3d (-) | 2.333 | 0.237 | 22.999 | 0.468 | 0.999 |
| Group 2 C3d (-) vs. Group 4 C3d (+) | 7.000 | 0.6 | 81.674 | 0.121 | 0.965 |
| Group 2 C3d (+) vs. Group 4 C3d (-) | 0.167 | 0.018 | 1.546 | 0.115 | 0.919 |
| Group 2 C3d (+) vs. Group 4 C3d (+) | 0.500 | 0.045 | 5.514 | 0.571 | 0.999 |
| Group 3 vs. Group 4 | 4.200 | 0.477 | 36.978 | 0.196 | 0.999 |
| Group 3 vs. Group 4 C3d (-) | 3.000 | 0.308 | 29.182 | 0.344 | 0.688 |
| Group 3 vs. Group 4 C3d (+) | 9.000 | 0.781 | 103.723 | 0.078 | 0.156 |
© 2020 by the authors. Licensee MDPI, Basel, Switzerland. This article is an open access article distributed under the terms and conditions of the Creative Commons Attribution (CC BY) license (http://creativecommons.org/licenses/by/4.0/).
Share and Cite
Choi, S.; Lee, K.W.; Park, J.B.; Kim, K.; Jang, H.-R.; Huh, W.; Kang, E.S. C3d-Positive Preformed DSAs Tend to Persist and Result in a Higher Risk of AMR after Kidney Transplants. J. Clin. Med. 2020, 9, 375. https://doi.org/10.3390/jcm9020375
Choi S, Lee KW, Park JB, Kim K, Jang H-R, Huh W, Kang ES. C3d-Positive Preformed DSAs Tend to Persist and Result in a Higher Risk of AMR after Kidney Transplants. Journal of Clinical Medicine. 2020; 9(2):375. https://doi.org/10.3390/jcm9020375
Chicago/Turabian StyleChoi, Sooin, Kyo Won Lee, Jae Berm Park, Kyunga Kim, Hye-Ryeon Jang, Wooseong Huh, and Eun Suk Kang. 2020. "C3d-Positive Preformed DSAs Tend to Persist and Result in a Higher Risk of AMR after Kidney Transplants" Journal of Clinical Medicine 9, no. 2: 375. https://doi.org/10.3390/jcm9020375