Clinical Impact of the Fracture Risk Assessment Tool on the Treatment Decision for Osteoporosis in Patients with Knee Osteoarthritis: A Multicenter Comparative Study of the Fracture Risk Assessment Tool and World Health Organization Criteria

 , , and
Abstract
:1. Introduction
2. Materials and Methods
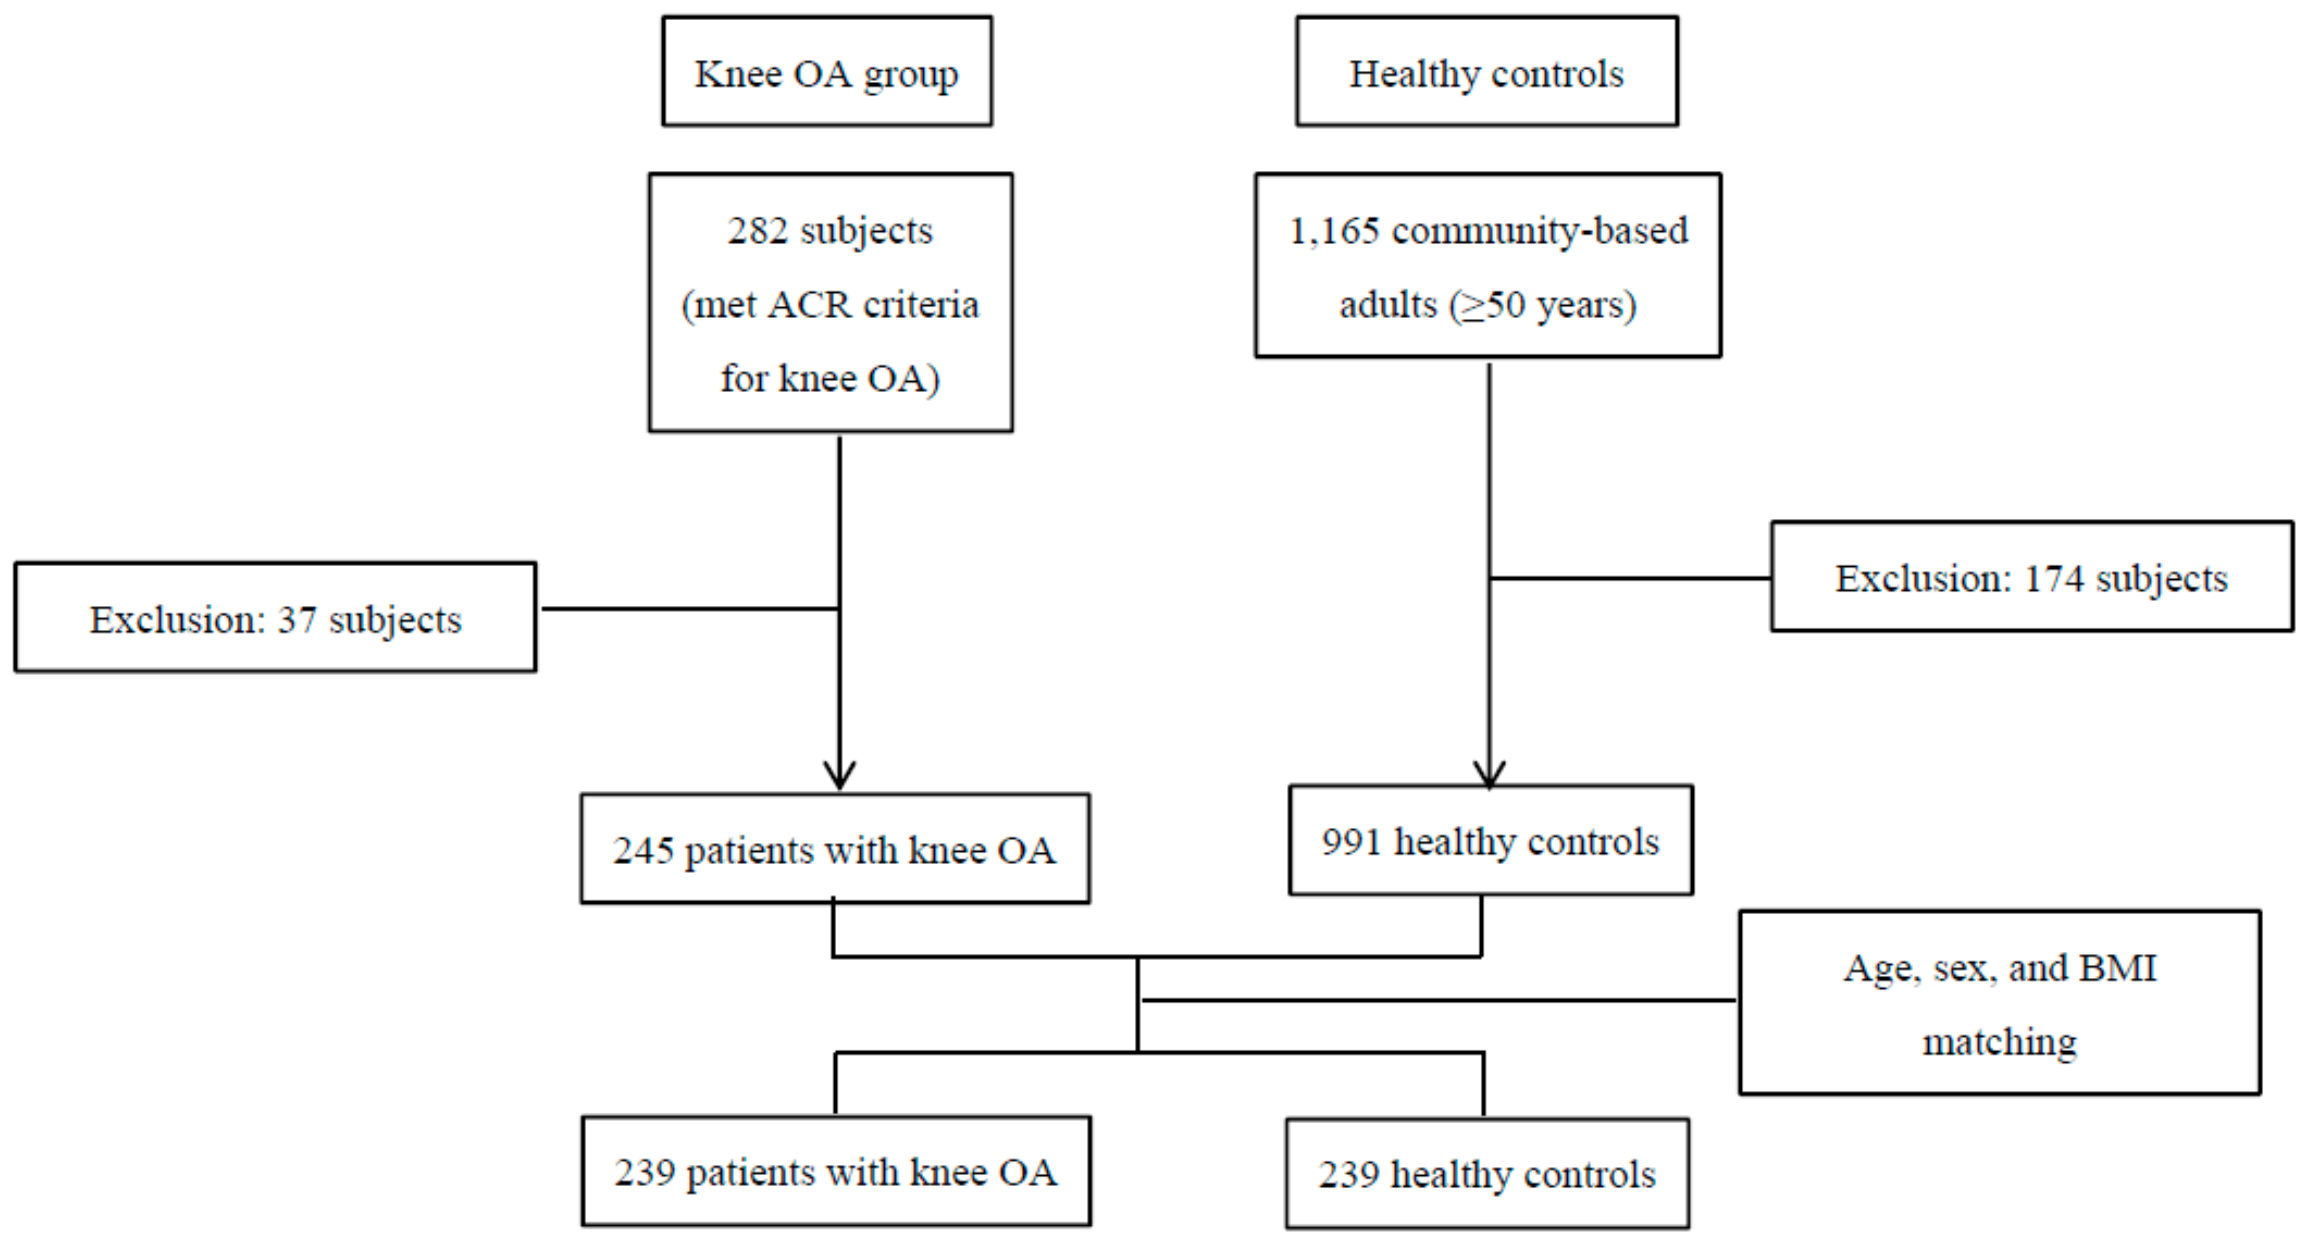
2.1. Study Design and Subjects
2.2. BMD Evaluation
2.3. Osteoporotic Fracture Assessment Using the FRAX Calculation
2.4. Statistical Analysis
3. Results
4. Discussion
5. Conclusions
Author Contributions
Funding
Acknowledgments
Conflicts of Interest
References
- Stewart, A.; Black, A.J. Bone mineral density in osteoarthritis. Curr. Opin. Rheumatol. 2000, 12, 464–467. [Google Scholar] [CrossRef] [PubMed]
- Dequeker, J.; Aerssens, J.; Luyten, F.P. Osteoarthritis and osteoporosis: Clinical and research evidence of inverse relationship. Aging Clin. Exp. Res. 2003, 15, 426–439. [Google Scholar] [CrossRef] [PubMed]
- Jones, G.; Nguren, T.; Sambrook, P.N.; Lord, S.R.; Kelly, P.J.; Eisman, J.A. Osteoarthritis, bone density, postural stability, and osteoporotic fracture: A population based study. J. Rheumatol. 1995, 22, 921–925. [Google Scholar] [PubMed]
- Arden, N.K.; Nevitt, M.C.; Lane, N.E.; Gore, L.R.; Hochberg, M.C.; Scott, J.C.; Pressman, A.R.; Cummings, S.R. Osteoarthritis and risk of falls, rates of bone loss, and osteoporotic fractures. Study of osteoporotic fracture research group. Arthritis Rheum. 1999, 42, 1378–1385. [Google Scholar] [CrossRef]
- Bergink, A.P.; Van Der Klift, M.; Hofman, A.; Verhaar, J.A.; Van Leeuwen, J.P.; Uitterlinden, A.G.; Pols, H.A. Osteoarthritis of the knee is associated with vertebral and nonvertebral fracutres in the elderly: The Rotterdam study. Arthritis Rheum. 2003, 49, 648–657. [Google Scholar] [CrossRef] [PubMed]
- Bultink, I.E.; Lems, W.F. Osteoarthritis and osteoporosis: What is the overlap? Curr. Rheumatol. Rep. 2013, 15, 328. [Google Scholar] [CrossRef] [PubMed]
- Breijawi, N.; Eckardt, A.; Pitton, M.B.; Hoelzl, A.J.; Giesa, M.; Von Stechow, D.; Haid, F.; Drees, P. Bone mineral density and vitamin D status in female and male patients with osteoarthritis of the knee of hip. Eur. Surg. Res. 2009, 42, 1–10. [Google Scholar] [CrossRef]
- Domingues, V.R.; de Campos, G.C.; Plapler, P.G.; de Rezende, M.U. Prevalence of osteoporosis in patients awating total hip arthroplasty. Acta Ortop. Bras. 2015, 23, 34–37. [Google Scholar] [CrossRef]
- Lingard, E.A.; Mitchell, S.Y.; Francis, R.M.; Rawlings, D.; Peaston, R.; Birrell, F.N.; McCaskie, A.W. The prevalence of osteoporosis in patients with severe hip and knee osteoarthritis awaiting joint arthroplasty. Age Ageing 2010, 39, 234–239. [Google Scholar] [CrossRef]
- World Health Organisation. WHO Technical Report Series 843. In Assessment of Fracture Risk and its Application to Screening for Postmenopausal Osteoporosis; WHO: Geneva, Switzerland, 1994. [Google Scholar]
- Pasco, J.A.; Seeman, E.; Henry, M.J.; Merriman, E.N.; Nicholson, G.C.; Kotowicz, M.A. The population burden of fractures originates in women with osteopenia, not osteoporosis. Osteoporos. Int. 2006, 17, 1404–1409. [Google Scholar] [CrossRef]
- Nguyen, N.D.; Eisman, J.A.; Center, J.R.; Nguyen, T.V. Risk factors for fracture in nonosteoporotic men and women. J. Clin. Endocrinol. Metab. 2007, 92, 955–962. [Google Scholar] [CrossRef] [PubMed]
- Kanis, J.A.; Johnell, O.; Oden, A.; Johansson, H.; McCloskey, E. FRAX and the assessment of fracture probability in men and women from the UK. Osteoporos. Int. 2008, 19, 385–397. [Google Scholar] [CrossRef] [PubMed]
- Kanis, J.A.; McCloskey, E.; Johansson, H.; Oden, A.; Leslie, W.D. FRAX with and without bone mineral density. Calcif. Tissue Int 2012, 90, 1–13. [Google Scholar] [CrossRef] [PubMed]
- Bijlsma, J.W.; Berenbaum, F.; Lafeber, F.P. Osteoarthritis: An update with relevance for clinical practice. Lancet 2011, 377, 2115–2126. [Google Scholar] [CrossRef]
- Kellgren, J.H.; Lawrence, J.S. Radiological assessment of osteo-arthrosis. Ann. Rheum. Dis. 1957, 16, 494–502. [Google Scholar] [CrossRef] [PubMed]
- Kim, K.H.; Lee, K.; Ko, Y.J.; Kim, S.J.; Oh, S.I.; Durrance, D.Y.; Yoo, D.; Park, S.M. Prevalence, awareness, and treatment of osteoporosis among Korean women: The fourth Korea National Health and Nutrition Examination Survey. Bone 2012, 50, 1039–1047. [Google Scholar] [CrossRef] [PubMed]
- Chang, C.B.; Kim, T.K.; Kang, Y.G.; Seong, S.C.; Kang, S.B. Prevalence of osteoporosis in female patients with advanced knee osteoarthritis undergoing total knee arthroplasty. J. Korean Med. Sci. 2014, 29, 1425–1431. [Google Scholar] [CrossRef] [PubMed]
- Sandini, L.; Arokoski, J.P.; Jurvelin, J.S.; Kroger, H. Increased bone mineral content but not bone mineral density in the hip in surgically treated knee and hip osteoarthritis. J. Rheumatol. 2005, 32, 1951–1957. [Google Scholar]
- Kanis, J.A.; Harvey, N.C.; Johansson, H.; Oden, A.; Leslie, W.D.; McCloskey, E.V. FRAX and fracture prediction without bone mineral density. Climacteric 2015, 18, 2–9. [Google Scholar] [CrossRef]
- Kanis, J.A.; Burlet, N.; Cooper, C.; Delmas, P.D.; Reginster, J.Y.; Borgstrom, F.; Rizzoli, R. European guidance for the diagnosis and management of osteoporosis in postmenopausal women. Osteoporos. Int. 2008, 19, 399–428. [Google Scholar] [CrossRef] [Green Version]
- Siris, E.S.; Chen, Y.T.; Abbott, T.A.; Barrett-Connor, E.; Miller, P.D.; Wehren, L.E.; Berger, M.L. Bone mineral density thresholds for pharmacological intervention to prevent fracture. Arch. Intern. Med. 2004, 164, 1108–1112. [Google Scholar] [CrossRef] [PubMed]
- Chan, M.Y.; Center, J.R.; Eisman, J.A.; Nguyen, T.V. Bone mineral density and association of osteoarthritis with fracture risk. Osteoarthr. Cartil. 2014, 22, 1251–1258. [Google Scholar] [CrossRef] [PubMed] [Green Version]
- Johansson, H.; Azizieh, F.; al Ali, N.; Alessa, T.; Harvey, N.C.; McCloskey, E.; Kanis, J.A. FRAX- vs. T-score-based intervention thresholds for osteoporosis. Osteoporos. Int. 2017, 28, 3099–3105. [Google Scholar] [CrossRef] [PubMed] [Green Version]
- Prieto-Alhambra, D.; Nogues, X.; Javaid, M.K.; Wyman, A.; Arden, N.K.; Azagra, R.; Cooper, C.; Adachi, J.D.; Boonen, S.; Chapurlat, R.D.; et al. An increased rate of falling leads to a rise in fracture risk in postmenopausal women with self-reported osteoarthritis: A prospective multinational cohort study (GLOW). Ann. Rheum. Dis. 2013, 72, 911–917. [Google Scholar] [CrossRef] [PubMed]
- Ding, C.; Cicuttini, F.; Boon, C.; Boon, P.; Srikanth, V.; Cooley, H.; Jones, G. Knee and hip radiographic osteoarthritis predict total hip bone loss in older adults: A prospective study. J. Bone Miner. Res. 2010, 25, 858–862. [Google Scholar] [CrossRef] [PubMed]
- Burger, H.; van Daele, P.L.; Odding, E.; Valkenburg, H.A.; Hofman, A.; Grobbee, D.E.; Schütte, H.E.; Birkenhäger, J.C.; Pols, H.A. Association of radiographically evident osteoarthritis with higher bone mineral density and increased bone loss with age. The Rotterdam Study. Arthritis Rheum. 1996, 39, 81–86. [Google Scholar] [CrossRef] [PubMed]
- Bultink, I.E.; Vis, M.; van der Horst-Bruinsma, I.E.; Lems, W.F. Inflammatory rheumatic disorders and Bone. Curr. Rheumatol. Rep. 2012, 14, 224–230. [Google Scholar] [CrossRef] [PubMed]
- Van Spil, W.E.; Welsing, P.M.; Kloppenburg, M.; Bierma-Zeinstra, S.M.; Bijlsma, J.W.; Mastbergen, S.C.; Lafeber, F.P. Cross-sectional and predictive associations between plamsa adipokines and radiographic signs of early-stage knee osteoarthritis: Data from CHECK. Osteoarthr. Cartil. 2012, 20, 1278–1285. [Google Scholar] [CrossRef] [PubMed]
- Zhang, Y.; Xu, L.; Nevitt, M.C.; Aliabadi, P.; Yu, W.; Qin, M.; Lui, L.Y.; Felson, D.T. Comparison of the prevalence of knee osteoarthritis between the elderly Chinese Population in Beijing and Whites in the United Status: The Beijing Osteoarthritis Study. Arthritis Rheum. 2001, 44, 2065–2071. [Google Scholar] [CrossRef]
- Atik, O.S.; Gunal, I.; Korkusuz, F. Burden of osteoporosis. Clin. Orthop. Relat. Res. 2006, 443, 19–24. [Google Scholar] [CrossRef]


| Osteoarthritis n = 239 | Healthy Controls n = 239 | p Value | |
|---|---|---|---|
| Demographics | |||
| Age (year), mean ± SD | 67.1 ± 9.3 | 67.1 ± 9.2 | 0.8244 |
| Sex (female), n (%) | 231 (96.7) | 231 (96.7) | - |
| Height (cm), mean ± SD | 153.1 ± 6.7 | 153.2 ± 6.5 | 0.7682 |
| Weight (kg), mean ± SD | 56.4 ± 9.3 | 56.7 ± 9.2 | 0.3427 |
| BMI (kg/m2), mean ± SD | 24 ± 3.5 | 24 ± 3.4 | 0.9676 |
| BMD T-scores, mean ± SD | |||
| Proximal femur | |||
| Neck | −1.6 ± 1.0 | −1.4 ± 1.1 | 0.036 * |
| Femur total | −1.2 ± 1.1 | −1.2 ± 1.4 | 0.712 |
| Lumbar spine | −1.8 ± 1.3 | −1.8 ± 1.4 | 0.646 |
| Osteoarthritis n = 239 | Healthy Controls n = 239 | p Value | |
|---|---|---|---|
| Femur BMD T-scores, n (%) | 0.173 | ||
| Normal | 54 (22.6) | 69 (28.9) | |
| Osteopenia | 137 (57.3) | 125 (52.3) | |
| Osteoporosis | 48 (20.1) | 45 (18.8) | |
| Lumbar BMD T-scores, n (%) | 0.084 | ||
| Normal | 49 (20.8) | 66 (28) | |
| Osteopenia | 113 (47.9) | 95 (40.3) | |
| Osteoporosis | 74 (31.4) | 75 (31.8) |
| Osteoarthritis n = 239 | Healthy Controls n = 239 | p Value | |
|---|---|---|---|
| Age (year), mean ± SD | 67.1 ± 9.3 | 67.1 ± 9.2 | 0.8244 |
| BMI (kg/m²), mean ± SD | 24 ± 3.5 | 24 ± 3.4 | 0.9676 |
| Sex (female), n (%) | 231 (96.7) | 231 (96.7) | - |
| Previous fracture, n (%) | 37 (15.5) | 0 (0) | <0.001 * |
| Parent fractured hip, n (%) | 0 (0) | 0 (0) | - |
| Current smoking, n (%) | 1 (0.5) | 3 (1.4) | 0.317 |
| >3 units of alcohol per day, n (%) | 0 (0) | 2 (0.9) | 0.157 |
| Patients with Previous Fractures n = 37 | Patients without Previous Fractures n = 202 | p Value | |
|---|---|---|---|
| FRAX calculations, Mean ± SD | |||
| Major osteoporotic fracture probability with femur BMD | 10.4 ± 5.7 | 6.3 ± 2.9 | <0.0001 * |
| Hip fracture probability with femur BMD | 4.0 ± 4.3 | 1.8 ± 1.7 | <0.0001 * |
| Major osteoporotic fracture probability without femur BMD | 11.6 ± 4.2 | 7.3 ± 3.1 | <0.0001 * |
| Hip fracture probability without femur BMD | 4.7 ± 2.5 | 2.7 ± 2.1 | <0.0001 * |
| Osteoarthritis n = 194 | Healthy Controls n = 194 | p Value | |
|---|---|---|---|
| Femur BMD T-scores, n (%) | 0.461 | ||
| Normal | 46 (23.7) | 55 (28.4) | |
| Osteopenia | 114 (58.8) | 105 (54.1) | |
| Osteoporosis | 34 (17.5) | 34 (17.5) | |
| Lumbar BMD T-scores, n (%) | 0.053 | ||
| Normal | 39 (20.4) | 56 (29.3) | |
| Osteopenia | 95 (49.7) | 77 (40.3) | |
| Osteoporosis | 57 (29.8) | 58 (30.4) |
| Osteoarthritis n = 194 | Healthy Controls n = 194 | p Value | |
|---|---|---|---|
| FRAX calculations, Mean ± SD | |||
| Major osteoporotic fracture probability with femur BMD | 6.4 ± 2.9 | 6.0 ± 2.6 | 0.104 |
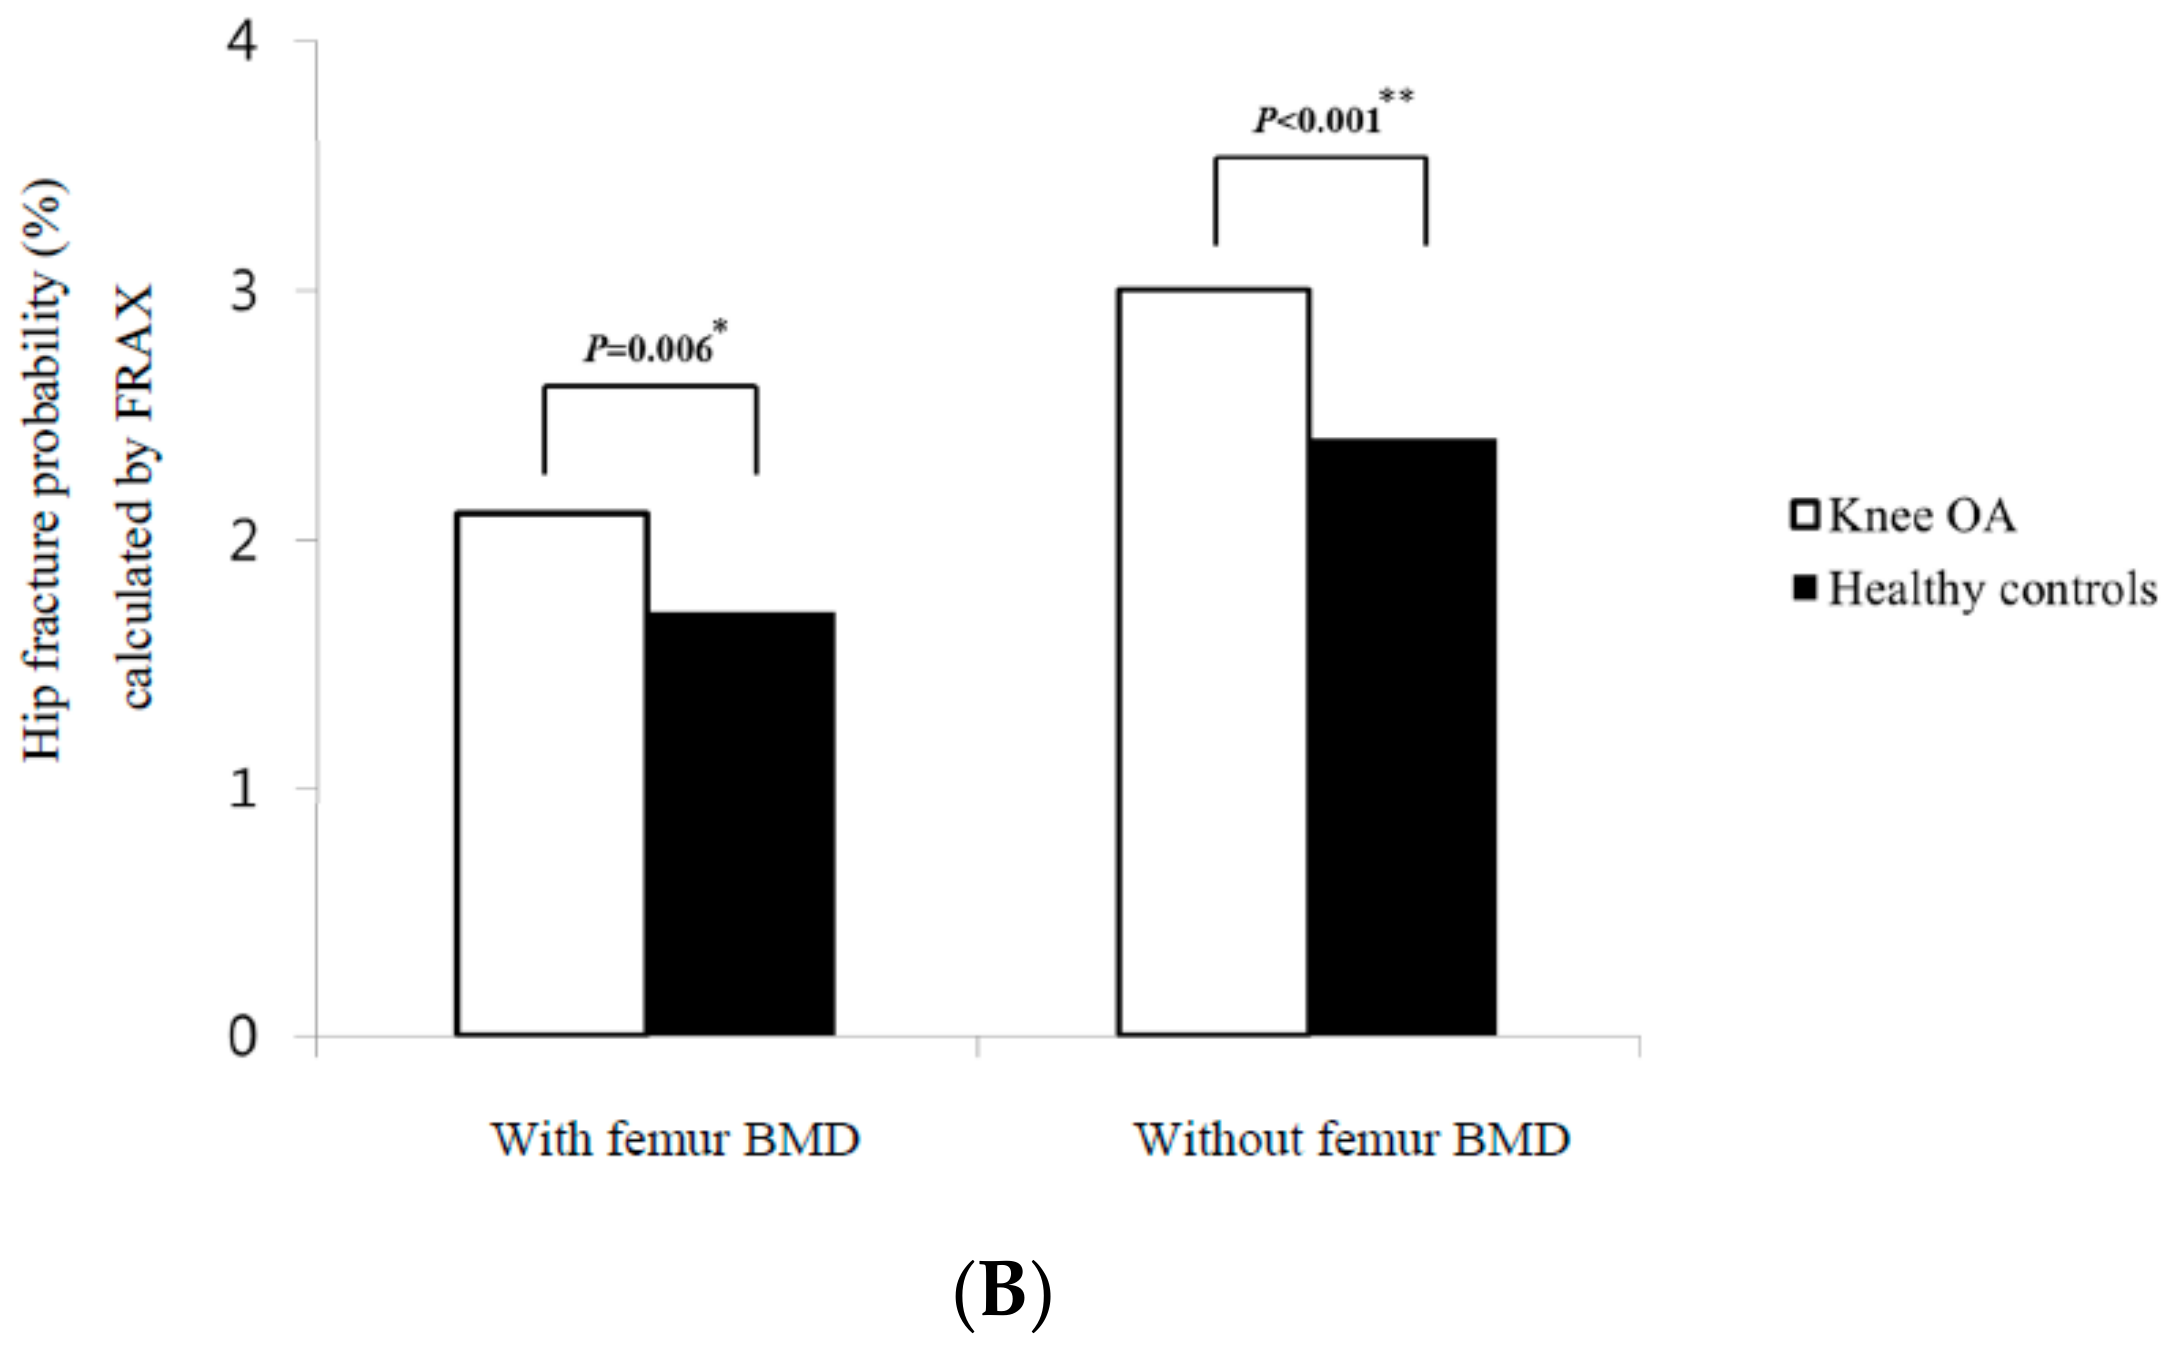
| Hip fracture probability with femur BMD | 1.8 ± 1.8 | 1.6± 1.6 | 0.090 |
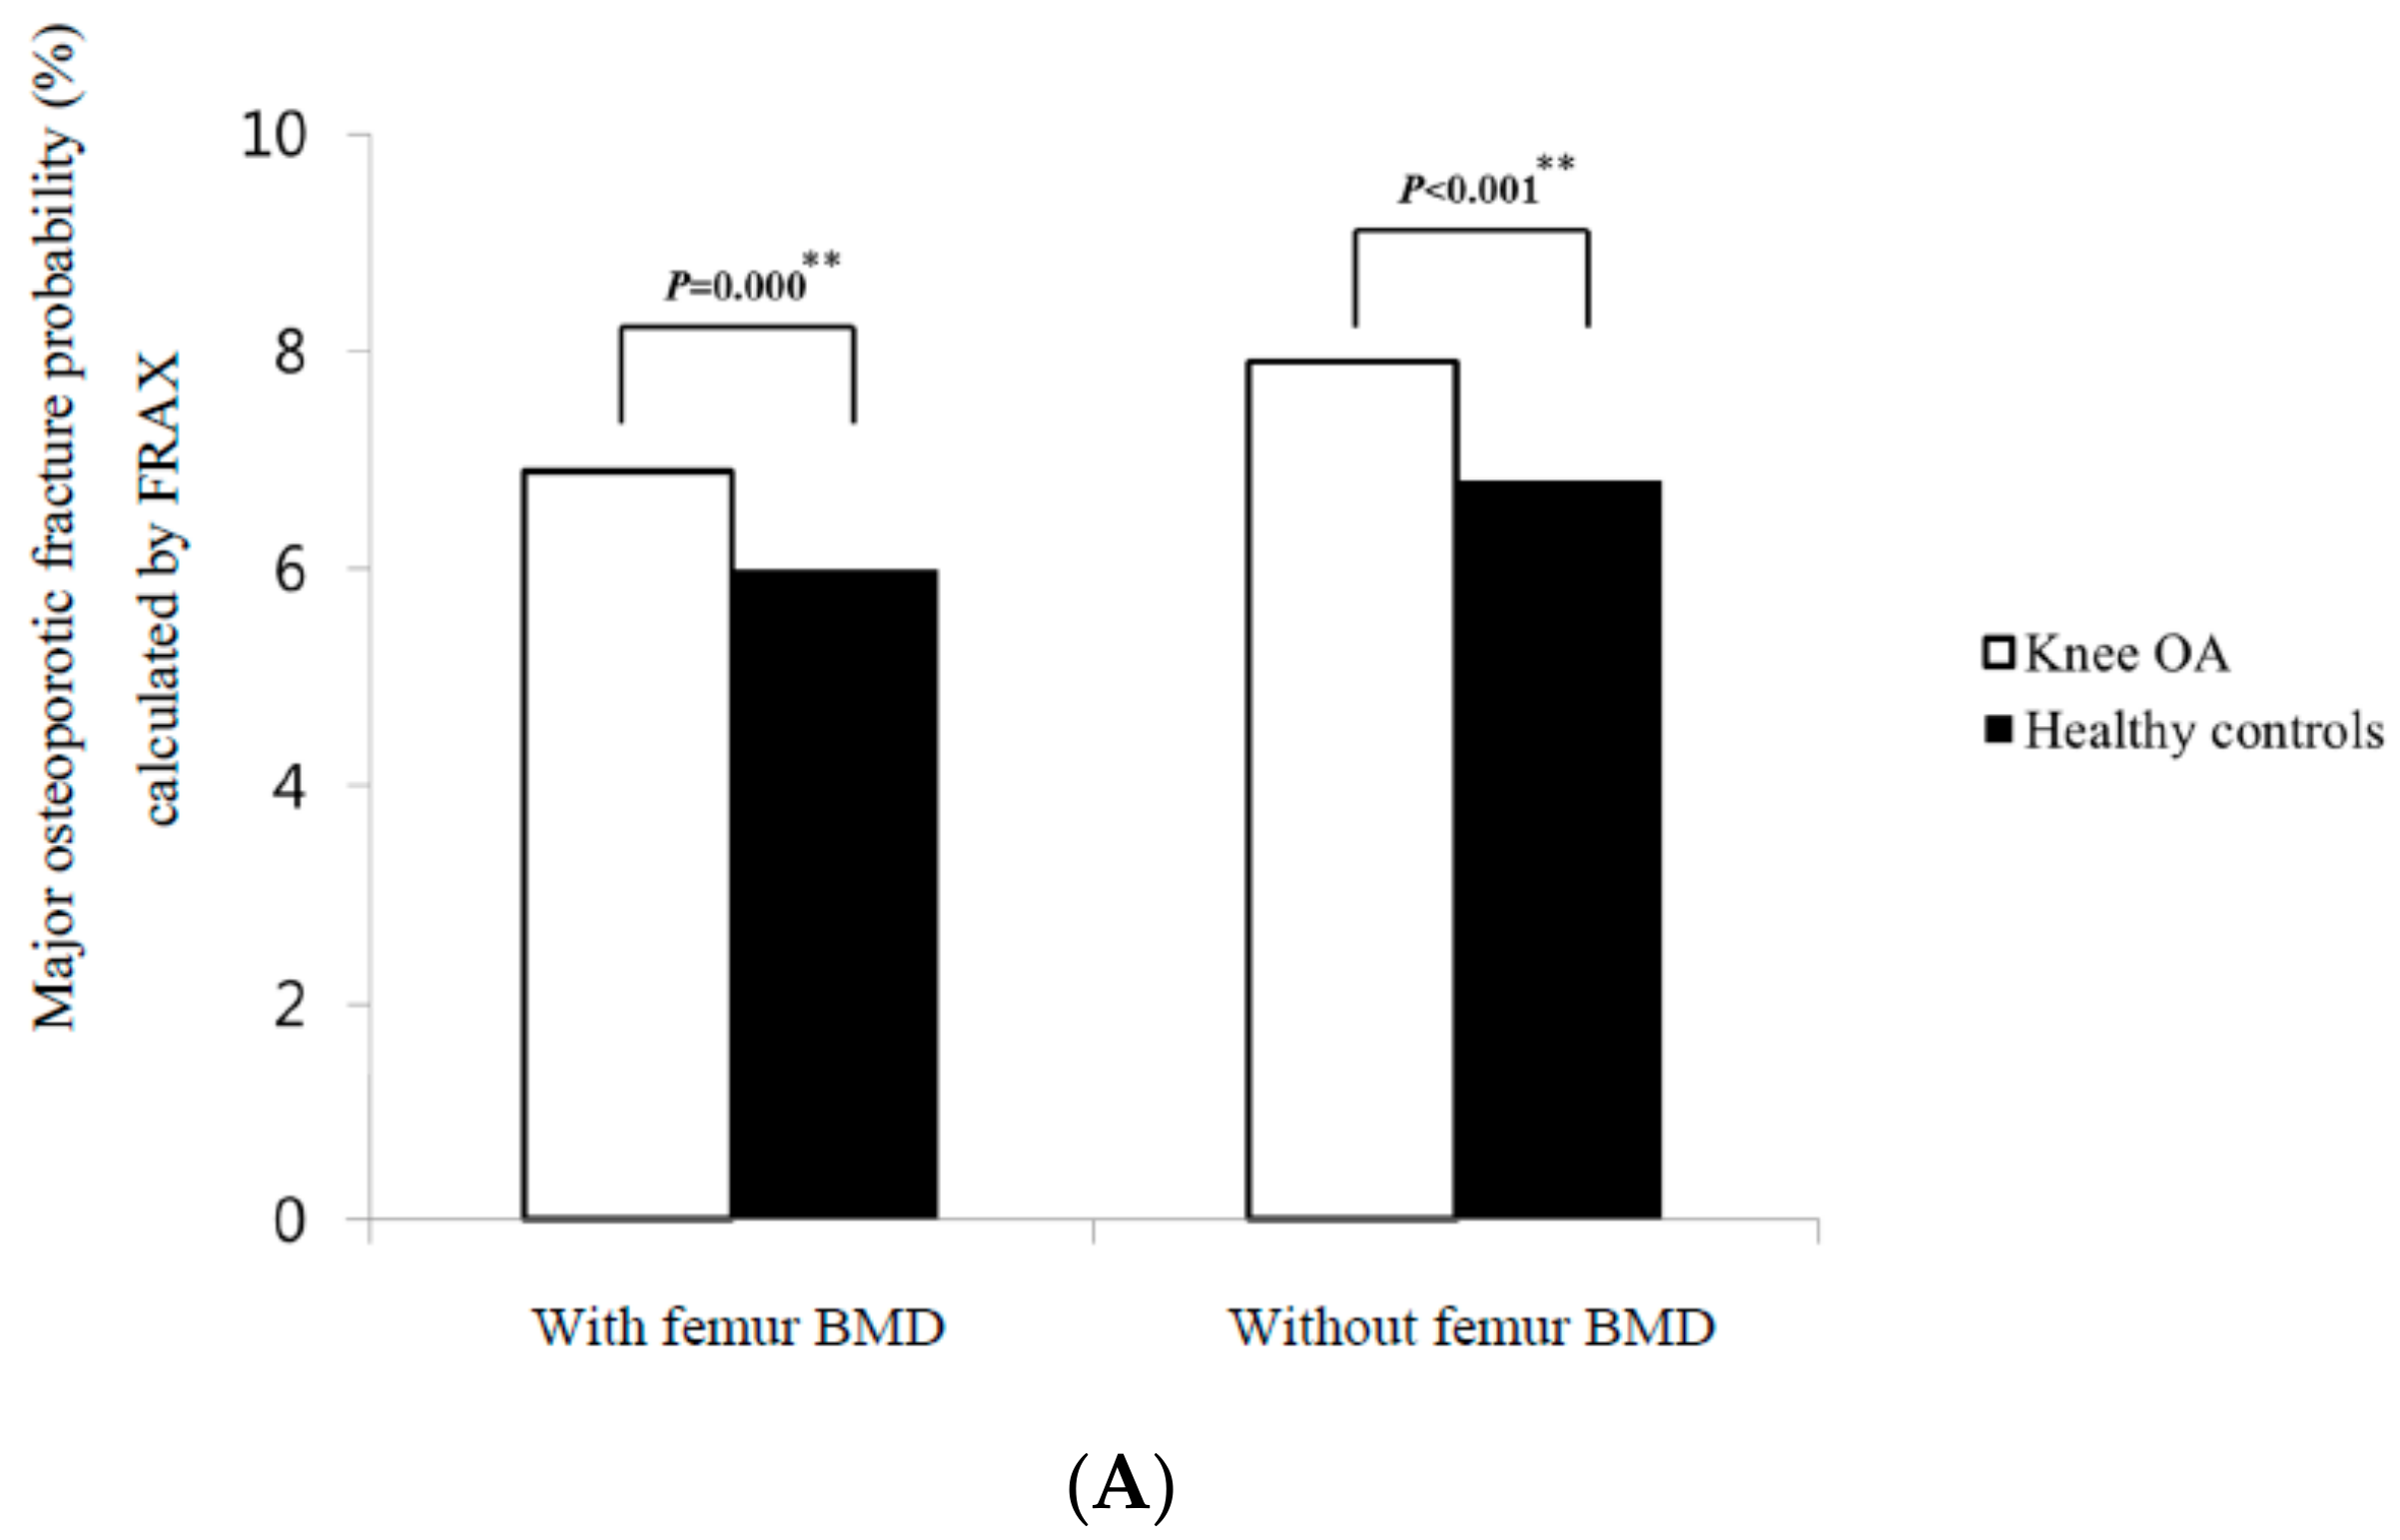
| Major osteoporotic fracture probability without femur BMD | 7.5 ± 3.0 | 6.8 ± 2.2 | <0.0001 ** |
| Hip fracture probability without femur BMD | 2.7 ± 2.1 | 2.3 ± 1.6 | <0.0001 ** |
| Candidates for pharmacological intervention, n (%) | |||
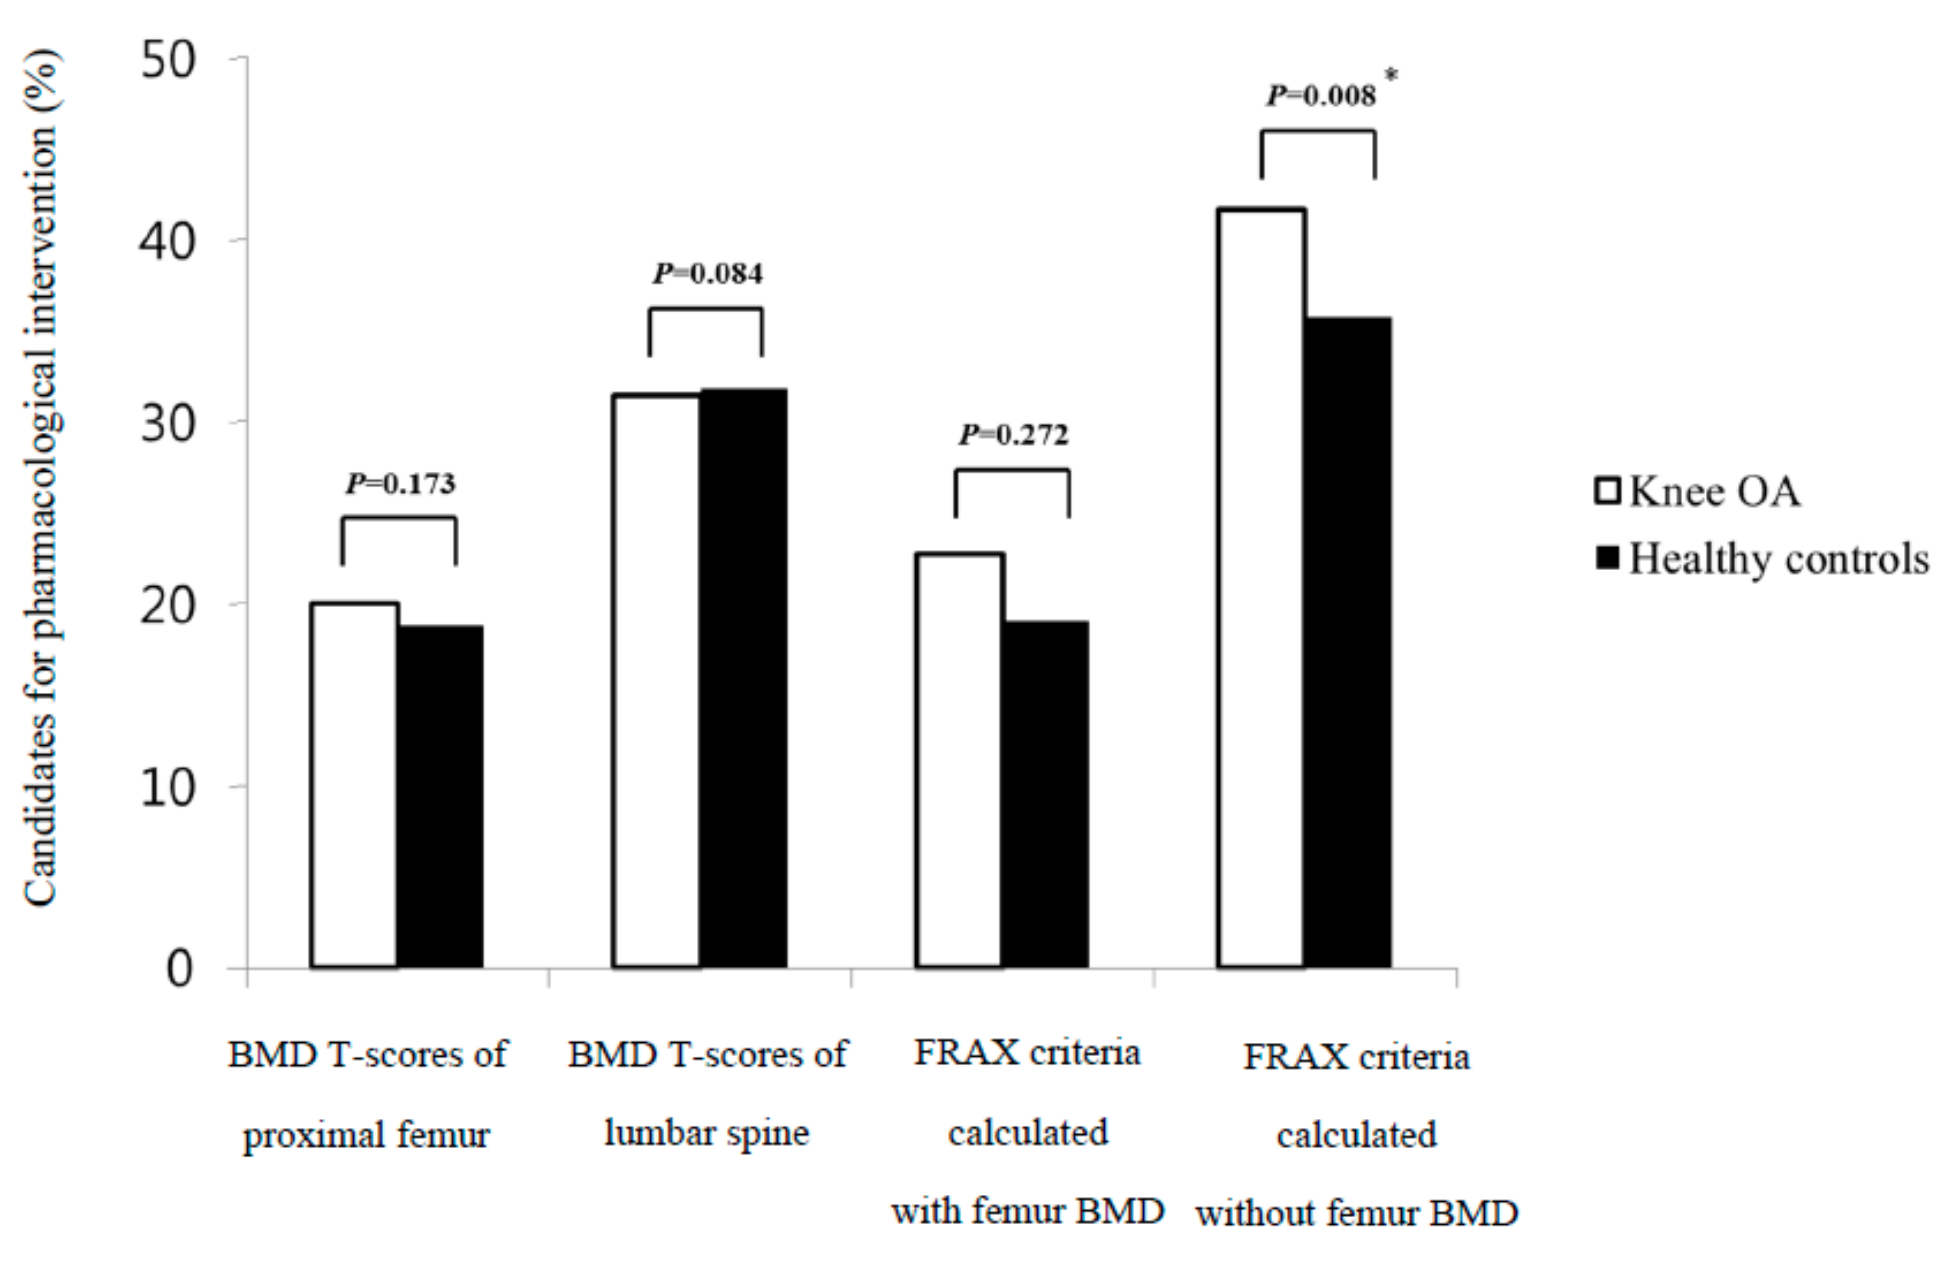
| FRAX with femur BMD | 37 (19.1) | 34 (17.5) | 0.691 |
| FRAX without femur BMD | 74 (38.1) | 64 (33.0) | 0.025 * |
| Non High-Risk Group of Osteoporotic Fracture | High-Risk Group of Osteoporotic Fracture | p Value | |
|---|---|---|---|
| BMD T-scores, n (%) | <0.001 * | ||
| Normal | 24 (17.3) | 3 (3.0) | |
| Osteopenia | 73 (52.5) | 43 (43.0) | |
| Osteoporosis | 42 (30.2) | 54 (54.0) |
| Non high-risk group of osteoporotic fracture | High-risk group of osteoporotic fracture | p Value | |
| BMD T-scores, n (%) | < 0.001 * | ||
| Normal | 27 (14.6) | 0 (0.0) | |
| Osteopenia | 110 (59.5) | 6 (11.1) | |
| Osteoporosis | 48 (26.0) | 48 (88.9) |
© 2019 by the authors. Licensee MDPI, Basel, Switzerland. This article is an open access article distributed under the terms and conditions of the Creative Commons Attribution (CC BY) license (http://creativecommons.org/licenses/by/4.0/).
Share and Cite
Kim, B.Y.; Kim, H.-A.; Jung, J.-Y.; Choi, S.T.; Kim, J.-M.; Kim, S.H.; Kwon, S.-R.; Suh, C.-H.; Kim, S.-S. Clinical Impact of the Fracture Risk Assessment Tool on the Treatment Decision for Osteoporosis in Patients with Knee Osteoarthritis: A Multicenter Comparative Study of the Fracture Risk Assessment Tool and World Health Organization Criteria. J. Clin. Med. 2019, 8, 918. https://doi.org/10.3390/jcm8070918
Kim BY, Kim H-A, Jung J-Y, Choi ST, Kim J-M, Kim SH, Kwon S-R, Suh C-H, Kim S-S. Clinical Impact of the Fracture Risk Assessment Tool on the Treatment Decision for Osteoporosis in Patients with Knee Osteoarthritis: A Multicenter Comparative Study of the Fracture Risk Assessment Tool and World Health Organization Criteria. Journal of Clinical Medicine. 2019; 8(7):918. https://doi.org/10.3390/jcm8070918
Chicago/Turabian StyleKim, Bo Young, Hyoun-Ah Kim, Ju-Yang Jung, Sang Tae Choi, Ji-Min Kim, Sang Hyon Kim, Seong-Ryul Kwon, Chang-Hee Suh, and Sung-Soo Kim. 2019. "Clinical Impact of the Fracture Risk Assessment Tool on the Treatment Decision for Osteoporosis in Patients with Knee Osteoarthritis: A Multicenter Comparative Study of the Fracture Risk Assessment Tool and World Health Organization Criteria" Journal of Clinical Medicine 8, no. 7: 918. https://doi.org/10.3390/jcm8070918