Waist Circumference and All-Cause Mortality Independent of Body Mass Index in Korean Population from the National Health Insurance Health Checkup 2009–2015

 ,
,
Abstract
:1. Introduction
2. Methods
2.1. The NHIS Database and NHIS Health Checkup Data
Subjects
2.2. Definition of Obesity and Abdominal Obesity
2.3. General Health Behavior and Socio-Demographic Variables
2.4. All-Cause Mortality
2.5. Statistical Analysis
3. Results
4. Discussion
5. Conclusions
Supplementary Materials
Author Contributions
Funding
Acknowledgments
Conflicts of Interest
References
- World Health Organization. The Asia-Pacific Perspective: Redefining Obesity and Its Treatment; International Association for the Study of Obesity; Health Communications Australia: Sydney, Australia, 2000. [Google Scholar]
- Executive Summary of the Clinical Guidelines on the Identification, Evaluation, and Treatment of Overweight and Obesity in Adults. Arch. Intern. Med. 1998, 158, 1855–1867. [CrossRef]
- Janssen, I.; Mark, A.E. Elevated body mass index and mortality risk in the elderly. Obes. Rev. 2007, 8, 41–59. [Google Scholar] [CrossRef] [PubMed]
- Prospective Studies Collaboration; Whitlock, G.; Lewington, S.; Sherliker, P.; Clarke, R.; Emberson, J.; Halsey, J.; Qizilbash, N.; Collins, R.; Peto, R. Body-mass index and cause-specific mortality in 900 000 adults: Collaborative analyses of 57 prospective studies. Lancet 2009, 373, 1083–1096. [Google Scholar] [CrossRef]
- Jee, S.H.; Sull, J.W.; Park, J.; Lee, S.Y.; Ohrr, H.; Guallar, E.; Samet, J.M. Body-mass index and mortality in Korean men and women. N. Engl. J. Med. 2006, 355, 779–787. [Google Scholar] [CrossRef] [PubMed]
- Kim, N.H.; Lee, J.; Kim, T.J.; Kim, N.H.; Choi, K.M.; Baik, S.H.; Choi, D.S.; Pop-Busui, R.; Park, Y.; Kim, S.G. Body Mass Index and Mortality in the General Population and in Subjects with Chronic Disease in Korea: A Nationwide Cohort Study (2002–2010). PLoS ONE 2015, 10, e0139924. [Google Scholar] [CrossRef] [PubMed]
- Strain, G.W.; Zumoff, B. The relationship of weight-height indices of obesity to body fat content. J. Am. Coll. Nutr. 1992, 11, 715–718. [Google Scholar] [CrossRef]
- Visscher, T.L.; Seidell, J.C.; Molarius, A.; van der Kuip, D.; Hofman, A.; Witteman, J.C. A comparison of body mass index, waist-hip ratio and waist circumference as predictors of all-cause mortality among the elderly: The Rotterdam study. Int. J. Obes. Relat. Metab. Disord. 2001, 25, 1730–1735. [Google Scholar] [CrossRef]
- National Institutes of Health. Clinical Guidelines on the Identification, Evaluation, and Treatment of Overweight and Obesity in Adults—The Evidence Report. Obes. Res. 1998, 6 (Suppl. 2), 51S–209S. [Google Scholar]
- Wang, Y.; Rimm, E.B.; Stampfer, M.J.; Willett, W.C.; Hu, F.B. Comparison of abdominal adiposity and overall obesity in predicting risk of type 2 diabetes among men. Am. J. Clin. Nutr. 2005, 81, 555–563. [Google Scholar] [CrossRef]
- Carey, V.J.; Walters, E.E.; Colditz, G.A.; Solomon, C.G.; Willett, W.C.; Rosner, B.A.; Speizer, F.E.; Manson, J.E. Body fat distribution and risk of non-insulin-dependent diabetes mellitus in women. The Nurses’ Health Study. Am. J. Epidemiol. 1997, 145, 614–619. [Google Scholar] [CrossRef]
- Snijder, M.B.; Zimmet, P.Z.; Visser, M.; Dekker, J.M.; Seidell, J.C.; Shaw, J.E. Independent and opposite associations of waist and hip circumferences with diabetes, hypertension and dyslipidemia: The AusDiab Study. Int. J. Obes. Relat. Metab. Disord. 2004, 28, 402–409. [Google Scholar] [CrossRef] [PubMed]
- Van Pelt, R.E.; Evans, E.M.; Schechtman, K.B.; Ehsani, A.A.; Kohrt, W.M. Waist circumference vs body mass index for prediction of disease risk in postmenopausal women. Int. J. Obes. Relat. Metab. Disord. 2001, 25, 1183–1188. [Google Scholar] [CrossRef] [PubMed] [Green Version]
- Canoy, D. Distribution of body fat and risk of coronary heart disease in men and women. Curr. Opin. Cardiol. 2008, 23, 591–598. [Google Scholar] [CrossRef] [PubMed]
- Katzmarzyk, P.T.; Craig, C.L.; Bouchard, C. Adiposity, adipose tissue distribution and mortality rates in the Canada Fitness Survey follow-up study. Int. J. Obes. Relat. Metab. Disord. 2002, 26, 1054–1059. [Google Scholar] [CrossRef] [PubMed] [Green Version]
- Lahmann, P.H.; Lissner, L.; Gullberg, B.; Berglund, G. A prospective study of adiposity and all-cause mortality: The Malmo Diet and Cancer Study. Obes. Res. 2002, 10, 361–369. [Google Scholar] [CrossRef] [PubMed]
- Pischon, T.; Boeing, H.; Hoffmann, K.; Bergmann, M.; Schulze, M.B.; Overvad, K.; van der Schouw, Y.T.; Spencer, E.; Moons, K.G.; Tjonneland, A.; et al. General and abdominal adiposity and risk of death in Europe. N. Engl. J. Med. 2008, 359, 2105–2120. [Google Scholar] [CrossRef]
- Simpson, J.A.; MacInnis, R.J.; Peeters, A.; Hopper, J.L.; Giles, G.G.; English, D.R. A comparison of adiposity measures as predictors of all-cause mortality: The Melbourne Collaborative Cohort Study. Obesity 2007, 15, 994–1003. [Google Scholar] [CrossRef]
- Baik, I.; Ascherio, A.; Rimm, E.B.; Giovannucci, E.; Spiegelman, D.; Stampfer, M.J.; Willett, W.C. Adiposity and mortality in men. Am. J. Epidemiol. 2000, 152, 264–271. [Google Scholar] [CrossRef]
- Bigaard, J.; Tjonneland, A.; Thomsen, B.L.; Overvad, K.; Heitmann, B.L.; Sorensen, T.I. Waist circumference, BMI, smoking, and mortality in middle-aged men and women. Obes. Res. 2003, 11, 895–903. [Google Scholar] [CrossRef]
- Folsom, A.R.; Kushi, L.H.; Anderson, K.E.; Mink, P.J.; Olson, J.E.; Hong, C.P.; Sellers, T.A.; Lazovich, D.; Prineas, R.J. Associations of general and abdominal obesity with multiple health outcomes in older women: The Iowa Women’s Health Study. Arch. Intern. Med. 2000, 160, 2117–2128. [Google Scholar] [CrossRef]
- Janssen, I.; Katzmarzyk, P.T.; Ross, R. Body mass index is inversely related to mortality in older people after adjustment for waist circumference. J. Am. Geriatr. Soc. 2005, 53, 2112–2118. [Google Scholar] [CrossRef]
- Koster, A.; Leitzmann, M.F.; Schatzkin, A.; Mouw, T.; Adams, K.F.; van Eijk, J.T.; Hollenbeck, A.R.; Harris, T.B. Waist circumference and mortality. Am. J. Epidemiol. 2008, 167, 1465–1475. [Google Scholar] [CrossRef] [PubMed]
- Zhang, C.; Rexrode, K.M.; van Dam, R.M.; Li, T.Y.; Hu, F.B. Abdominal obesity and the risk of all-cause, cardiovascular, and cancer mortality: Sixteen years of follow-up in US women. Circulation 2008, 117, 1658–1667. [Google Scholar] [CrossRef] [PubMed]
- Cerhan, J.R.; Moore, S.C.; Jacobs, E.J.; Kitahara, C.M.; Rosenberg, P.S.; Adami, H.O.; Ebbert, J.O.; English, D.R.; Gapstur, S.M.; Giles, G.G.; et al. A pooled analysis of waist circumference and mortality in 650,000 adults. Mayo Clin. Proc. 2014, 89, 335–345. [Google Scholar] [CrossRef] [PubMed]
- Jacobs, E.J.; Newton, C.C.; Wang, Y.; Patel, A.V.; McCullough, M.L.; Campbell, P.T.; Thun, M.J.; Gapstur, S.M. Waist circumference and all-cause mortality in a large US cohort. Arch. Intern. Med. 2010, 170, 1293–1301. [Google Scholar] [CrossRef]
- Zhang, X.; Shu, X.O.; Yang, G.; Li, H.; Cai, H.; Gao, Y.T.; Zheng, W. Abdominal adiposity and mortality in Chinese women. Arch. Intern. Med. 2007, 167, 886–892. [Google Scholar] [CrossRef] [PubMed]
- Lee, J.; Lee, J.S.; Park, S.H.; Shin, S.A.; Kim, K. Cohort Profile: The National Health Insurance Service-National Sample Cohort (NHIS-NSC), South Korea. Int. J. Epidemiol. 2016, 46, e15. [Google Scholar] [CrossRef]
- Song, S.O.; Jung, C.H.; Song, Y.D.; Park, C.Y.; Kwon, H.S.; Cha, B.S.; Park, J.Y.; Lee, K.U.; Ko, K.S.; Lee, B.W. Background and data configuration process of a nationwide population-based study using the korean national health insurance system. Diabetes Metab. J. 2014, 38, 395–403. [Google Scholar] [CrossRef]
- National Health Insurance Service: Health Checkup. Available online: https://nhiss.nhis.or.kr/bd/ay/bdaya001iv.do (accessed on 11 February 2017).
- Lee, S.Y.; Park, H.S.; Kim, D.J.; Han, J.H.; Kim, S.M.; Cho, G.J.; Kim, D.Y.; Kwon, H.S.; Kim, S.R.; Lee, C.B.; et al. Appropriate waist circumference cutoff points for central obesity in Korean adults. Diabetes Res. Clin. Pract. 2007, 75, 72–80. [Google Scholar] [CrossRef] [Green Version]
- Hu, F. Obesity and Mortality; Oxford University Press: New York, NY, USA, 2008. [Google Scholar]
- de Hollander, E.L.; Bemelmans, W.J.; Boshuizen, H.C.; Friedrich, N.; Wallaschofski, H.; Guallar-Castillon, P.; Walter, S.; Zillikens, M.C.; Rosengren, A.; Lissner, L.; et al. The association between waist circumference and risk of mortality considering body mass index in 65- to 74-year-olds: A meta-analysis of 29 cohorts involving more than 58 000 elderly persons. Int. J. Epidemiol. 2012, 41, 805–817. [Google Scholar] [CrossRef]
- Krotkiewski, M.; Bjorntorp, P.; Sjostrom, L.; Smith, U. Impact of obesity on metabolism in men and women. Importance of regional adipose tissue distribution. J. Clin. Investig. 1983, 72, 1150–1162. [Google Scholar] [CrossRef] [PubMed]
- Kuk, J.L.; Lee, S.; Heymsfield, S.B.; Ross, R. Waist circumference and abdominal adipose tissue distribution: Influence of age and sex. Am. J. Clin. Nutr. 2005, 81, 1330–1334. [Google Scholar] [CrossRef] [PubMed]
- Fox, C.S.; Massaro, J.M.; Hoffmann, U.; Pou, K.M.; Maurovich-Horvat, P.; Liu, C.Y.; Vasan, R.S.; Murabito, J.M.; Meigs, J.B.; Cupples, L.A.; et al. Abdominal visceral and subcutaneous adipose tissue compartments: Association with metabolic risk factors in the Framingham Heart Study. Circulation 2007, 116, 39–48. [Google Scholar] [CrossRef] [PubMed]
- Janssen, I.; Heymsfield, S.B.; Allison, D.B.; Kotler, D.P.; Ross, R. Body mass index and waist circumference independently contribute to the prediction of nonabdominal, abdominal subcutaneous, and visceral fat. Am. J. Clin. Nutr. 2002, 75, 683–688. [Google Scholar] [CrossRef] [PubMed] [Green Version]
- Despres, J.P.; Lemieux, I.; Bergeron, J.; Pibarot, P.; Mathieu, P.; Larose, E.; Rodes-Cabau, J.; Bertrand, O.F.; Poirier, P. Abdominal obesity and the metabolic syndrome: Contribution to global cardiometabolic risk. Arterioscler. Thromb. Vasc. Biol. 2008, 28, 1039–1049. [Google Scholar] [CrossRef] [PubMed]
- Haslam, D.W.; James, W.P. Obesity. Lancet 2005, 366, 1197–1209. [Google Scholar] [CrossRef]
- Festa, A.; D’Agostino, R., Jr.; Williams, K.; Karter, A.J.; Mayer-Davis, E.J.; Tracy, R.P.; Haffner, S.M. The relation of body fat mass and distribution to markers of chronic inflammation. Int. J. Obes. Relat. Metab. Disord. 2001, 25, 1407–1415. [Google Scholar] [CrossRef] [Green Version]
- Panagiotakos, D.B.; Pitsavos, C.; Yannakoulia, M.; Chrysohoou, C.; Stefanadis, C. The implication of obesity and central fat on markers of chronic inflammation: The ATTICA study. Atherosclerosis 2005, 183, 308–315. [Google Scholar] [CrossRef]
- Farin, H.M.; Abbasi, F.; Reaven, G.M. Body mass index and waist circumference correlate to the same degree with insulin-mediated glucose uptake. Metabolism 2005, 54, 1323–1328. [Google Scholar] [CrossRef]
- Wannamethee, S.G.; Shaper, A.G.; Morris, R.W.; Whincup, P.H. Measures of adiposity in the identification of metabolic abnormalities in elderly men. Am. J. Clin. Nutr. 2005, 81, 1313–1321. [Google Scholar] [CrossRef] [Green Version]
- Klein, S.; Allison, D.B.; Heymsfield, S.B.; Kelley, D.E.; Leibel, R.L.; Nonas, C.; Kahn, R.; Association for Weight Management and Obesity Prevention; NAASO, The Obesity Society; American Society for Nutrition; et al. Waist circumference and cardiometabolic risk: A consensus statement from shaping America’s health: Association for Weight Management and Obesity Prevention; NAASO, the Obesity Society; the American Society for Nutrition; and the American Diabetes Association. Diabetes Care 2007, 30, 1647–1652. [Google Scholar] [PubMed]
- Snijder, M.B.; van Dam, R.M.; Visser, M.; Seidell, J.C. What aspects of body fat are particularly hazardous and how do we measure them? Int. J. Epidemiol. 2006, 35, 83–92. [Google Scholar] [CrossRef] [PubMed]


| Waist Circumference Group | ||||||
|---|---|---|---|---|---|---|
| 1 | 2 | 3 | 4 | 5 | 6 | |
| N | 8,672,967 | 5,362,342 | 4,538,812 | 2,714,222 | 1,253,456 | 722,079 |
| Men (yes,%) | 3,450,338(39.78) | 3,079,604(57.43) | 2,648,218(58.35) | 1,604,864(59.13) | 679,425(54.2) | 351,401(48.67) |
| Age (year) | 42.69 ± 13.76 | 48.24 ± 13.42 | 50.91 ± 13.44 | 52.43 ± 13.67 | 53.33 ± 14.18 | 52.5 ± 15.11 |
| Age group (yes,%) | ||||||
| 20–40 | 3,596,630(41.47) | 1,384,164(25.81) | 915,952(20.18) | 492,555(18.15) | 225,771(18.01) | 158,788(21.99) |
| 40–64 | 4,399,758(50.73) | 3,297,574(61.5) | 2,842,275(62.62) | 1,651,324(60.84) | 720,342(57.47) | 381,554(52.84) |
| 65–85 | 676,579(7.8) | 680,604(12.69) | 780,585(17.2) | 570,343(21.01) | 307,343(24.52) | 181,737(25.17) |
| Body mass index (kg/m2) | 21.05 ± 2.04 | 23.51 ± 1.89 | 24.99 ± 2.01 | 26.47 ± 2.16 | 28.04 ± 2.37 | 30.68 ± 3.21 |
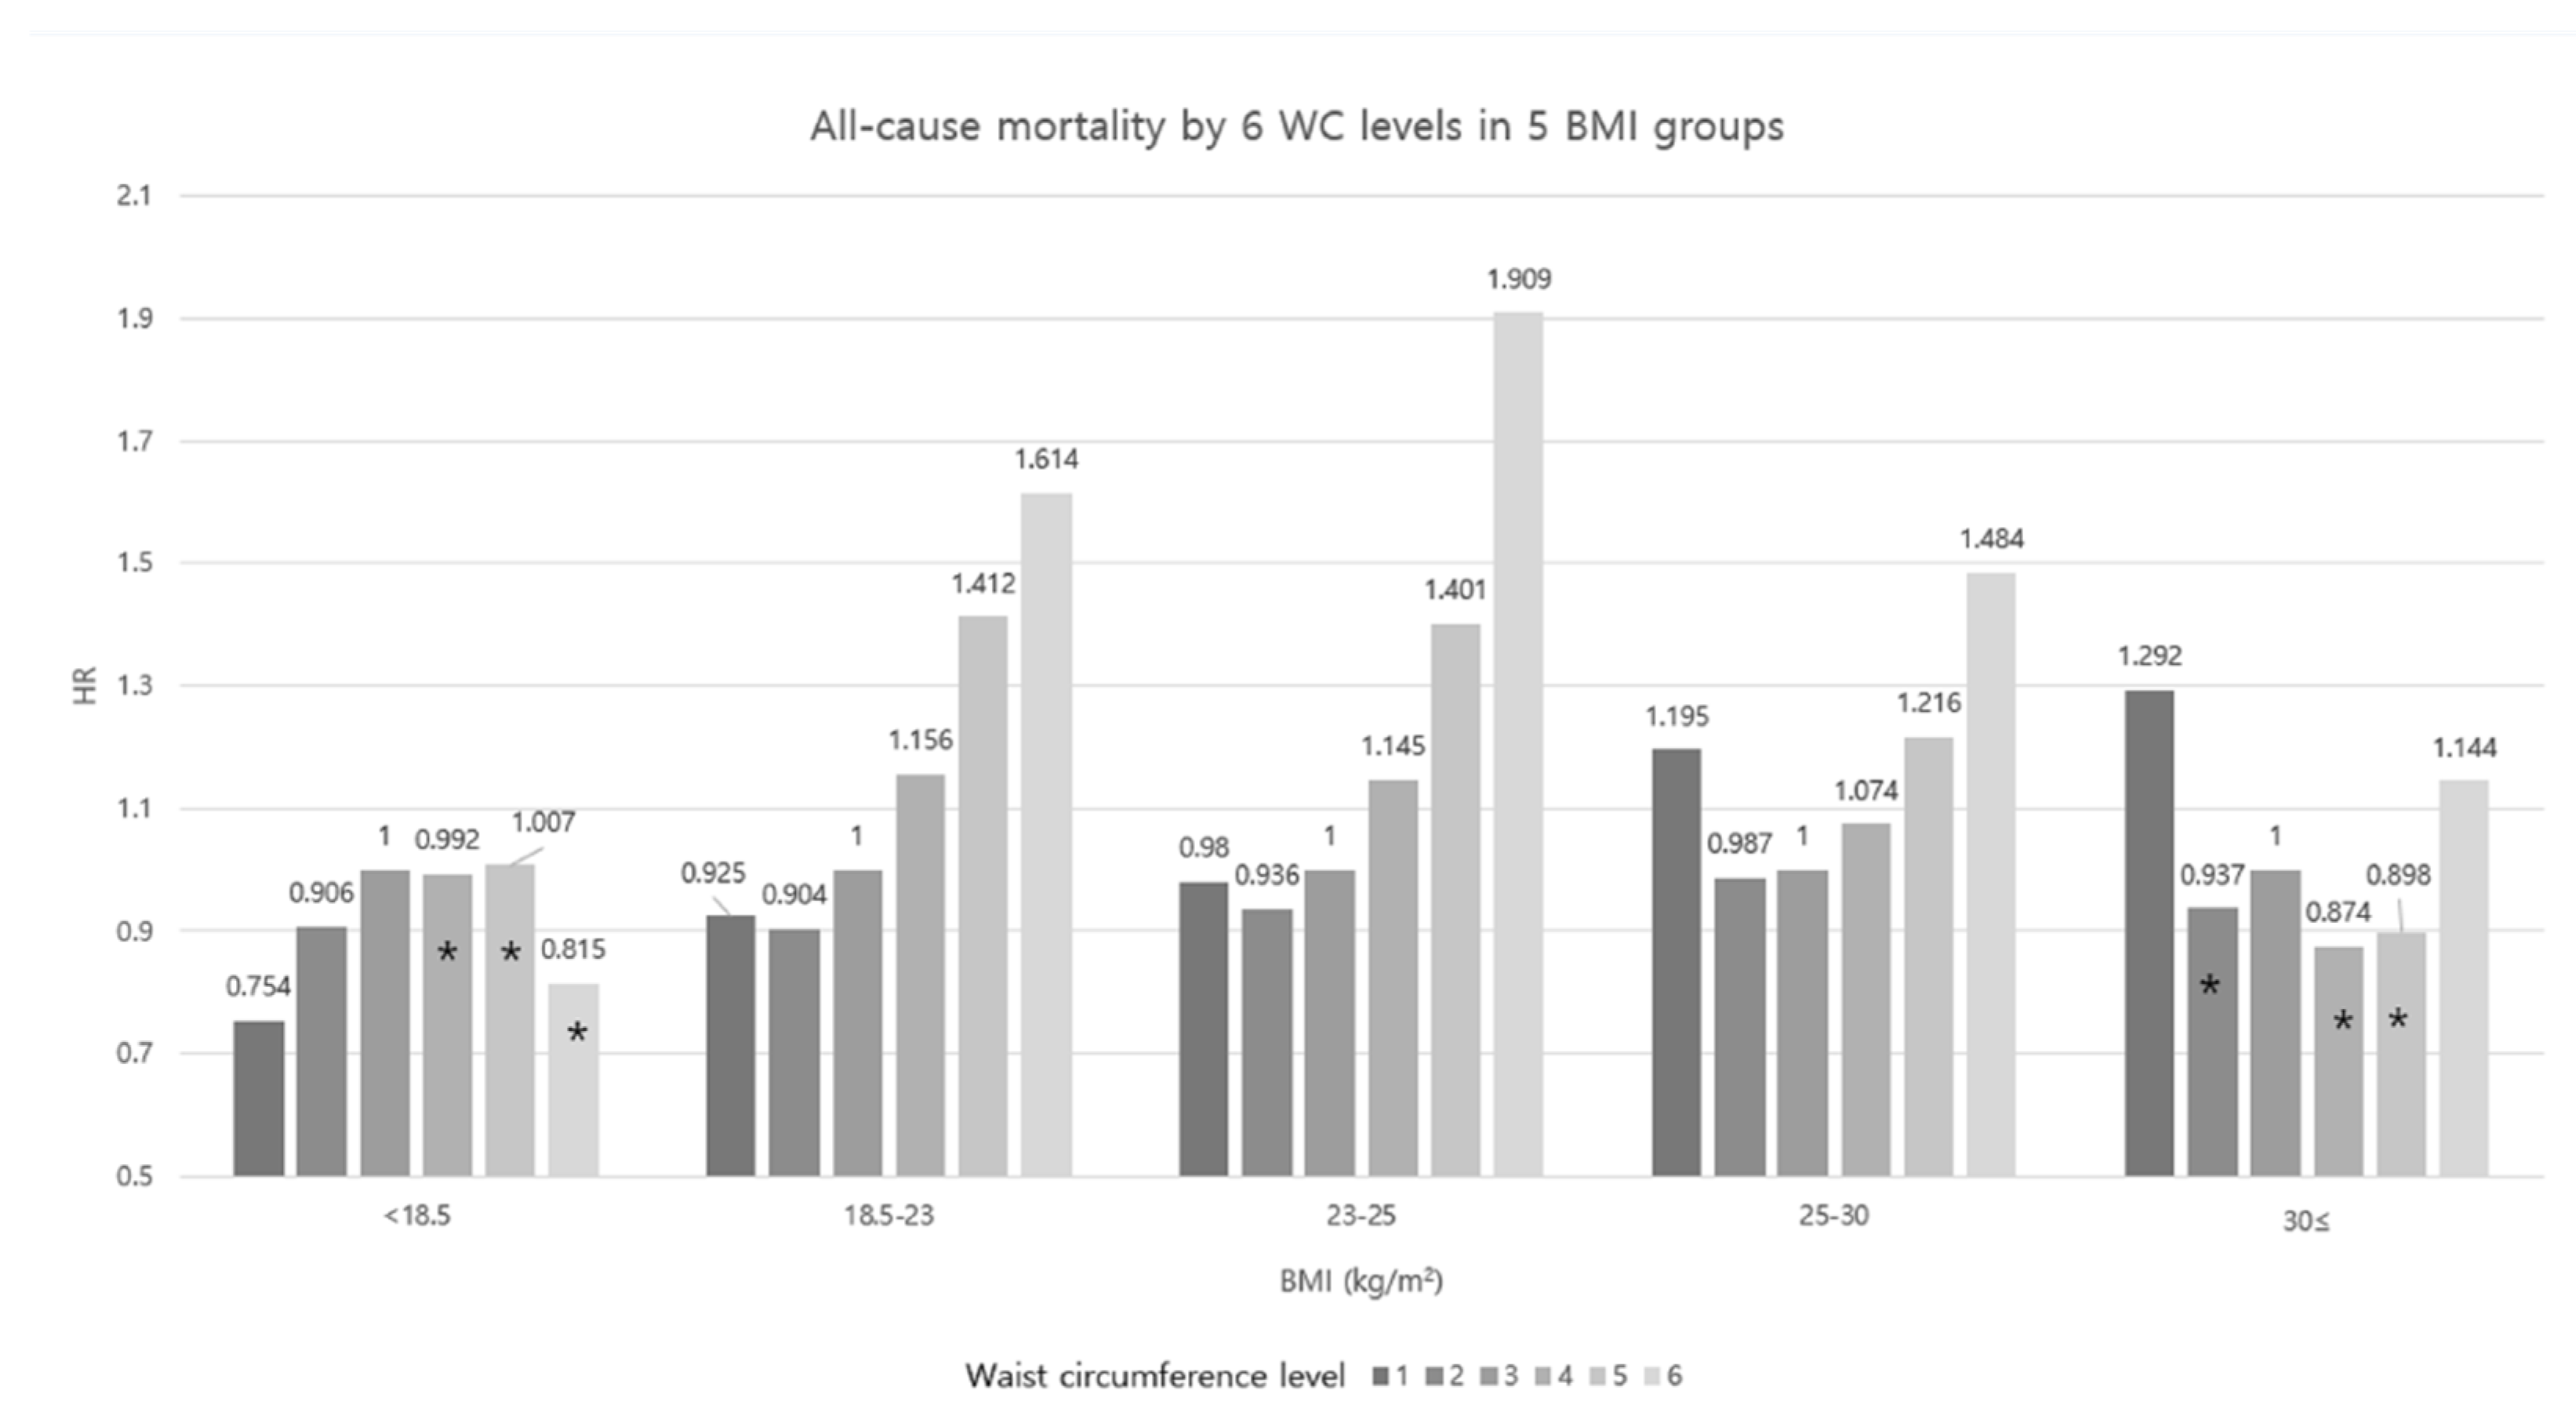
| <18.5 | 901,949(10.4) | 24,771(0.46) | 6702(0.15) | 2197(0.08) | 638(0.05) | 287(0.04) |
| 18.5–23 | 6,323,446(72.91) | 2,090,324(38.98) | 678,158(14.94) | 125,309(4.62) | 20,215(1.61) | 5471(0.76) |
| 23–25 | 1,213,690(13.99) | 2,156,699(40.22) | 1,637,121(36.07) | 516,685(19.04) | 90,541(7.22) | 14,870(2.06) |
| 25–30 | 230,364(2.66) | 1,080,974(20.16) | 2,167,188(47.75) | 1,925,391(70.94) | 897,990(71.64) | 288,858(40) |
| ≥30 | 3518(0.04) | 9574(0.18) | 49,643(1.09) | 144,640(5.33) | 244,072(19.47) | 412,593(57.14) |
| Smoking (yes,%) | ||||||
| Non | 5,964,846(68.78) | 3,106,503(57.93) | 2,592,749(57.12) | 1,531,141(56.41) | 741,549(59.16) | 446,954(61.9) |
| Former | 786,403(9.07) | 812,076(15.14) | 765,533(16.87) | 481,828(17.75) | 205,172(16.37) | 100,249(13.88) |
| Current | 1,921,718(22.16) | 1,443,763(26.92) | 1,180,530(26.01) | 701,253(25.84) | 306,735(24.47) | 174,876(24.22) |
| Alcohol drinking (yes,%) | ||||||
| Non | 4,784,499(55.17) | 2,741,740(51.13) | 2,368,663(52.19) | 1,433,874(52.83) | 700,834(55.91) | 425,314(58.9) |
| Moderate | 3,422,946(39.47) | 2,178,086(40.62) | 1,756,031(38.69) | 1,006,673(37.09) | 426,554(34.03) | 225,813(31.27) |
| Heavy | 465,522(5.37) | 442,516(8.25) | 414,118(9.12) | 273,675(10.08) | 126,068(10.06) | 70,952(9.83) |
| Regular exercise (yes,%) | 1,405,021(16.2) | 1,027,051(19.15) | 864,575(19.05) | 498,760(18.38) | 216,517(17.27) | 112,544(15.59) |
| Income (Q1) (yes,%) | 1,931,941(22.28) | 1,090,911(20.34) | 911,431(20.08) | 551,669(20.33) | 265,490(21.18) | 163,770(22.68) |
| Urban living (yes,%) | 4,058,601(46.82) | 2,471,135(46.11) | 2,065,373(45.53) | 1,211,852(44.68) | 549,845(43.91) | 31,2001(43.27) |
| Death (yes,%) | 149,733(1.73) | 111,307(2.08) | 106,771(2.35) | 72,606(2.68) | 37,763(3.01) | 24,276(3.36) |
| HR (95% C.I.) | |||||||
|---|---|---|---|---|---|---|---|
| WC Group | N | Death | Duration | Incidence Rate | Model 1 | Model 2 | Model 3 |
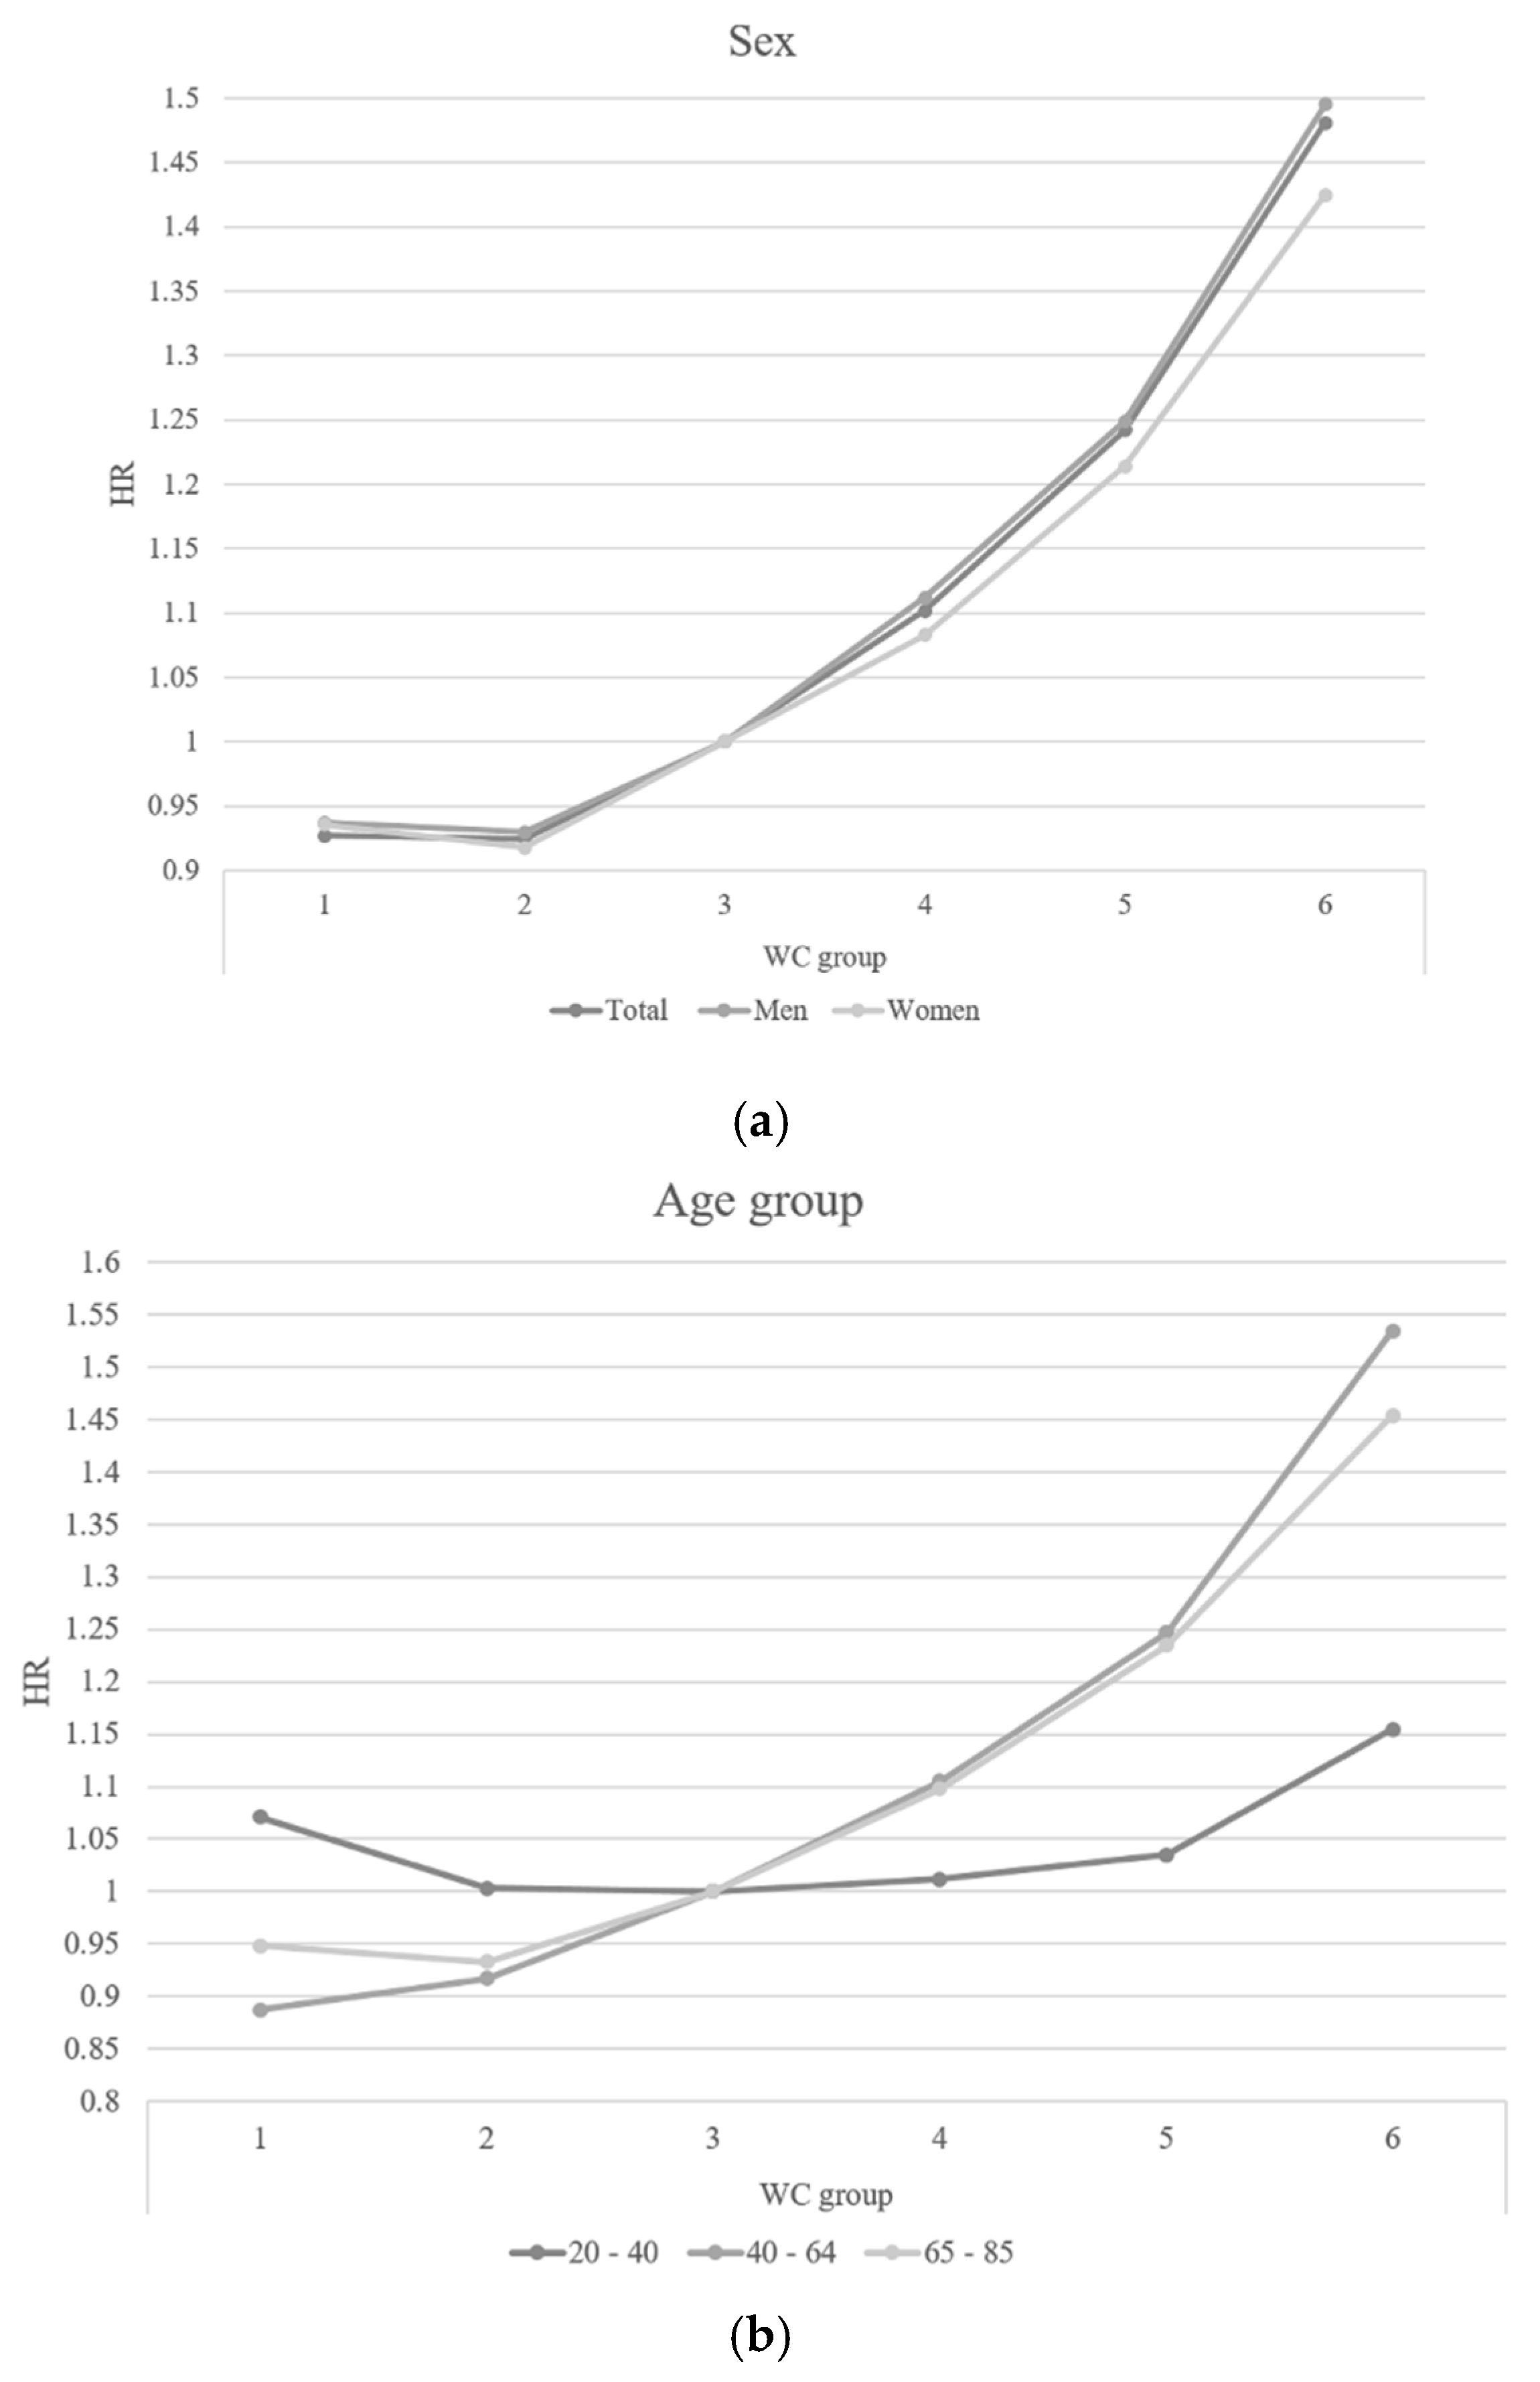
| 1 | 8,672,967 | 149,733 | 46,394,946.4 | 3.22736 | 1.375(1.364,1.386) | 1.328(1.317,1.338) | 0.927(0.919,0.936) |
| 2 | 5,362,342 | 111,307 | 29,089,043.6 | 3.82642 | 1.069(1.06,1.078) | 1.06(1.051,1.069) | 0.925(0.917,0.933) |
| 3 | 4,538,812 | 106,771 | 24,633,745.2 | 4.33434 | 1 | 1 | 1 |
| 4 | 2,714,222 | 72,606 | 14,677,575.8 | 4.94673 | 0.993(0.984,1.003) | 0.995(0.985,1.004) | 1.102(1.091,1.113) |
| 5 | 1,253,456 | 37,763 | 6,731,707.3 | 5.60972 | 1.063(1.051,1.076) | 1.061(1.048,1.073) | 1.242(1.226,1.257) |
| 6 | 722,079 | 24,276 | 3,814,427.1 | 6.36426 | 1.262(1.245,1.28) | 1.247(1.23,1.264) | 1.481(1.457,1.505) |
© 2019 by the authors. Licensee MDPI, Basel, Switzerland. This article is an open access article distributed under the terms and conditions of the Creative Commons Attribution (CC BY) license (http://creativecommons.org/licenses/by/4.0/).
Share and Cite
Kim, Y.-H.; Kim, S.M.; Han, K.-D.; Jung, J.-H.; Lee, S.-S.; Oh, S.W.; Park, H.S.; Rhee, E.-J.; Lee, W.-Y.; Yoo, S.J. Waist Circumference and All-Cause Mortality Independent of Body Mass Index in Korean Population from the National Health Insurance Health Checkup 2009–2015. J. Clin. Med. 2019, 8, 72. https://doi.org/10.3390/jcm8010072
Kim Y-H, Kim SM, Han K-D, Jung J-H, Lee S-S, Oh SW, Park HS, Rhee E-J, Lee W-Y, Yoo SJ. Waist Circumference and All-Cause Mortality Independent of Body Mass Index in Korean Population from the National Health Insurance Health Checkup 2009–2015. Journal of Clinical Medicine. 2019; 8(1):72. https://doi.org/10.3390/jcm8010072
Chicago/Turabian StyleKim, Yang-Hyun, Seon Mee Kim, Kyung-Do Han, Jin-Hyung Jung, Seong-Su Lee, Sang Woo Oh, Hye Soon Park, Eun-Jung Rhee, Won-Young Lee, and Soon Jib Yoo. 2019. "Waist Circumference and All-Cause Mortality Independent of Body Mass Index in Korean Population from the National Health Insurance Health Checkup 2009–2015" Journal of Clinical Medicine 8, no. 1: 72. https://doi.org/10.3390/jcm8010072