How Unawareness of Weight Excess Can Increase Cardiovascular Risk?

 , , , and
Abstract
:1. Introduction
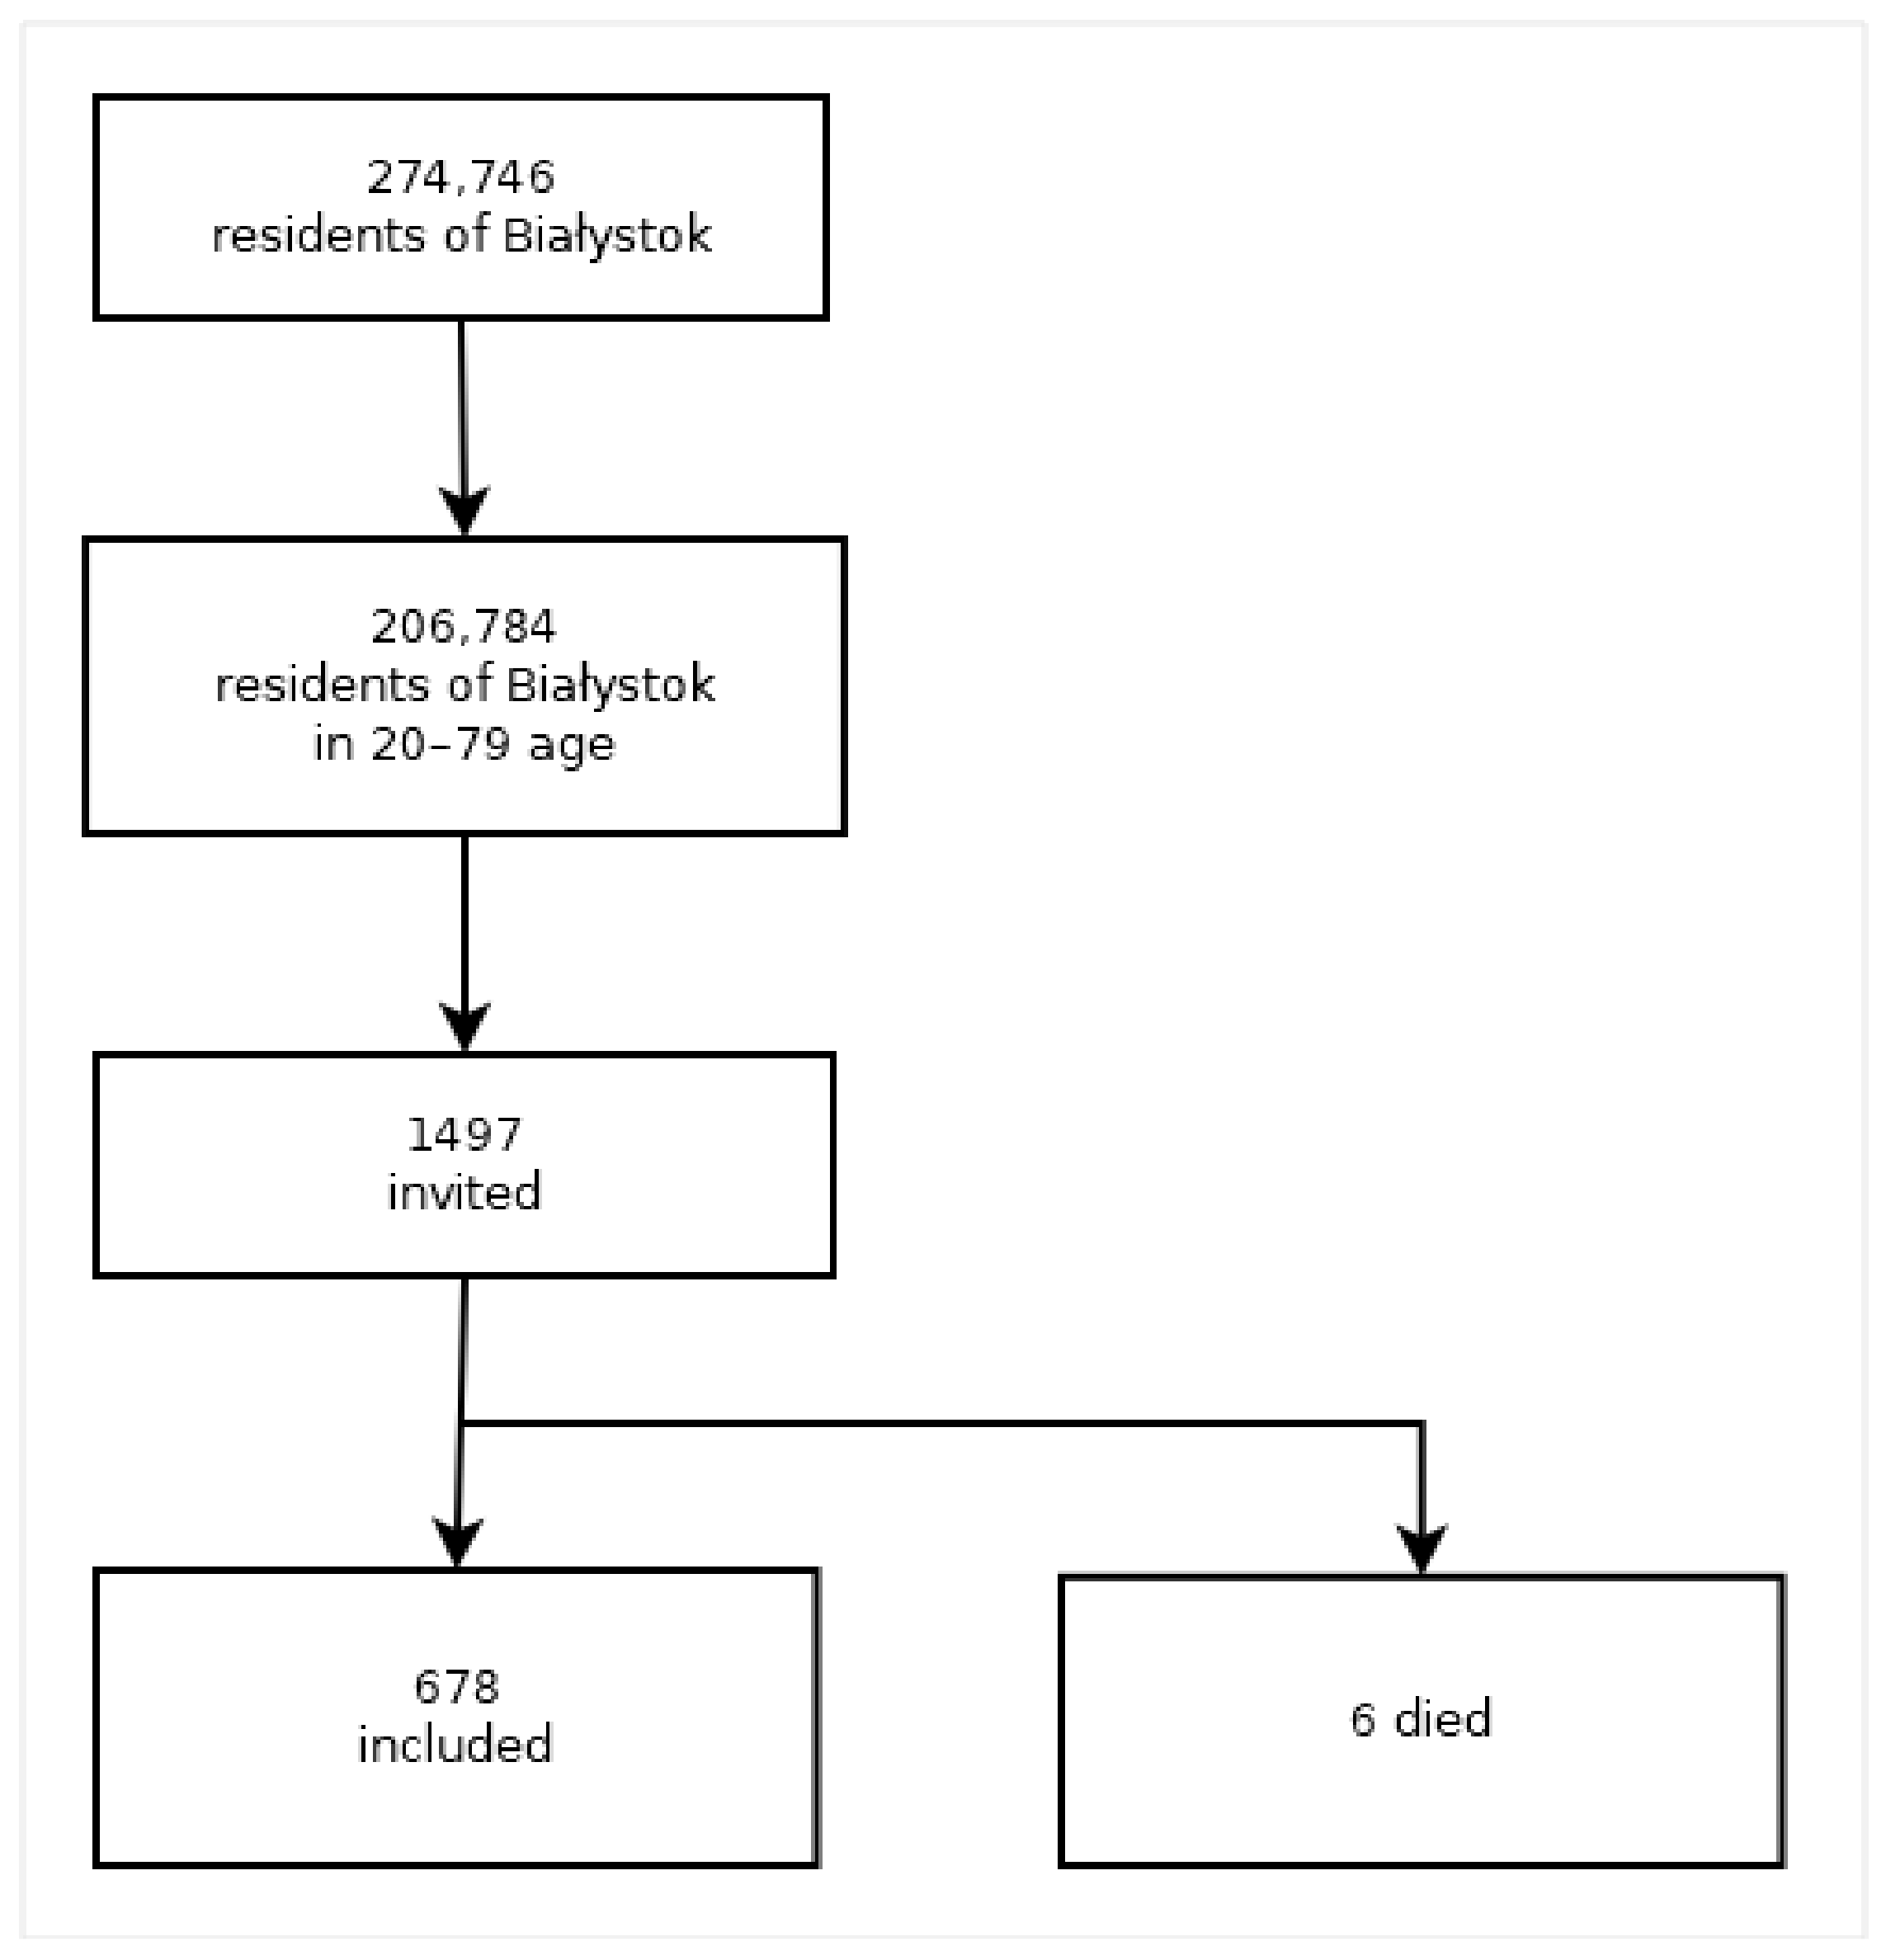
2. Materials and Methods
- normal weight—normal weight in self-assessment and normal weight according to BMI (BMI < 25);
- unawareness of overweight and obesity—normal weight in self-assessment, but overweight/obesity according to BMI (BMI ≥ 25);
- awareness of overweight and obesity—overweight/obesity in self-esteem and normal weight according to BMI (BMI < 25);
- ignorance of the correct body weight—overweight/obesity in self-assessment and overweight/obesity according to BMI (BMI ≥ 25).
2.1. Ethical Issues
2.2. Statistical Analysis
3. Results
3.1. Socio-Demographic and Clinical Characteristics
3.2. Overweight and Obesity Perception and Diet Assessment
4. Discussion
5. Conclusions
Supplementary Materials
Author Contributions
Funding
Institutional Review Board Statement
Informed Consent Statement
Data Availability Statement
Conflicts of Interest
References
- World Health Organization. Obesity and Overweight. Available online: https://www.who.int/en/news-room/fact-sheets/detail/obesity-and-overweight (accessed on 2 August 2022).
- Inoue, Y.; Qin, B.; Poti, J.; Sokol, R.; Gordon-Larsen, P. Epidemiology of Obesity in Adults: Latest Trends. Curr. Obes. Rep. 2018, 7, 276–288. [Google Scholar] [CrossRef]
- Wojtyniak, B.; Goryński, P. (Eds.) Health Status of Polish Population and Its Determinants; National Institute of Public Health—National Institute of Hygiene: Warsaw, Poland, 2020; ISBN 978-83-65870-37-7. [Google Scholar]
- Fruh, S.M. Obesity: Risk factors, complications, and strategies for sustainable long-term weight management. J. Am. Assoc. Nurse Pract. 2017, 29, S3–S14. [Google Scholar] [CrossRef]
- Lopes, S.; Meincke, H.H.; Lamotte, M.; Olivieri, A.; Lean, M.E.J. A novel decision model to predict the impact of weight management interventions: The Core Obesity Model. Obes. Sci. Pract. 2021, 9, 269–280. [Google Scholar] [CrossRef]
- Khan, S.S.; Ning, H.; Wilkins, J.T.; Allen, N.; Carnethon, M.; Berry, J.D.; Sweis, R.N.; Lloyd-Jones, D.M. Association of body mass index with lifetime risk of cardiovascular disease and compression of morbidity. JAMA Cardiol. 2018, 3, 280–287. [Google Scholar] [CrossRef]
- Ellulu, M.S.; Patimah, I.; KhazáAi, H.; Rahmat, A.; Abed, Y. Obesity and inflammation: The linking mechanism and the complications. Arch. Med. Sci. 2017, 13, 851–863. [Google Scholar] [CrossRef]
- Han, E.; Lee, Y.-H.; Lee, B.-W.; Kang, E.S.; Lee, I.-K.; Cha, B.-S. Anatomic fat depots and cardiovascular risk: A focus on the leg fat using nationwide surveys (KNHANES 2008–2011). Cardiovasc. Diabetol. 2017, 16, 54. [Google Scholar] [CrossRef] [Green Version]
- Powell-Wiley, T.M.; Poirier, P.; Burke, L.E.; Després, J.-P.; Gordon-Larsen, P.; Lavie, C.J.; Lear, S.A.; Ndumele, C.E.; Neeland, I.J.; Sanders, P.; et al. Obesity and Cardiovascular Disease: A Scientific Statement from the American Heart Association. Circulation 2021, 143, e984–e1010. [Google Scholar] [CrossRef]
- Bakhtiyari, M.; Kazemian, E.; Kabir, K.; Hadaegh, F.; Aghajanian, S.; Mardi, P.; Ghahfarokhi, N.T.; Ghanbari, A.; Mansournia, M.A.; Azizi, F. Contribution of obesity and cardiometabolic risk factors in developing cardiovascular disease: A population-based cohort study. Sci. Rep. 2022, 12, 1544. [Google Scholar] [CrossRef] [PubMed]
- Paniczko, M.; Chlabicz, M.; Jamiołkowski, J.; Sowa, P.; Szpakowicz, M.; Łapińska, M.; Kondraciuk, M.; Ptaszyńska-Kopczyńska, K.; Raczkowski, A.; Szpakowicz, A.; et al. Impact of Pulse Wave Velocity and Parameters Reflecting Android Type Fat Distribution on Left Ventricular Diastolic Dysfunction in Patients with Chronic Coronary Syndromes. J. Clin. Med. 2020, 9, 3924. [Google Scholar] [CrossRef] [PubMed]
- Chlabicz, M.; Dubatówka, M.; Jamiołkowski, J.; Sowa, P.; Łapińska, M.; Raczkowski, A.; Łaguna, W.; Moniuszko-Malinowska, A.M.; Waszkiewicz, N.; Kowalska, I.; et al. Subjective well-being in non-obese individuals depends strongly on body composition. Sci. Rep. 2021, 11, 21797. [Google Scholar] [CrossRef] [PubMed]
- Abdelaal, M.; le Roux, C.W.; Docherty, N.G. Morbidity and mortality associated with obesity. Ann. Transl. Med. 2017, 5, 161. [Google Scholar] [CrossRef] [PubMed] [Green Version]
- Kim, H.; Kim, K.; Shin, S. Cardiometabolic Risk Factor in Obese and Normal Weight Individuals in Community Dwelling Men. Int. J. Environ. Res. Public Health 2020, 17, 8925. [Google Scholar] [CrossRef]
- Shan, Z.; Li, Y.; Baden, M.Y.; Bhupathiraju, S.N.; Wang, D.D.; Sun, Q.; Rexrode, K.M.; Rimm, E.B.; Qi, L.; Willett, W.C.; et al. Association Between Healthy Eating Patterns and Risk of Cardiovascular Disease. JAMA Intern. Med. 2020, 180, 1090–1100. [Google Scholar] [CrossRef]
- Smethers, A.D.; Rolls, B.J. Dietary management of obesity: Cornerstones of healthy eating patterns. Med. Clin. N. Am. 2018, 102, 107–124. [Google Scholar] [CrossRef]
- Radwan, H.; Hasan, H.A.; Ismat, H.; Hakim, H.; Khalid, H.; Al-Fityani, L.; Mohammed, R.; Ayman, A. Body Mass Index Perception, Body Image Dissatisfaction and Their Relations with Weight-Related Behaviors among University Students. Int. J. Environ. Res. Public Health 2019, 16, 1541. [Google Scholar] [CrossRef] [Green Version]
- Gardner, R.M. Weight status and the perception of body image in men. Psychol. Res. Behav. Manag. 2014, 25, 175–184. [Google Scholar] [CrossRef] [Green Version]
- Adams, J. Addressing socioeconomic inequalities in obesity: Democratising access to resources for achieving and maintaining a healthy weight. PLoS Med. 2020, 17, e1003243. [Google Scholar] [CrossRef]
- Robinson, E.; Haynes, A.; Surin, A.; Daly, M. Self-perception of overweight and obesity: A review of mental and physical health outcomes. Obes. Sci. Pract. 2020, 6, 552–561. [Google Scholar] [CrossRef]
- Chlabicz, M.; Jamiołkowski, J.; Paniczko, M.; Sowa, P.; Szpakowicz, M.; Łapińska, M.; Jurczuk, N.; Kondraciuk, M.; Ptaszyńska-Kopczyńska, K.; Raczkowski, A.; et al. ECG Indices Poorly Predict Left Ventricular Hypertrophy and Are Applicable Only in Individuals with Low Cardiovascular Risk. J. Clin. Med. 2020, 9, 1364. [Google Scholar] [CrossRef]
- Jarosz, M. Standards of nutrition for the Polish population—Amendment. Inst. Food Nutr. 2017, 5, 76–87. (In Polish) [Google Scholar]
- Hollander, M.; Wolfe, D.A.; Chicken, E. Nonparametric Statistical Methods, 3rd ed.; John Wiley & Sons: New York, NY, USA, 2013; pp. 256–264. [Google Scholar]
- Hanley, J.A.; McNeil, B. A method of comparing the areas under receiver operating characteristic curves derived from the same case. Radiology 1983, 148, 839–843. [Google Scholar] [CrossRef] [PubMed] [Green Version]
- Hanley, J.A.; Hajian-Tilaki, K.O. Sampling Variability of Nonparametric Estimates of the Areas under Receiver Operating Characteristic Curves: An Update. Acad. Radiol. 1997, 4, 49–58. [Google Scholar] [CrossRef]
- Olfert, M.D.; Barr, M.L.; Charlier, C.M.; Famodu, O.A.; Zhou, W.; Mathews, A.E.; Byrd-Bredbenner, C.; Colby, S.E. Self-Reported vs. Measured Height, Weight, and BMI in Young Adults. Int. J. Environ. Res. Public Health 2018, 15, 2216. [Google Scholar] [CrossRef] [PubMed] [Green Version]
- Łopuszańska, M.; Lipowicz, A.; Kołodziej, H.; Szklarska, A.; Bielicki, T. Self-reported versus measured body height and weight in Polish adult men: The risk of underestimating obesity rates. Anthropol. Anz. 2015, 72, 263–277. [Google Scholar] [CrossRef]
- Robinson, E.; Oldham, M. Weight status misperceptions among UK adults: The use of self-reported vs. measured BMI. BMC Obes. 2016, 3, 21. [Google Scholar] [CrossRef] [Green Version]
- Yaemsiri, S.; Slining, M.M.; Agarwal, S.K. Perceived weight status, overweight diagnosis, and weight control among US adults: The NHANES 2003–2008 Study. Int. J. Obes. 2011, 35, 1063–1070. [Google Scholar] [CrossRef] [Green Version]
- Akhuemonkhan, E.; Lazo, M. Association between family history of diabetes and cardiovascular disease and lifestyle risk factors in the United States population: The 2009–2012 National Health and Nutrition Examination Survey. Prev. Med. 2017, 96, 129–134. [Google Scholar] [CrossRef]
- Simmonds, M.; Llewellyn, A.; Owen, C.G.; Woolacott, N. Predicting adult obesity from childhood obesity: A systematic review and meta-analysis. Obes. Rev. 2016, 17, 95–107. [Google Scholar] [CrossRef] [Green Version]
- Djalalinia, S.; Qorbani, M.; Peykari, N.; Kelishadi, R. Health impacts of Obesity. Pak. J. Med. Sci. 2015, 31, 239–242. [Google Scholar] [CrossRef]
- Barroso, T.A.; Marins, L.B.; Alves, R.; Gonçalves, A.C.S.; Barroso, S.G.; Rocha, G.D.S. Association of central obesity with the incidence of cardiovascular diseases and risk factors. Int. J. Cardiovasc. Sci. 2017, 30, 5. [Google Scholar] [CrossRef]
- Carbone, S.; Canada, J.M.; Billingsley, H.E.; Siddiqui, M.S.; Elagizi, A.; Lavie, C.J. Obesity paradox in cardiovascular disease: Where do we stand? Vasc. Health Risk. Manag. 2019, 15, 89–100. [Google Scholar] [CrossRef] [Green Version]
- Faulkner, J.L.; Belin de Chantemele, E.J. Sex Differences in Mechanisms of Hypertension Associated with Obesity. Hypertension 2018, 71, 15–21. [Google Scholar] [CrossRef]
- Yu, E.; Malik, V.S.; Hu, F.B. Cardiovascular Disease Prevention by Diet Modification: JACC Health Promotion Series. J. Am. Coll. Cardiol. 2018, 72, 914–926. [Google Scholar] [CrossRef]
- Bouzas, C.; Bibiloni, M.; Tur, J.A. Relationship between Body Image and Body Weight Control in Overweight ≥55-Year-Old Adults: A Systematic Review. Int. J. Environ. Res. Public Health 2019, 16, 1622. [Google Scholar] [CrossRef] [Green Version]
- Weinberger, N.A.; Kersting, A.; Riedel-Heller, S.G.; Luck-Sikorski, C. Body Dissatisfaction in Individuals with Obesity Compared to Normal-Weight Individuals: A Systematic Review and Meta-Analysis. Obes. Facts 2017, 9, 424–441. [Google Scholar] [CrossRef]
- Haynes, A.; Kersbergen, I.; Sutin, A.; Robinson, E. A systematic review of the relationship between weight status perceptions and weight loss attempts, strategies, behaviours and outcomes. Obes. Rev. 2018, 19, 347–363. [Google Scholar] [CrossRef]


| Variables-Food Products | Points | Multiplier 1, 2, −1, −2 | |
|---|---|---|---|
| 1 | 2 | ||
| Groats | ≥once per week <4–6 times per week | ≥4–6 times per week | 2 |
| Oatmeal, barley flakes, rye flakes, muesli | ≥once per week <4–6 times per week | ≥4–6 times per week | 2 |
| Rye bread | >4–6 times per week <7 times per week | 7 times per week | 2 |
| Eggs | ≥once per week <4–6 times per week | 4–6 times per week | 1 |
| Milk | ≥2–3 times per week <7 times per week | 7 times per week | 1 |
| Raw vegetables | ≥2–3 times per week <7 times per week | 7 times per week | 2 |
| Boiled vegetables | ≥once per week <4–6 times per week | ≥4–6 times per week | 2 |
| Raw fruits | ≥2–3 times per week <7 times per week | 7 times per week | 2 |
| Legumes | ≥once per week <2–3 times per week | 2–3 times per week | 1 |
| Nuts | ≥once per week | 2–3 times per week | 1 |
| Sea fishes | <2–3 times per week | 2–3 times per week | 2 |
| Vegetable oils | ≥once per week <4–6 times per week | ≥4–6 times per week | 2 |
| Poultry | 2–3 times per week | 4–6 times per week | 1 |
| Lard, bacon | >once per week <2–3 times per week | ≥2–3 times per week | −2 |
| Fatty meat | <once per week >4–6 times per week | ≥4–6 times per week | −2 |
| Processed meat | >once per week <4–6 times per week | ≥4–6 times per week | −2 |
| Sausages, luncheon meat, canned food | >once per week <4–6 times per week | ≥4–6 times per week | −2 |
| Offal | >once per week >4–6 times per week | ≥4–6 times per week | −2 |
| Colored carbonated drinks | >once per week <2–3 times per week | ≥2–3 times per week | −2 |
| Sweets, cakes, candies, sticks, crackers | >once per week >4–6 times per week | ≥4–6 times per week | −2 |
| Fast food | >once per week <4–6 times per week | ≥4–6 times per week | −2 |
| Natural spices, herbs | >once per week <4-6 times per week | >=4-6 times per week | 2 |
| Bouillon cubes, spice mixtures for dishes | >once per week <4–6 times per week | ≥4–6 times per week | −2 |
| Alcohol | >1–2 times per month <2–3 times per week | ≥2–3 times per week | −2 |
| Variables | Total Population N = 658 | Normal Weight (I) N = 256 | Unawareness of Overweight and Obesity (II) N = 143 | Awareness of Overweight and Obesity (III) N = 259 | p Value * | Pairwise Comparisons ** | ||
|---|---|---|---|---|---|---|---|---|
| IvsII | IvsIII | IIvsIII | ||||||
| Sociodemographic characteristic | ||||||||
| Gender (men%) | 306 (46.5) | 86 (33.6) | 92 (64.3) | 128 (49.4) | <0.001 | sig. | sig. | |
| Age < 40 | 226 (34.3) | 120 (46.9) | 42 (29.4) | 64 (24.7) | sig. | |||
| Age 40–59 | 233 (35.4) | 87 (34.0) | 52 (36.4) | 94 (36.3) | <0.001 | |||
| Age ≥ 60 | 199 (30.2) | 49 (19.1) | 49 (34.3) | 101 (39.0) | sig. | sig. | ||
| Education | ||||||||
| Elementary + Vocational based on elementary school | 95 (14.5) | 27 (10.6) | 27 (18.9) | 41 (15.8) | 0.071 | |||
| Secondary + Post-secondary | 227 (34.6) | 85 (33.5) | 44 (30.8) | 98 (37.8) | ||||
| Higher education | 334 (50.9) | 142 (55.9) | 72 (50.3) | 120 (46.4) | ||||
| Obesity in family | ||||||||
| Yes | 176 (30.9) | 57 (24.9) | 29 (25.4) | 90 (39.6) | 0.001 | sig. | sig. | |
| Variables | Total Population N = 658 | Normal Weight (I) N = 256 | Unawareness of Overweight and Obesity (II) N = 143 | Awareness of Overweight and Obesity (III) N = 259 | p Value * | Pairwise Comparisons ** | ||
|---|---|---|---|---|---|---|---|---|
| IvsII | IvsIII | IIvsIII | ||||||
| Overweight/obesity | ||||||||
| BMI, kg/m2 | 26.8 ± 4.9 | 22.1 ± 1.9 | 27.3 ± 4.8 | 31.1 ± 3.7 | <0.001 | <0.001 | <0.001 | <0.001 |
| WHR, cm | 0.9 ± 0.1 | 0.8 ± 0.1 | 0.9 ± 0.1 | 0.94 ± 1.2 | <0.001 | <0.001 | <0.001 | 0.126 |
| BAI, ((HC/height)1.5) − 18 | 26.8 ± 5.9 | 23.5 ± 3.9 | 26.3 ± 4.8 | 30.5 ± 6.1 | <0.001 | <0.001 | <0.001 | <0.001 |
| Body composition | ||||||||
| Average percent fat | 32.9 ± 7.5 | 29.7 ± 6.9 | 31.1 ± 6.9 | 37.1 ± 6.1 | <0.001 | 0.393 | <0.001 | <0.001 |
| Average fat tissue thickness/mm | 10.4 ± 1.3 | 9.1 ± 0.6 | 10.6 ± 0.7 | 11.5 ± 0.9 | <0.001 | <0.001 | <0.001 | <0.001 |
| Average percent lean mass | 63.7 ± 7.7 | 68.2 ± 6.7 | 65.2 ± 6.6 | 58.4 ± 5.7 | <0.001 | 0.001 | <0.001 | <0.001 |
| Total fat mass/kg | 26.1 ± 9.4 | 17.9 ± 4.7 | 25.5 ± 5.2 | 34.5 ± 6.9 | <0.001 | <0.001 | <0.001 | <0.001 |
| Total lean mass/kg | 49.7 ± 10.9 | 44.1 ± 8.8 | 54.2 ± 10.9 | 52.8 ± 10.5 | <0.001 | <0.001 | <0.001 | 0.537 |
| Total bone mass/kg | 2.7 ± 0.6 | 2.5 ± 0.5 | 2.9 ± 0.6 | 2.8 ± 0.5 | <0.001 | <0.001 | <0.001 | 0.085 |
| Android fat mass/kg | 2.4 ± 1.3 | 1.3 ± 0.6 | 2.4 ± 0.7 | 3.6 ± 1.0 | <0.001 | <0.001 | <0.001 | <0.001 |
| Gynoid fat mass/kg | 4.0 ± 1.4 | 3.1 ± 0.9 | 3.8 ± 0.9 | 5.1 ± 1.3 | <0.001 | <0.001 | <0.001 | <0.001 |
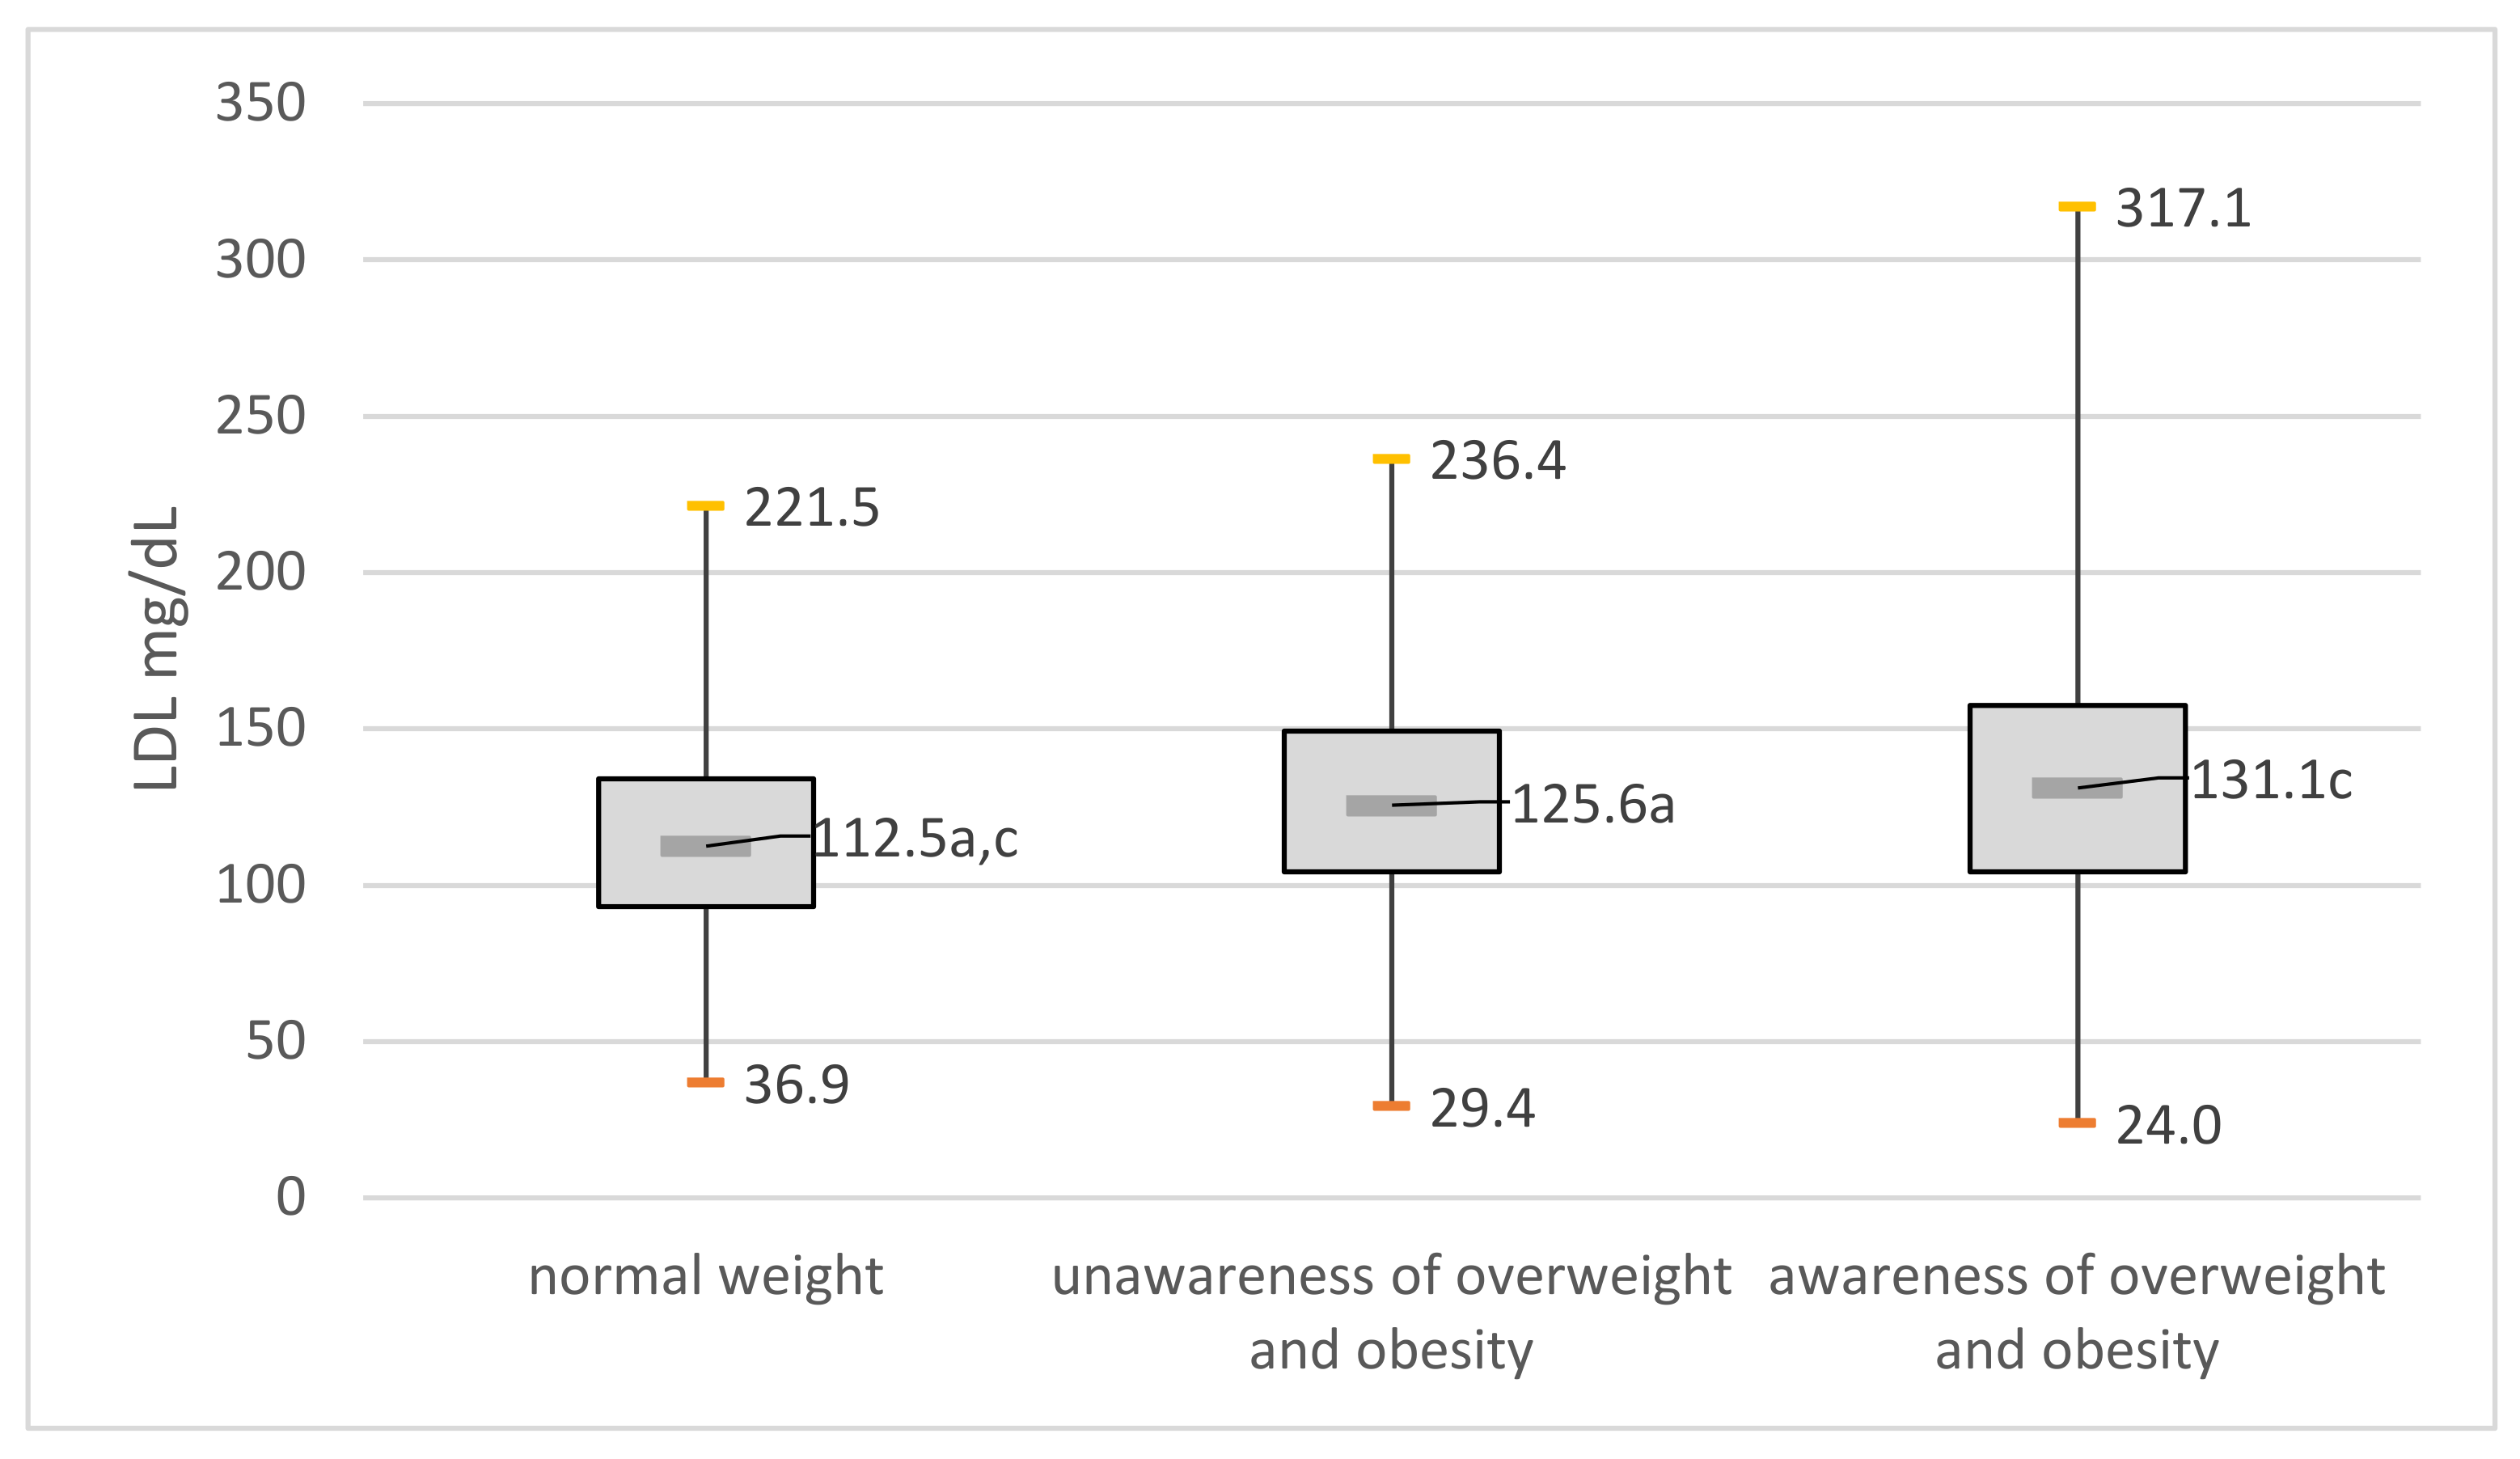
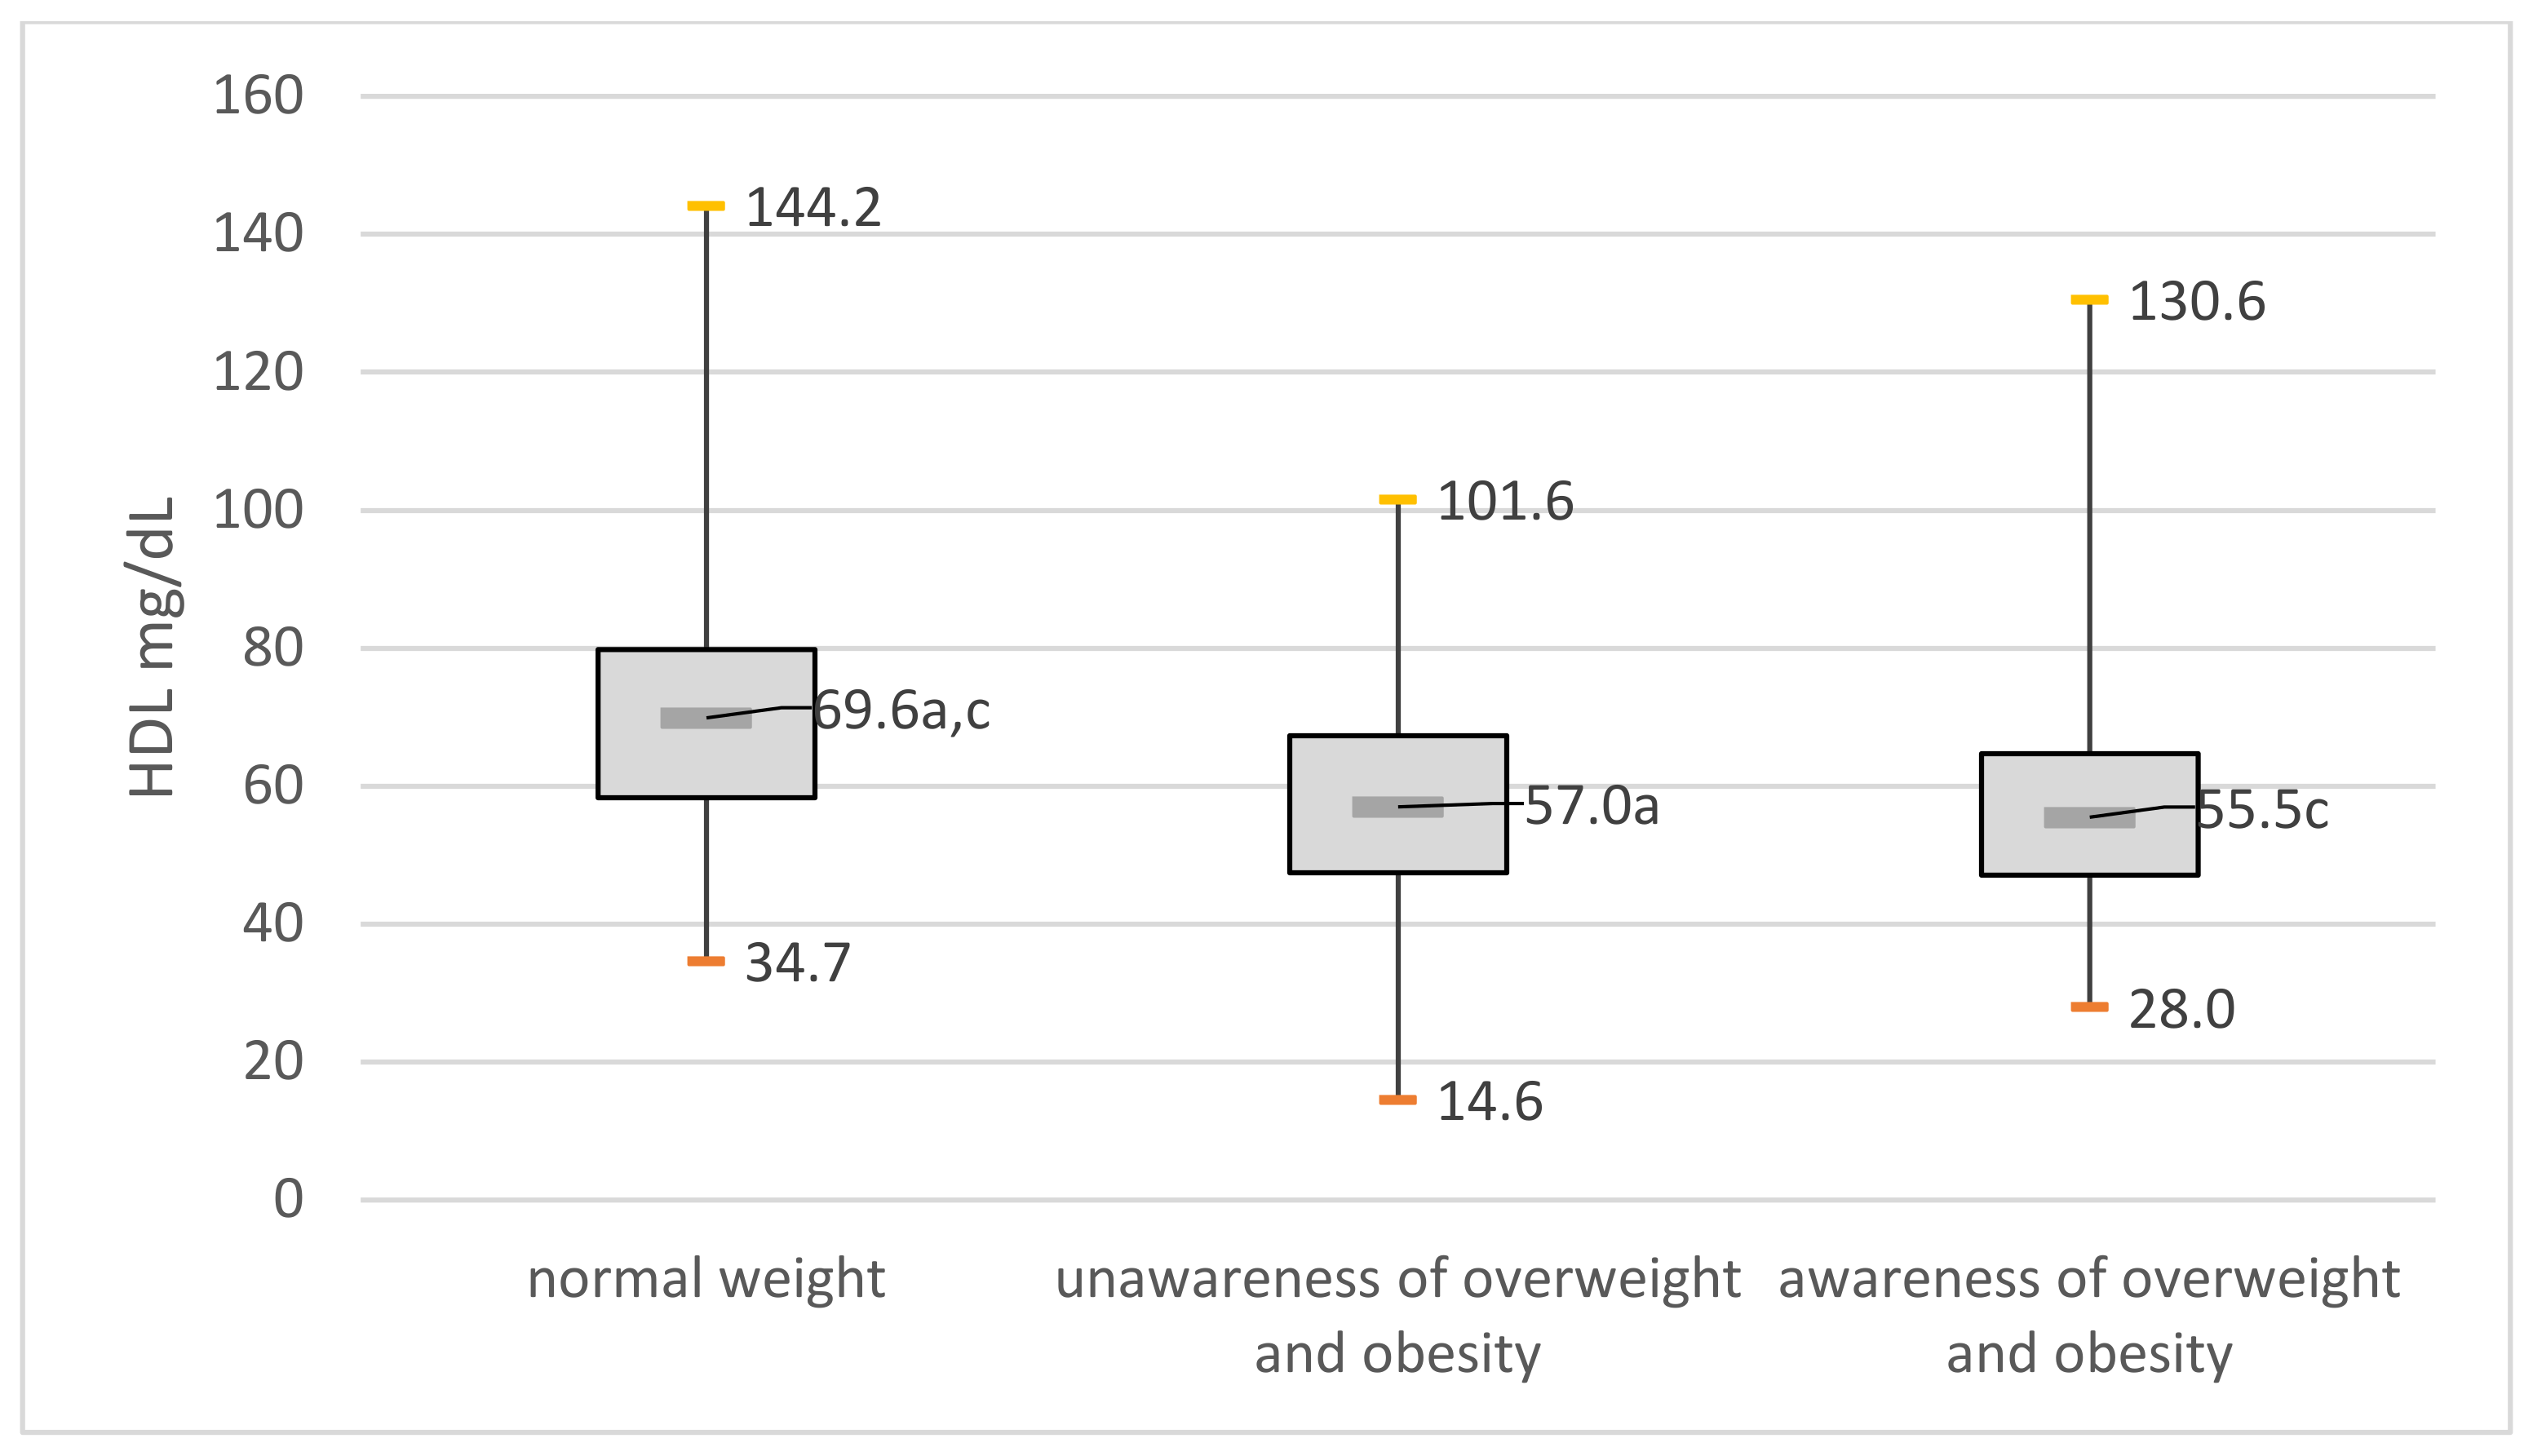
| Variable | Total Population N = 658 | Normal Weight (I) N = 256 | Unawareness of Overweight or Obesity (II) N = 143 | Awareness of Overweight and Obesity (III) N = 259 | p Value * | Pairwise Comparisons p-Value ** | ||
|---|---|---|---|---|---|---|---|---|
| IvsII | IvsIII | IIvsIII | ||||||
| TC/mg/dL | 191.3 ± 41.3 | 183.6 ± 37.7 | 191.6 ± 40.6 | 198.5 ± 443.8 | 0.001 | 0.102 | 0.001 | 0.444 |
| Tg/mg/dL | 72.5 ± 29.0 | 85.3 ± 50.3 | 119.3 ± 75.4 | 139.1 ± 79.4 | <0.001 | <0.001 | <0.001 | 0.003 |
| Fasting glucose/mg/dL | 103.6 ± 21.7 | 96.5 ± 8.9 | 104.1 ± 18.4 | 110.4 ± 29.0 | <0.001 | <0.001 | <0.001 | 0.002 |
| OGTT 120 min-glucose/mg/dL | 124.8 ± 39.1 | 113.7 ± 31.3 | 124.2 ± 42.8 | 137.3 ± 40.8 | <0.001 | 0.086 | <0.001 | 0.001 |
| HOMA-IR | 3.4 ± 3.1 | 2.0 ± 0.9 | 3.2 ± 2.3 | 4.9 ± 4.1 | <0.001 | <0.001 | <0.001 | <0.001 |
| Hba1c/% | 5.5 ± 0.7 | 5.3 ± 0.4 | 5.6 ± 0.8 | 5.7 ± 0.8 | <0.001 | <0.001 | <0.001 | 0.035 |
| BPs/mmHg | 125.15 ± 17.77 | 118.1 ± 16.3 | 127.7 ± 15.9 | 130.7 ± 17.9 | <0.001 | <0.001 | <0.001 | 0.308 |
| BPd/mmHg | 81.9 ± 10.4 | 78.8 ± 9.1 | 81.5 ± 10.4 | 85.3 ± 10.7 | <0.001 | 0.026 | <0.001 | 0.002 |
| Variable | AUC | 95% C.I.(AUC) | p (H0: AUC = 0.5) | * | ||
|---|---|---|---|---|---|---|
| Cutoff | Sensitivity | Specificity | ||||
| Women | ||||||
| BMI, kg/m2 | 0.9153 | (0.887–0.943) | <0.0001 | >26.4 | 81.5% | 88.5% |
| WHR, cm | 0.7201 | (0.667–0.773) | <0.0001 | >0.8 | 70.5% | 65.4% |
| WC, cm | 0.8814 | (0.846–0.917) | <0.001 | >81.8 | 80.8% | 84.3% |
| Average percent fat, % | 0.8593 | (0.822–0.897) | <0.0001 | >0.38 | 80.8% | 77.0% |
| Men | ||||||
| BMI, kg/m2 | 0.9125 | (0.881–0.944) | <0.0001 | >27.9 | 83.8% | 86.3% |
| WHR, cm | 0.7679 | (0.715–0.821) | <0.0001 | >1.0 | 70.8% | 71.4% |
| WC, cm | 0.8778 | (0.841–0.915) | <0.001 | >90.3 | 93.1% | 66.3% |
| Average percent fat, % | 0.8793 | (0.841–0.917) | <0.0001 | >0.29 | 79.2% | 83.4% |
| Variables | Total Population [N/%] | Normal Weight (I) [N/%] | Unawareness of Overweight and Obesity (II) [N/%] | Awareness of Overweight and Obesity (III) [N/%] | p Value * | Pairwise Comparisons ** | ||
|---|---|---|---|---|---|---|---|---|
| IvsII | IvsIII | IIvsIII | ||||||
| Currently smoking: | N = 640 | N = 250 | N = 136 | N = 254 | ||||
| Yes | 126 (19.7) | 48 (19.2) | 25 (18.4) | 53 (20.9) | 0.816 | |||
| No answer | 18 (2.7) | 6 (2.3) | 7 (4.9) | 5 (1.9) | ||||
| Self-assessment of diet: | N = 520 | N = 205 | N=104 | N=211 | ||||
| very good | 24 (4.6) | 11 (5.4) | 9 (8.7) | 4 (1.9) | 0.001 | sig. | ||
| good | 378 (72.7) | 158 (77.1) | 80 (76.9) | 140 (66.4) | ||||
| bad | 113 (21.7) | 34 (16.6) | 15 (14.4) | 64 (30.0) | sig. | |||
| very bad | 5 (1.0) | 2 (1.0) | 0 | 3 (1.4) | ||||
| no answer | 138 (21.0) | 51 (19.9) | 39 (27.3) | 48 (18.5) | ||||
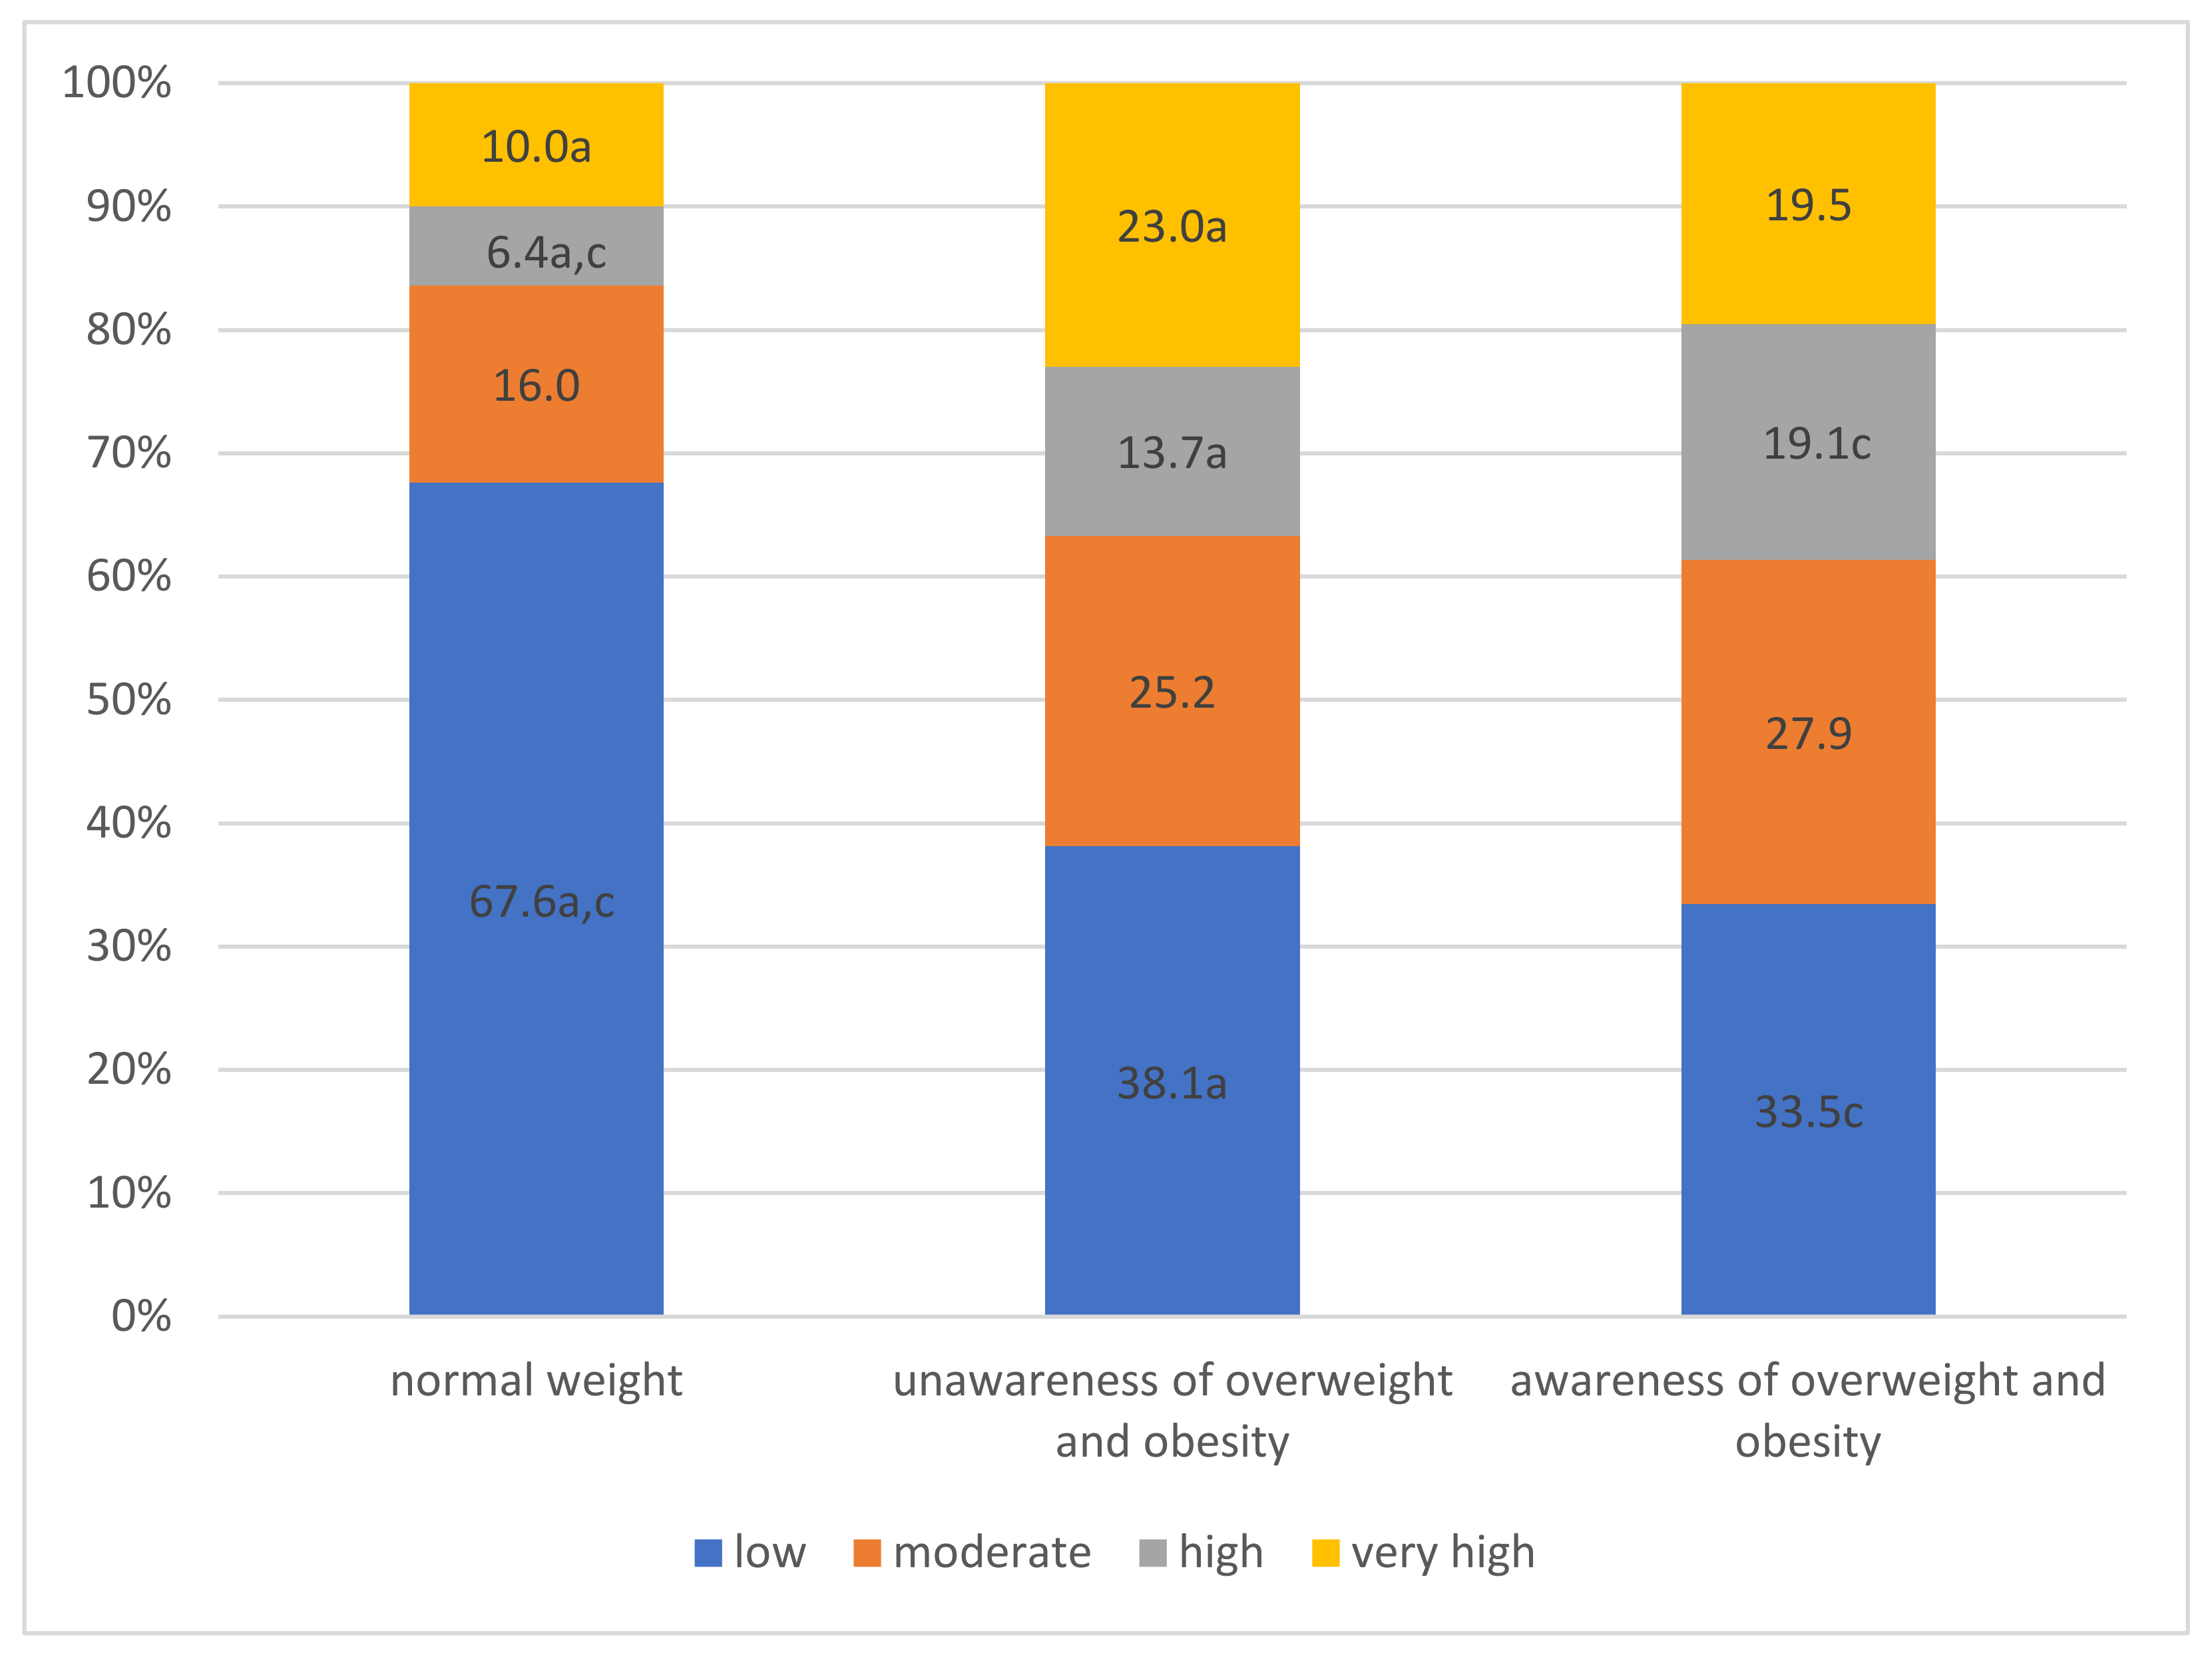
| Q1 | Median | Q3 | p Value | |
|---|---|---|---|---|
| Normal weight | 1.0 | 5.0 | 10.0 | p = 0.027 |
| Unawareness of overweight and obesity | −1.0 | 3.5 | 9.0 | |
| Awareness overweight and obesity | −1.0 | 3.0 | 8.0 | |
| Normal weight vs. unawareness of overweight and obesity p = 0.013 Unawareness of overweight and obesity vs. awareness of overweight and obesity p = 0.903 | ||||
Publisher’s Note: MDPI stays neutral with regard to jurisdictional claims in published maps and institutional affiliations. |
© 2022 by the authors. Licensee MDPI, Basel, Switzerland. This article is an open access article distributed under the terms and conditions of the Creative Commons Attribution (CC BY) license (https://creativecommons.org/licenses/by/4.0/).
Share and Cite
Zalewska, M.; Jamiołkowski, J.; Chlabicz, M.; Łapińska, M.; Dubatówka, M.; Kondraciuk, M.; Hermanowicz, A.; Kamiński, K.A. How Unawareness of Weight Excess Can Increase Cardiovascular Risk? J. Clin. Med. 2022, 11, 4944. https://doi.org/10.3390/jcm11174944
Zalewska M, Jamiołkowski J, Chlabicz M, Łapińska M, Dubatówka M, Kondraciuk M, Hermanowicz A, Kamiński KA. How Unawareness of Weight Excess Can Increase Cardiovascular Risk? Journal of Clinical Medicine. 2022; 11(17):4944. https://doi.org/10.3390/jcm11174944
Chicago/Turabian StyleZalewska, Magdalena, Jacek Jamiołkowski, Małgorzata Chlabicz, Magda Łapińska, Marlena Dubatówka, Marcin Kondraciuk, Adam Hermanowicz, and Karol Adam Kamiński. 2022. "How Unawareness of Weight Excess Can Increase Cardiovascular Risk?" Journal of Clinical Medicine 11, no. 17: 4944. https://doi.org/10.3390/jcm11174944