
Impact of CFTR Modulators on Beta-Cell Function in Children and Young Adults with Cystic Fibrosis

 , ,
, ,
Abstract
:1. Introduction
2. Materials and Methods
2.1. Participants and Study Protocol
2.2. Clinical Characteristics
2.3. Oral Glucose Tolerance Test
2.4. Assessment of the Determinants of Glucose Regulation during the OGTT
- -
- Homeostasis model assessment insulin resistance (HOMA-IR), as marker of insulin resistance based on fasting glycemia and insulin: ((Insulin0′ (mU/L) Glucose0′ (mmol/L))/22.5);
- -
- Insulinogenic index (IGI), as marker of early insulin bioavailability in response to oral glucose: (insulin30′ (mU/L)-insulin0′ (mU/L))/(glucose30′ (mg/dL)-glucose0′ (mg/dL));
- -
- Matsuda index, as marker of postprandial insulin sensitivity: 10,000/((Glucose 0′ (mg/dL) ·Insulin0′ (mU/L)) · (mean OGTT glucose concentration (mg/dL)) · (mean OGTT insulin concentration (mU/L)))1/2;
- -
- Oral disposition index (DI), a popular marker of the adequacy of insulin bioavailability to the prevailing insulin sensitivity: Matsuda index·IGI.
2.5. Statistical Analysis
3. Results
4. Conclusions
Supplementary Materials
Author Contributions
Funding
Institutional Review Board Statement
Informed Consent Statement
Data Availability Statement
Acknowledgments
Conflicts of Interest
Abbreviations
| CFRD | Cystic Fibrosis Related Diabetes |
| CF | Cystic Fibrosis |
| CFTR | Cystic Fibrosis Transmembrane Conductance Regulator Protein |
| OGTT | Oral Glucose Tolerance Test |
| BMI | Body Mass Index |
| FEV1 | Forced Expiratory Volume in the 1st Second |
| FVC | Forced Vital Capacity |
| NGT | Normal Glucose Tolerance |
| INDET | Indeterminate Glucose Tolerance |
| IGT | Impaired Glucose Tolerance |
| DC | Derivative Control |
| PC | Proportional Control |
| ISR | Insulin Secretion Rate |
| OGIS | Oral Glucose Insulin Sensitivity |
| HOMA-IR | Homeostasis Model Assessment Insulin Resistance |
| IGI | Insulinogenic Index |
| DI | Disposition Index |
| SD | Standard Deviation |
| IQR | Interquartile Range |
| SEM | Standard Error of the Mean |
References
- Moran, A.; Dunitz, J.; Nathan, B.; Saeed, A.; Holme, B.; Thomas, W. Cystic Fibrosis-Related Diabetes: Current Trends in Prevalence, Incidence, and Mortality. Diabetes Care 2009, 32, 1626–1631. [Google Scholar] [CrossRef] [PubMed] [Green Version]
- Yi, Y.; Norris, A.; Wang, K.; Sun, X.; Uc, A.; Moran, A.; Engelhardt, J.; Ode, K.L. Abnormal Glucose Tolerance in Infants and Young Children with Cystic Fibrosis. Am. J. Respir. Crit. Care Med. 2016, 194, 974–980. [Google Scholar] [CrossRef] [PubMed] [Green Version]
- Mozzillo, E.; Raia, V.; Fattorusso, V.; Falco, M.; Sepe, A.; De Gregorio, F.; Nugnes, R.; Valerio, G.; Franzese, A. Glucose Derangements in Very Young Children With Cystic Fibrosis and Pancreatic Insufficiency. Diabetes Care 2012, 35, e78. [Google Scholar] [CrossRef] [PubMed] [Green Version]
- Mohan, K.; Miller, H.; Dyce, P.; Grainger, R.; Hughes, R.; Vora, J.; Ledson, M.; Walshaw, M. Mechanisms of glucose intolerance in cystic fibrosis. Diabet. Med. 2009, 26, 582–588. [Google Scholar] [CrossRef]
- Battezzati, A.; Mari, A.; Zazzeron, L.; Alicandro, G.; Claut, L.; Battezzati, P.M.; Colombo, C. Identification of insulin secretory defects and insulin resistance during oral glucose tolerance test in a cohort of cystic fibrosis patients. Eur. J. Endocrinol. 2011, 165, 69–76. [Google Scholar] [CrossRef] [PubMed] [Green Version]
- Piona, C.; Volpi, S.; Zusi, C.; Mozzillo, E.; Tosco, A.; Franzese, A.; Raia, V.; Boselli, M.L.; Trombetta, M.; Cipolli, M.; et al. Glucose Tolerance Stages in Cystic Fibrosis Are Identified by a Unique Pattern of Defects of Beta-Cell Function. J. Clin. Endocrinol. Metab. 2021, 106, 1793–1802. [Google Scholar] [CrossRef]
- Moran, A.; Milla, C.; Ducret, R.; Nair, K.S. Protein Metabolism in Clinically Stable Adult Cystic Fibrosis Patients With Abnormal Glucose Tolerance. Diabetes 2001, 50, 1336–1343. [Google Scholar] [CrossRef] [Green Version]
- Rosenecker, J.; Höfler, R.; Steinkamp, G.; Eichler, I.; Smaczny, C.; Ballmann, M.; Posselt, H.G.; Bargon, J.; Von Der Hardt, H. Diabetes mellitus in patients with cystic fibrosis: The impact of diabetes mellitus on pulmonary function and clinical outcome. Eur. J. Med. Res. 2001, 6, 345–350. [Google Scholar]
- Clancy, J.P.; Cotton, C.U.; Donaldson, S.H.; Solomon, G.M.; VanDevanter, D.R.; Boyle, M.P.; Gentzsch, M.; Nick, J.A.; Illek, B.; Wallenburg, J.C.; et al. CFTR modulator theratyping: Current status, gaps and future directions. J. Cyst. Fibros. 2019, 18, 22–34. [Google Scholar] [CrossRef] [Green Version]
- Gavioli, E.M.; Guardado, N.; Haniff, F.; Deiab, N.; Vider, E. A current review of the safety of cystic fibrosis transmembrane conductance regulator modulators. J. Clin. Pharm. Ther. 2021, 46, 286–294. [Google Scholar] [CrossRef]
- Zaher, A.; ElSaygh, J.; Elsori, D.; ElSaygh, H.; Sanni, A. A Review of Trikafta: Triple Cystic Fibrosis Transmembrane Conductance Regulator (CFTR) Modulator Therapy. Cureus 2021, 13, e16144. [Google Scholar] [CrossRef] [PubMed]
- Edlund, A.; Esguerra, J.L.; Wendt, A.; Flodström-Tullberg, M.; Eliasson, L. CFTR and Anoctamin 1 (ANO1) contribute to cAMP amplified exocytosis and insulin secretion in human and murine pancreatic beta-cells. BMC Med. 2014, 12, 87. [Google Scholar] [CrossRef] [Green Version]
- Guo, J.H.; Chen, H.; Ruan, Y.C.; Zhang, X.L.; Zhang, X.H.; Fok, E.; Tsang, L.L.; Yu, M.K.; Huang, W.Q.; Sun, X.; et al. Glucose-induced electrical activities and insulin secretion in pancreatic islet β-cells are modulated by CFTR. Nat. Commun. 2014, 5, 4420. [Google Scholar] [CrossRef] [Green Version]
- Best, L. Glucose-induced electrical activity in rat pancreatic β-cells: Dependence on intracellular chloride concentration. J. Physiol. 2005, 568 Pt 1, 137–144. [Google Scholar] [CrossRef]
- Ntimbane, T.; Mailhot, G.; Spahis, S.; Rabasa-Lhoret, R.; Kleme, M.-L.; Melloul, D.; Brochiero, E.; Berthiaume, Y.; Levy, E. CFTR silencing in pancreatic β-cells reveals a functional impact on glucose-stimulated insulin secretion and oxidative stress response. Am. J. Physiol. Endocrinol. Metab. 2016, 310, E200–E212. [Google Scholar] [CrossRef]
- Hart, N.; Aramandla, R.; Poffenberger, G.; Fayolle, C.; Thames, A.H.; Bautista, A.; Spigelman, A.F.; Babon, J.A.B.; DeNicola, M.E.; Dadi, P.K.; et al. Cystic fibrosis-related diabetes is caused by islet loss and inflammation. JCI Insight. 2018, 3. [Google Scholar] [CrossRef] [PubMed] [Green Version]
- White, M.G.; Maheshwari, R.R.; Anderson, S.J.; Berlinguer-Palmini, R.; Jones, C.; Richardson, S.J.; Rotti, P.G.; Armour, S.L.; Ding, Y.; Krasnogor, N.; et al. In Situ Analysis Reveals That CFTR Is Expressed in Only a Small Minority of β-Cells in Normal Adult Human Pancreas. J. Clin. Endocrinol. Metab. 2020, 105, 1366–1374. [Google Scholar] [CrossRef] [PubMed]
- Di Fulvio, M.; Bogdani, M.; Velasco, M.; McMillen, T.S.; Ridaura, C.; Kelly, L.; Almutairi, M.M.; Kursan, S.; Sajib, A.A.; Hiriart, M.; et al. Heterogeneous expression of CFTR in insulin-secreting β-cells of the normal human islet. PLoS ONE 2020, 15, e0242749. [Google Scholar] [CrossRef]
- Volkova, N.; Moy, K.; Evans, J.; Campbell, D.; Tian, S.; Simard, C.; Higgins, M.; Konstan, M.W.; Sawicki, G.S.; Elbert, A.; et al. Disease progression in patients with cystic fibrosis treated with ivacaftor: Data from national US and UK registries. J. Cyst. Fibros. 2020, 19, 68–79. [Google Scholar] [CrossRef]
- Kelly, A.; de Leon, D.; Sheikh, S.; Camburn, D.; Kubrak, C.; Peleckis, A.J.; Stefanovski, D.; Hadjiliadis, D.; Rickels, M.; Rubenstein, R.C. Islet Hormone and Incretin Secretion in Cystic Fibrosis after Four Months of Ivacaftor Therapy. Am. J. Respir. Crit. Care Med. 2019, 199, 342–351. [Google Scholar] [CrossRef]
- Misgault, B.; Chatron, E.; Reynaud, Q.; Touzet, S.; Abely, M.; Melly, L.; Dominique, S.; Troussier, F.; Ronsin-Pradel, O.; Gerardin, M.; et al. Effect of one-year lumacaftor-ivacaftor treatment on glucose tolerance abnormalities in cystic fibrosis patients. J. Cyst. Fibros. 2020, 19, 712–716. [Google Scholar] [CrossRef] [PubMed] [Green Version]
- Moheet, A.; Beisang, D.; Zhang, L.; Sagel, S.D.; VanDalfsen, J.M.; Heltshe, S.L.; Frederick, C.; Mann, M.; Antos, N.; Billings, J.; et al. Lumacaftor/ivacaftor therapy fails to increase insulin secretion in F508del/F508del CF patients. J. Cyst. Fibros. 2021, 20, 333–338. [Google Scholar] [CrossRef]
- Cobelli, C.; Toffolo, G.M.; Man, C.D.; Campioni, M.; Denti, P.; Caumo, A.; Butler, P.C.; A Rizza, R. Assessment of β-cell function in humans, simultaneously with insulin sensitivity and hepatic extraction, from intravenous and oral glucose tests. Am. J. Physiol. Endocrinol. Metab. 2007, 293, E1–E15. [Google Scholar] [CrossRef] [PubMed]
- Weiss, R.; Caprio, S.; Trombetta, M.; Taksali, S.E.; Tamborlane, W.V.; Bonadonna, R. β-Cell Function Across the Spectrum of Glucose Tolerance in Obese Youth. Diabetes 2005, 54, 1735–1743. [Google Scholar] [CrossRef] [PubMed] [Green Version]
- Bergman, R.N.; Piccinini, F.; Kabir, M.; Kolka, C.M.; Ader, M. Hypothesis: Role of Reduced Hepatic Insulin Clearance in the Pathogenesis of Type 2 Diabetes. Diabetes 2019, 68, 1709–1716. [Google Scholar] [CrossRef] [PubMed]
- Bonadonna, R.C.; Boselli, L.; Cas, A.D.; Trombetta, M. Methods to assess in vivo insulin sensitivity and insulin secretion. Chapter 12. In Diabetes Epidemiology, Genetics, Pathogenesis, Diagnosis, Prevention and Treatment, 1st ed.; Bonora, E., DeFronzo, R.A., Eds.; Springer: Berlin/Heidelberg, Germany, 2018. [Google Scholar]
- Colombo, C.; Foppiani, A.; Bisogno, A.; Gambazza, S.; Daccò, V.; Nazzari, E.; Leone, A.; Giana, A.; Mari, A.; Battezzati, A. Lumacaftor/ivacaftor in cystic fibrosis: Effects on glucose metabolism and insulin secretion. J. Endocrinol. Investig. 2021, 44, 2213–2218. [Google Scholar] [CrossRef] [PubMed]
- WHO Multicentre Growth Reference Study Group. WHO Child Growth Standards based on length/height, weight and age. Acta Paediatr. Suppl. 2006, 450, 76–85. [Google Scholar]
- Graham, B.L.; Steenbruggen, I.; Miller, M.R.; Barjaktarevic, I.Z.; Cooper, B.G.; Hall, G.L.; Hallstrand, T.S.; Kaminsky, D.A.; McCarthy, K.; McCormack, M.C.; et al. Standardization of Spirometry 2019 Update. An Official American Thoracic Society and European Respiratory Society Technical Statement. Am. J. Respir. Crit. Care Med. 2019, 200, e70–e88. [Google Scholar] [CrossRef] [PubMed]
- Green, A.; Kirk, J. The Guidelines Development Group Guidelines for the performance of the sweat test for the diagnosis of cystic fibrosis. Ann. Clin. Biochem. Int. J. Lab. Med. 2007, 44 Pt 1, 25–34. [Google Scholar] [CrossRef] [PubMed] [Green Version]
- Moran, A.; Pillay, K.; Becker, D.; Granados, A.; Hameed, S.; Acerini, C.L. ISPAD Clinical Practice Consensus Guidelines 2018: Management of cystic fibrosis-related diabetes in children and adolescents. Pediatr. Diabetes 2018, 19 (Suppl. 27), 64–74. [Google Scholar] [CrossRef]
- Grancini, V.; Trombetta, M.; Lunati, M.E.; Boselli, M.L.; Gatti, S.; Donato, M.F.; Palmieri, E.; Resi, V.; Pugliese, G.; Bonadonna, R.C.; et al. Central role of the β-cell in driving regression of diabetes after liver transplantation in cirrhotic patients. J. Hepatol. 2019, 70, 954–962. [Google Scholar] [CrossRef] [PubMed]
- Mari, A.; Pacini, G.; Murphy, E.; Ludvik, B.; Nolan, J.J. A Model-Based Method for Assessing Insulin Sensitivity From the Oral Glucose Tolerance Test. Diabetes Care 2001, 24, 539–548. [Google Scholar] [CrossRef] [PubMed] [Green Version]
- Kahn, S.E.; Lachin, J.M.; Zinman, B.; Haffner, S.M.; Aftring, R.P.; Paul, G.; Kravitz, B.G.; Herman, W.H.; Viberti, G.; Holman, R.R.; et al. Effects of Rosiglitazone, Glyburide, and Metformin on β-Cell Function and Insulin Sensitivity in ADOPT. Diabetes 2011, 60, 1552–1560. [Google Scholar] [CrossRef] [PubMed] [Green Version]
- Comegna, M.; Terlizzi, V.; Salvatore, D.; Colangelo, C.; Di Lullo, A.; Zollo, I.; Taccetti, G.; Castaldo, G.; Amato, F. Elexacaftor-Tezacaftor-Ivacaftor Therapy for Cystic Fibrosis Patients with The F508del/Unknown Genotype. Antibiotics 2021, 10, 828. [Google Scholar] [CrossRef] [PubMed]
- Di Fulvio, M.; Aguilar-Bryan, L. Chloride transporters and channels in β-cell physiology: Revisiting a 40-year-old model. Biochem. Soc. Trans. 2019, 47, 1843–1855. [Google Scholar] [CrossRef] [Green Version]
- Henquin, J.-C.; Ravier, M.; Nenquin, M.; Jonas, J.-C.; Gilon, P. Hierarchy of the β-cell signals controlling insulin secretion. Eur. J. Clin. Investig. 2003, 33, 742–750. [Google Scholar] [CrossRef]
- Henquin, J.C.; Nenquin, M.; Ravier, M.A.; Szollosi, A. Shortcomings of current models of glucose-induced insulin secretion. Diabetes Obes. Metab. 2009, 11 (Suppl. 4), 168–179. [Google Scholar] [CrossRef]
- Thomassen, J.C.; Mueller, M.I.; Alcazar, M.A.A.; Rietschel, E.; van Koningsbruggen-Rietschel, S. Effect of Lumacaftor/Ivacaftor on glucose metabolism and insulin secretion in Phe508del homozygous cystic fibrosis patients. J. Cyst. Fibros. 2018, 17, 271–275. [Google Scholar] [CrossRef] [Green Version]
- Scully, K.J.; Marchetti, P.; Sawicki, G.S.; Uluer, A.; Cernadas, M.; Cagnina, R.E.; Kennedy, J.C.; Putman, M.S. The effect of elexacaftor/tezacaftor/ivacaftor (ETI) on glycemia in adults with cystic fibrosis. J. Cyst. Fibros. 2021, 21, 258–263. [Google Scholar] [CrossRef]


| Variables | Baseline | After 12–18 Months of Lumacaftor/Ivacaftor Treatment | p |
|---|---|---|---|
| Gender (M/F) n (%) | 9 (56.2)/7 (43.8) | - | |
| Age (years) | 15.5 ± 4.6 | 17.0 ± 4.5 | <0.001 |
| Pubertal status | 0.65 | ||
| Pre-pubertal n (%) | 1 (6.3) | 1 (6.3) | |
| Pubertal n (%) | 4 (25.0) | 2 (12.5) | |
| Post-pubertal n (%) | 11 (68.7) | 13 (81.2) | |
| Height (Z-score) | −0.07 ± 0.70 | 0.09 ± 0.92 | 0.16 |
| Weight (Z-score) | −0.47 ± 0.55 | −0.40 ± 0.77 | 0.62 |
| BMI (kg × m−2) | 18.84 ± 3.20 | 19.80 ± 3.10 | 0.06 |
| BMI z-score | −0.63 ± 1.38 | −0.27 ± 1.20 | 0.12 |
| FEV1 (L) | 2.50 ± 0.86 | 2.89 ± 0.90 | <0.001 |
| FEV1% of predicted | 86.56 ± 16.93 | 93.56 ± 18.74 | 0.002 |
| FVC (L) | 3.38 ± 1.29 | 3.95 ± 1.26 | <0.001 |
| FVC% of predicted | 98.75 ± 24.35 | 108.59 ± 24.36 | <0.001 |
| Sweat chloride (mmol/L) | 82.37 ± 15.29 | 59.68 ± 19.73 | <0.001 |
| Glucose tolerance categories: | 0.94 | ||
| NGT n (%) | 8 (50.0) | 8 (50.0) | |
| INDET n (%) | 2 (12.5) | 3 (18.75) | |
| IGT n (%) | 3 (18.75) | 2 (12.5) | |
| CFRD n (%) | 3 (18.75) | 3 (18.75) | |
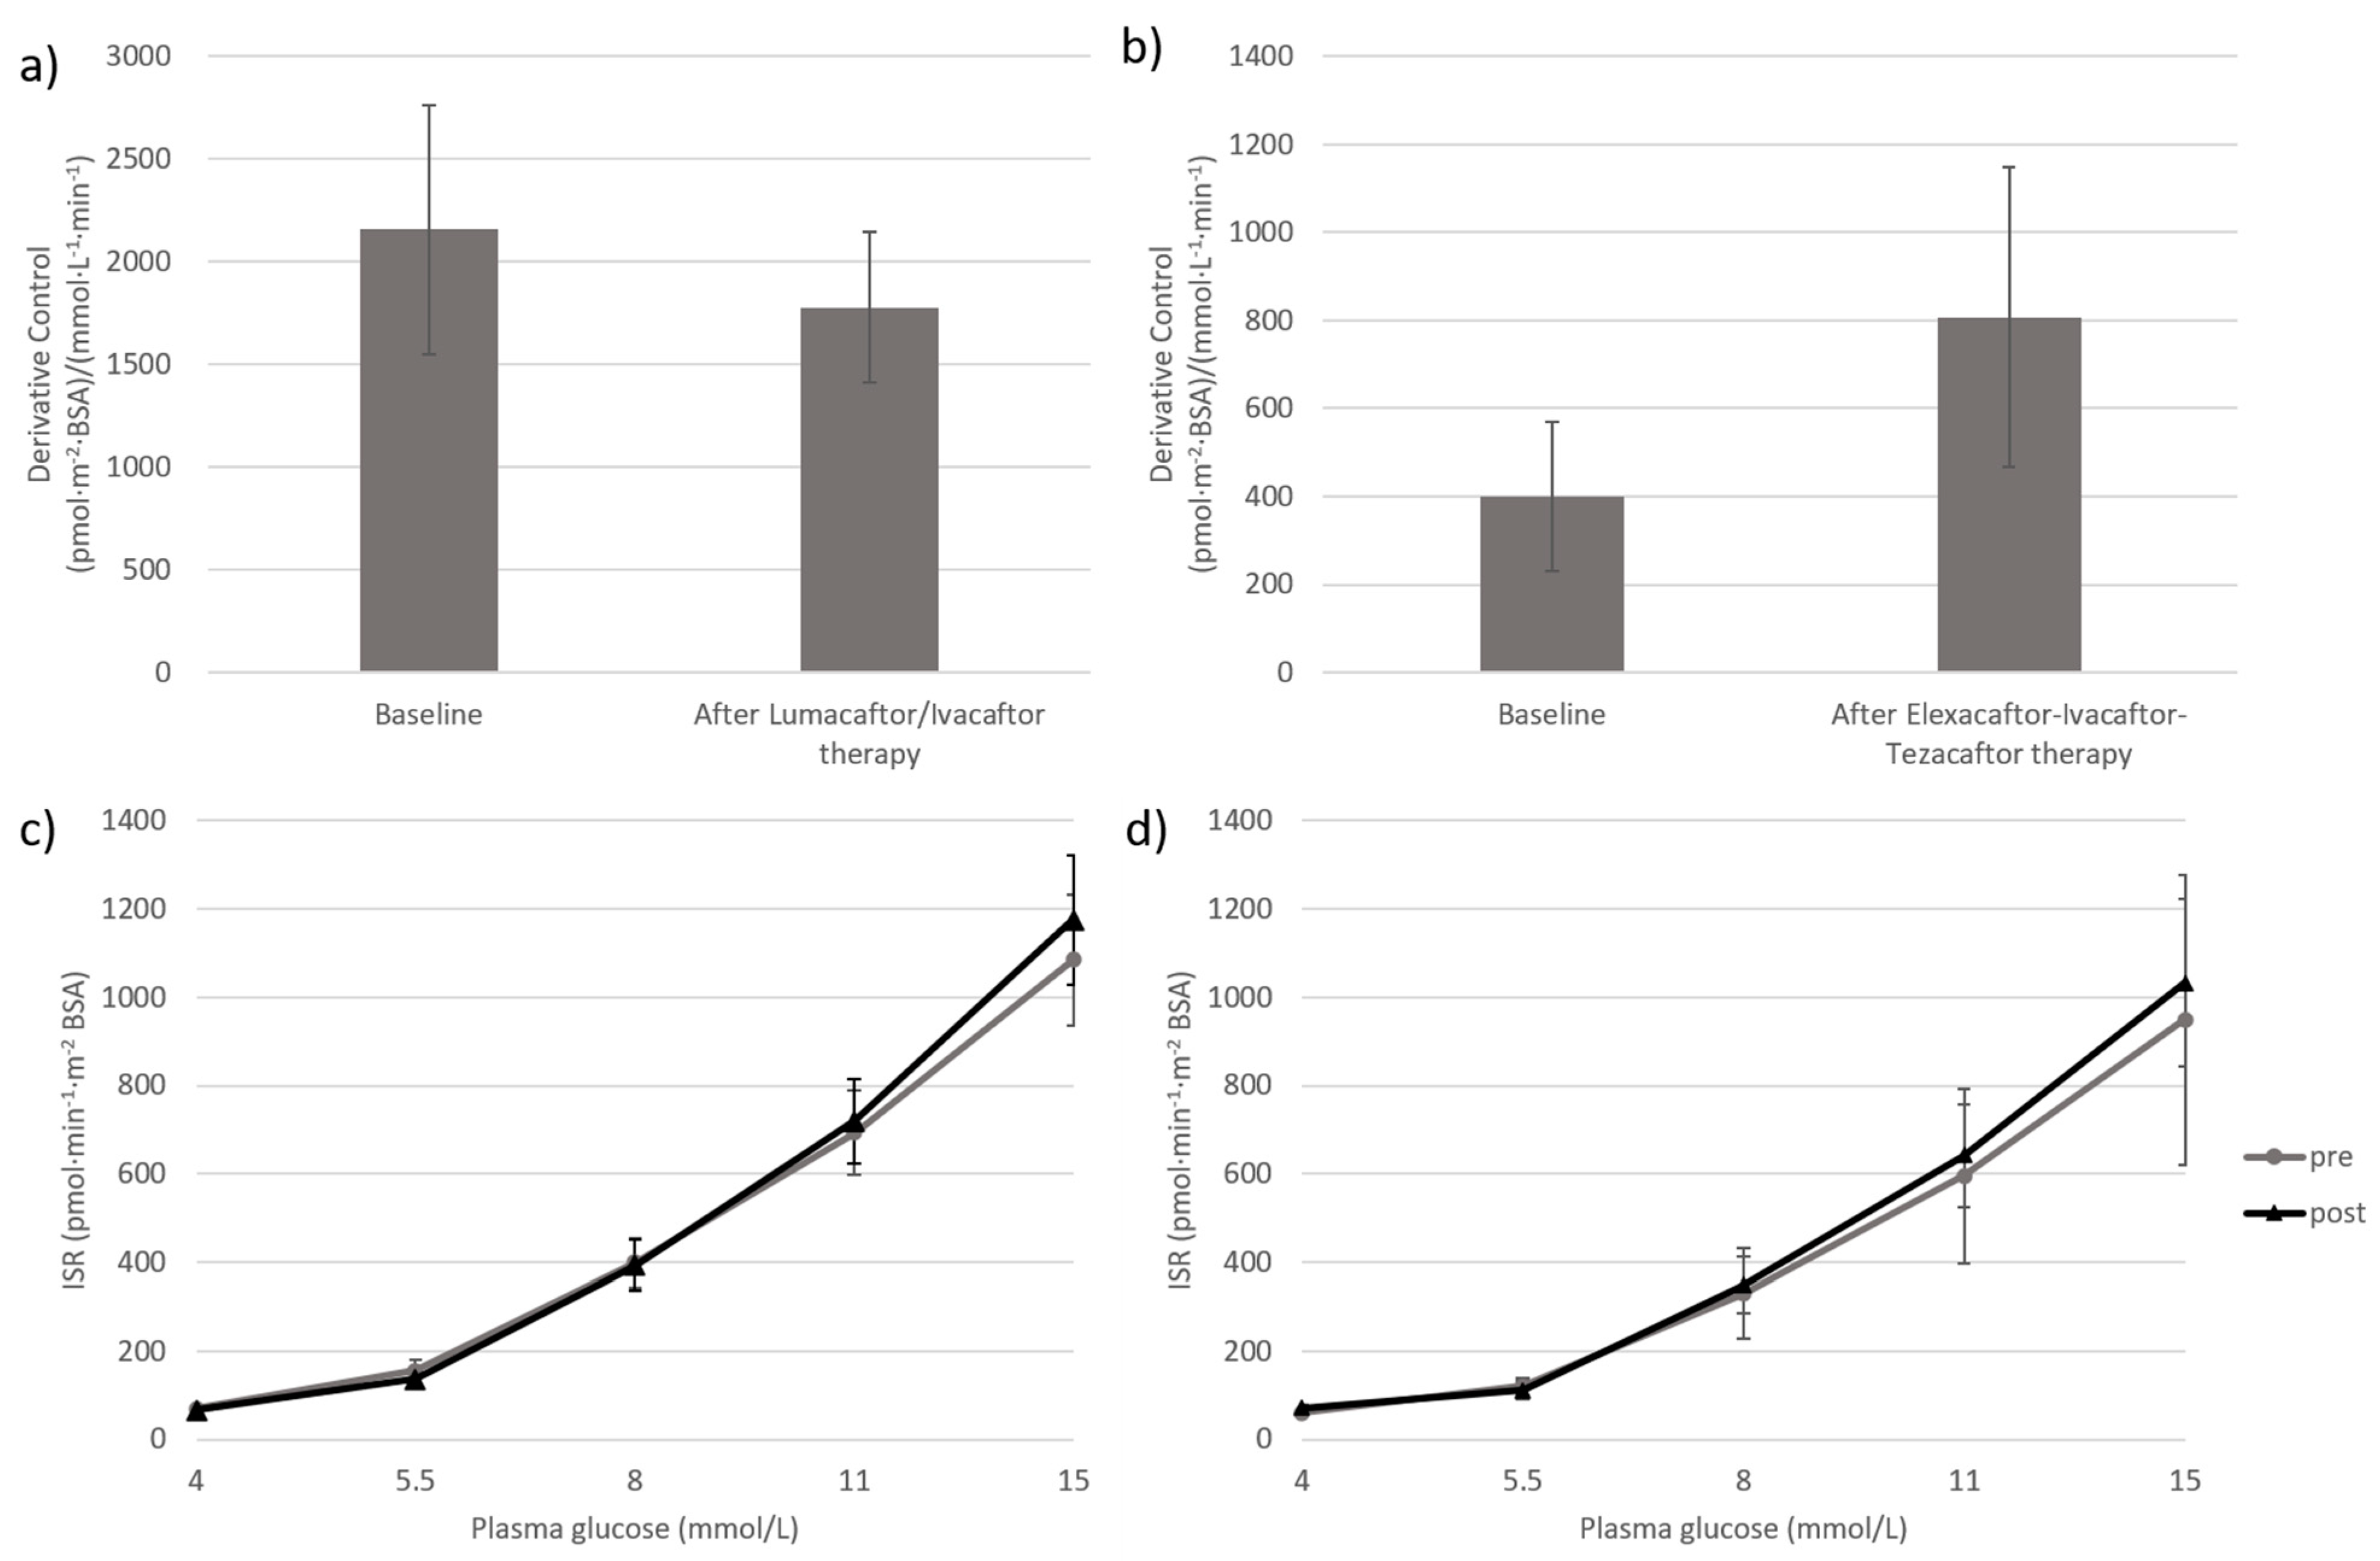
| DC ((pmol·m−2·BSA)/(mmol·L−1·min−1)) | 2157.0 ± 607.8 | 1778.4 ± 368.0 | 0.48 |
| PC (pmol/min/m2 BSA) | |||
| ISR4 | 60.9 (41.0–88.5) | 61.2 (46.2–84.7) | 0.16 |
| ISR5.5 | 123.4 (77.4–235.6) | 100.5 (71.0–216.7) | 0.50 |
| ISR8 | 340.6 (237.5–533.2) | 346.9 (257.2–504.8) | 0.09 |
| ISR11 | 619.9 (419.5–907.7) | 642.7 (472.0–937.4) | 0.91 |
| ISR15 | 970.1 (661.0–1419.8) | 1037.1 (805.6–1449.7) | 0.11 |
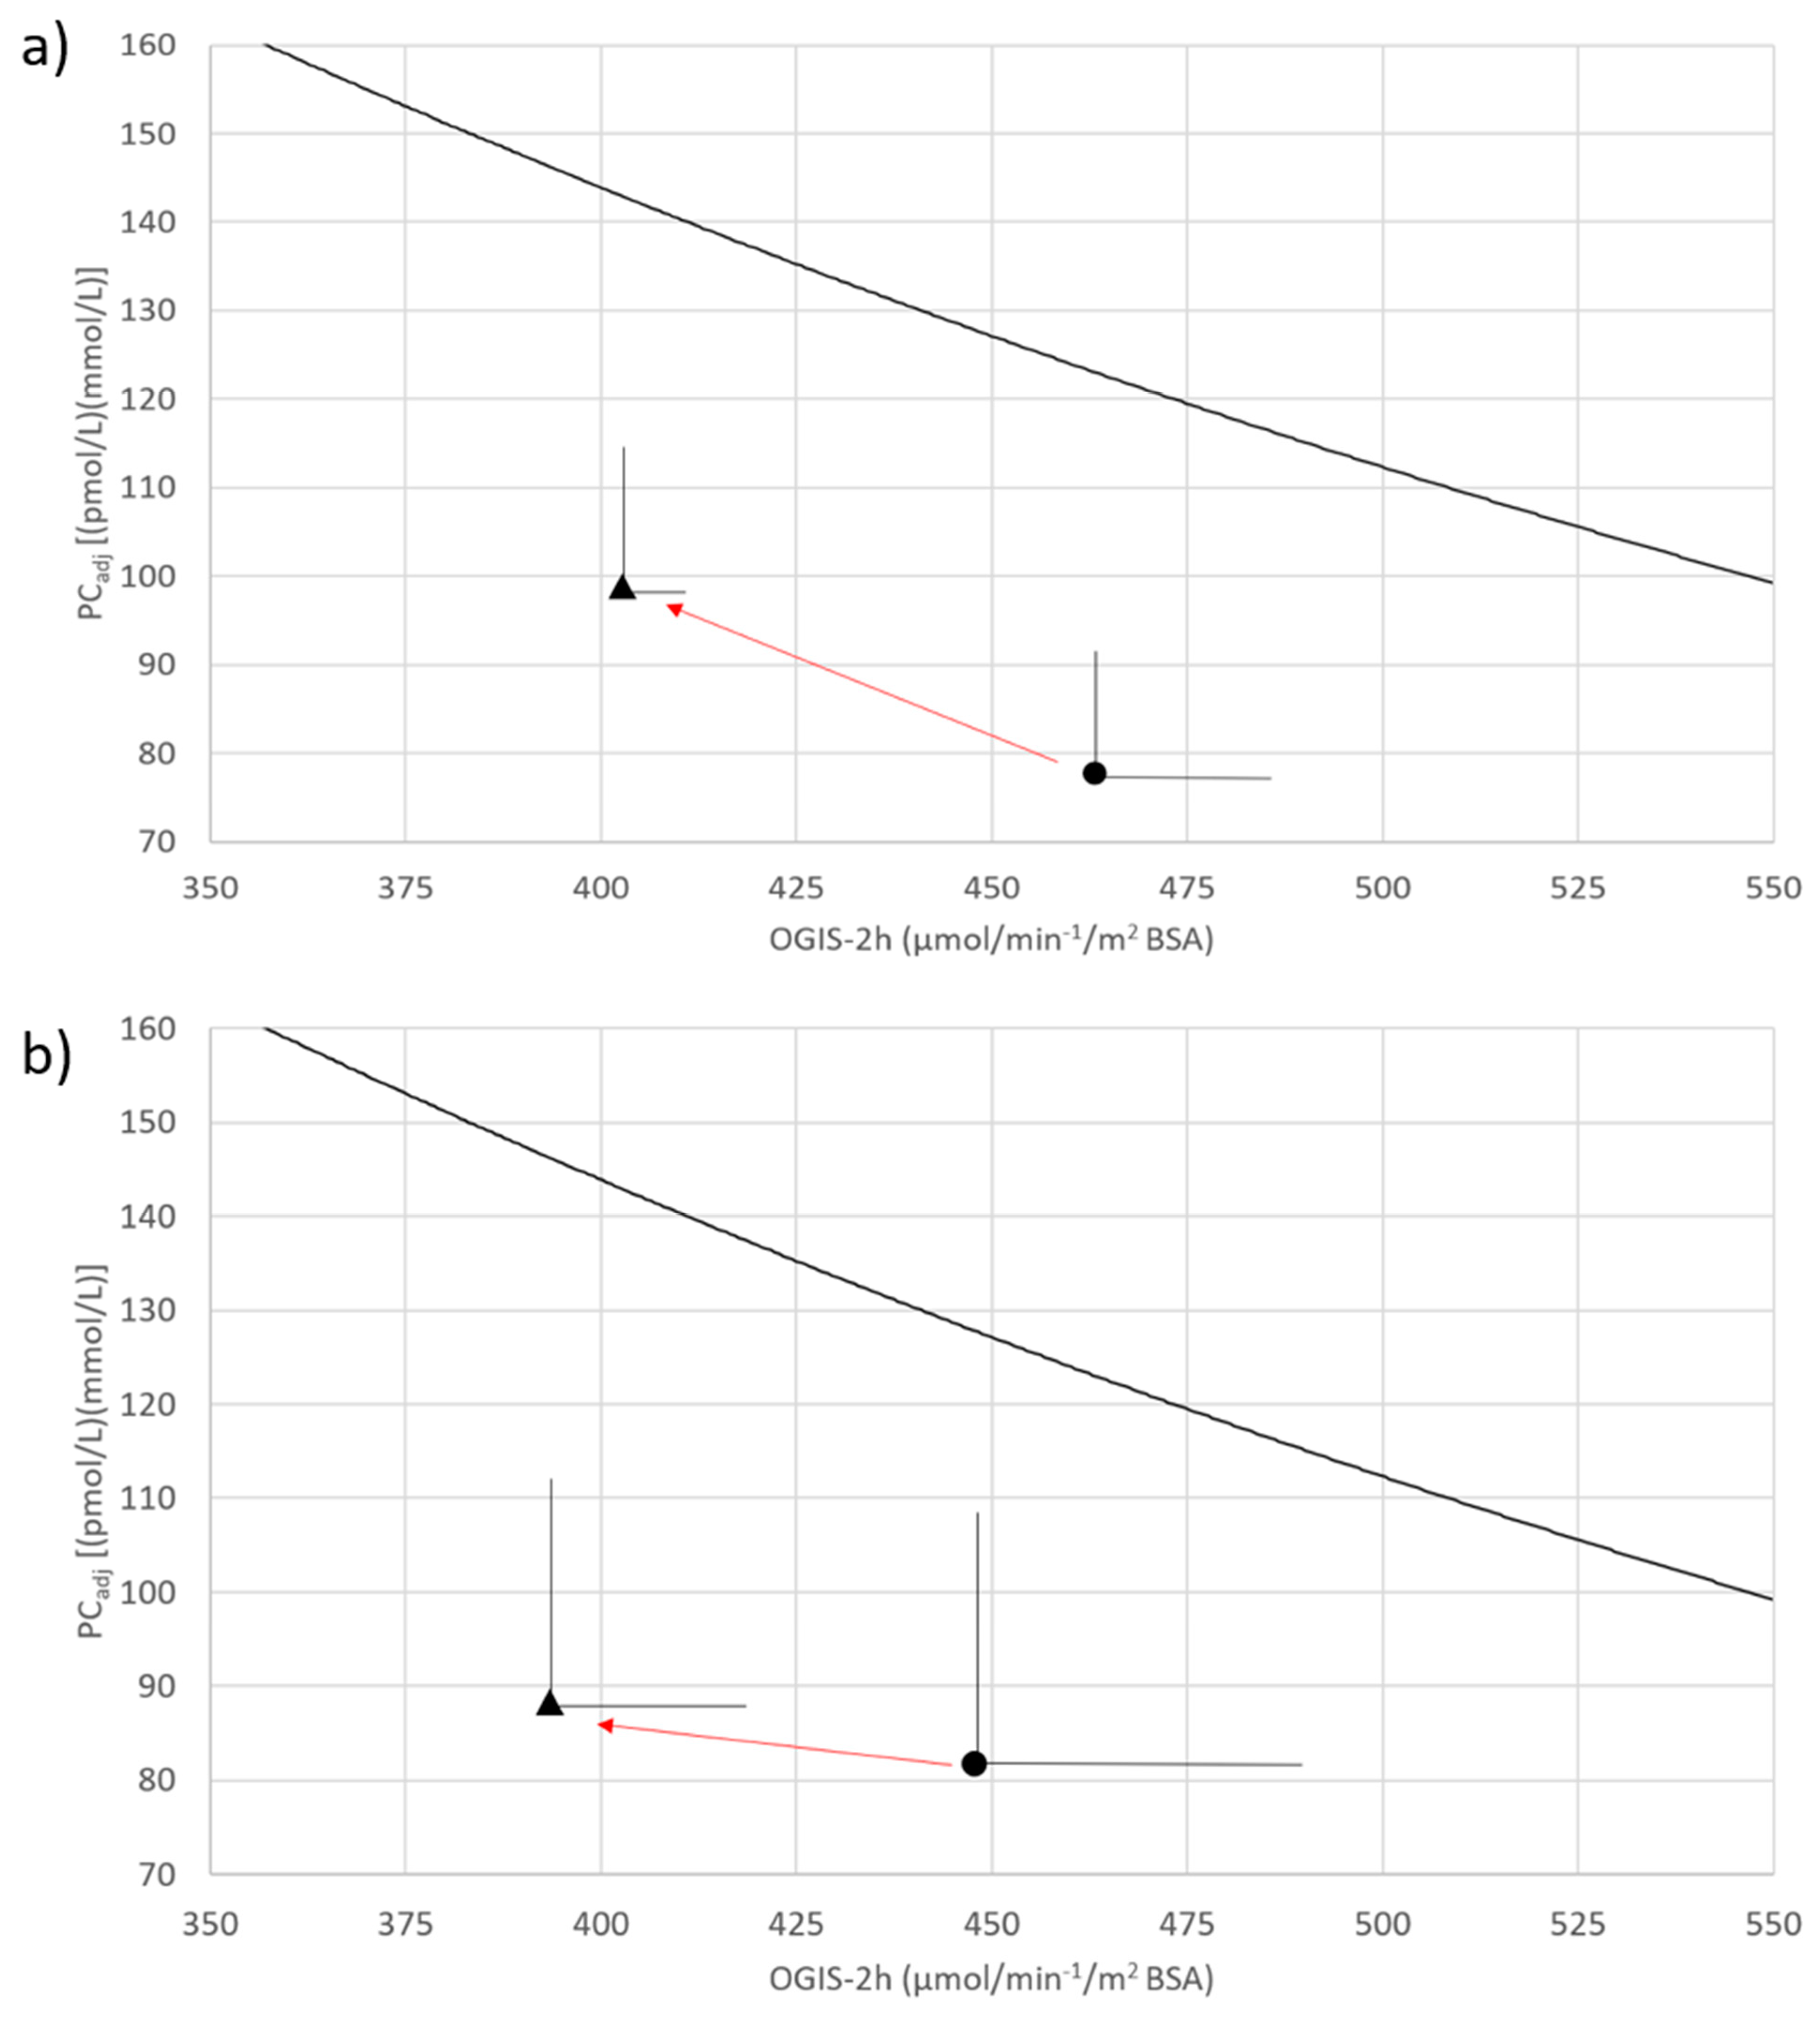
| PCadj ((pmol/L) (mmol/L)) | 77.6 ± 13.9 | 98.6 ± 15.2 | 0.16 |
| Insulin Clearance | 1.10 (0.82–1.51) | 0.98 (0.88–1.40) | 0.26 |
| OGIS | 464.1 ± 21.1 | 403.0 ± 9.8 | 0.004 |
| Variables | Baseline | After 12−18 months of Exacaftor/Ivacaftor/Tezacaftor | p |
|---|---|---|---|
| Gender (M/F) n (%) | 4 (80)/1 (20) | − | − |
| Age (years) | 22.0 ± 7.4 | 23.14 ± 7.50 | 0.028 |
| Pubertal status | 1.00 | ||
| Pre−pubertal n (%) | 0 (0) | 0 (0) | |
| Pubertal n (%) | 1 (20) | 1 (20) | |
| Post−pubertal n (%) | 4 (80) | 4 (80) | |
| Height (Z−score) | −0.32 ± 1.5 | −0.29 ± 1.47 | 0.48 |
| Weight (Z−score) | −0.67 ± 0.71 | −0.43 ± 0.53 | 0.18 |
| BMI (kg × m−2) | 19.92 ± 3.0 | 21.10 ± 2.49 | 0.07 |
| BMI z−score | −0.90 ± 0.72 | −0.44 ± 0.85 | 0.13 |
| FEV1 (L) | 1.67 ± 0.56 | 2.11 ± 0.57 | 0.023 |
| FEV1% of predicted | 39.0 ± 11.14 | 49.00 ± 11.27 | 0.041 |
| FVC (L) | 3.57 ± 0.98 | 4.17 ± 0.95 | 0.014 |
| FVC% of predicted | 72.67 ± 18.18 | 80.67 ± 10.07 | 0.287 |
| Sweat chloride (mmol/L) | 98.67 ± 15.04 | 30.33 ± 11.72 | 0.002 |
| Glucose tolerance categories: | 0.07 | ||
| NGT n (%) | 2 (40.0) | 2 (40.0) | |
| INDET n (%) | 1 (20) | 0 (0) | |
| IGT n (%) | 1 (20) | 2 (40) | |
| CFRD n (%) | 1 (20) | 1 (20) | |
| DC ((pmol·m−2·BSA) /(mmol·L −1 ·min−1)) | 400.7 ± 169.7 | 807.8 ± 341.8 | 0.35 |
| PC (pmol/min/m2 BSA) | |||
| ISR4 | 61.7 [45.2−76.4] | 66.8 [56.3−89.3] | 0.35 |
| ISR5.5 | 111.4 [79.3−167.9] | 105.3 [81.6−145.1] | 0.89 |
| ISR8 | 258.3 [221.2−475.4] | 259.5 [220.3−522.9] | 0.69 |
| ISR11 | 523.1 [382.9−844.5] | 484.0 [387.1−976.3] | 0.50 |
| ISR15 | 882.6 [595.0−1336.5] | 804.9 [598.7−1580.9] | 0.69 |
| PCadj ((pmol/L)·(mmol/L)) | 81.6 ± 28.4 | 88.2 ± 25.3 | 0.89 |
| Insulin Clearance (L/min) | 0.95 [0.83−1.14] | 0.92 [0.77−1.15] | 0.50 |
| OGIS (µmol·min−1·m−2 BSA) | 449.2 ± 44.4 | 396.2 ± 25.4 | 0.14 |
Publisher’s Note: MDPI stays neutral with regard to jurisdictional claims in published maps and institutional affiliations. |
© 2022 by the authors. Licensee MDPI, Basel, Switzerland. This article is an open access article distributed under the terms and conditions of the Creative Commons Attribution (CC BY) license (https://creativecommons.org/licenses/by/4.0/).
Share and Cite
Piona, C.; Mozzillo, E.; Tosco, A.; Volpi, S.; Rosanio, F.M.; Cimbalo, C.; Franzese, A.; Raia, V.; Zusi, C.; Emiliani, F.; et al. Impact of CFTR Modulators on Beta-Cell Function in Children and Young Adults with Cystic Fibrosis. J. Clin. Med. 2022, 11, 4149. https://doi.org/10.3390/jcm11144149
Piona C, Mozzillo E, Tosco A, Volpi S, Rosanio FM, Cimbalo C, Franzese A, Raia V, Zusi C, Emiliani F, et al. Impact of CFTR Modulators on Beta-Cell Function in Children and Young Adults with Cystic Fibrosis. Journal of Clinical Medicine. 2022; 11(14):4149. https://doi.org/10.3390/jcm11144149
Chicago/Turabian StylePiona, Claudia, Enza Mozzillo, Antonella Tosco, Sonia Volpi, Francesco Maria Rosanio, Chiara Cimbalo, Adriana Franzese, Valeria Raia, Chiara Zusi, Federica Emiliani, and et al. 2022. "Impact of CFTR Modulators on Beta-Cell Function in Children and Young Adults with Cystic Fibrosis" Journal of Clinical Medicine 11, no. 14: 4149. https://doi.org/10.3390/jcm11144149