Inflammation and TGF-β Signaling Differ between Abdominal Aneurysms and Occlusive Disease

 ,
,
Abstract
:1. Introduction
2. Materials and Methods
2.1. Tissue Analysis
2.1.1. Patient Cohort Tissue Collection
2.1.2. Aortic Biopsies
2.1.3. RNA Isolation and Microarray Hybridization
2.1.4. RNA Expression Analysis
2.1.5. Microarray Data Processing
2.1.6. Ingenuity Pathway Analysis
2.1.7. qPCR Analysis
2.2. Clinical Study Population Analysis
2.2.1. Patient Cohort Study Population
2.2.2. Lipoprotein and Inflammatory Parameters
2.2.3. Statistical Analysis
3. Results
3.1. AAA and AOD Patient and Sample Characteristics
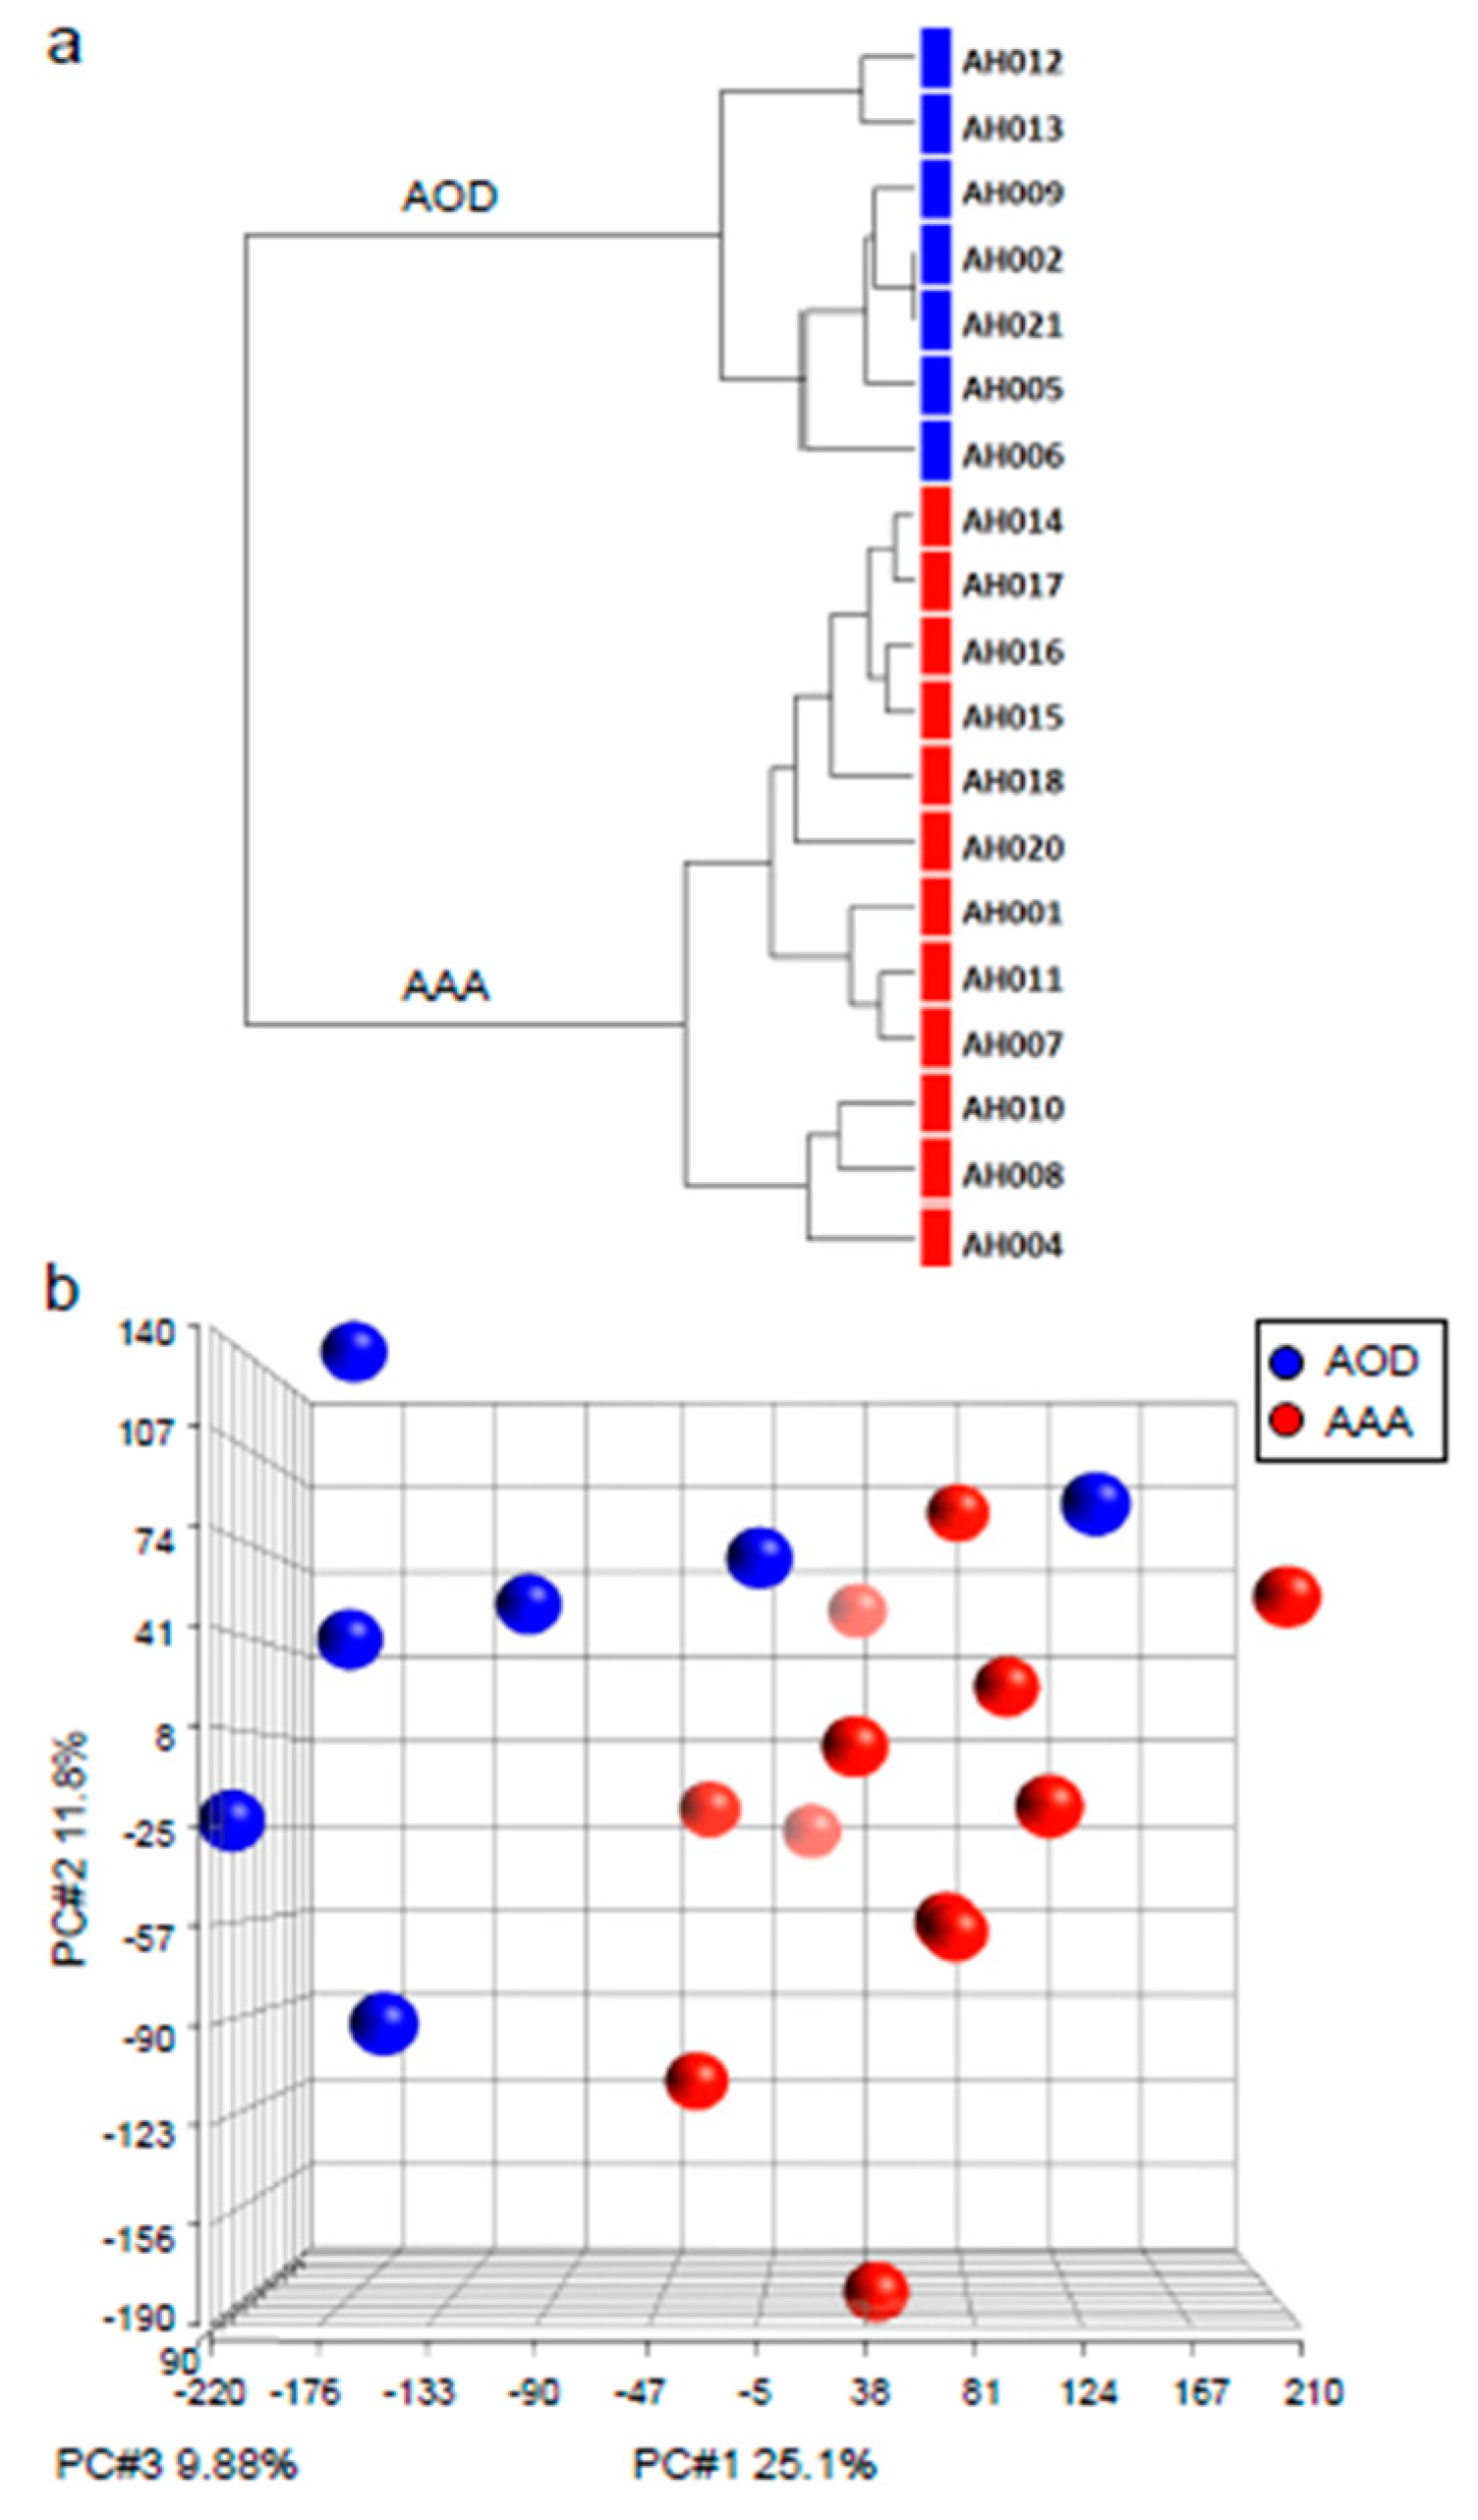
3.2. Non-Supervised Hierarchical Clustering and Principal Component Analysis
3.3. Gender Difference Exclusion
3.4. Selection of Genes
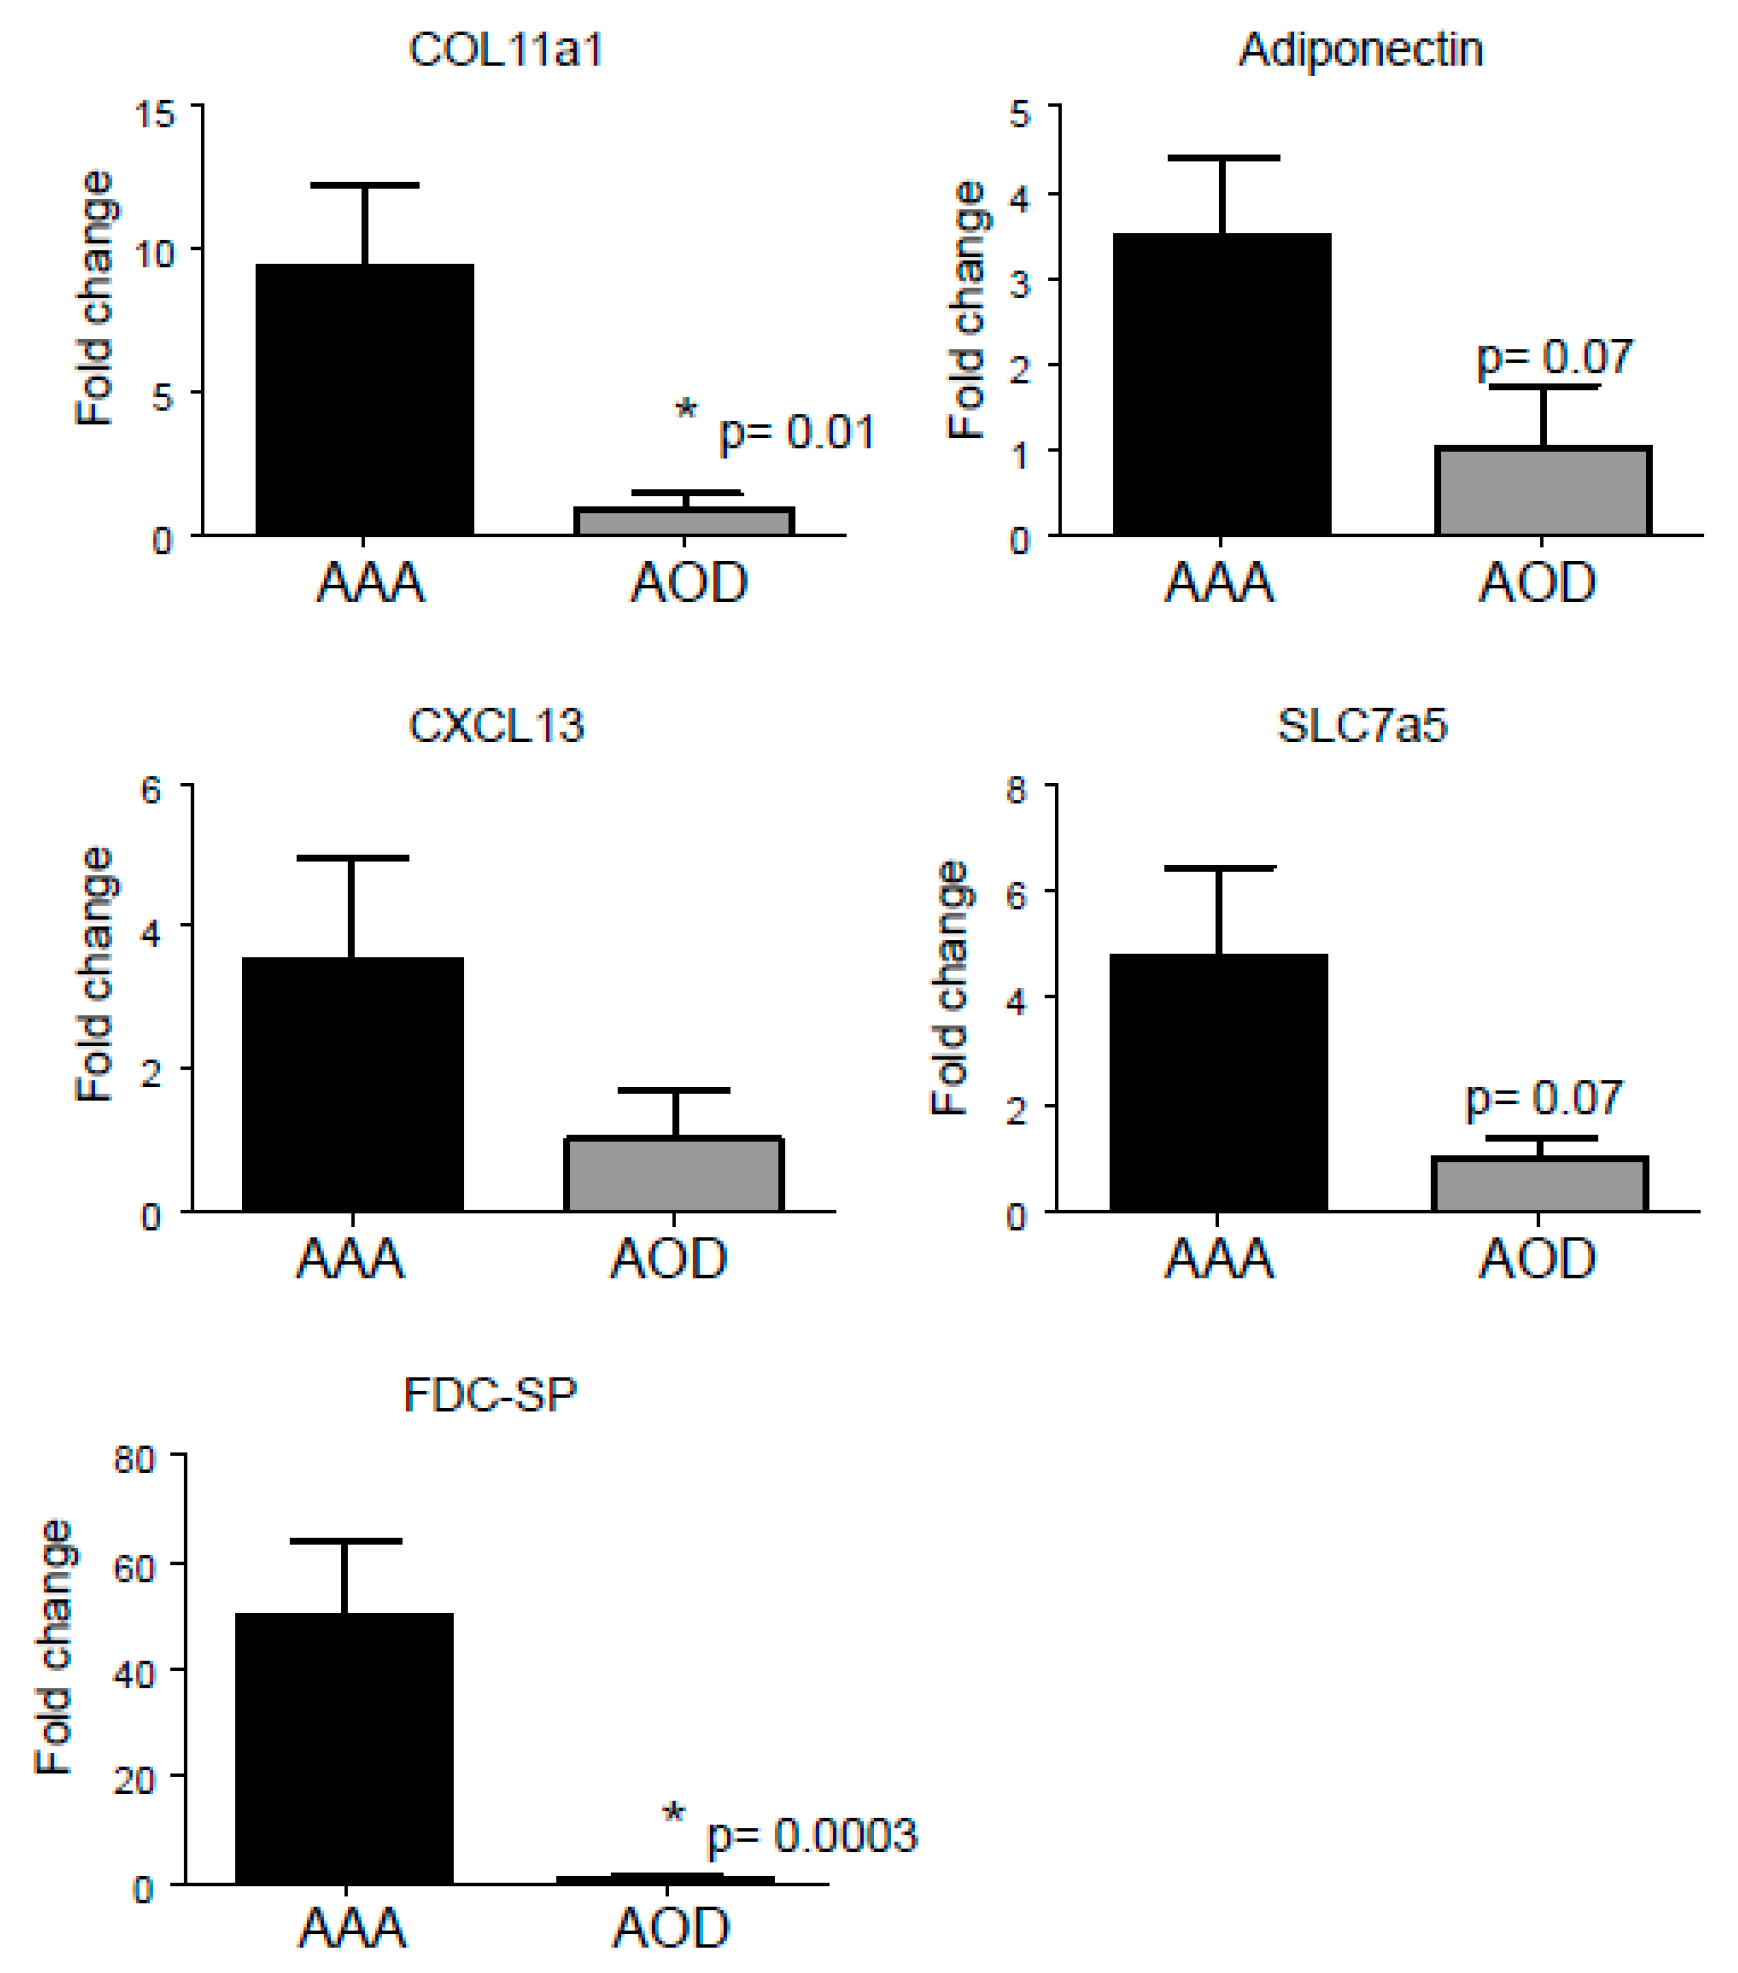
3.5. Selection Procedure of Top Upregulated Genes Reveals ‘Known’ and ‘Novel’ Candidate Marker Genes’ for AAA
3.6. Selection of Top Upstream Regulators Indicating Potential Key Regulators in AAA
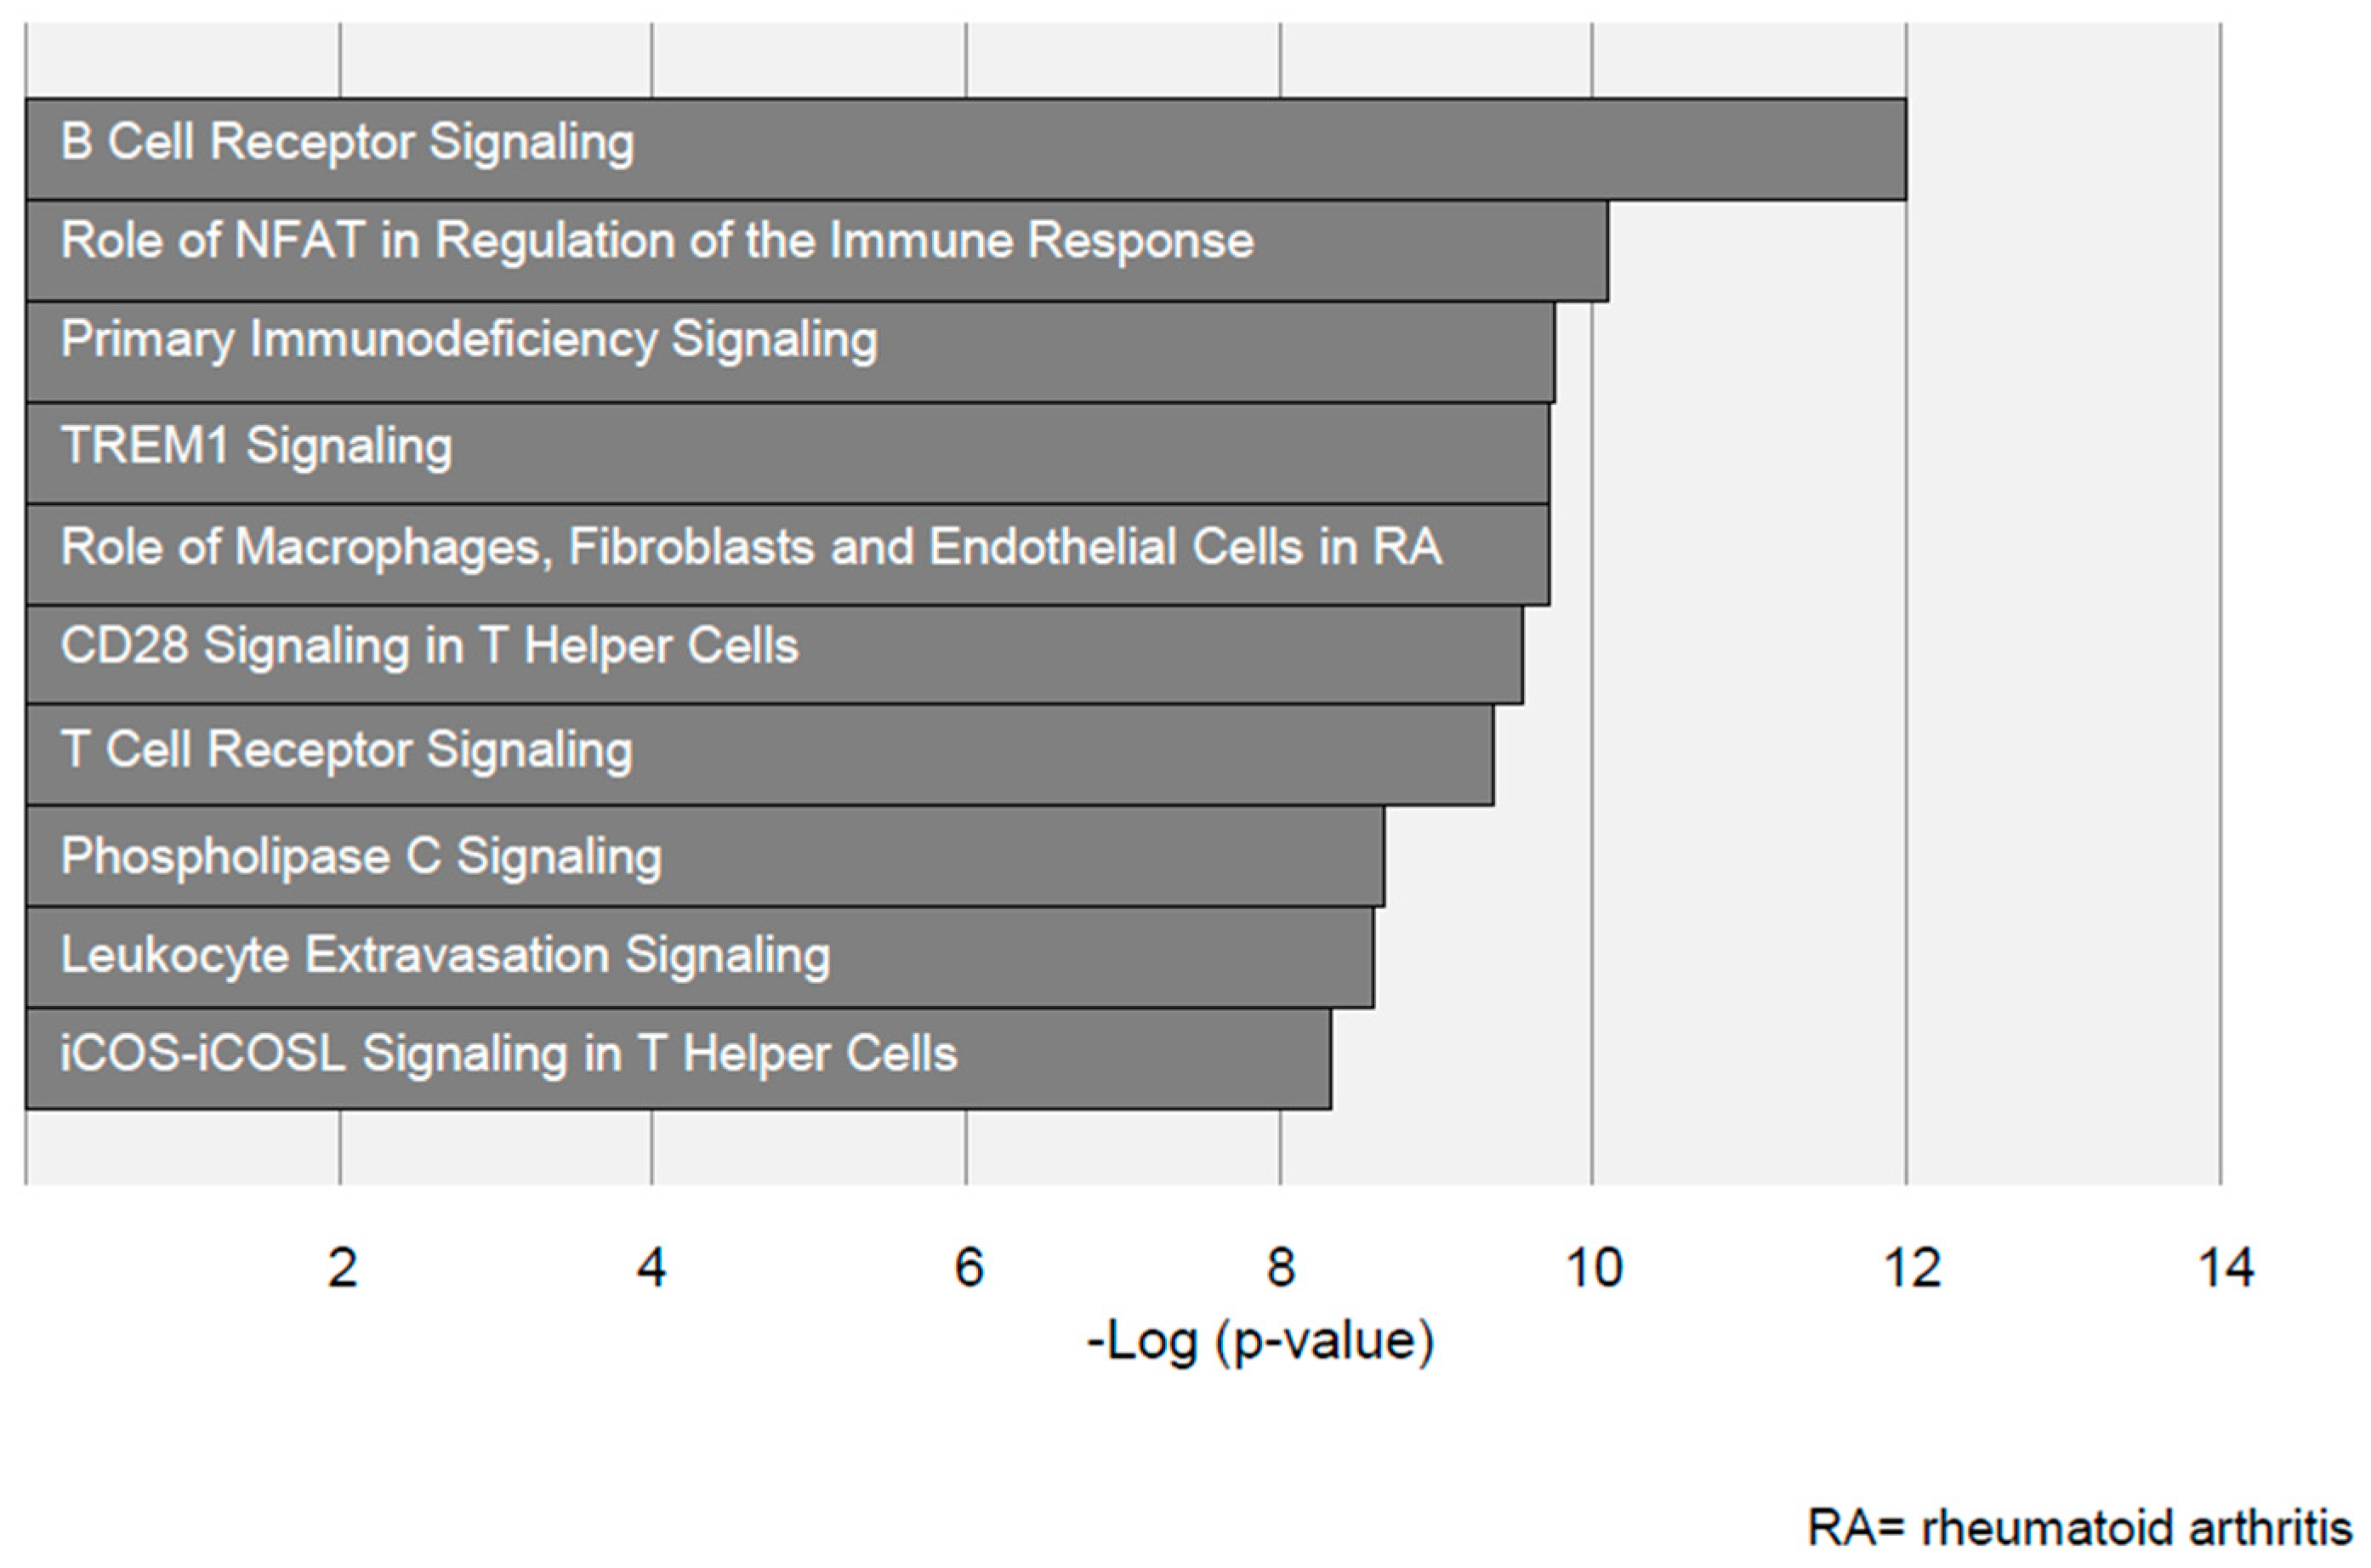
3.7. Pathway Selection by Ingenuity Pathway Analysis Identifies Distinct Inflammatory Pathways in Aneurysmal and Arterial Occlusive Disease
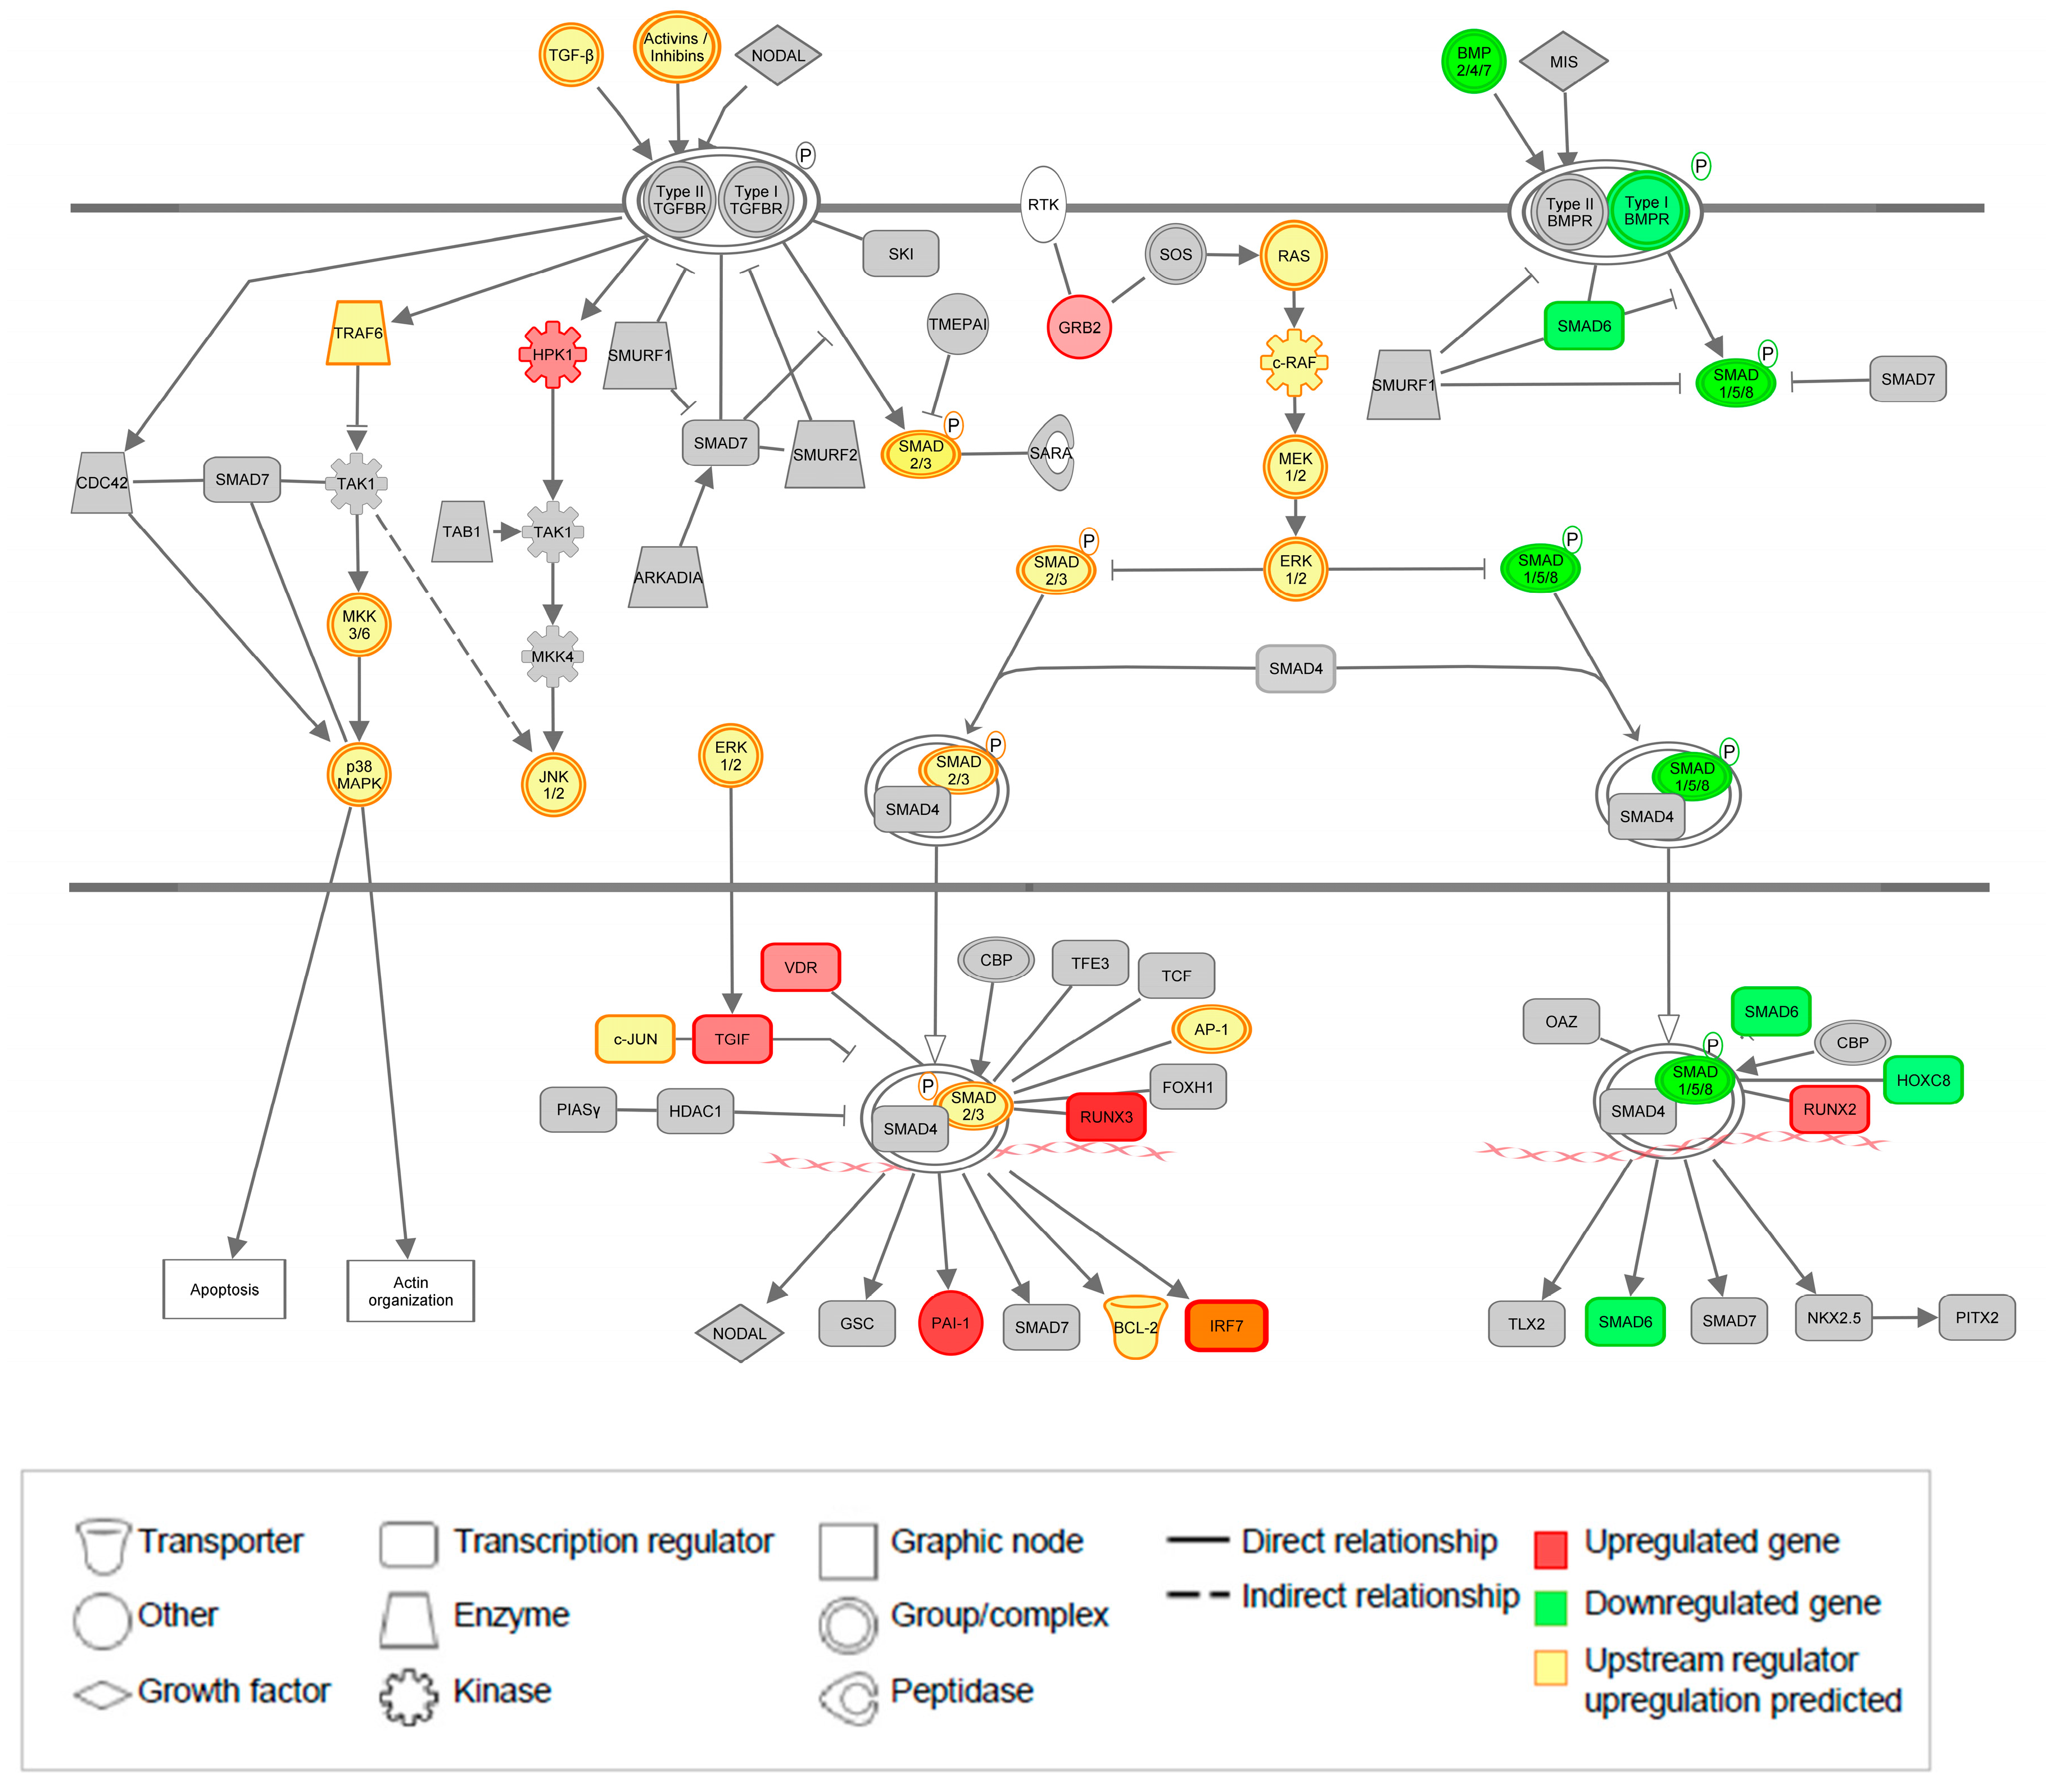
3.8. The TGF-β Pathway Is Significantly Regulated at Both Gene and Upstream Regulator Level
4. Discussion
Supplementary Materials
Author Contributions
Funding
Conflicts of Interest
References
- Isselbacher, E.M. Thoracic and abdominal aortic aneurysms. Circulation 2005, 111, 816–828. [Google Scholar] [CrossRef] [PubMed]
- Albornoz, G.; Coady, M.A.; Roberts, M.; Davies, R.R.; Tranquilli, M.; Rizzo, J.A.; Elefteriades, J.A. Familial thoracic aortic aneurysms and dissections--incidence, modes of inheritance, and phenotypic patterns. Ann. Thorac. Surg. 2006, 82, 1400–1405. [Google Scholar] [CrossRef] [PubMed]
- Dietz, H.C.; Cutting, G.R.; Pyeritz, R.E.; Maslen, C.L.; Sakai, L.Y.; Corson, G.M.; Puffenberger, E.G.; Hamosh, A.; Nanthakumar, E.J.; Curristin, S.M.; et al. Marfan-syndrome caused by a recurrent denovo missense mutation in the fibrillin gene. Nature 1991, 352, 337–339. [Google Scholar] [CrossRef] [PubMed]
- Loeys, B.L.; Chen, J.; Neptune, E.R.; Judge, D.P.; Podowski, M.; Holm, T.; Meyers, J.; Leitch, C.C.; Katsanis, N.; Sharifi, N.; et al. A syndrome of altered cardiovascular, craniofacial, neurocognitive and skeletal development caused by mutations in tgfbr1 or tgfbr2. Nat. Genet. 2005, 37, 275–281. [Google Scholar] [CrossRef]
- van de Laar, I.M.; Oldenburg, R.A.; Pals, G.; Roos-Hesselink, J.W.; de Graaf, B.M.; Verhagen, J.M.; Hoedemaekers, Y.M.; Willemsen, R.; Severijnen, L.A.; Venselaar, H.; et al. Mutations in smad3 cause a syndromic form of aortic aneurysms and dissections with early-onset osteoarthritis. Nat. Genet. 2011, 43, 121–126. [Google Scholar] [CrossRef]
- Boileau, C.; Guo, D.C.; Hanna, N.; Regalado, E.S.; Detaint, D.; Gong, L.; Varret, M.; Prakash, S.K.; Li, A.H.; d’Indy, H.; et al. Tgfb2 mutations cause familial thoracic aortic aneurysms and dissections associated with mild systemic features of marfan syndrome. Nat. Genet. 2012, 44, 916–921. [Google Scholar] [CrossRef]
- Grewal, N.; Gittenberger-de Groot, A.C. Pathogenesis of aortic wall complications in marfan syndrome. Cardiovasc. Pathol. 2018, 33, 62–69. [Google Scholar] [CrossRef]
- Buchan, J.G.; Alvarado, D.M.; Haller, G.E.; Cruchaga, C.; Harms, M.B.; Zhang, T.; Willing, M.C.; Grange, D.K.; Braverman, A.C.; Miller, N.H.; et al. Rare variants in fbn1 and fbn2 are associated with severe adolescent idiopathic scoliosis. Hum. Mol. Genet. 2014, 23, 5271–5282. [Google Scholar] [CrossRef]
- Kaijzel, E.L.; van Heijningen, P.M.; Wielopolski, P.A.; Vermeij, M.; Koning, G.A.; van Cappellen, W.A.; Que, I.; Chan, A.; Dijkstra, J.; Ramnath, N.W.; et al. Multimodality imaging reveals a gradual increase in matrix metalloproteinase activity at aneurysmal lesions in live fibulin-4 mice. Circ. Cardiovasc. Imaging 2010, 3, 567–577. [Google Scholar] [CrossRef]
- Lindsay, M.E.; Schepers, D.; Bolar, N.A.; Doyle, J.J.; Gallo, E.; Fert-Bober, J.; Kempers, M.J.; Fishman, E.K.; Chen, Y.; Myers, L.; et al. Loss-of-function mutations in tgfb2 cause a syndromic presentation of thoracic aortic aneurysm. Nat. Genet. 2012, 44, 922–927. [Google Scholar] [CrossRef]
- Matt, P.; Schoenhoff, F.; Habashi, J.; Holm, T.; Van Erp, C.; Loch, D.; Carlson, O.D.; Griswold, B.F.; Fu, Q.; De Backer, J.; et al. Circulating transforming growth factor-beta in marfan syndrome. Circulation 2009, 120, 526–532. [Google Scholar] [PubMed]
- van de Luijtgaarden, K.M.; Heijsman, D.; Maugeri, A.; Weiss, M.M.; Verhagen, H.J.; IJpma, A.; Bruggenwirth, H.T.; Majoor-Krakauer, D. First genetic analysis of aneurysm genes in familial and sporadic abdominal aortic aneurysm. Hum. Genet. 2015, 134, 881–893. [Google Scholar] [CrossRef] [PubMed] [Green Version]
- Derezinski, T.L.; Formankiewicz, B.; Migdalski, A.; Brazis, P.; Jakubowski, G.; Woda, L.; Jawien, A. The prevalence of abdominal aortic aneurysms in the rural/urban population in central poland—Gniewkowo aortic study. Kardiol. Pol. 2017, 75, 705–710. [Google Scholar]
- Lindholt, J.S.; Juul, S.; Fasting, H.; Henneberg, E.W. Screening for abdominal aortic aneurysms: Single centre randomised controlled trial. BMJ 2005, 330, 750. [Google Scholar]
- Persson, S.E.; Boman, K.; Wanhainen, A.; Carlberg, B.; Arnerlov, C. Decreasing prevalence of abdominal aortic aneurysm and changes in cardiovascular risk factors. J. Vasc. Surg. 2017, 65, 651–658. [Google Scholar] [CrossRef] [Green Version]
- Ashton, H.A.; Buxton, M.J.; Campbell, H.E.; Day, N.E.; Kim, L.G.; Marteau, T.M.; Scott, R.A.P.; Thompson, S.G.; Barker, P.; Collin, J.; et al. Multicentre aneurysm screening study (mass): Cost effectiveness analysis of screening for abdominal aortic aneurysms based on four year results from randomised controlled trial. Br. Med. J. 2002, 325, 1135. [Google Scholar]
- van de Luijtgaarden, K.M.; Rouwet, E.V.; Hoeks, S.E.; Stolker, R.J.; Verhagen, H.J.; Majoor-Krakauer, D. Risk of abdominal aortic aneurysm (aaa) among male and female relatives of aaa patients. Vasc. Med. 2017, 22, 112–118. [Google Scholar] [CrossRef]
- Lederle, F.A.; Johnson, G.R.; Wilson, S.E.; Chute, E.P.; Littooy, F.N.; Bandyk, D.; Krupski, W.C.; Barone, G.W.; Acher, C.W.; Ballard, D.J. Prevalence and associations of abdominal aortic aneurysm detected through screening. Aneurysm detection and management (adam) veterans affairs cooperative study group. Ann. Intern. Med. 1997, 126, 441–449. [Google Scholar]
- Gallino, A.; Aboyans, V.; Diehm, C.; Cosentino, F.; Stricker, H.; Falk, E.; Schouten, O.; Lekakis, J.; Amann-Vesti, B.; Siclari, F.; et al. Non-coronary atherosclerosis. Eur. Heart J. 2014, 35, 1112–1119. [Google Scholar] [Green Version]
- Ramnath, N.W.; van de Luijtgaarden, K.M.; van der Pluijm, I.; van Nimwegen, M.; van Heijningen, P.M.; Swagemakers, S.M.; van Thiel, B.S.; Ridwan, R.Y.; van Vliet, N.; Vermeij, M.; et al. Extracellular matrix defects in aneurysmal fibulin-4 mice predispose to lung emphysema. PLoS ONE 2014, 9, e106054. [Google Scholar]
- Pearson, T.A.; Mensah, G.A.; Alexander, R.W.; Anderson, J.L.; Cannon, R.O., 3rd; Criqui, M.; Fadl, Y.Y.; Fortmann, S.P.; Hong, Y.; Myers, G.L.; et al. Markers of inflammation and cardiovascular disease: Application to clinical and public health practice: A statement for healthcare professionals from the centers for disease control and prevention and the american heart association. Circulation 2003, 107, 499–511. [Google Scholar] [CrossRef] [PubMed]
- Hinterseher, I.; Erdman, R.; Donoso, L.A.; Vrabec, T.R.; Schworer, C.M.; Lillvis, J.H.; Boddy, A.M.; Derr, K.; Golden, A.; Bowen, W.D.; et al. Role of complement cascade in abdominal aortic aneurysms. Arterioscler Thromb. Vasc. Biol. 2011, 31, 1653–1660. [Google Scholar] [CrossRef] [PubMed]
- Black, K.M.; Masuzawa, A.; Hagberg, R.C.; Khabbaz, K.R.; Trovato, M.E.; Rettagliati, V.M.; Bhasin, M.K.; Dillon, S.T.; Libermann, T.A.; Toumpoulis, I.K.; et al. Preliminary biomarkers for identification of human ascending thoracic aortic aneurysm. J. Am. Heart Assoc. 2013, 2, e000138. [Google Scholar] [CrossRef] [PubMed]
- Takeshita, S.; Takabayashi, H.; Yoshida, N. Circulating adiponectin levels in kawasaki disease. Acta Paediatr. 2006, 95, 1312–1314. [Google Scholar] [CrossRef] [PubMed]
- Ansel, K.M.; Ngo, V.N.; Hyman, P.L.; Luther, S.A.; Forster, R.; Sedgwick, J.D.; Browning, J.L.; Lipp, M.; Cyster, J.G. A chemokine-driven positive feedback loop organizes lymphoid follicles. Nature 2000, 406, 309–314. [Google Scholar] [CrossRef]
- Houtkamp, M.A.; de Boer, O.J.; van der Loos, C.M.; van der Wal, A.C.; Becker, A.E. Adventitial infiltrates associated with advanced atherosclerotic plaques: Structural organization suggests generation of local humoral immune responses. J. Pathol. 2001, 193, 263–269. [Google Scholar] [CrossRef]
- Mohanta, S.K.; Yin, C.J.; Peng, L.; Srikakulapu, P.; Bontha, V.; Hu, D.S.; Weih, F.; Weber, C.; Gerdes, N.; Habenicht, A.J.R. Artery tertiary lymphoid organs contribute to innate and adaptive immune responses in advanced mouse atherosclerosis. Circ. Res. 2014, 114, 1772–1787. [Google Scholar] [CrossRef]
- Tilson, M.D.; Ro, C.Y. The candidate gene approach to susceptibility for abdominal aortic aneurysm—timp1, hla-dr-15, ferritin light chain, and collagen xi-alpha-1. Abdom. Aortic Aneurysm: Genet. Pathophysiol. Mol. Biol. 2006, 1085, 282–290. [Google Scholar] [CrossRef]
- Toumpoulis, I.K.; Oxford, J.T.; Cowan, D.B.; Anagnostopoulos, C.E.; Rokkas, C.K.; Chamogeorgakis, T.P.; Angouras, D.C.; Shemin, R.J.; Navab, M.; Ericsson, M.; et al. Differential expression of collagen type v and xi alpha-1 in human ascending thoracic aortic aneurysms. Ann. Thorac. Surg. 2009, 88, 506–514. [Google Scholar] [CrossRef]
- Urieli-Shoval, S.; Linke, R.P.; Matzner, Y. Expression and function of serum amyloid a, a major acute-phase protein, in normal and disease states. Curr. Opin. Hematol. 2000, 7, 64–69. [Google Scholar] [CrossRef]
- Steel, D.M.; Sellar, G.C.; Uhlar, C.M.; Simon, S.; Debeer, F.C.; Whitehead, A.S. A constitutively expressed serum amyloid-a protein gene (saa4) is closely linked to, and shares structural similarities with, an acute-phase serum amyloid-a protein gene (saa2). Genomics 1993, 16, 447–454. [Google Scholar] [CrossRef] [PubMed]
- De Beer, M.C.; Wroblewski, J.M.; Noffsinger, V.P.; Rateri, D.L.; Howatt, D.A.; Balakrishnan, A.; Ji, A.L.; Shridas, P.; Thompson, J.C.; van der Westhuyzen, D.R.; et al. Deficiency of endogenous acute phase serum amyloid a does not affect atherosclerotic lesions in apolipoprotein e-deficient mice. Arterioscler. Thromb. Vasc. Biol. 2014, 34, 255–261. [Google Scholar] [CrossRef] [PubMed]
- Ridker, P.M.; Hennekens, C.H.; Buring, J.E.; Rifai, N. C-reactive protein and other markers of inflammation in the prediction of cardiovascular disease in women. N. Engl. J. Med. 2000, 342, 836–843. [Google Scholar] [CrossRef] [PubMed]
- Yamauchi, T.; Kamon, J.; Waki, H.; Terauchi, Y.; Kubota, N.; Hara, K.; Mori, Y.; Ide, T.; Murakami, K.; Tsuboyama-Kasaoka, N.; et al. The fat-derived hormone adiponectin reverses insulin resistance associated with both lipoatrophy and obesity. Nat. Med. 2001, 7, 941–946. [Google Scholar] [CrossRef]
- Yoshida, S.; Fuster, J.J.; Walsh, K. Adiponectin attenuates abdominal aortic aneurysm formation in hyperlipidemic mice. Atherosclerosis 2014, 235, 339–346. [Google Scholar] [CrossRef] [Green Version]
- Okamoto, Y.; Kihara, S.; Ouchi, N.; Nishida, M.; Arita, Y.; Kumada, M.; Ohashi, K.; Sakai, N.; Shimomura, I.; Kobayashi, H.; et al. Adiponectin reduces atherosclerosis in apolipoprotein e-deficient mice. Circulation 2002, 106, 2767–2770. [Google Scholar] [CrossRef]
- Marshall, A.J.; Du, Q.; Draves, K.E.; Shikishima, Y.; HayGlass, K.T.; Clark, E.A. Fdc-sp, a novel secreted protein expressed by follicular dendritic cells. J. Immunol. 2002, 169, 2381–2389. [Google Scholar] [CrossRef]
- Al-Alwan, M.; Du, Q.; Hou, S.; Nashed, B.; Fan, Y.; Yang, X.; Marshall, A.J. Follicular dendritic cell secreted protein (fdc-sp) regulates germinal center and antibody responses. J. Immunol. 2007, 178, 7859–7867. [Google Scholar] [CrossRef]
- Teitell, M.A. Oca-b regulation of b-cell development and function. Trends Immunol. 2003, 24, 546–553. [Google Scholar] [CrossRef]
- Hagg, S.; Salehpour, M.; Noori, P.; Lundstrom, J.; Possnert, G.; Takolander, R.; Konrad, P.; Rosfors, S.; Ruusalepp, A.; Skogsberg, J.; et al. Carotid plaque age is a feature of plaque stability inversely related to levels of plasma insulin. PLoS ONE 2011, 6, e18248. [Google Scholar] [CrossRef]
- Treska, V.; Kocova, J.; Boudova, L.; Neprasova, P.; Topolcan, O.; Pecen, L.; Tonar, Z. Inflammation in the wall of abdominal aortic aneurysm and its role in the symptomatology of aneurysm. Cytokines Cell Mol. Ther. 2002, 7, 91–97. [Google Scholar] [CrossRef] [PubMed]
- Ait-Oufella, H.; Herbin, O.; Bouaziz, J.D.; Binder, C.J.; Uyttenhove, C.; Laurans, L.; Taleb, S.; Van Vre, E.; Esposito, B.; Vilar, J.; et al. B cell depletion reduces the development of atherosclerosis in mice. J. Exp. Med. 2010, 207, 1579–1587. [Google Scholar] [CrossRef] [PubMed]
- Kyaw, T.; Tay, C.; Hosseini, H.; Kanellakis, P.; Gadowski, T.; MacKay, F.; Tipping, P.; Bobik, A.; Toh, B.H. Depletion of b2 but not b1a b cells in baff receptor-deficient apoe mice attenuates atherosclerosis by potently ameliorating arterial inflammation. PLoS ONE 2012, 7, e29371. [Google Scholar] [CrossRef] [PubMed]
- Kyaw, T.; Tay, C.; Krishnamurthi, S.; Kanellakis, P.; Agrotis, A.; Tipping, P.; Bobik, A.; Toh, B.H. B1a b lymphocytes are atheroprotective by secreting natural igm that increases igm deposits and reduces necrotic cores in atherosclerotic lesions. Circ. Res. 2011, 109, 830–840. [Google Scholar] [CrossRef] [PubMed]
- Flach, H.; Rosenbaum, M.; Duchniewicz, M.; Kim, S.; Zhang, S.L.; Cahalan, M.D.; Mittler, G.; Grosschedl, R. Mzb1 protein regulates calcium homeostasis, antibody secretion, and integrin activation in innate-like b cells. Immunity 2010, 33, 723–735. [Google Scholar] [CrossRef]
- Verrey, F.; Closs, E.I.; Wagner, C.A.; Palacin, M.; Endou, H.; Kanai, Y. Cats and hats: The slc7 family of amino acid transporters. Pflug. Arch. 2004, 447, 532–542. [Google Scholar] [CrossRef]
- Allison, M.B.; Myers, M.G., Jr. 20 years of leptin: Connecting leptin signaling to biological function. J. Endocrinol. 2014, 223, T25–T35. [Google Scholar] [CrossRef]
- Tao, M.; Yu, P.; Nguyen, B.T.; Mizrahi, B.; Savion, N.; Kolodgie, F.D.; Virmani, R.; Hao, S.; Ozaki, C.K.; Schneiderman, J. Locally applied leptin induces regional aortic wall degeneration preceding aneurysm formation in apolipoprotein e-deficient mice. Arter. Thromb. Vasc. Biol. 2013, 33, 311–320. [Google Scholar] [CrossRef]
- Schneiderman, J.; Schaefer, K.; Kolodgie, F.D.; Savion, N.; Kotev-Emeth, S.; Dardik, R.; Simon, A.J.; Halak, M.; Pariente, C.; Engelberg, I.; et al. Leptin locally synthesized in carotid atherosclerotic plaques could be associated with lesion instability and cerebral emboli. J. Am. Heart Assoc. 2012, 1, e001727. [Google Scholar] [CrossRef]
- Chiba, T.; Shinozaki, S.; Nakazawa, T.; Kawakami, A.; Ai, M.; Kaneko, E.; Kitagawa, M.; Kondo, K.; Chait, A.; Shimokado, K. Leptin deficiency suppresses progression of atherosclerosis in apoe-deficient mice. Atherosclerosis 2008, 196, 68–75. [Google Scholar] [CrossRef]
- Bodary, P.F.; Gu, S.; Shen, Y.; Hasty, A.H.; Buckler, J.M.; Eitzman, D.T. Recombinant leptin promotes atherosclerosis and thrombosis in apolipoprotein e-deficient mice. Arter. Thromb. Vasc. Biol. 2005, 25, e119–e122. [Google Scholar] [CrossRef] [PubMed]
- De Rango, P.; Farchioni, L.; Fiorucci, B.; Lenti, M. Diabetes and abdominal aortic aneurysms. Eur. J. Vasc. Endovasc. Surg. 2014, 47, 243–261. [Google Scholar] [CrossRef] [PubMed]
- Liu, H.; Shi, L.; Zeng, T.; Ji, Q.; Shi, Y.; Huang, Y.; Zhang, L.; Xiao, T.; Ye, J.; Lin, Y.; et al. Type 2 diabetes mellitus reduces clinical complications and mortality in stanford type b aortic dissection after thoracic endovascular aortic repair: A 3-year follow-up study. Life Sci. 2019, 230, 104–110. [Google Scholar] [CrossRef] [PubMed]
- Torsney, E.; Pirianov, G.; Cockerill, G.W. Diabetes as a negative risk factor for abdominal aortic aneurysm—Does the disease aetiology or the treatment provide the mechanism of protection? Curr. Vasc. Pharmacol. 2013, 11, 293–298. [Google Scholar] [CrossRef]
- Armstrong, P.J.; Johanning, J.M.; Calton, W.C., Jr.; Delatore, J.R.; Franklin, D.P.; Han, D.C.; Carey, D.J.; Elmore, J.R. Differential gene expression in human abdominal aorta: Aneurysmal versus occlusive disease. J. Vasc. Surg. 2002, 35, 346–355. [Google Scholar] [CrossRef] [PubMed]
- Biros, E.; Gabel, G.; Moran, C.S.; Schreurs, C.; Lindeman, J.H.; Walker, P.J.; Nataatmadja, M.; West, M.; Holdt, L.M.; Hinterseher, I.; et al. Differential gene expression in human abdominal aortic aneurysm and aortic occlusive disease. Oncotarget 2015, 6, 12984–12996. [Google Scholar] [CrossRef]
- Butt, H.Z.; Sylvius, N.; Salem, M.K.; Wild, J.B.; Dattani, N.; Sayers, R.D.; Bown, M.J. Microarray-based gene expression profiling of abdominal aortic aneurysm. Eur. J. Vasc. Endovasc. Surg. 2016, 52, 47–55. [Google Scholar] [CrossRef]
- Lenk, G.M.; Tromp, G.; Weinsheimer, S.; Gatalica, Z.; Berguer, R.; Kuivaniemi, H. Whole genome expression profiling reveals a significant role for immune function in human abdominal aortic aneurysms. BMC Genom. 2007, 8, 237. [Google Scholar] [CrossRef]
- Peshkova, I.O.; Schaefer, G.; Koltsova, E.K. Atherosclerosis and aortic aneurysm—Is inflammation a common denominator? FEBS J. 2016, 283, 1636–1652. [Google Scholar] [CrossRef]
- Fukuda, H.; Aoki, H.; Yoshida, S.; Tobinaga, S.; Otsuka, H.; Shojima, T.; Takagi, K.; Fukumoto, Y.; Akashi, H.; Kato, S.; et al. Characterization of smad2 activation in human thoracic aortic aneurysm. Ann. Vasc. Dis. 2018, 11, 112–119. [Google Scholar] [CrossRef]
- Kostina, A.; Bjork, H.; Ignatieva, E.; Irtyuga, O.; Uspensky, V.; Semenova, D.; Maleki, S.; Tomilin, A.; Moiseeva, O.; Franco-Cereceda, A.; et al. Notch, bmp and wnt/beta-catenin network is impaired in endothelial cells of the patients with thoracic aortic aneurysm. Atheroscler Suppl. 2018, 35, e6–e13. [Google Scholar] [CrossRef] [PubMed]
- Renard, M.; Callewaert, B.; Baetens, M.; Campens, L.; MacDermot, K.; Fryns, J.P.; Bonduelle, M.; Dietz, H.C.; Gaspar, I.M.; Cavaco, D.; et al. Novel myh11 and acta2 mutations reveal a role for enhanced tgfbeta signaling in ftaad. Int. J. Cardiol. 2013, 165, 314–321. [Google Scholar] [CrossRef] [PubMed]
- Chen, X.; Rateri, D.L.; Howatt, D.A.; Balakrishnan, A.; Moorleghen, J.J.; Cassis, L.A.; Daugherty, A. Tgf-beta neutralization enhances angii-induced aortic rupture and aneurysm in both thoracic and abdominal regions. PLoS ONE 2016, 11, e0153811. [Google Scholar]
- Wang, Y.; Ait-Oufella, H.; Herbin, O.; Bonnin, P.; Ramkhelawon, B.; Taleb, S.; Huang, J.; Offenstadt, G.; Combadiere, C.; Renia, L.; et al. Tgf-beta activity protects against inflammatory aortic aneurysm progression and complications in angiotensin ii-infused mice. J. Clin. Investig. 2010, 120, 422–432. [Google Scholar] [CrossRef]
- Angelov, S.N.; Hu, J.H.; Wei, H.; Airhart, N.; Shi, M.; Dichek, D.A. Tgf-beta (transforming growth factor-beta) signaling protects the thoracic and abdominal aorta from angiotensin ii-induced pathology by distinct mechanisms. Arter. Thromb Vasc. Biol. 2017, 37, 2102–2113. [Google Scholar] [CrossRef]
- Biros, E.; Walker, P.J.; Nataatmadja, M.; West, M.; Golledge, J. Downregulation of transforming growth factor, beta receptor 2 and notch signaling pathway in human abdominal aortic aneurysm. Atherosclerosis 2012, 221, 383–386. [Google Scholar] [CrossRef]
- Gillis, E.; Van Laer, L.; Loeys, B.L. Genetics of thoracic aortic aneurysm: At the crossroad of transforming growth factor-beta signaling and vascular smooth muscle cell contractility. Circ. Res. 2013, 113, 327–340. [Google Scholar] [CrossRef]
- Akhurst, R.J.; Hata, A. Targeting the tgfbeta signalling pathway in disease. Nat. Rev. Drug Discov. 2012, 11, 790–811. [Google Scholar] [CrossRef]
- Karkhanis, S.; Patil, S.; Hoey, E.T.; Ganeshan, A. The prevalence and significance of thoracic findings in patients undergoing extended coverage computed tomography for assessment of abdominal aortic aneurysms. Br. J. Radiol. 2016, 89, 20150723. [Google Scholar] [CrossRef] [Green Version]
- DeFreitas, M.R.; Quint, L.E.; Watcharotone, K.; Nan, B.; Ranella, M.J.; Hider, J.R.; Liu, P.S.; Williams, D.M.; Eliason, J.L.; Patel, H.J. Evaluation for abdominal aortic aneurysms is justified in patients with thoracic aortic aneurysms. Int J. Cardiovasc Imaging 2016, 32, 647–653. [Google Scholar] [CrossRef]
- Sorelius, K.; Budtz-Lilly, J.; Mani, K.; Wanhainen, A. Systematic review of the management of mycotic aortic aneurysms. Eur. J. Vasc Endovasc. Surg. 2019, 58, 426–435. [Google Scholar] [CrossRef] [PubMed]
- Kojima, Y.; Werner, N.; Ye, J.; Nanda, V.; Tsao, N.; Wang, Y.; Flores, A.M.; Miller, C.L.; Weissman, I.; Deng, H.; et al. Proefferocytic therapy promotes transforming growth factor-beta signaling and prevents aneurysm formation. Circulation 2018, 137, 750–753. [Google Scholar] [CrossRef] [PubMed]
- Lareyre, F.; Clement, M.; Raffort, J.; Pohlod, S.; Patel, M.; Esposito, B.; Master, L.; Finigan, A.; Vandestienne, M.; Stergiopulos, N.; et al. Tgfbeta (transforming growth factor-beta) blockade induces a human-like disease in a nondissecting mouse model of abdominal aortic aneurysm. Arter. Thromb. Vasc. Biol. 2017, 37, 2171–2181. [Google Scholar] [CrossRef] [PubMed]
- Wang, Y.; Krishna, S.; Walker, P.J.; Norman, P.; Golledge, J. Transforming growth factor-beta and abdominal aortic aneurysms. Cardiovasc. Pathol. 2013, 22, 126–132. [Google Scholar] [CrossRef] [PubMed]


| Fw seq | Rev seq | |
|---|---|---|
| β-Actin | CTCCCTGGAGAAGAGCTACG | GAAGGAAGGCTGGAAGAGTG |
| Hprt | TGACACTGGCAAAACAATGCA | GGTCCTTTTCACCAGCAAGCT |
| COL11a1 | ACAATAGCACAGACGGAGGC | GGATTTGGCTCATTTGTCCCAG |
| AdipoQ | GTGATGGCAGAGATGGCACC | ACTCCGGTTTCACCGATGTC |
| Cxcl13 | CGAATTCAAATCTTGCCCCGT | ACTTGTTCTTCTTCCAGACTATGA |
| Slca5 | TCATCATCCGGCCTTCATCG | AGCAGCAGCACGCAGAG |
| Fdc-sp | GGCTGTTGGTTTCCCAGTCTC | TGGTGGAAGTGGGCGAAATG |
| Characteristic | AAA (n = 12) | AOD (n = 7) | p-Value |
|---|---|---|---|
| Male gender—n (%) | 11 (92) | 2 (29) | 0.0095 |
| Age—(y, mean ± SD) | 68 ± 6.7 | 56 ± 5.7 | 0.001 |
| Diabetes mellitus—n (%) | 0 (0) | 1 (14) | 0.3684 |
| Ischemic heart disease—n (%) | 2 (17) | 1 (14) | 1 |
| Renal insufficiency—n (%) | 4 (33) | 1 (14) | 0.6027 |
| Hypertension—n (%) | 9 (75) | 5 (71) | 1 |
| Dyslipidemia—n (%) | 9 (75) | 6 (86) | 1 |
| Current smoking—n (%) | 6 (50) | 4 (57) | 1 |
| Ever smoking—n (%) | 4 (33) | 3 (43) | 1 |
| Gene Symbol | Entrez Gene Name | Fold Change | p-Value | Location | Type(s) | Vascular Gene Set |
|---|---|---|---|---|---|---|
| CXCL13 | chemokine (C-X-C motif) ligand 13 | 32.269 | 1.12 × 10⁻⁴ | Extracellular Space | Cytokine | YES |
| COL11A1 | collagen, type XI, alpha 1 | 27.046 | 5.29 × 10⁻⁵ | Extracellular Space | Other | YES |
| SAA2 | serum amyloid A2 | 24.96 | 3.95 × 10⁻⁷ | Extracellular Space | Other | NO |
| ADIPOQ | adiponectin, C1Q and collagen domain containing | 21.454 | 3.01 × 10⁻⁴ | Extracellular Space | Other | YES |
| FDCSP | follicular dendritic cell secreted protein | 21.38 | 1.01 × 10⁻⁴ | Extracellular Space | Other | NO |
| POU2AF1 | POU class 2 associating factor 1 | 18.842 | 4.79 × 10⁻⁴ | Nucleus | transcription regulator | NO |
| MS4A1 | membrane-spanning 4-domains, subfamily A, member 1 | 18.414 | 2.61 × 10⁻⁴ | Plasma Membrane | Other | YES |
| MZB1 | marginal zone B and B1 cell-specific protein | 17.072 | 1.26 × 10⁻³ | Extracellular Space | Other | NO |
| SLC7A5 | solute carrier family 7 (amino acid transporter light chain, L system), member 5 | 15.716 | 5.37 × 10⁻⁷ | Plasma Membrane | Transporter | YES |
| LEP | leptin | 14.288 | 1.94 × 10⁻⁶ | Extracellular Space | growth factor | YES |
| MARCO | macrophage receptor with collagenous structure | 13.563 | 4.12 × 10⁻⁴ | Plasma Membrane | transmembrane receptor | YES |
| LPL | lipoprotein lipase | 12.984 | 3.51 × 10⁻⁵ | Cytoplasm | Enzyme | YES |
| IL1RN | interleukin 1 receptor antagonist | 12.873 | 1.16 × 10⁻³ | Extracellular Space | Cytokine | YES |
| IGLL5 | immunoglobulin lambda-like polypeptide 1 | 12.848 | 9.73 × 10⁻⁴ | Plasma Membrane | Other | NO |
| CR2 | complement component (3d/Epstein Barr virus) receptor 2 | 12.123 | 1.13 × 10⁻³ | Plasma Membrane | transmembrane receptor | NO |
| KIAA1199 | KIAA1199 | 12.122 | 1.60 × 10⁻³ | Cytoplasm | Other | YES |
| TREM1 | triggering receptor expressed on myeloid cells 1 | 11.851 | 4.33 × 10⁻⁴ | Plasma Membrane | transmembrane receptor | YES |
| P2RX5 | purinergic receptor P2X, ligand-gated ion channel, 5 | 11.706 | 8.53 × 10⁻⁵ | Plasma Membrane | ion channel | NO |
| HMOX1 | heme oxygenase (decycling) 1 | 10.932 | 5.47 × 10⁻⁵ | Cytoplasm | Enzyme | YES |
| IGLJ3 | immunoglobulin lambda joining 3 | 10.776 | 7.29 × 10⁻³ | Other | Other | NO |
| IGH | immunoglobulin heavy locus | 10.257 | 4.24 × 10⁻⁴ | Other | Other | NO |
| ISG20 | interferon stimulated exonuclease gene 20kDa | 10.238 | 1.31 × 10⁻⁵ | Nucleus | Enzyme | NO |
| CCL18 | chemokine (C-C motif) ligand 18 (pulmonary and activation-regulated) | 10.164 | 1.51 × 10⁻⁴ | Extracellular Space | Cytokine | YES |
| CD79A | CD79a molecule, immunoglobulin-associated alpha | 10.064 | 1.97 × 10⁻⁴ | Plasma Membrane | transmembrane receptor | NO |
| FNDC1 | fibronectin type III domain containing 1 | 10.028 | 2.80 × 10⁻⁴ | Plasma Membrane | Other | YES |
| TIMD4 | T-cell immunoglobulin and mucin domain containing 4 | 9.859 | 2.59 × 10⁻³ | Plasma Membrane | Other | NO |
| PIM2 | pim-2 oncogene | 9.838 | 2.35 × 10⁻⁴ | Other | Kinase | YES |
| CXCL5 | chemokine (C-X-C motif) ligand 5 | 9.659 | 2.76 × 10⁻⁴ | Extracellular Space | Cytokine | YES |
| FCRL5 | Fc receptor-like 5 | 9.596 | 2.49 × 10⁻³ | Other | Other | NO |
| CXCL3 | chemokine (C-X-C motif) ligand 3 | 9.526 | 3.06 × 10⁻⁶ | Extracellular Space | Cytokine | YES |
| Gene | Function and Relation to AAA or Atherosclerosis | FC | p-Value | Location | Vascular Gene Set |
|---|---|---|---|---|---|
| CXCL13 C-X-C motif chemokine 13 | Selective chemotactic for B cells (B-1 and B-2 subsets), by interacting with chemokine receptor CXCR5. Control of B cell organization within follicles of lymphoid tissues [25,26,27]. High levels of CXCL13 are found in aneurysm and in atherosclerotic lesions | 32.26 | 1.12 × 10⁻⁴ | Extracellular space | YES |
| COL11A1 Collagen alpha-1(XI) chain | Adds structure and strength to connective tissues supporting muscles, joints, organs, and skin. Col11a1 protein levels are upregulated in TAA and AAA tissue [23,28,29]. | 27.05 | 5.29 × 10⁻⁵ | Extracellular space | YES |
| SAA2 Serum amyloid A protein | Production primarily in liver, circulates in low levels in the blood. Although its function is not fully understood, serum amyloid A appears to play a role in the immune system. Different biomarker studies have shown association of SAA with atherosclerotic disease. Patients with atherosclerotic disease show increased levels of Amyloid A protein [30,31,32,33]. | 24.96 | 3.95 × 10⁻⁷ | Extracellular space | NO |
| ADIPOQ Adiponectin | Involved in the control of fat metabolism and insulin sensitivity, with direct anti-diabetic, anti-atherogenic and anti-inflammatory activities. Stimulates AMPK phosphorylation and activation in liver and skeletal muscle, enhancing glucose utilization and fatty-acid combustion. Negatively regulates TNF-alpha expression in various tissues such as liver and macrophages. Inhibits endothelial NFκB signaling through a cAMP-dependent pathway. Adiponectin is dysregulated in aneurysm and atherosclerotic disease [34,35,36]. | 21.45 | 3.01 × 10⁻⁴ | Extracellular space | YES |
| FDCSP follicular dendritic cell-secreted protein | FDCSP bind to the surface of B-lymphoma cells. Functions as a secreted mediator acting upon B-cells. No direct associations of FDCSP with atherosclerotic disease or AAA are described in literature [37,38]. | 21.38 | 1.01 × 10⁻⁴ | Extracellular space | NO |
| POU2AF1 POU domain class 2-associating factor 1 | Transcriptional coactivator that specifically associates with either OCT1 or OCT2. It boosts the OCT1 mediated promoter activity and to a lesser extent that of OCT2. Essential for the response of B-cells to antigens and required for the formation of germinal centers. Little is known about this factor in AAA, though in carotid plaque formation analysis it is shown that POU2AF1 is upregulated, which is related to the immune and inflammatory processes linked to atherosclerosis [39,40]. | 18.84 | 4.79 ×10⁻⁴ | Nucleus | NO |
| MS4A1 membrane-spanning 4A/CD20 | B-lymphocyte surface molecule which plays a role in the development and differentiation of B-cells into plasma cells. B-lymphocytes with MS4A1 expressed are found in aneurysm and atherosclerotic [41,42,43,44]. | 18.41 | 2.61 × 10⁻⁴ | Plasma membrane | YES |
| MZB1 Marginal zone B and B1 cell-specific protein | Associates with immunoglobulin M (IgM) heavy and light chains and promotes IgM assembly and secretion. Acts as a hormone-regulated adipokine/ proinflammatory cytokine implicated in causing chronic inflammation, affecting cellular expansion and blunting insulin response in adipocytes. No direct association of MZB1 with atherosclerotic disease or AAA are described in literature [45]. | 17.07 | 1.26 × 10⁻³ | Extracellular space | NO |
| SLC7A5 Solute carrier family 7 member 5 | Encodes for a protein called y+L amino acid transporter 1 (y+LAT-1). Involved in transport of amino acids, namely lysine, arginine, and ornithine. The y+LAT-1 protein forms one part (the light subunit) of a complex called the heterodimeric cationic amino acid transporter, responsible for binding to the amino acids that are transported. There is no direct association of SLC7A5 with atherosclerotic disease or AAA described in the literature [46]. | 15.72 | 5.37 × 10⁻⁷ | Plasma membrane | YES |
| LEP Leptin | Hormone involved in the regulation of body weight. As fat accumulates in cells, more leptin is produced, indicating that fat stores are increasing. Increased leptin levels are associated with atherosclerotic disease. Furthermore, in an AAA animal model mRNA and protein levels of leptin were found to be upregulated in aneurysmatic tissue [47,48,49,50,51]. | 14.29 | 1.94 × 10⁻⁶ | Extracellular space | YES |
| Upstream Regulator | Activation z-Score | p-Value of overlap | FC | Molecule Type | Predicted Activation State | Target Molecules in Dataset |
|---|---|---|---|---|---|---|
| IL1B | 7.3 | 9 × 10⁻²⁷ | 6.7 | cytokine | Activated | ABCG2,ACTA2,ADAM8,ADM,AIF1,AMPD3,ANGPT1,ANGPTL4,APOB,APOE,ARC,ARG1,BCL2A1,BCL3,BGN,BIRC3,BMP4,CCL3,CCL5,CCR1,CCR5,CCR6,CCR7,CCRL2,CD14,CD4,CD44,CD83,CD86,CEBPB,CEBPD,CFLAR,CHI3L1,COL10A1,CREM,CSF2RB,CSF3,CTSB,CTSS,CTSZ,CX3CL1,CXCL1,CXCL2,CXCL3,CXCL5,CXCR4,CYBA,CYBB,CYSLTR1,CYTIP,DAB2,DDIT4,DUSP5,EDN1,ENPP1,ERBB2,ESR1,F2RL1,FABP5,FAM129A,FCGR2B,FGF2,FOSL1,FST,G0S2,GAD1,GADD45B,GBP1,GCH1,GLA,GM2A,HAS1,HEY2,HGF,HIF1A,HK2,HMGA1,HMOX1,HSD11B1,IBSP,ICAM1,IER3,IGFBP5,IGFBP6,IL10,IL10RA,IL16,IL18,IL18R1,IL18RAP,IL1B,IL1R2,IL1RN,IL33,IL6,IL6R,IL8,IRAK1,IRF1,IRF7,ISG20,ITGAM,LCP1,LEP,LIF,MCL1,MMP1,MMP12,MMP3,MMP9,MYEF2,MYH11,NAMPT,NFIL3,NR4A3,OCLN,OLR1,OSM,PCDH7,PDE4B,PIM1,PLAT,PLAU,PRKCD,PTGS1,PTGS2,PTP4A1,PTX3,RAC2,REL,RUNX2,S100A8,S100A9,SAA2,SCUBE2,SDC1,SERPINB9,SERPINE1,SLAMF1,SLC12A1,SLC14A1,SLC1A3,SLC20A1,SOD2,SPP1,SRGN,STAT4,STMN2,TAC1,TACR1,THBS1,THRSP,THY1,TLR2,TLR3,TLR8,TMEM176B,TNFAIP3,TNFRSF11A,TNFRSF1B,TREM1,TREM2,TYMP,UAP1,UGCG,VDR,VEGFA,XYLT1,ZC3H12A |
| CEBPA | 4.9 | 1 × 10⁻²⁰ | 3.1 | transcription regulator | Activated | ACSL1,ADCY7,ADH1B,ADIPOQ,AGT,ALOX5AP,ANPEP,APOB,ARG1,ARL4C,BCL2A1,BTG1,C3AR1,CCR1,CD14,CD19,CD3G,CEBPA,CEBPB,CEBPD,CHI3L1,COL10A1,CSF1R,CSF3,CSF3R,CXCR4,DDX21,DGAT2,EFNB2,EMCN,FABP4,FASN,FCAR,FHL1,G0S2,GABPB1,GAS1,GATA6,GBP1,GCH1,GLRX,HCAR3,HGF,HMOX1,HSD11B1,ICAM1,IER3,IL10,IL1RN,IL6,IL6R,IL8,ITGAL,ITGAM,ITGAX,LCK,LEP,LPL,LST1,LTF,MALT1,MNDA,NFATC2,NFIL3,OLR1,PAX5,PCK1,PFN2,PGD,PLIN2,PPP1R3C,PTAFR,PTGS1,PTGS2,PTPN3,PTPRC,PTPRE,PTX3,RGS2,RUNX2,RUNX3,S100A8,S100A9,SCD,SEMA3E,SERPINE1,SMPDL3A,SOD2,SPP1,TAC1,TBXAS1,THRB,TRIB1,VDR,VLDLR |
| IL6 | 4.6 | 3 × 10⁻¹⁹ | 4.0 | cytokine | Activated | ABCA1,ABCG2,ACP5,AGT,ANPEP,APOB,APOE,ARG1,ARL4C,BATF,BCL2L11,BCL3,BGN,C5AR1,CCL5,CCR1,CCR5,CCR6,CCR7,CD14,CD163,CD209,CD36,CD48,CD53,CD68,CD79A,CD83,CD86,CDKN2B,CEBPA,CEBPB,CEBPD,CFLAR,CLU,CSF2RB,CSF3R,CXCL1,CXCL13,CXCL2,CXCL3,CXCL5,CXCR4,CYBB,CYTIP,EZH2,GADD45B,GLRX,GSTA4,GZMB,HGF,HIF1A,HLA-DQA1,HMOX1,ICAM1,ICAM3,ICOS,IGFBP5,IGFBP6,IGHM,IGJ,IL10,IL1RN,IL6,IL6R,IL7R,IL8,IRF1,IRF4,ITGAM,JAK1,JAK2,KIAA0101,KLRB1,KRT14,LEFTY2,LEP,LIF,LPL,LRG1,LRP6,LTF,LY86,MCL1,MERTK,MMP1,MMP12,MMP3,MMP9,MRVI1,MSR1,NAMPT,NCF2,PIM1,PLAT,PLAU,PRF1,PROK2,PTGS2,PTPRC,PTTG1,RAB27A,RNASE6,RRM2,S100A9,SAA2,SEMA4A,SERPINA1,SERPINE1,SGK1,SLC14A1,SLC7A7,SNX10,SOD2,SPP1,SRA1,STAT4,TAC1,TBXAS1,THBS1,THRSP,TLR1,TLR10,TLR2,TLR3,TLR8,TNFRSF11A,TNFRSF17,TNFRSF1B,TOP2A,VEGFA,VLDLR,XBP1 |
| IL18 | 4.4 | 4 × 10⁻¹¹ | 2.6 | cytokine | Activated | ADIPOQ,CCL3,CCL5,CCR5,CCR7,CD44,CD69,CD83,CD86,CFLAR,CXCL16,CXCL3,GADD45B,GZMB,HAVCR2,ICAM1,IL10,IL12RB1,IL18,IL18R1,IL1B,IL6,IL8,INPP5D,IRF1,ITGAM,KLRC4-KLRK1/KLRK1,MMP1,MMP3,MMP9,PRF1,PTGS2,SELL,SPP1,TACR1,TXK,VEGFA |
| IRF7 | 4.3 | 2 × 10⁻³ | 2.6 | transcription regulator | Activated | CCL5,CCRL2,CD69,CTLA4,FAM26F,GBP1,GBP5,IRF1,IRF7,IRF8,ISG20,ITGAM,ITGAX,JAK2,MCL1,MX2,NAMPT,PELI1,PLAC8,PMAIP1,S100A8,TLR8,TMBIM6,TNFAIP8,ZBP1,ZC3HAV1 |
| TLR2 | 4.1 | 9 × 10⁻⁹ | 4.3 | transmembrane receptor | Activated | ARG1,CCL5,CCR1,CCR5,CD69,CD86,CEBPB,CEBPD,CSF3,CXCL2,CXCL3,CYLD,GRIN2A,GZMB,HLA-DQA1,HMOX1,ICAM1,IL10,IL18,IL1B,IL1RN,IL6,IL8,IRAK1,IRF1,ITGA4,LEP,MMP1,MMP9,PTGS2,TREM1,VDR,XBP1 |
| CEBPB | 4.0 | 3 × 10⁻¹² | 2.4 | transcription regulator | Activated | ACTA2,ADIPOQ,AGT,ALDH1A1,ALOX5AP,APOB,ARG1,BCL2A1,BLNK,CCL3,CCL5,CCR5,CD14,CDKN2B,CEBPA,CEBPB,CEBPD,CIRBP,COL10A1,CSF1R,CSF3,CSF3R,CXCL2,CXCL3,CXCL5,DAB2,DGAT2,EFNB2,EMCN,FABP4,FBLN1,FCAR,FHL1,GAS1,HGF,HSD11B1,ICAM1,IER3,IGKC,IL10,IL11RA,IL1B,IL1RN,IL6,IL8,ITGAL,LCP2,LEP,LYN,MBP,MGP,MMP1,MMP3,MSR1,NFATC2,NFKBID,PCK1,PLAUR,PRKCD,PTGS1,PTGS2,RAC2,RUNX2,SAA2,SAT1,SCD,SEMA3E,SERPINA1,SERPINE1,SGK1,SPP1,TAC1,TLR8,TMEM176B,TRIB3,UPP1,VDR,VLDLR,XIST |
| CCL5 | 3.9 | 2 × 10⁻⁸ | 2.4 | cytokine | Activated | C5AR1,CCL3,CCL5,CCR1,CCR5,CCRL2,CD163,CD44,CXCL2,CXCL3,EMP1,F2RL1,HMGA1,IL1B,IL6,IL8,MMP19,MMP9,NAMPT,OLR1,PLAUR,PNP,PPIF,SGK1 |
| OSM | 3.8 | 3 × 10⁻¹³ | 6.1 | cytokine | Activated | ABCA1,ABCG1,ADAM17,ADH5,AMPD3,AQP9,ARG1,ARHGEF12,ARL4C,BHLHE40,BTC,CALB2,CCL5,CEBPA,CEBPD,CH25H,CHD1,CPM,CSF3,CTSL,CXADR,CXCL1,CXCL13,CXCL2,CXCL3,CXCL5,CYP4F3,DNAJC3,DSC2,ECM2,FGF2,FOXC1,GAB1,GBP1,GLUL,GRIN2A,HGF,HIF1A,HK2,HMOX1,HOXA9,HSD11B1,ICAM1,IGFBP6,IL10,IL18,IL1B,IL1R2,IL33,IL6,IL6R,IL8,IRAK1,IRF1,IRF7,ISG20,ITGAL,JAG1,LIF,LRRFIP1,MAP2,MARCKS,MICA,MLLT11,MMP1,MMP3,MMP9,MYEF2,MYH10,NAMPT,NEDD4,NELL2,NOTCH3,NUAK1,OSM,P2RY10,PDPN,PFKFB3,PLAU,PRDM1,PTP4A1,PTPN21,S100A12,S100A8,S100A9,S100P,SEL1L,SERPINA1,SERPINE1,SLC16A3,SLC16A6,SOST,STK4,STX11,TLR2,TLR3,TMBIM6,TNC,TNFRSF11A,TOP2A,TPM1,TYMP,UAP1,VDR,VEGFA,ZBTB43,ZC3HAV1 |
| XBP1 | 3.8 | 5 × 10⁻⁴ | 3.3 | transcription regulator | Activated | COL10A1,CXCL2,DERL1,DNAJB9,DNAJC3,EDEM1,ERO1LB,ESR1,ETS1,FASN,FKBP11,FKBP7,HMOX1,HSPA13,ICAM1,IL6,IL8,IRF4,NCF1,PDIA4,POU2AF1,PRDM1,RUNX2,SDF2L1,SEC11C,SEC24D,SEC61A1,SERPINA1,SPCS3,SRPRB,SSR4,STARD5,TXNDC11,TXNDC5 |
| SELPLG | 3.7 | 5 × 10⁻⁷ | 3.5 | other | Activated | BCL2A1,CCL3,CXCL2,CXCR4,HCAR3,HCK,IL10,IL1B,IL1R2,IL8,ITGAM,PLAUR,PRKCD,SERPINB9 |
| STAT4 | 3.6 | 3 × 10⁻⁶ | 3.1 | transcription regulator | Activated | ACADL,ACAP1,ARMCX1,BCL2L11,BCL3,CCR5,CXCL2,CXCL3,ERO1L,FCER1G,FYB,GRTP1,IER3,IL10,IL10RA,IL12RB1,IL18R1,IL18RAP,IL6,IRF1,IRF4,ISG20,ITGA7,KDM6B,LRRFIP1,MAP3K1,MGARP,PCGF5,PDK1,PLAC8,PRDM16,RASL12,RGCC,SAT1,SELENBP1,SELPLG,SERPINE1,SLC2A3,SMPDL3A,STC2,TPD52,VEGFA,VLDLR |
| CD2 | 3.6 | 8 × 10⁻⁵ | 2.9 | transmembrane receptor | Activated | CCR7,CD4,CD44,CD48,CD86,CD8A,HLA-DPA1,ICAM1,IL10,ITGAL,PTPRC,SELL,STAT4 |
| CD44 | 3.6 | 2 × 10⁻⁹ | 2.5 | enzyme | Activated | ADAM8,ARHGEF12,BCAM,BGN,BIRC3,CCL5,CCR5,CCR7,CD36,CD44,CD69,CD8A,CIDEC,CLEC7A,CX3CL1,CXADR,ERBB2,FASN,IL10,IL1B,IL1R2,IL1RN,IL6,ITGA4,ITGAX,LIMS2,LTBP1,MCL1,MMP12,MMP3,MMP9,NPNT,PLAU,SELL,SMAD1,SPP1,THBS1,THY1,TLR8,TNFRSF11A,TPM2,WNT2 |
| TYROBP | 3.4 | 1 × 10⁻⁶ | 2.6 | transmembrane receptor | Activated | CCL3,CCR7,CD69,CD83,CD86,FCGR2B,ICAM1,IL6,IL8,ITGAX,NOD2,TYROBP |
| POU2AF1 | 3.3 | 9 × 10⁻¹¹ | 18.8 | transcription regulator | Activated | CCND3,CCR5,CD79A,CD79B,IDH2,IGH,IGHA1,IGHG1,IGHM,IGK,KCNN4,LCK,MS4A6A,PAX5,PRDM1,RBP1,SDS,SPIB,SPP1 |
| TREM1 | 3.3 | 2 × 10⁻¹⁵ | 11.9 | transmembrane receptor | Activated | ABL2,AREG/AREGB,ATP1B1,CCL18,CCL3,CCL5,CCRL2,CD14,CD86,CDKN2B,CEBPB,CKS2,CRTAM,CXCL1,CXCL2,CXCL3,CXCL5,DUSP14,DUSP4,EDN1,FOSL1,GADD45B,GCLM,GLA,HAS1,HS3ST3B1,IL10,IL1B,IL6,IL6R,IL8,IRF1,ITGAX,KANK1,LAMP3,LIF,LPL,LY9,MAFF,MCOLN2,MLF1IP,MMP1,MMP19,NOD2,NRIP3,PIM2,PLAC8,PLCXD1,PTGS2,RGS1,SCG5,SFMBT2,SLAMF7,SLC1A3,SPP1,TARP,THBS1,TLR2,TNFSF15 |
| PLAU | 3.3 | 7 × 10⁻⁶ | 4.2 | peptidase | Activated | ABCG1,ARG1,C5AR1,CCL5,CCR5,CXCL3,HGF,ICAM1,IL1B,IL6,MMP1,MMP12,MMP9,PLAU,PLAUR,S100A8,S100A9,SERPINE1 |
| ETS1 | 3.3 | 2 × 10⁻¹⁵ | 2.9 | transcription regulator | Activated | ANPEP,ARL4C,ATP2A3,BCL11A,BMP4,CD14,CD27,CD79A,CD79B,CRTAM,CSF1R,ERBB2,ETS1,FCGR2A,FOXD1,GZMB,GZMK,HCST,HGF,HMOX1,HPSE,HSPA6,HSPB8,ICAM1,IL10,IL2RB,INSIG1,ITGB2,ITK,JAK1,KLRC4-KLRK1/KLRK1,LAIR1,LCK,LTB,MCL1,MMP1,MMP3,MMP9,MSR1,NCF1,NFIL3,NPR1,PLAU,PRF1,RUNX2,RUNX3,SELL,SERPINE1,SLAMF6,SPP1,SRGN,TBXAS1,TGFA,THY1,TRPC1,VEGFA,WAS,ZAP70,ZEB1 |
| NFATC2 | 3.3 | 2 × 10⁻⁶ | 2.5 | transcription regulator | Activated | ABCA1,ACP5,BATF,CD3G,CFLAR,CTLA4,CXCL3,DAB2,E2F5,EDN1,ICOS,IKZF1,IL10,IL18,IRF1,IRF4,IRF7,ISG20,MERTK,NFATC1,PELI1,PLAT,PLK2,PPP3R1,PTGS2,PTPN1,REL,RGS1,RGS2,RILPL1,TLR3,TNFSF8 |
| VEGFA | 3.3 | 5 × 10⁻⁶ | 2.1 | growth factor | Activated | ACSL1,ADH5,ANPEP,BCL2A1,BTK,CCRL2,CD34,CTSB,CTSS,CXCR4,DUSP4,DUSP5,EFNB2,ETS1,FABP4,FGF2,GBP1,GRIA2,HMOX1,ICAM1,IGFBP5,IL6,IL8,INPP5D,MCL1,MEOX2,MMP1,MMP12,MMP9,NME1,OCLN,PIM1,PLAT,PLAU,PTGS1,PTGS2,RUNX2,SCO2,SERPINE1,SNCG,SOD2,THBS1,VEGFA |
| MAP3K1 | 3.2 | 6 × 10⁻⁴ | 2.0 | kinase | Activated | BIRC3,CSTA,HMOX1,IL8,MMP3,PGR,PLAU,PLAUR,PTGS2,SERPINE1,THBS1,TNC,TOP2A,TPH1 |
| C5AR1 | 3.1 | 8 × 10⁻⁷ | 4.8 | G-protein coupled receptor | Activated | C5AR1,CD28,CD86,CSF3,CXCL2,FCER1G,FCGR2A,FCGR2B,IL1B,IL6,IL8,SERPINE1 |
| IL6R | 3.1 | 1 × 10⁻⁸ | 2.9 | transmembrane receptor | Activated | CCL3,CCL5,CD36,CXCL2,CXCL3,CXCL5,ICAM1,ICAM3,IGFBP5,IL10,IL6,IL8,IRF1,MCL1,MMP3,MMP9,NAMPT,PTGS2,TAC1,TNFRSF11A,VEGFA |
| IL17RA | 3.1 | 1 × 10⁻⁶ | 2.2 | transmembrane receptor | Activated | CCR1,CSF3,CSF3R,CXCL2,CXCL3,CXCR2,IL1B,IL6,IL8,MMP3,S100A8,S100A9 |
| PLAUR | 3.0 | 1 × 10⁻³ | 7.1 | transmembrane receptor | Activated | C5AR1,CCL5,CTSB,CXCL3,CYBB,ITGAM,MMP3,MMP9,PLAU,PLAUR |
| CD14 | 3.0 | 1 × 10⁻⁴ | 3.0 | transmembrane receptor | Activated | BCL2A1,CCL3,CCL5,CXCL2,CXCR2,IL10,IL10RA,IL1B,IL6,IL8,PTGS2,TLR2,TNFAIP3 |
| ICAM1 | 2.9 | 9 × 10⁻⁶ | 2.4 | transmembrane receptor | Activated | ACTA2,CCL5,CD69,CD86,CXCL2,CXCL3,ICAM1,IL1B,IL6,ITGA4,ITGAL,MMP9,VEGFA |
| SAMSN1 | 2.8 | 4 × 10⁻⁵ | 4.7 | other | Activated | BATF,CXCL2,DAB2,EDN1,IL18,IL6,IRF1,IRF7,ISG20,MARCO,MERTK,PELI1,PLAT,PTGS2,RGCC,RILPL1,SDC1,TLR3,TNFSF8,XBP1,ZC3H12A |
| NAMPT | 2.8 | 2 × 10⁻⁶ | 3.5 | cytokine | Activated | CXCL1,CXCL2,IL6,IL8,MMP1,MMP3,MMP9,NAMPT,NELL2,NPY1R,TMSB15A |
| Inflammatory Marker. | Number | Total | Aortic Aneurysmal Disease | Arterial Occlusive Disease | p-Value |
|---|---|---|---|---|---|
| triglyceride (mmol/L) | 1307 | 1.61 [1.16–2.27] | 1.58 [1.13–2.19] | 1.63 [1.18–2.34] | 0.053 |
| high-density lipoprotein (mmol/L) | 1314 | 1.20 [0.97–1.46] | 1.18 [0.97–1.42] | 0.97 [1.20–1.48] | 0.275 |
| low-density lipoprotein (mmol/L) | 1297 | 2.72 [2.04–3.47] | 2.83 [2.13–3.53] | 2.59 [1.95–3.41] | 0.003 |
| hs-CRP (mg/L) [IQR] | 919 | 3.42 [1.63–6.00] | 4.00 [2.00–6.01] | 3.00 [1.39–5.48] | 0.002 |
© 2019 by the authors. Licensee MDPI, Basel, Switzerland. This article is an open access article distributed under the terms and conditions of the Creative Commons Attribution (CC BY) license (http://creativecommons.org/licenses/by/4.0/).
Share and Cite
IJpma, A.; te Riet, L.; van de Luijtgaarden, K.M.; van Heijningen, P.M.; Burger, J.; Majoor-Krakauer, D.; Rouwet, E.V.; Essers, J.; Verhagen, H.J.M.; van der Pluijm, I. Inflammation and TGF-β Signaling Differ between Abdominal Aneurysms and Occlusive Disease. J. Cardiovasc. Dev. Dis. 2019, 6, 38. https://doi.org/10.3390/jcdd6040038
IJpma A, te Riet L, van de Luijtgaarden KM, van Heijningen PM, Burger J, Majoor-Krakauer D, Rouwet EV, Essers J, Verhagen HJM, van der Pluijm I. Inflammation and TGF-β Signaling Differ between Abdominal Aneurysms and Occlusive Disease. Journal of Cardiovascular Development and Disease. 2019; 6(4):38. https://doi.org/10.3390/jcdd6040038
Chicago/Turabian StyleIJpma, A., L. te Riet, K. M. van de Luijtgaarden, P. M. van Heijningen, J. Burger, D. Majoor-Krakauer, E. V. Rouwet, J. Essers, H. J. M. Verhagen, and I. van der Pluijm. 2019. "Inflammation and TGF-β Signaling Differ between Abdominal Aneurysms and Occlusive Disease" Journal of Cardiovascular Development and Disease 6, no. 4: 38. https://doi.org/10.3390/jcdd6040038