
The Relationship between Postexercise Hypotension and Heart Rate Variability before and after Exercise Training

 , , , ,
Abstract
:1. Introduction
2. Methods
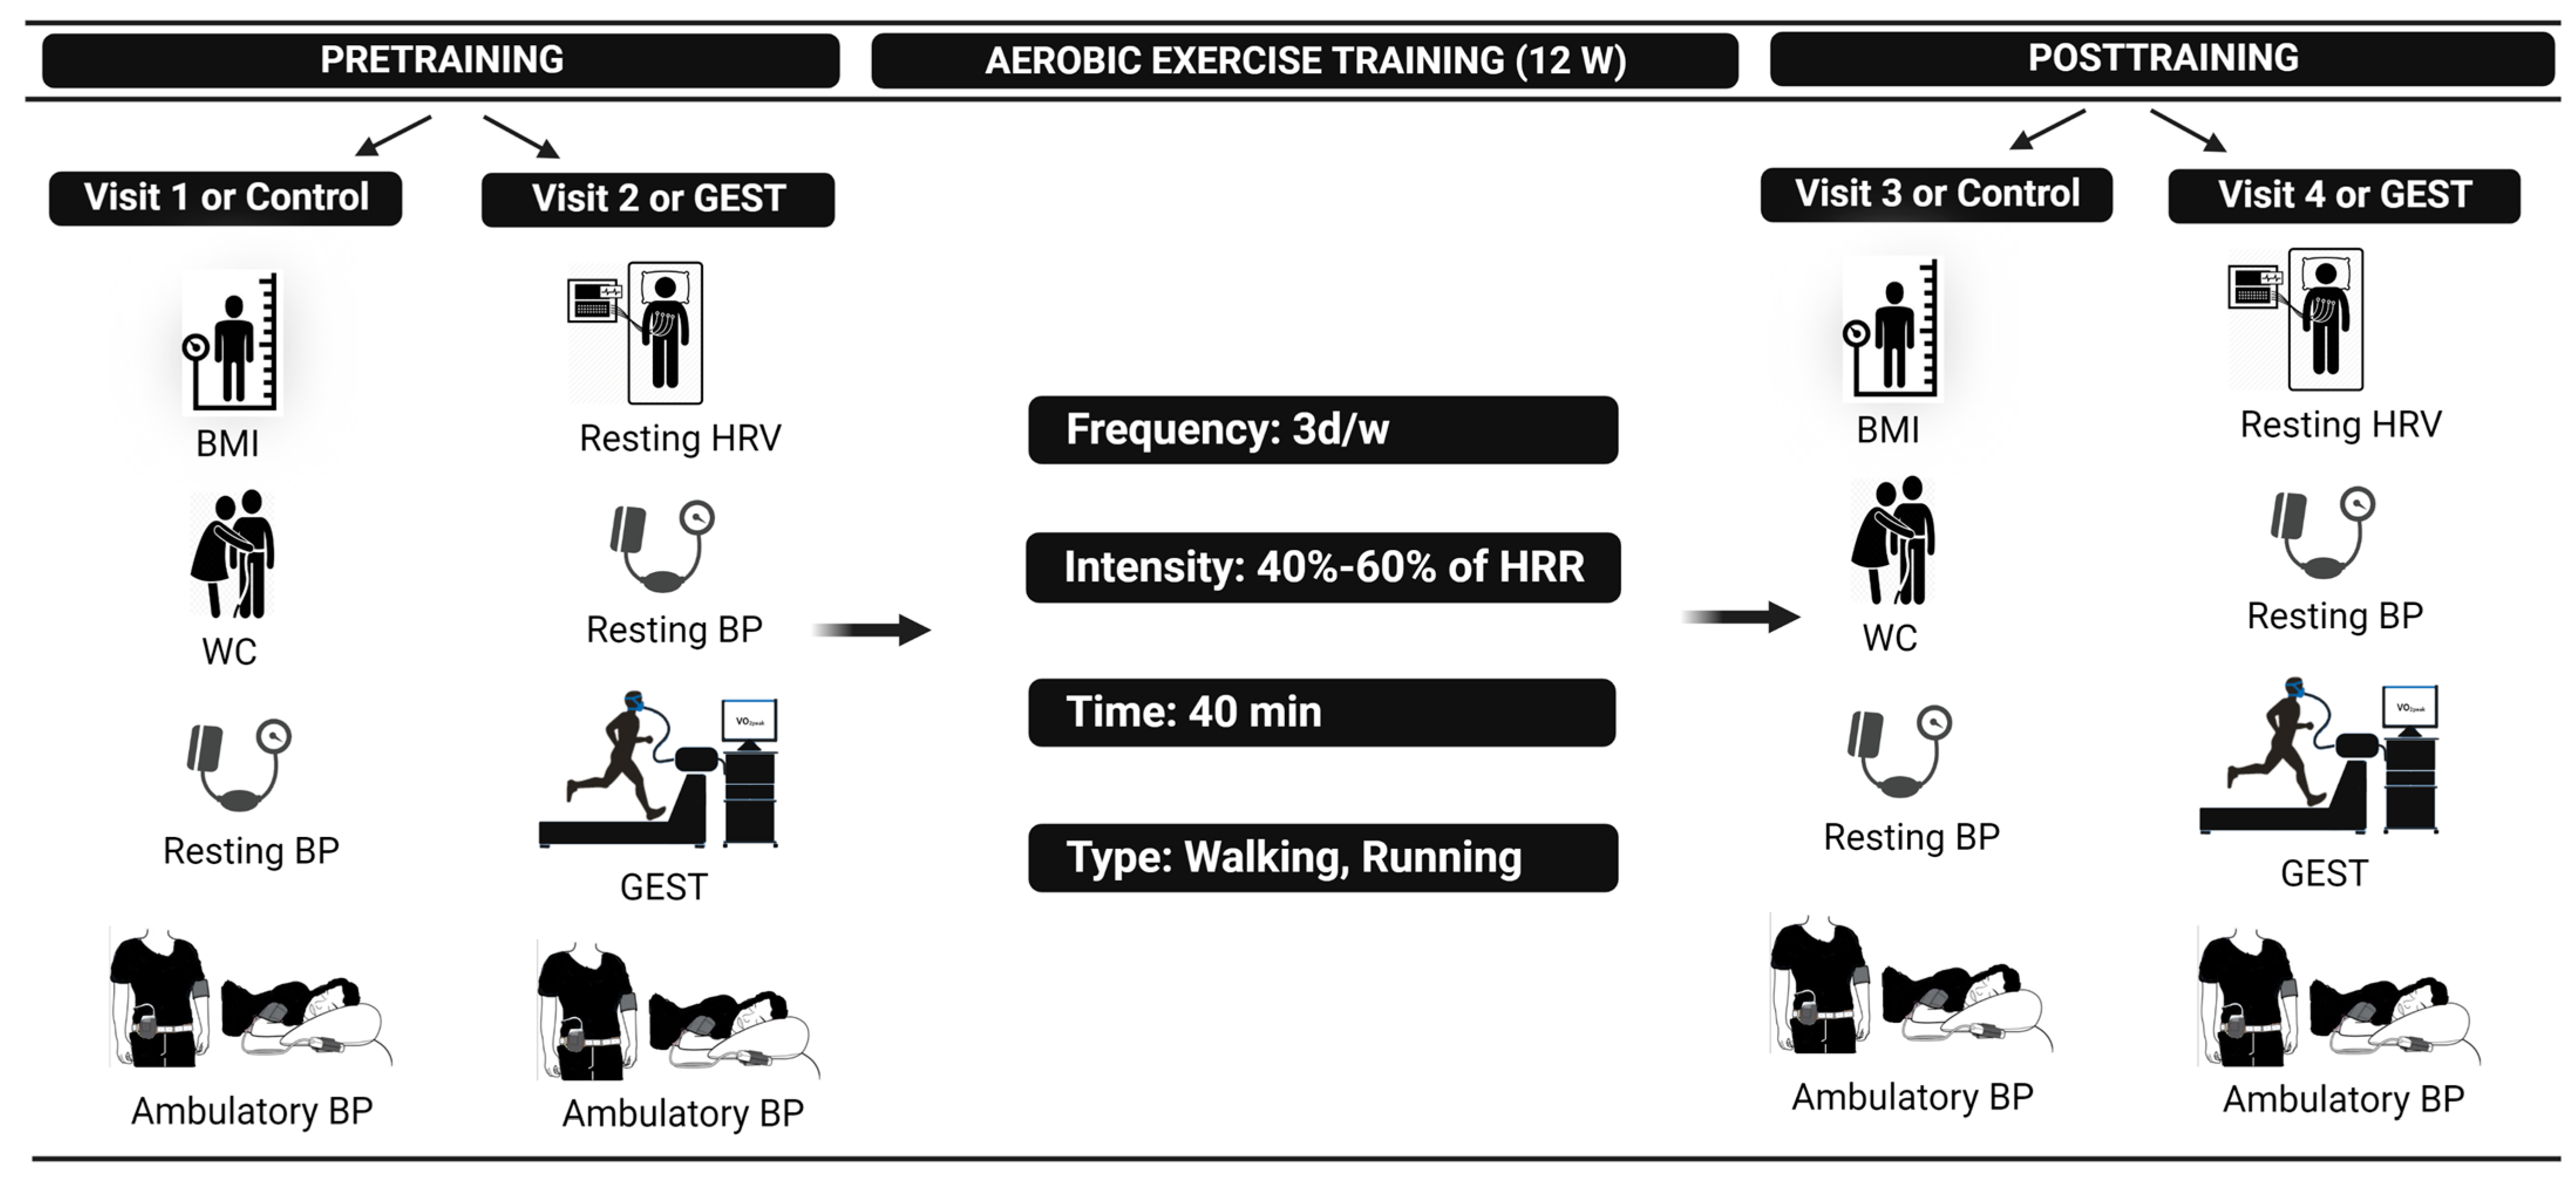
2.1. Study Overview
2.2. Study Procedures
2.2.1. Control Visits 1 and 3
2.2.2. Graded Cardiopulmonary Exercise Stress Test Visits 2 and 4
2.2.3. Exercise Training
2.3. Statistical Analysis
3. Results
3.1. Exercise Training Program
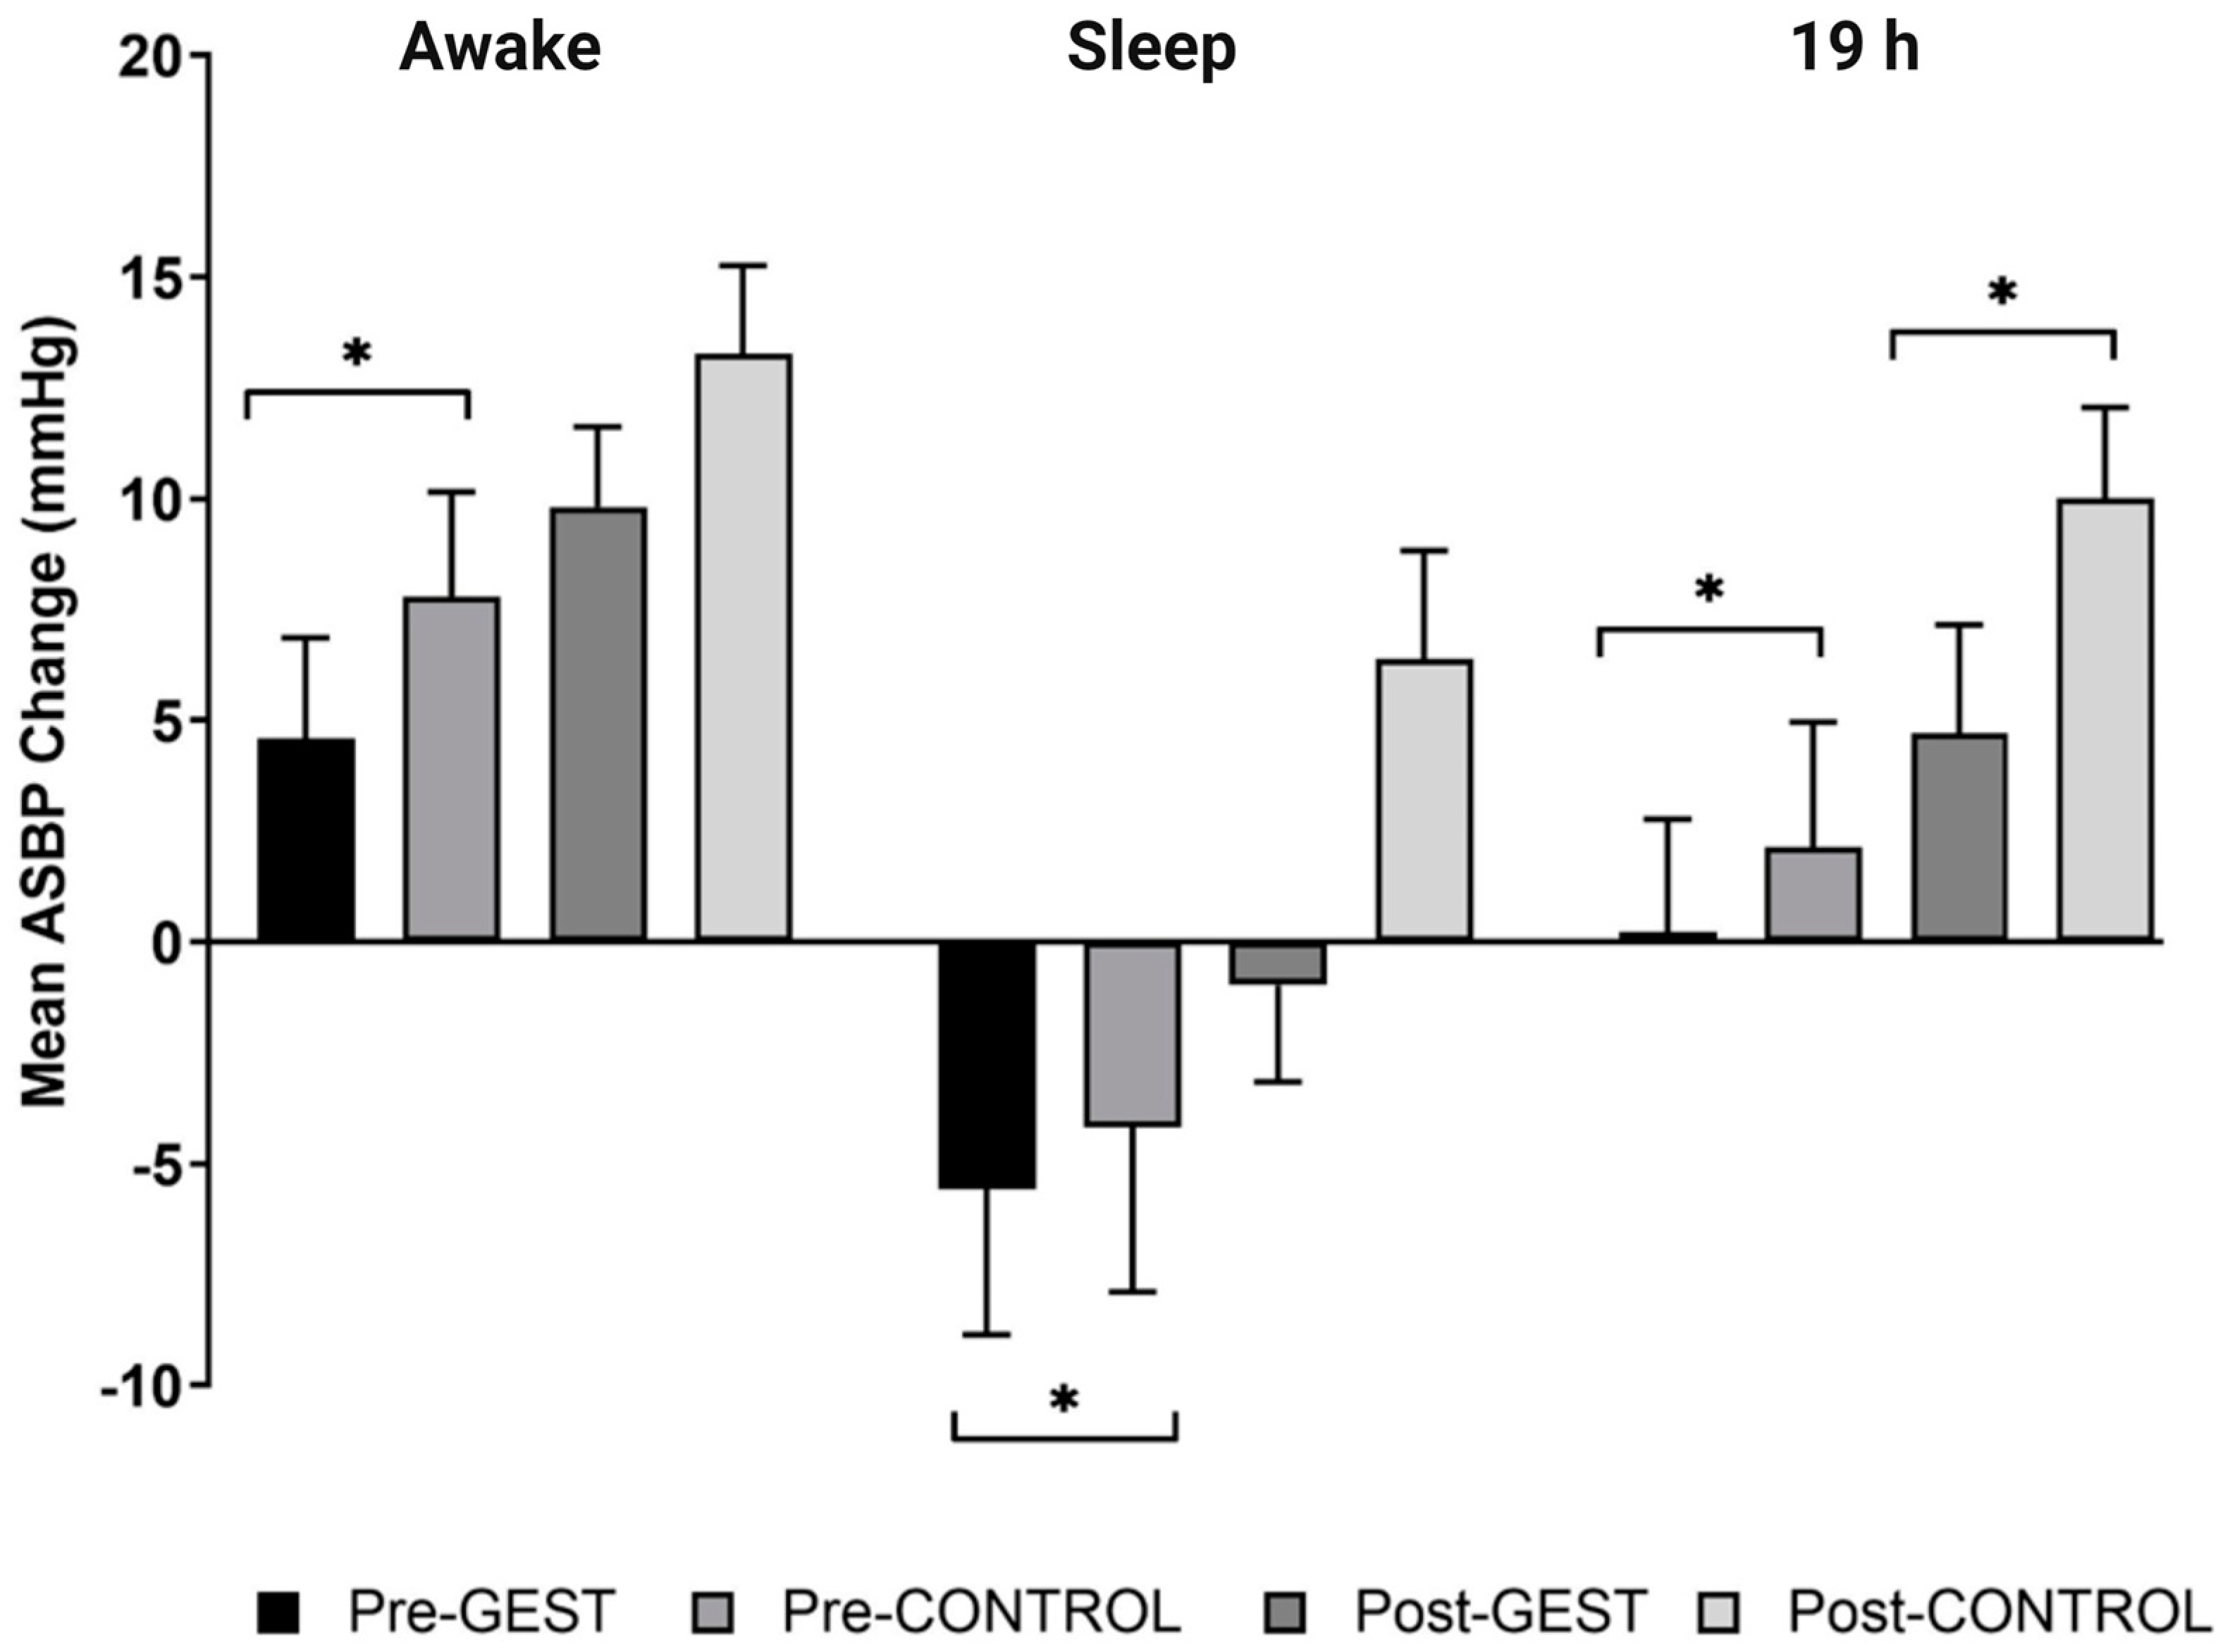
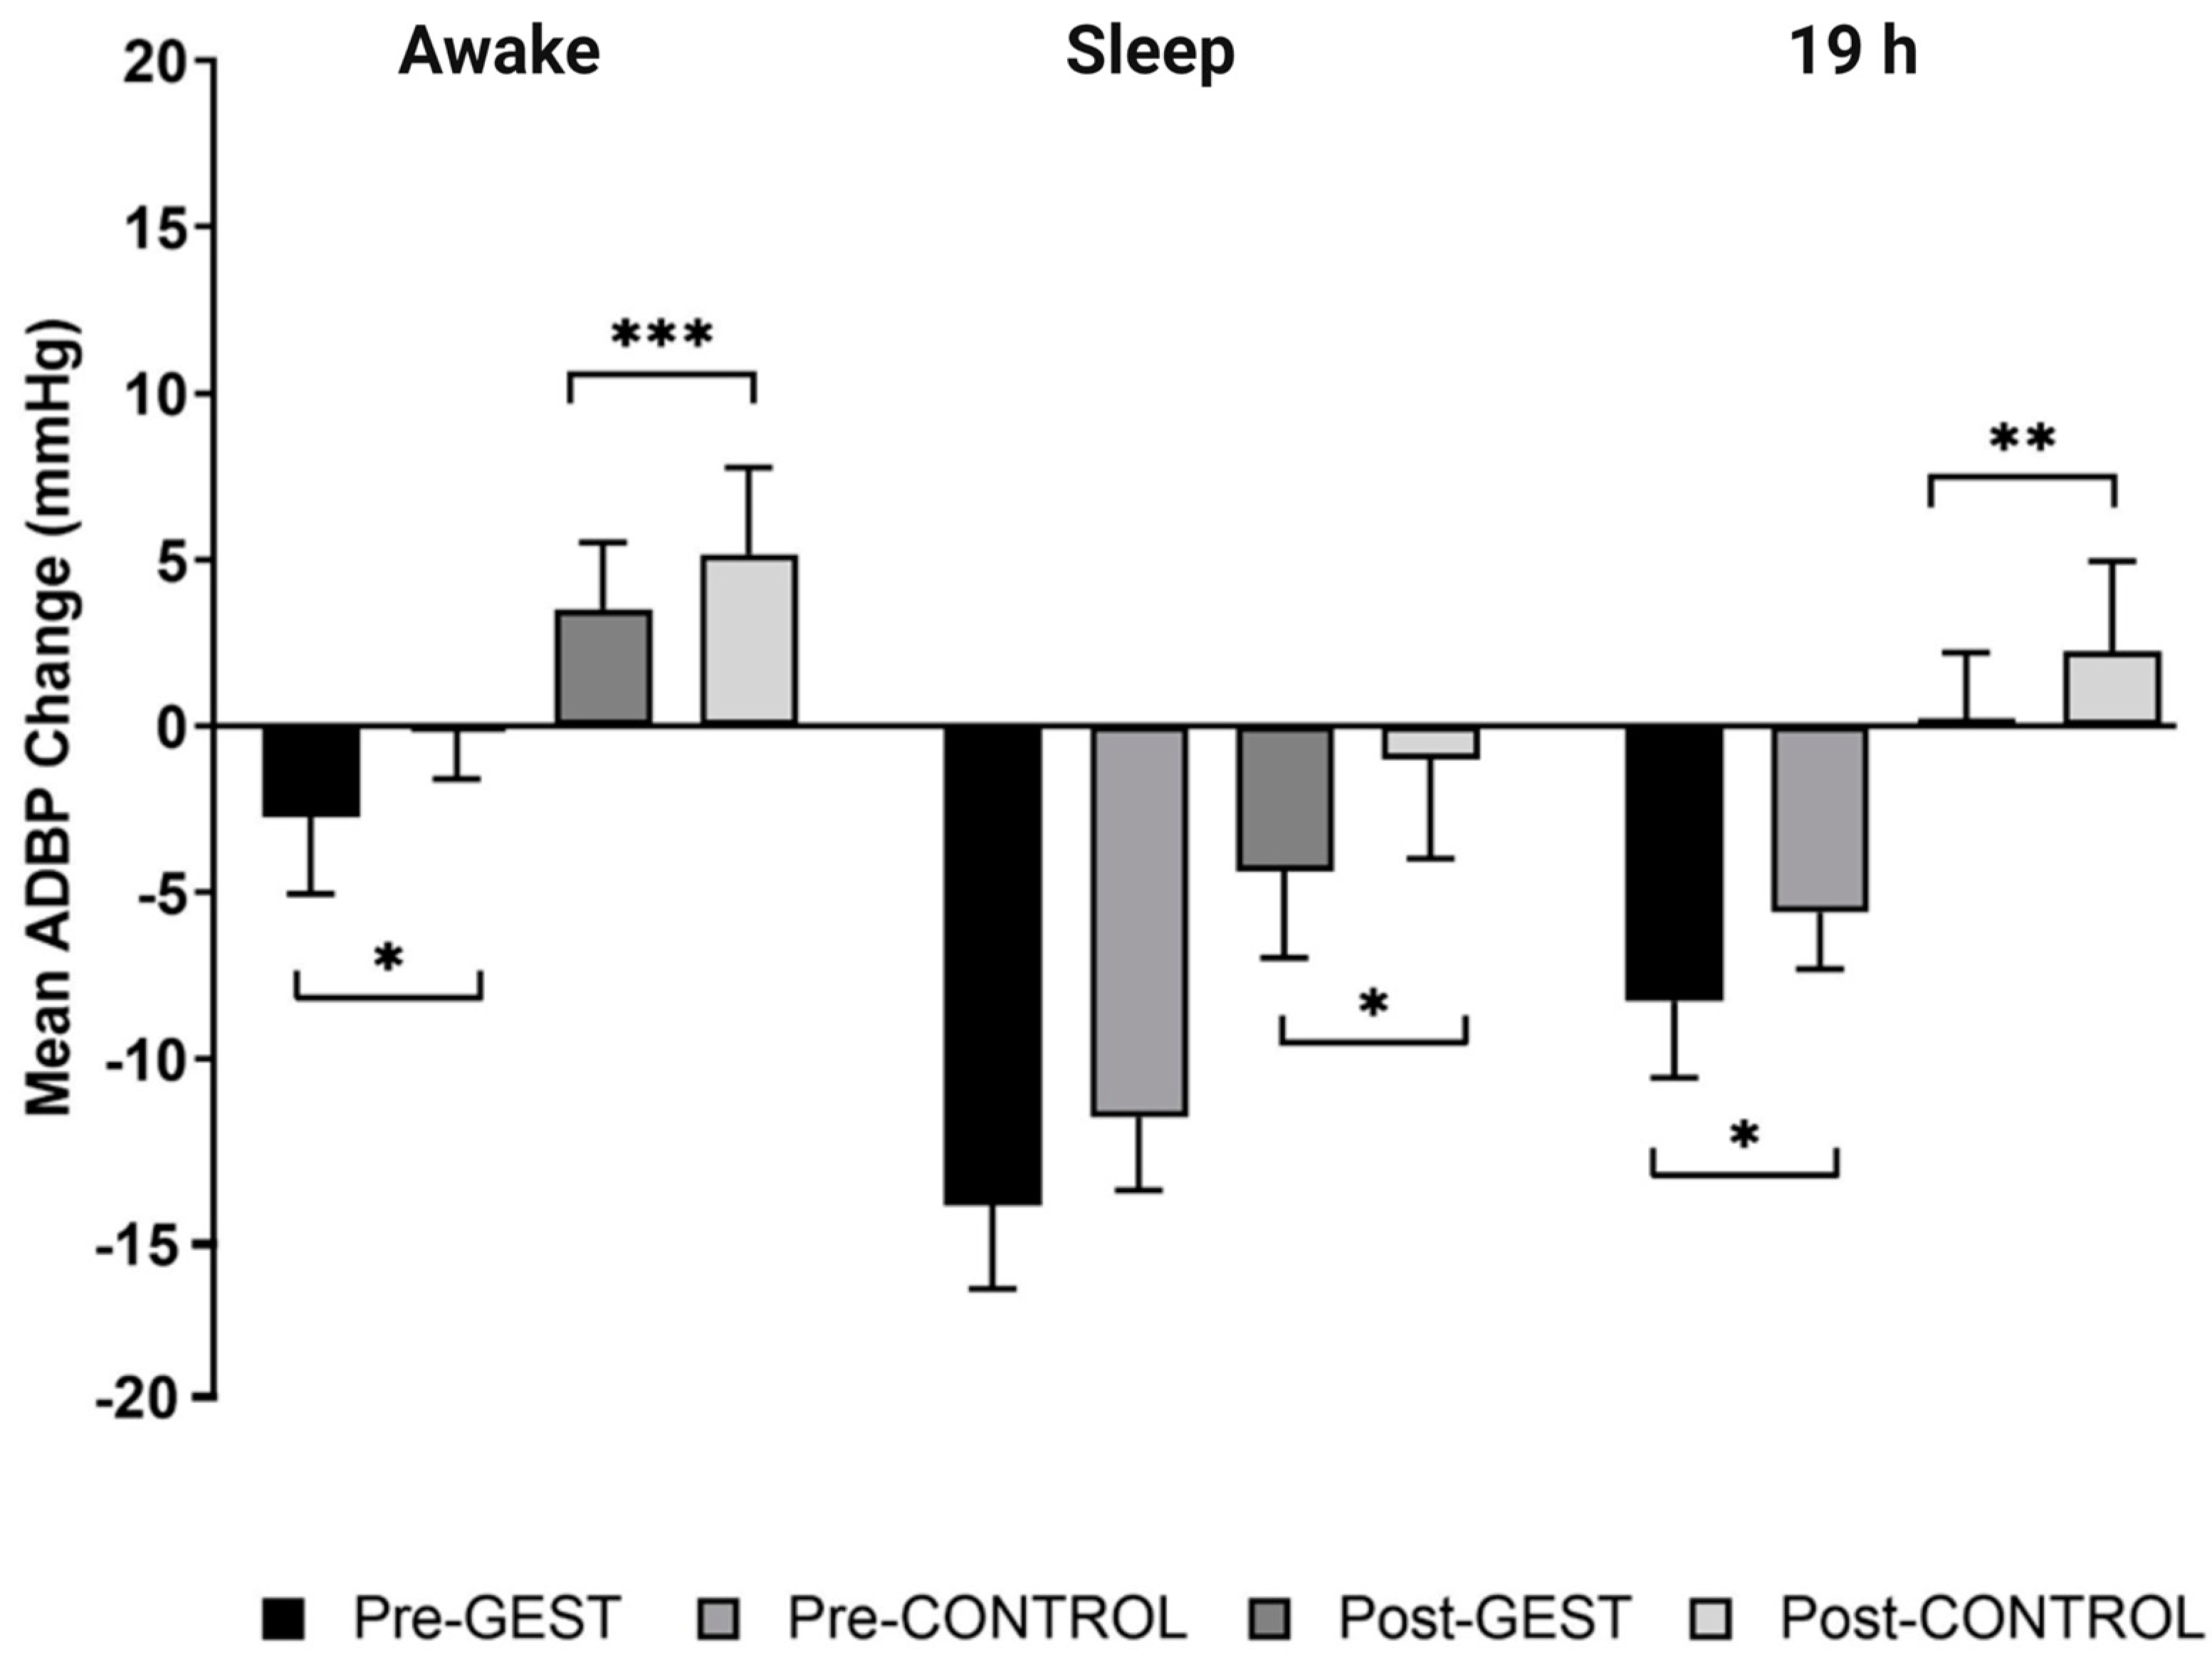
3.2. The Blood Pressure Response after GEST versus CONTROL (i.e., PEH)
3.2.1. Pretraining
3.2.2. Post-Training
3.3. The Ambulatory Blood Pressure Response to the GEST versus CONTROL (i.e., PEH) after versus before Training
3.4. The Ambulatory Blood Pressure Response to Exercise Training
3.5. The Resting Blood Pressure Response to Exercise Training
3.6. The Resting Heart Rate Variability Response to Exercise Training
3.7. Relationship between the Ambulatory Blood Pressure Response to the GEST versus CONTROL (i.e., PEH) and Resting Heart Rate Variability before and after Exercise Training
3.7.1. Correlates of the ASBP and ADBP Responses to the GEST versus CONTROL (i.e., PEH) before Training over Awake, Sleep, and 19 h
3.7.2. Correlates of the ASBP and ADBP Responses to the GEST versus CONTROL (i.e., PEH) after Training over Awake, Sleep, and 19 h
3.8. Correlates of the Blood Pressure Response to Exercise Training
4. Discussion
Supplementary Materials
Author Contributions
Funding
Institutional Review Board Statement
Informed Consent Statement
Data Availability Statement
Acknowledgments
Conflicts of Interest
References
- Benjamin, E.J.; Virani, S.S.; Callaway, C.W.; Chamberlain, A.M.; Chang, A.R.; Cheng, S.; Chiuve, S.E.; Cushman, M.; Delling, F.N.; Deo, R.; et al. Heart disease and stroke statistics—2018 update: A report from the American Heart Association. Circulation 2018, 137, 67–492. [Google Scholar]
- Tsao, C.W.; Aday, A.W.; Almarzooq, Z.I.; Alonso, A.; Beaton, A.Z.; Bittencourt, M.S.; Boehme, A.K.; Buxton, A.E.; Carson, A.P.; Commodore-Mensah, Y.; et al. Heart Disease and Stroke Statistics—2022 Update: A Report from the American Heart Association. Circulation 2022, 145, e153–e639. [Google Scholar] [CrossRef]
- Mills, K.T.; Bundy, J.D.; Kelly, T.N.; Reed, J.E.; Kearney, P.M.; Reynolds, K.; Chen, J.; He, J. Global disparities of hypertension prevalence and control: A systematic analysis of population-based studies from 90 countries. Circulation 2016, 134, 441–450. [Google Scholar] [CrossRef] [PubMed]
- Pescatello, L.S.; Wu, Y.; Panza, G.A.; Zaleski, A.; Guidry, M. Development of a Novel Clinical Decision Support System for Exercise Prescription among Patients with Multiple Cardiovascular Disease Risk Factors. MCP IQ&O 2021, 5, 193–203. [Google Scholar]
- Barone Gibbs, B.; Hivert, M.F.; Jerome, G.J.; Kraus, W.E.; Rosenkranz, S.K.; Schorr, E.N.; Spartano, N.L.; Lobelo, F.; American Heart Association Council on Lifestyle and Cardiometabolic Health; Council on Cardiovascular and Stroke Nursing; et al. Physical Activity as a Critical Component of First-Line Treatment for Elevated Blood Pressure or Cholesterol: Who, What, and How?: A Scientific Statement from the American Heart Association. Hypertension 2021, 78, 26–37. [Google Scholar] [CrossRef]
- Pescatello, L.S.; Riebe, D.; Thompson, P.D. ACSM’s Guidelines for Exercise Testing and Prescription, 9th ed.; Lippincott Williams & Wilkins: Philadelphia, PA, USA, 2014. [Google Scholar]
- Halliwill, J.R. Mechanisms and clinical implications of post-exercise hypotension in humans. Exerc. Sport Sci. Rev. 2001, 29, 65–70. [Google Scholar] [PubMed]
- Halliwill, J.R.; Buck, T.M.; Lacewell, A.N.; Romero, S.A. Postexercise hypotension and sustained postexercise vasodilatation: What happens after we exercise? Exp. Physiol. 2013, 98, 7–18. [Google Scholar] [CrossRef]
- Pescatello, L.S.; Kulikowich, J.M. The aftereffects of dynamic exercise on ambulatory blood pressure. Med. Sci. Sports Exerc. 2001, 33, 1855–1861. [Google Scholar] [CrossRef] [PubMed]
- Thompson, P.D.; Crouse, S.F.; Goodpaster, B.; Kelley, D.; Moyna, N.; Pescatello, L. The acute versus the chronic response to exercise. Med. Sci. Sports Exerc. 2001, 33 (Suppl. 6), S438–S453. [Google Scholar] [CrossRef]
- Hecksteden, A.; Grütters, T.; Meyer, T. Association between postexercise hypotension and long-term training-induced blood pressure reduction: A pilot study. Clin. J. Sport Med. 2013, 23, 58–63. [Google Scholar] [CrossRef]
- Kleinnibbelink, G.; Stens, N.A.; Fornasiero, A.; Speretta, G.F.; Van Dijk, A.P.; Low, D.A.; Oxborough, D.L.; Thijssen, D.H. The acute and chronic effects of high-intensity exercise in hypoxia on blood pressure and post-exercise hypotension: A randomized cross-over trial. Medicine 2020, 99, e22411. [Google Scholar] [CrossRef] [PubMed]
- Liu, S.; Goodman, J.; Nolan, R.; Lacombe, S.; Thomas, S.G. Blood pressure responses to acute and chronic exercise are related in prehypertension. Med. Sci. Sports Exerc. 2012, 44, 1644–1652. [Google Scholar] [CrossRef] [Green Version]
- Teixeira, L.; Ritti-Dias, R.M.; Tinucci, T.; Mion Júnior, D.; Forjaz, C.L. Post-concurrent exercise hemodynamics and cardiac autonomic modulation. Eur. J. Appl. Physiol. 2011, 111, 2069–2078. [Google Scholar] [CrossRef]
- Cilhoroz, B.; Zaleski, A.; Taylor, B.; Fernhall, B.; Chen, M.H.; Thompson, P.; Pescatello, L. The ambulatory blood pressure and heart rate variability responses following sudden vigorous physical exertion among firefighters with hypertension. Turk. J. Sports Med. 2021, 56, 98–105. [Google Scholar] [CrossRef]
- Grässler, B.; Thielmann, B.; Böckelmann, I.; Hökelmann, A. Effects of different training interventions on heart rate variability and cardiovascular health and risk factors in young and middle-aged adults: A systematic review. Front. Physiol. 2021, 12, 532. [Google Scholar] [CrossRef]
- Joyner, M.J.; Green, D.J. Exercise protects the cardiovascular system: Effects beyond traditional risk factors. J. Physiol. 2009, 587, 5551–5558. [Google Scholar] [CrossRef] [PubMed]
- Zaleski, A.L.; Taylor, B.A.; Park, C.L.; Santos, L.P.; Panza, G.; Kramarz, M.; McCormick, K.; Thompson, P.D.; Fernandez, A.B.; Chen, M.H.; et al. Using the immediate blood pressure benefits of exercise to improve exercise adherence among adults with hypertension: A randomized clinical trial. J. Hypertens. 2019, 37, 1877–1888. [Google Scholar] [CrossRef]
- Cilhoroz, B.; Giles, D.; Zaleski, A.; Taylor, B.; Fernhall, B.; Pescatello, L. Validation of the Polar V800 heart rate monitor and comparison of artifact correction methods among adults with hypertension. PLoS ONE 2020, 15, e0240220. [Google Scholar] [CrossRef]
- Balke, B.; Ware, R.W. The Present Status of Physical Fitness in the Air Force. Proj. Rep. USAF Sch. Aviat. Med. 1959, 59, 1–9. [Google Scholar]
- Borg, G. Perceived exertion as an indicator of somatic stress. Scand. J. Rehabil. Med. 1970, 2, 92–98. [Google Scholar]
- McAuley, E.; Poag, K.; Gleason, A.; Wraith, S. Attrition from exercise programs: Attributional and affective perspectives. Soc. Behav. Personal. 1990, 5, 591. [Google Scholar]
- Wong, G.W.; Wright, J.M. Blood pressure lowering efficacy of nonselective beta-blockers for primary hypertension. Cochrane Database Syst. Rev. 2014. [Google Scholar] [CrossRef]
- Zanchetti, A.; Thomopoulos, C.; Parati, G. Randomized controlled trials of blood pressure lowering in hypertension: A critical reappraisal. Circ. Res. 2015, 116, 1058–1073. [Google Scholar] [CrossRef]
- Fang, S.C.; Wu, Y.L.; Tsai, P.S. Heart rate variability and risk of all-cause death and cardiovascular events in patients with cardiovascular disease: A meta-analysis of cohort studies. Biol. Res. Nurs. 2020, 22, 45–56. [Google Scholar] [CrossRef]
- Zhou, B.; Perel, P.; Mensah, G.A.; Ezzati, M. Global epidemiology, health burden and effective interventions for elevated blood pressure and hypertension. Nat. Rev. Cardiol. 2021, 18, 785–802. [Google Scholar] [CrossRef] [PubMed]
- Pescatello, L.S.; Guidry, M.A.; Blanchard, B.E.; Kerr, A.; Taylor, A.L.; Johnson, A.N.; Maresh, C.M.; Rodriguez, N.; Thompson, P.D. Exercise intensity alters postexercise hypotension. J. Hypertens. 2004, 22, 1881–1888. [Google Scholar] [CrossRef] [PubMed]
- Southard, D.R.; Hart, L. The influence on blood pressure during daily activities of a single session of aerobic exercise. Behav. Med. 1991, 17, 135–142. [Google Scholar] [CrossRef]
- Hagberg, J.M.; Montain, S.J.; Martin, W.H., 3rd. Blood pressure and hemodynamic responses after exercise in older hypertensives. J. Appl. Physiol. 1987, 63, 270–276. [Google Scholar] [CrossRef]
- Kaufman, F.L.; Hughson, R.L.; Schaman, J.P. Effect of exercise on recovery blood pressure in normotensive and hypertensive subjects. Med. Sci. Sports Exerc. 1987, 19, 17–20. [Google Scholar] [CrossRef]
- Grant, C.C.; Janse van Rensburg, D.C. The contribution of preintervention blood pressure, VO2max, BMI, autonomic function and gender to exercise-induced changes in heart rate variability. Br. J. Sports Med. 2013, 47, 575–578. [Google Scholar] [CrossRef]
- Cornelissen, V.A.; Verheyden, B.; Aubert, A.E.; Fagard, R.H. Effects of aerobic training intensity on resting, exercise and post-exercise blood pressure, heart rate and heart-rate variability. J. Hum. Hypertens. 2010, 24, 175–182. [Google Scholar] [CrossRef] [PubMed]
- Cunha, R.M.; Costa, A.M.; Silva, C.N.F.; Póvoa, T.I.R.; Pescatello, L.S.; Lehnen, A.M. Postexercise hypotension after aquatic exercise in older women with hypertension: A randomized crossover clinical trial. Am. J. Hypertens. 2018, 31, 247–252. [Google Scholar] [CrossRef] [PubMed]
- Halliwill, J.R.; Taylor, J.A.; Eckberg, D.L. Impaired sympathetic vascular regulation in humans after acute dynamic exercise. J. Physiol. 1996, 495, 279–288. [Google Scholar] [CrossRef] [PubMed]
- Jones, P.P.; Shapiro, L.F.; Keisling, G.A.; Jordan, J.; Shannon, J.R.; Quaife, R.A.; Seals, D.R. Altered autonomic support of arterial blood pressure with age in healthy men. Circulation 2001, 104, 2424–2429. [Google Scholar] [CrossRef]
- Pescatello, L.S.; MacDonald, H.V.; Lamberti, L.; Johnson, B.T. Exercise for hypertension: A prescription update integrating existing recommendations with emerging research. Curr. Hypertens. Rep. 2015, 17, 87. [Google Scholar] [CrossRef] [PubMed] [Green Version]
- Pescatello, L.S.; MacDonald, H.V.; Ash, G.I.; Lamberti, L.M.; Farquhar, W.B.; Arena, R.; Johnson, B.T. Assessing the existing professional exercise recommendations for hypertension: A review and recommendations for future research priorities. Mayo Clin. Proc. 2015, 90, 801–812. [Google Scholar] [CrossRef] [Green Version]


| Variables | Values |
|---|---|
| Age (year) | 51.9 ± 2.8 |
| Sex (% men) | 50% |
| Race (Caucasian/African American/Asian) | 15/1/2 |
| Waist circumference (cm) | 102.9 ± 2.8 |
| Body mass index (kg/m2) | 29.4 ± 0.9 |
| Systolic blood pressure (mmHg) | 135.3 ± 2.7 |
| Diastolic blood pressure (mmHg) | 85.8 ± 1.7 |
| Heart Rate (bpm) | 76.3 ± 2.5 |
| Duration of hypertension (year) | 6.0 ± 1.3 |
| Medication use (%) | 50% |
| VO2peak (mL/kg·min−1) | 27.3 ± 1.6 |
| Time | Pretraining n = (18) | Post-Training n = (18) | Post-Pretraining n = (18) | p |
|---|---|---|---|---|
| Awake | −3.2 ± 2.1 | −3.5 ± 2.2 | −0.3 ± 2.9 | 0.874 |
| Sleep | −1.4 ± 3.4 | −7.4 ± 3.0 | −6.0 ± 3.7 | 0.567 |
| 19 h | −2.3 ± 2.4 | −5.3 ± 2.2 | −3.0 ± 2.8 | 0.630 |
| Awake | −2.5 ± 1.5 | −1.7 ± 2.5 | 0.9 ± 3.0 | 0.002 |
| Sleep | −2.9 ± 1.7 | −3.4 ± 2.7 | −0.5 ± 3.2 | 0.081 |
| 19 h | −2.7 ± 1.5 | −2.5 ± 2.4 | 0.2 ± 2.9 | 0.010 |
| Variable | Pretraining n = (18) | Post-Training n = (18) | Post-Pretraining n = (18) | p |
|---|---|---|---|---|
| SDNN (ms) | 38.2 ± 2.7 | 48.4 ± 3.0 | 10.1 ± 1.9 | <0.001 |
| RMSSD (ms) | 24.0 ± 4.2 | 36.6 ± 5.3 | 12.62 ± 3.1 | 0.001 |
| pNN50% | 4.9 ± 2.4 | 13.9 ± 4.6 | 8.97 ± 2.7 | 0.004 |
| LF (ms2) | 741.2 ± 113.8 | 527.7 ± 113.0 | −213.5 ± 94.3 | 0.037 |
| HF (ms2) | 384.0 ± 105.2 | 889.0 ± 323.6 | 505.0 ± 231.2 | 0.043 |
| LF (nu) | 65.4 ± 5.0 | 61.7 ± 5.3 | −3.7 ± 4.8 | 0.452 |
| HF (nu) | 34.6 ± 5.0 | 38.2 ± 5.3 | 3.7 ± 4.8 | 0.455 |
| LF/HF | 4.0 ± 0.6 | 1.3 ± 0.2 | −2.7 ± 0.5 | <0.001 |
| SampEn (ms) | 1.1 ± 0.1 | 1.4 ± 0.1 | 0.3 ± 0.3 | 0.003 |
| Pretraining | Post-Raining | |||||||||||
|---|---|---|---|---|---|---|---|---|---|---|---|---|
| Variable | Predictors | β | t | PVE | p | VIF | Predictors | β | t | PVE | p | VIF |
| ASBP (mmHg) Awake | 0.668 | 0.001 | 0.607 | 0.004 | ||||||||
| HFms2 | −0.411 | −2.573 | 0.321 | 0.022 | 1.076 | SDNN | −0.556 | −3.233 | 0.427 | 0.006 | 1.055 | |
| Age | 0.568 | 3.604 | 0.481 | 0.003 | 1.047 | Age | 0.506 | 2.768 | 0.354 | 0.015 | 1.188 | |
| SBP | 0.504 | 3.166 | 0.417 | 0.007 | 1.067 | SBP | 0.259 | 1.451 | 0.131 | 0.169 | 1.136 | |
| ASBP (mmHg) Sleep | 0.412 | 0.053 | 0.153 | 0.289 | ||||||||
| LF/HF | 0.178 | 0.846 | 0.049 | 0.412 | 1.060 | pNN50 | 0.197 | 0.827 | 0.044 | 0.421 | 1.005 | |
| SBP | 0.596 | 2.795 | 0.358 | 0.014 | 1.083 | SBP | 0.351 | 1.473 | 0.126 | 0.161 | 1.005 | |
| BMI | 0.371 | 1.792 | 0.187 | 0.095 | 1.022 | |||||||
| ASBP (mmHg) 19 h | 0.541 | 0.010 | 0.408 | 0.055 | ||||||||
| SampEn | 0.301 | 1.568 | 0.139 | 0.139 | 1.123 | SDNN | 0.369 | 1.714 | 0.173 | 0.109 | 1.055 | |
| SBP | 0.578 | 3.101 | 0.407 | 0.008 | 1.059 | Age | 0.391 | 1.747 | 0.179 | 0.103 | 1.188 | |
| Age | 0.437 | 2.307 | 0.275 | 0.037 | 1.095 | SBP | 0.313 | 1.427 | 0.127 | 0.176 | 1.136 | |
| Pretraining | Post-Training | |||||||||||
|---|---|---|---|---|---|---|---|---|---|---|---|---|
| Variable | Predictors | β | t | PVE | p | VIF | Predictors | β | t | PVE | p | VIF |
| ADBP (mmHg) Awake | 0.357 | 0.037 | 0.585 | 0.001 | ||||||||
| LF/HF | 0.516 | 2.487 | 0.292 | 0.025 | 1.002 | SDNN | −0.236 | −1.382 | 0.113 | 0.187 | 1.059 | |
| DBP | 0.277 | 1.337 | 0.106 | 0.201 | 1.002 | DBP | 0.785 | 4.588 | 0.584 | <0.001 | 1.059 | |
| ADBP (mmHg) Sleep | 0.136 | 0.132 | 0.119 | 0.388 | ||||||||
| LFnu | 0.368 | 1.585 | 0.136 | 0.132 | 1.000 | pNN50 | 0.377 | 1.959 | 0.204 | 0.069 | 1.018 | |
| DBP | 0.612 | 3.184 | 0.403 | 0.006 | 1.018 | |||||||
| ADBP (mmHg) 19 h | 0.223 | 0.048 | 0.482 | 0.007 | ||||||||
| LF/HF | 0.473 | 2.146 | 0.223 | 0.048 | 1.000 | LF/HF | 0.123 | 0.663 | 0.028 | 0.518 | 1.002 | |
| DBP | 0.689 | 3.701 | 0.477 | 0.002 | 1.002 | |||||||
| Variable | Predictors | β | t | PVE | p | VIF |
|---|---|---|---|---|---|---|
| ∆SBP (mmHg) | 0.432 | 0.042 | ||||
| Pretraining ASBP awake | 0.130 | 0.546 | 0.021 | 0.594 | 1.400 | |
| ∆LF nu | 0.468 | 2.175 | 0.253 | 0.047 | 1.114 | |
| SBP | 0.415 | 1.747 | 0.179 | 0.103 | 1.393 | |
| ∆DBP (mmHg) | 0.440 | 0.039 | ||||
| Pretraining ADBP awake | 0.287 | 1.204 | 0.094 | 0.249 | 1.418 | |
| ∆LF/HF | 0.716 | 3.154 | 0.415 | 0.007 | 1.289 | |
| DBP | 0.264 | 1.247 | 0.100 | 0.233 | 1.122 |
Disclaimer/Publisher’s Note: The statements, opinions and data contained in all publications are solely those of the individual author(s) and contributor(s) and not of MDPI and/or the editor(s). MDPI and/or the editor(s) disclaim responsibility for any injury to people or property resulting from any ideas, methods, instructions or products referred to in the content. |
© 2023 by the authors. Licensee MDPI, Basel, Switzerland. This article is an open access article distributed under the terms and conditions of the Creative Commons Attribution (CC BY) license (https://creativecommons.org/licenses/by/4.0/).
Share and Cite
Cilhoroz, B.T.; Zaleski, A.; Taylor, B.; Fernandez, A.B.; Santos, L.P.; Vonk, T.; Thompson, P.D.; Pescatello, L.S. The Relationship between Postexercise Hypotension and Heart Rate Variability before and after Exercise Training. J. Cardiovasc. Dev. Dis. 2023, 10, 64. https://doi.org/10.3390/jcdd10020064
Cilhoroz BT, Zaleski A, Taylor B, Fernandez AB, Santos LP, Vonk T, Thompson PD, Pescatello LS. The Relationship between Postexercise Hypotension and Heart Rate Variability before and after Exercise Training. Journal of Cardiovascular Development and Disease. 2023; 10(2):64. https://doi.org/10.3390/jcdd10020064
Chicago/Turabian StyleCilhoroz, Burak T., Amanda Zaleski, Beth Taylor, Antonio B. Fernandez, Lucas P. Santos, Thijs Vonk, Paul D. Thompson, and Linda S. Pescatello. 2023. "The Relationship between Postexercise Hypotension and Heart Rate Variability before and after Exercise Training" Journal of Cardiovascular Development and Disease 10, no. 2: 64. https://doi.org/10.3390/jcdd10020064