
Three Complete Mitochondrial Genomes of Erotylidae (Coleoptera: Cucujoidea) with Higher Phylogenetic Analysis
by
 , ,
, ,
Jing Liu
1,†, 
Yuyu Wang
1,†,
Ruyue Zhang
1,
Chengmin Shi
1,
Weicheng Lu
1,
Jing Li
1,* and
Ming Bai
1,2,* 1
College of Plant Protection, Hebei Agricultural University, Baoding 071001, China
2
Key Laboratory of Zoological Systematics and Evolution, Institute of Zoology, Chinese Academy of Sciences, Beijing 100101, China
*
Authors to whom correspondence should be addressed.
†
Correspondence authors contributed equally to this manuscript.
Insects 2021, 12(6), 524; https://doi.org/10.3390/insects12060524
Submission received: 4 May 2021
/
Revised: 28 May 2021
/
Accepted: 31 May 2021
/
Published: 5 June 2021
(This article belongs to the Section Insect Systematics, Phylogeny and Evolution)
Abstract
:Simple Summary
Erotylid beetles are phytophagous and mycophagous. Phylogenetic studies on this family were mainly based on morphological characters or several gene fragments. Research on the mitochondrial genome of Erotylidae is rare. Therefore, we sequenced and analyzed three complete mt genomes of Erotylinae with a comparative mt genomic analysis of Erotylinae and Languriinae for the first time to reveal mitochondrial genome characterizations and reconstruct phylogenetic relationships of this group. The comparative analyses showed the mt genome characterizations of Erotylinae are similar to Languriinae. These results provided a comprehensive framework and worthy information for the future research of this family.
Abstract
The family Erotylidae belongs to the superfamily Cucujoidea, which are phytophagous and mycophagous. So far, only two representative complete mitochondrial (mt) genomes of Erotylidae have been sequenced. Mitochondrial genomes of Tritoma metasobrina, Neotriplax arisana, and Episcapha opaca, which all belong to the subfamily Erotylinae, were sequenced using next-generation sequencing technology to better understand the diversity of mt genomes of Erotylidae. A comparative mt genomic analysis was conducted on the three sequenced representatives of Erotylinae and Languriinae sp. (Languriinae). The size of the complete mt genome of the 4 species ranged from 15,581 bp to 16,502 bp in length, including 37 genes (13 protein-coding genes, 22 transfer RNAs, and 2 ribosomal RNAs) and the control region. The arrangements of their mt genomes are highly consistent with other Coleoptera species. The start codons of two PCGs (ND1 and ND5) and the stop codons of one PCG (ATP8) were illustrated differences between Languriinae sp. and the other three species. All tRNAs of these 4 species exhibited cloverleaf secondary structures except that the dihydorouridine (DHU) arm of tRNASer(AGN) was absent. The phylogenetic analyses using both Bayesian inference (BI) and maximum likelihood (ML) methods all supported that Erotylidae as monophyletic. Erotylinae was monophyletic being the sister group to Xenocelinae. Languriinae was closely related to ‘Erotylinae-Xenocelinae’. Our results recovered Languriinae nested within Erotylidae.
1. Introduction
The diverse family Erotylidae belongs to the superfamily Cucujoidea (Coleoptera: Polyphaga), which includes about 260 genera and 3500 species in the world [1]. The larvae and adults of Erotylidae have different feeding habits [2]. The highest numbers of species are contained in the basidiomycete fungus-feeding Erotylinae and the mainly phytophagous-feeding Languriinae, whereas other subfamilies include fewer species with mixed diets [2]. The monophyly and composition of Erotylidae have never been explicitly determined since Latreille established this family [3]. The monophyly of Erotylidae was supported by Leschen and Lawrence based on morphological analysis of Cucujoidea [4,5,6]. In Leschen’s study, the sister group with Erotylidae was not clear [4]. The monophyly of the family Erotylidae was also put forward by Hunt and Mcelrath according to the molecular phylogenetic study [7,8] and the results showed Erotylidae was closely related to Protocucujoidae, Helotidae, and Monotomidae. But the paraphyly of Erotylidae has been recovered by a molecular phylogeny based on several nuclear and mitochondrial genes [9]. The paraphyletic or polyphyletic Erotylidae was also proposed by the morphological characters in Cucujoidea [10].
The relationships within Erotylidae are still controversial, especially between Erotylinae and Languriinae. Languriidae should be merged into Erotylidae as indicated by Crotch as well as Wegrzynowicz and Leschen [11,12,13]. This conclusion was also supported by Robertson, who analyzed the 18S rRNA and 28S rRNA gene sequences of 61 species [14]. But there has also been some research that showed Languriidae and Erotylidae to be separate families [15,16,17,18,19]. Arrow showed that there were significant morphological differences between Erotylidae and Languriidae, such as the procoxal cavities open and the larval spiracles are divided into two pairs in Languriidae, whereas in Erotylidae the procoxal cavities are closed and the larval spiracles are of a simple annular shape [15]. This result was also supported by Crowson, Sen, and Leschen [16,17,18]. Kai indicated that Languriidae should be regarded as a separated family based on their feeding characteristics [19]. So, the phylogenetic position of Languriinae and the internal phylogenetic relationships of Erotylidae are still unclear.
Phylogenetic investigations of Erotylidae have remained at the level of morphology and mitochondrial (mt) markers for a long time. In recent years, mt genome has been widely used in the analysis of species heredity and molecular evolution due to their advantages such as small molecular weight, ease to operate, fast mutation speed, and maternal inheritance [20,21,22]. The complete mt genome can provide more informative genetic information as well as a suite of genomic-level characters, such as RNA secondary structures and gene arrangements in comparison with the individual mt genes. [23,24].
Currently, the study of mt genomes from Erotylidae is still scarce. A total of 10 mt genomes label as Erotylidae were available in GenBank (accession date, 9 January 2021). Of them, one mt genome (accession No. KT696227.1) was likely mislabeled, because manifested high sequence identity (99% for COX1 gene) with Thamiaraea americana. Another 8 mt genomes for 6 unidentified species of Erotylidae sp., Loberonotha olivascens, and Tritoma bipustulata, are highly incomplete. Here, the mt genomes of three species, Tritoma metasobrina Chûjô, 1941, Neotriplax arisana Miwa, 1929 and Episcapha opaca Heller, 1920 were sequenced using next-generation sequencing to better understand the diversity of mt genomes and the phylogenetic of Erotylidae [25,26,27]. A comparative mt genomic analysis of two subfamilies in Erotylidae was conducted including T. metasobrina, E. opaca, N. arisana (Erotylinae), and Languriinae sp. (Languriinae). The results will lay a foundation for the study of Erotylidae mitogenomes. The phylogenetic relationships were reconstructed to demonstrate the phylogenetic position of Erotylidae as well as to explore the phylogeny of Cucujoidea. The results will lay a foundation for the study of Erotylidae as well as Cucujoidea.
2. Materials and Methods
2.1. Sampling and Genomic DNA Extraction
Specimens of T. metasobrina (September 2019, 113°46′13″ E, 36°50′47″ N), E. opaca (April 2020, 102°37′30″ E, 24°56′17″ N), and N. arisana (September 2019, 101°56′26″ E, 35°16′36″ N) were collected in Yunnan, Qinghai and Hebei, respectively. Specimens were preserved in absolute ethanol at −20 °C for storage at the Hebei Agricultural University (HEBAU). Genomic DNA was extracted by DNeasy Blood & Tissue kit (QIAGEN, Hilden, Germany) (Table S1).
2.2. Genome Sequencing and Analyses
DNA quality and quantification were determined by the ND-2000 (NanoDrop Technologies). Only high-quality (OD260/280 = 1.8–2.0, OD260/230 ≥ 2.0) and sufficient DNA sample was used in subsequent experiments.
Sequencing libraries (Illumina NovaSeq) were prepared using genomic DNA with an average insert size of 400 bp, and were sequenced on the Illumina Hiseq platform with 150 bp paired-end reads at Majorbio (Shanghai, China). According to the principle of second-generation sequencing data, the original offline data (Raw Data) was subjected to fastp [28] quality control filtering to obtain Clean Data, and the analysis of Clean Data was performed according to GATK Best Practice for mutation detection. MitoZ [29] was used to conduct assembly and annotation, then checked by manual proofreading according to its relative species. TRNA scan-SE Search Server v1.21 [30] was used to identify the tRNA genes and then manually proofread. The secondary structures of two rRNAs (rrnS, rrnL) were predicted by RNA Structure (http://rna.urmc.rochester.edu/RNAstructureWeb/) (accessed on 25 December 2020). [31]. All PCGs were annotated by alignment with homologous genes from T. metasobrina, N. arisana, and E. opaca using Geneious 8.0.5 software (Biomatters, Auckland, New Zealand) [32]. MEGA 7.0 was used to calculate the A + T content and relative synonymous codon usage (RSCU) for PCG analysis [33]. The bias of base usage was measured by AT-skew and was calculated to AT-skew = (A − T)/ (A + T) [34]. The numbers of synonymous substitutions (Ks) and non-synonymous substitutions (Ka), and the ratios of Ka/Ks for each PCG were also measured in the software KaKs_Calculator 2.0. [35] (Table S1). MEGA 7.0 [33] was used to analyze the genetic distances based on Kimura-2-parameter among the 4 mt genomes were analyzed by. Genome organization and base composition, PCGs, RSCU, tRNAs, rRNAs, CR, intergenic spacer, and overlapping regions of the mt genomes were compared between Erotylidae species. The newly sequenced mitogenome sequences of T. metasobrina, E. opaca, and N. arisana were submitted to GenBank with the accession numbers MZ014622, MZ014623, and MZ014624, respectively.
2.3. Phylogenetic Analyses
In this study, the phylogenetic analyses were conducted based on 17 mt genomes from GenBank (Available online: http://www.ncbi.nlm.nih.gov) (accessed on 9 January 2021). including three newly sequenced (Table 1). Most of the mt genomes chosen were complete. The ingroup taxa included 15 species from Cucujoidea representing 7 families and the outgroup taxa included Curculionidae and Chrysomelidae for their close relationships with Cucujoidea [36,37].
Clustal_X [38] was used to conduct DNA alignment from the amino acid alignment of PCGs. MEGA 7.0 was used to connect all alignment sequences excluding the stop codon. Bayesian inferences were conducted with PhyloBayes 3 [39] on DNA sequence alignment with the CAT-GTR model, and on the amino acid alignment with the CAT-Poisson model [40,41,42], respectively. Two Markov chain Monte Carlo (MCMC) chains were employed. The maximum likelihood analysis was conducted with IQ-Tree in Phylosuite [43,44] on DNA sequence alignment with the GTR + F + I + G4 model selected by ModelFinder [45]. Branch supports were evaluated through the ultra-fast bootstrapping method [46] with 1000 replicates (Table S1). The inferred phylogenetic trees were viewed and illustrated using FigTree [47].
3. Results and Discussion
3.1. General Features of Erotylidae mt Genomes
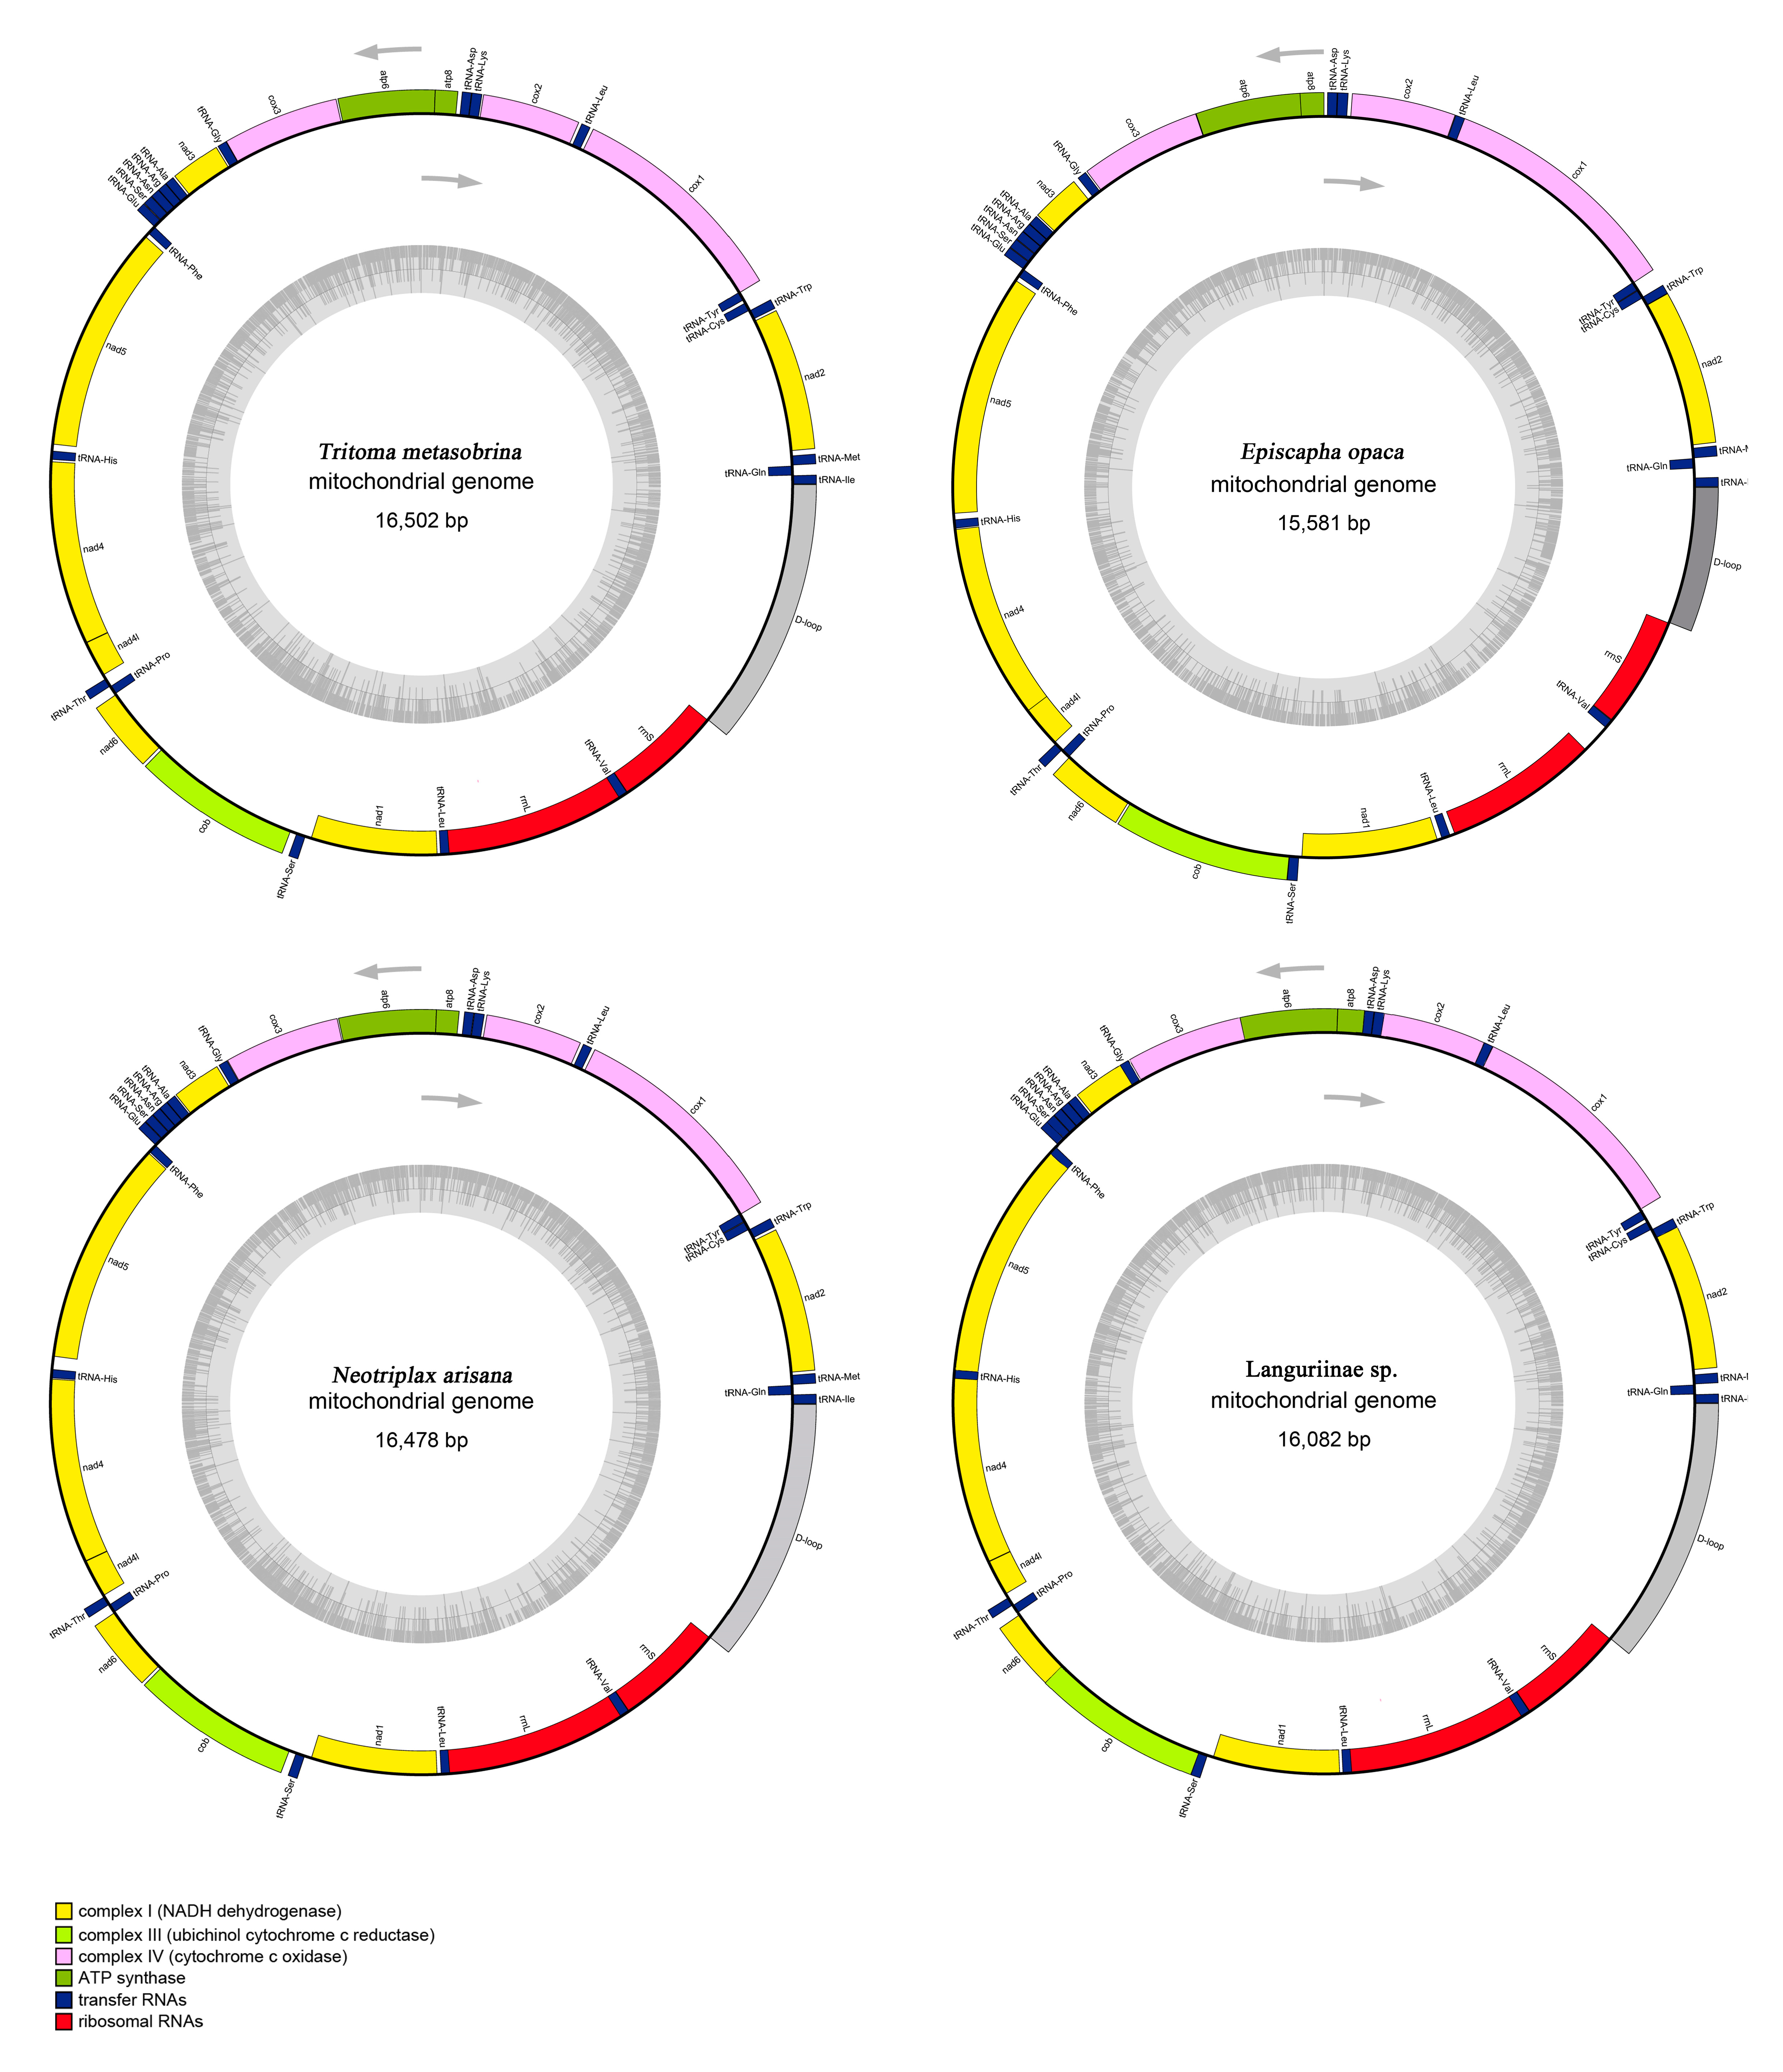
Including the newly sequenced mt genomes of T. metasobrina, E. opaca, and N. arisana, a total of four mt genomes representing three tribes and two subfamilies of Erotylidae were used in our comparative analyses. The mt genomes of four specimens were typical circular double-strand molecules, ranging from 15,581 bp to 16,502 bp in length. The mt genomes included 13 Protein-coding genes (PCGs), 22 transfer RNAs (tRNAs) and 2 ribosomal RNAs (rRNAs), and the control region (CR) (Figure 1). Twenty-three genes were encoded at the majority strand (J), while the remaining 14 genes were oriented at the minority strand (N). The 4 species displayed a 929–1785 bp CR, identified by the position between the rrnS and tRNAIle. The overlap nucleotides were located between tRNATyr/COX1 of T. metasobrina (8 bp), tRNATrp/tRNACys of E. opaca (8 bp), ATP8/ATP6 of N. arisana (4 bp) and ATP8/ATP6 and ND4/ND4L of Languriinae sp. (7 bp). In addition to the CR, the largest non-coding region of these 4 species was located between tRNAIle and tRNAGln in T. metasobrina with a length of 145 bp (Table 2).
The mt genomes of Erotylidae had a significant bias towards A and T, with the nucleotide composition of A and T in total ranging from 74.80% in T. metasobrina to 78.70% in E. opaca [48]. The content of A + T in the PCGs, tRNAs, rRNAs and CR were ranging from 72.90% to 77.79%, 77.48% to 79.20%, 80.20% to 80.4% and 75.50% to 81.59%. AT-skews and GC-skews were used to measure the strand bias of nucleotide composition of metazoans mt genomes [49]. The AT-skew was −0.01 to 0.04 and the GC-skew was −0.29 to −0.20 (Table 3).
3.2. Protein-Coding Genes
Most PCGs started with ATN, except for several genes that started with GTG or TTG. The PCGs stopped with TAA/TAG or truncated termination codons with T/TA-tRNA [50]. The start codons of two PCGs (ND1 and ND5) and stop codons of one PCG (ATP8) were illustrated differences between Languriinae sp. and the other three species (Table 2).
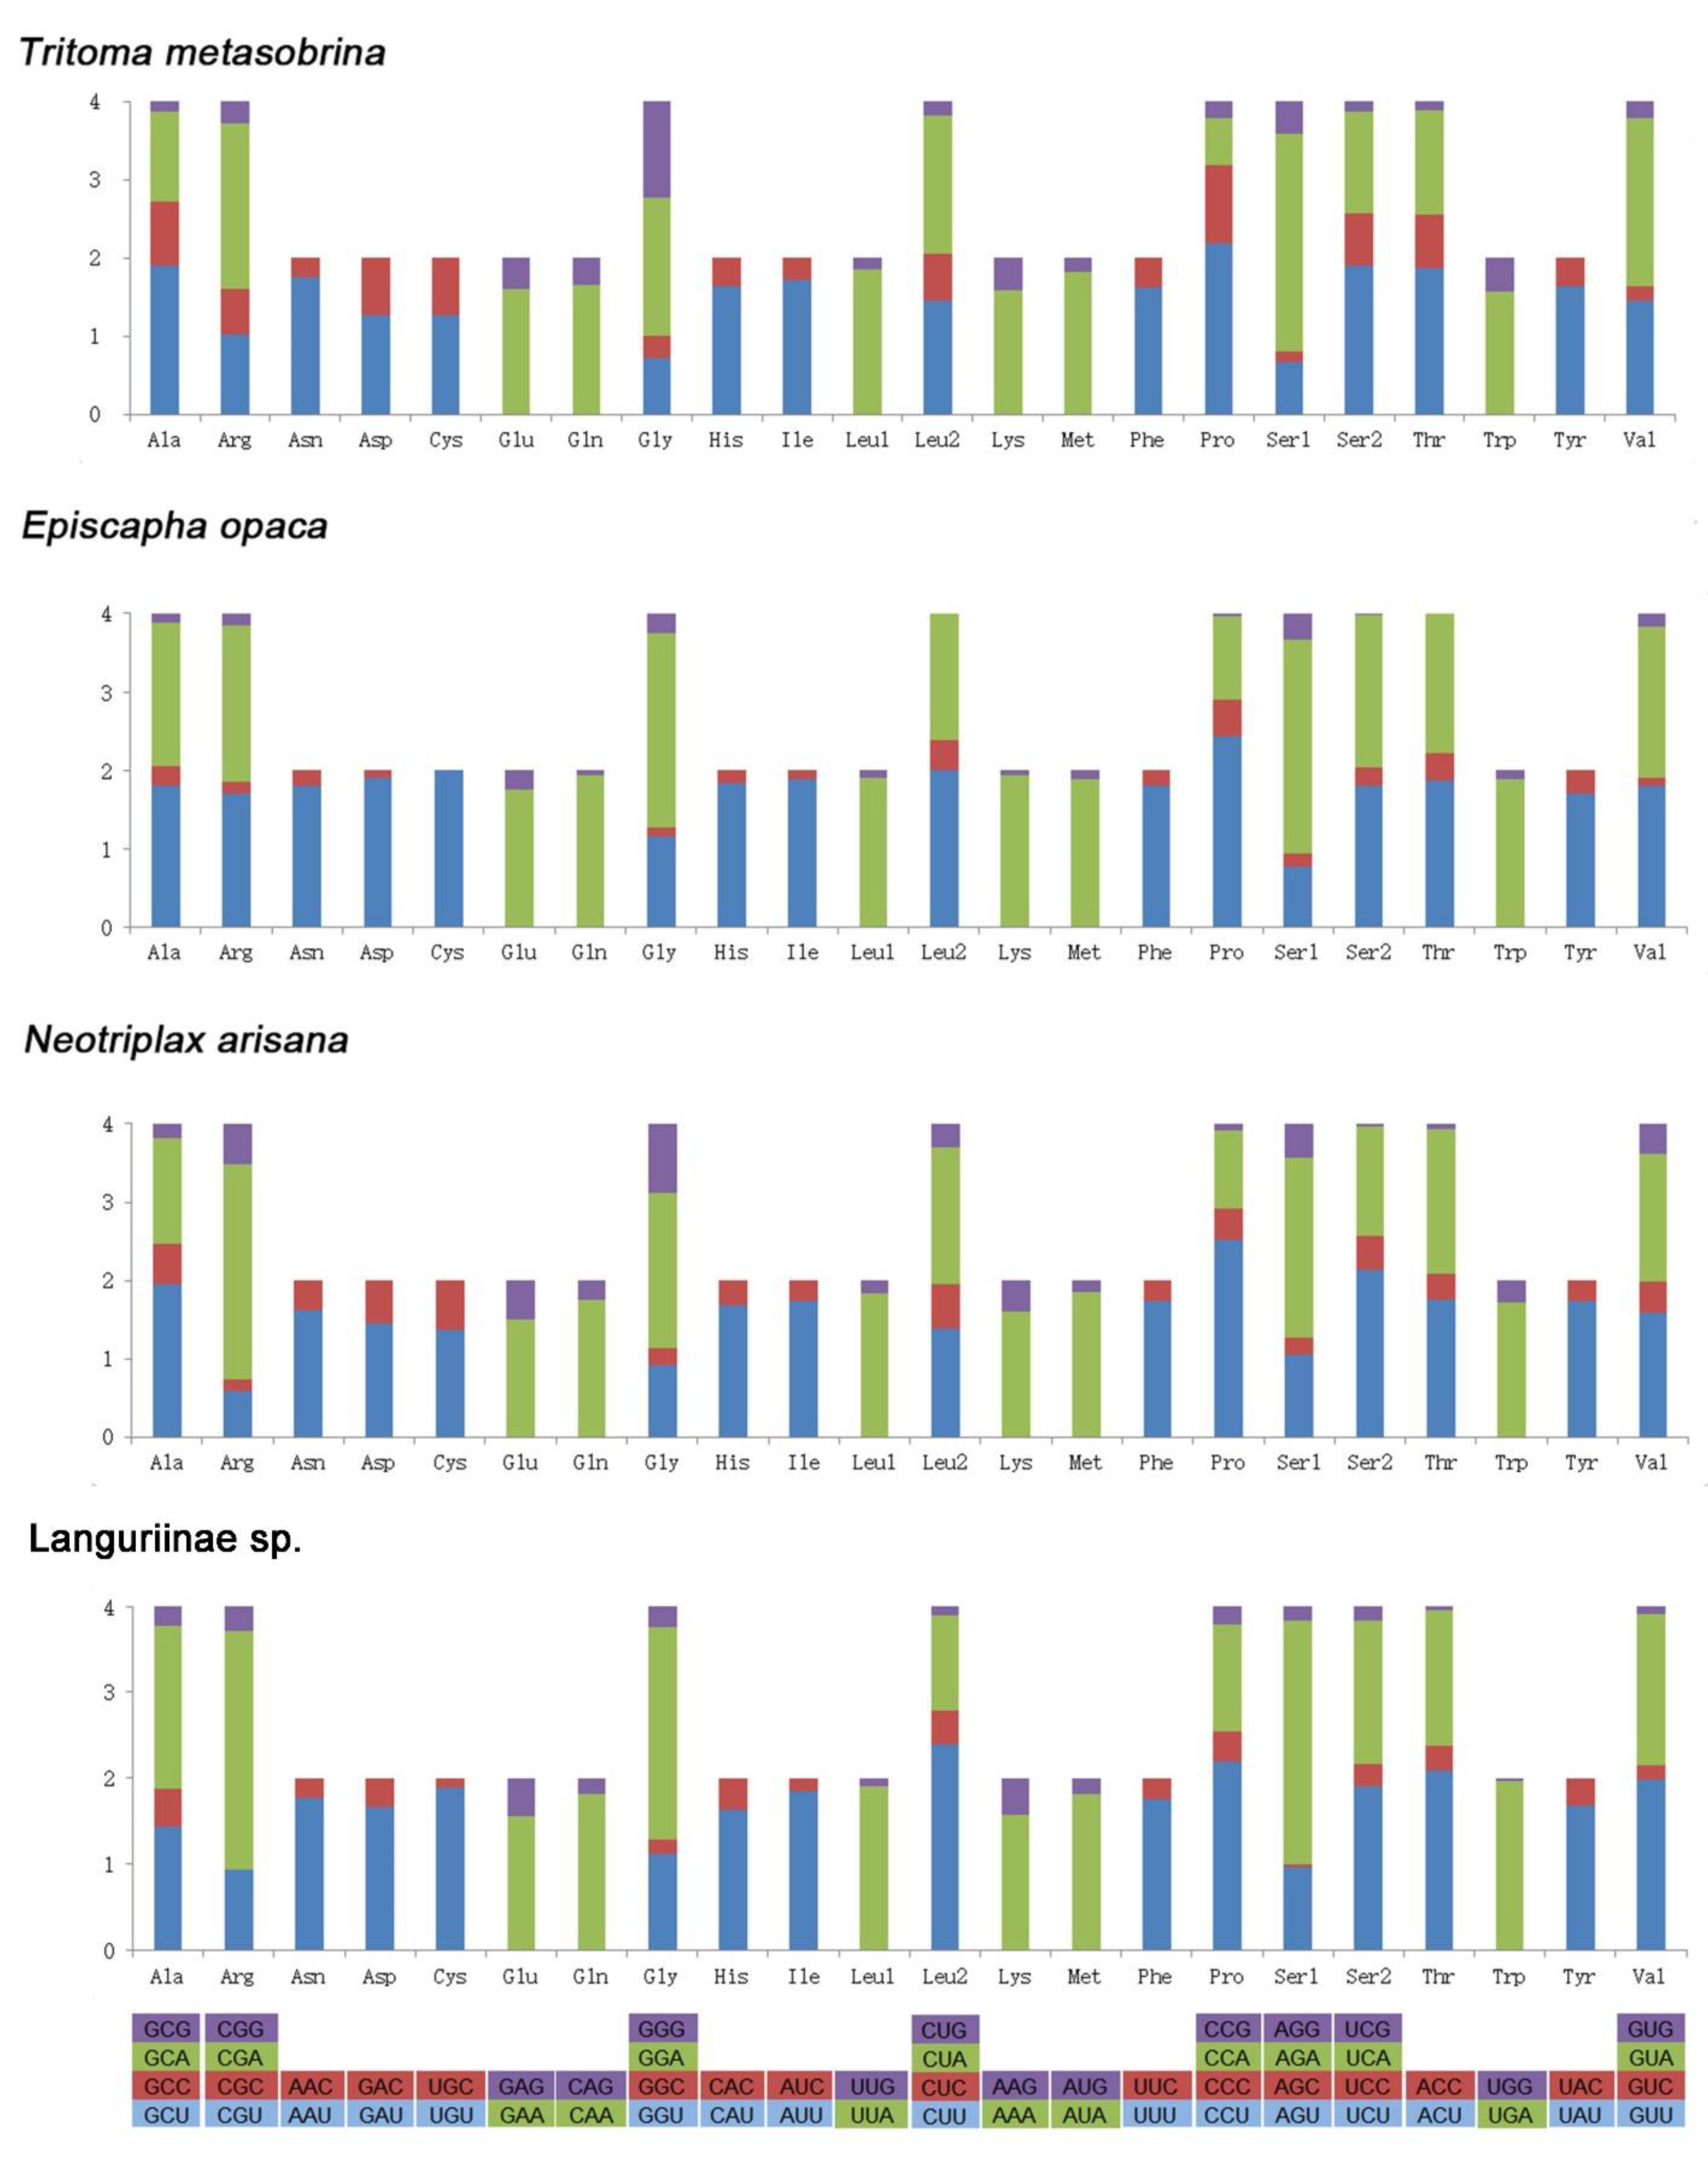
The number of each codon, the amino acid(aa) compositions of PCGs, and relative synonymous codon usage (RSCU) values in four species were given in Figure 2. A total of 3641–3691 codons were used excluding termination codons. The frequency of A and U in the third site of four species was much higher than C and G. The four most frequently used codons were CGA, AGA, CCU, and GGA. The highest value of RSCU was 2.84 of AGA in Languriinae sp. The lowest value of RSCU was 0 of UGC and CUG in E. opaca. Leucine, Isoleucine, Phenylalanine, and Methionine were the most frequent coding amino acids (aa). The most frequently used codons were TTA, ATT, TTT, and ATA indicating the preference of nucleotide composition A/T.
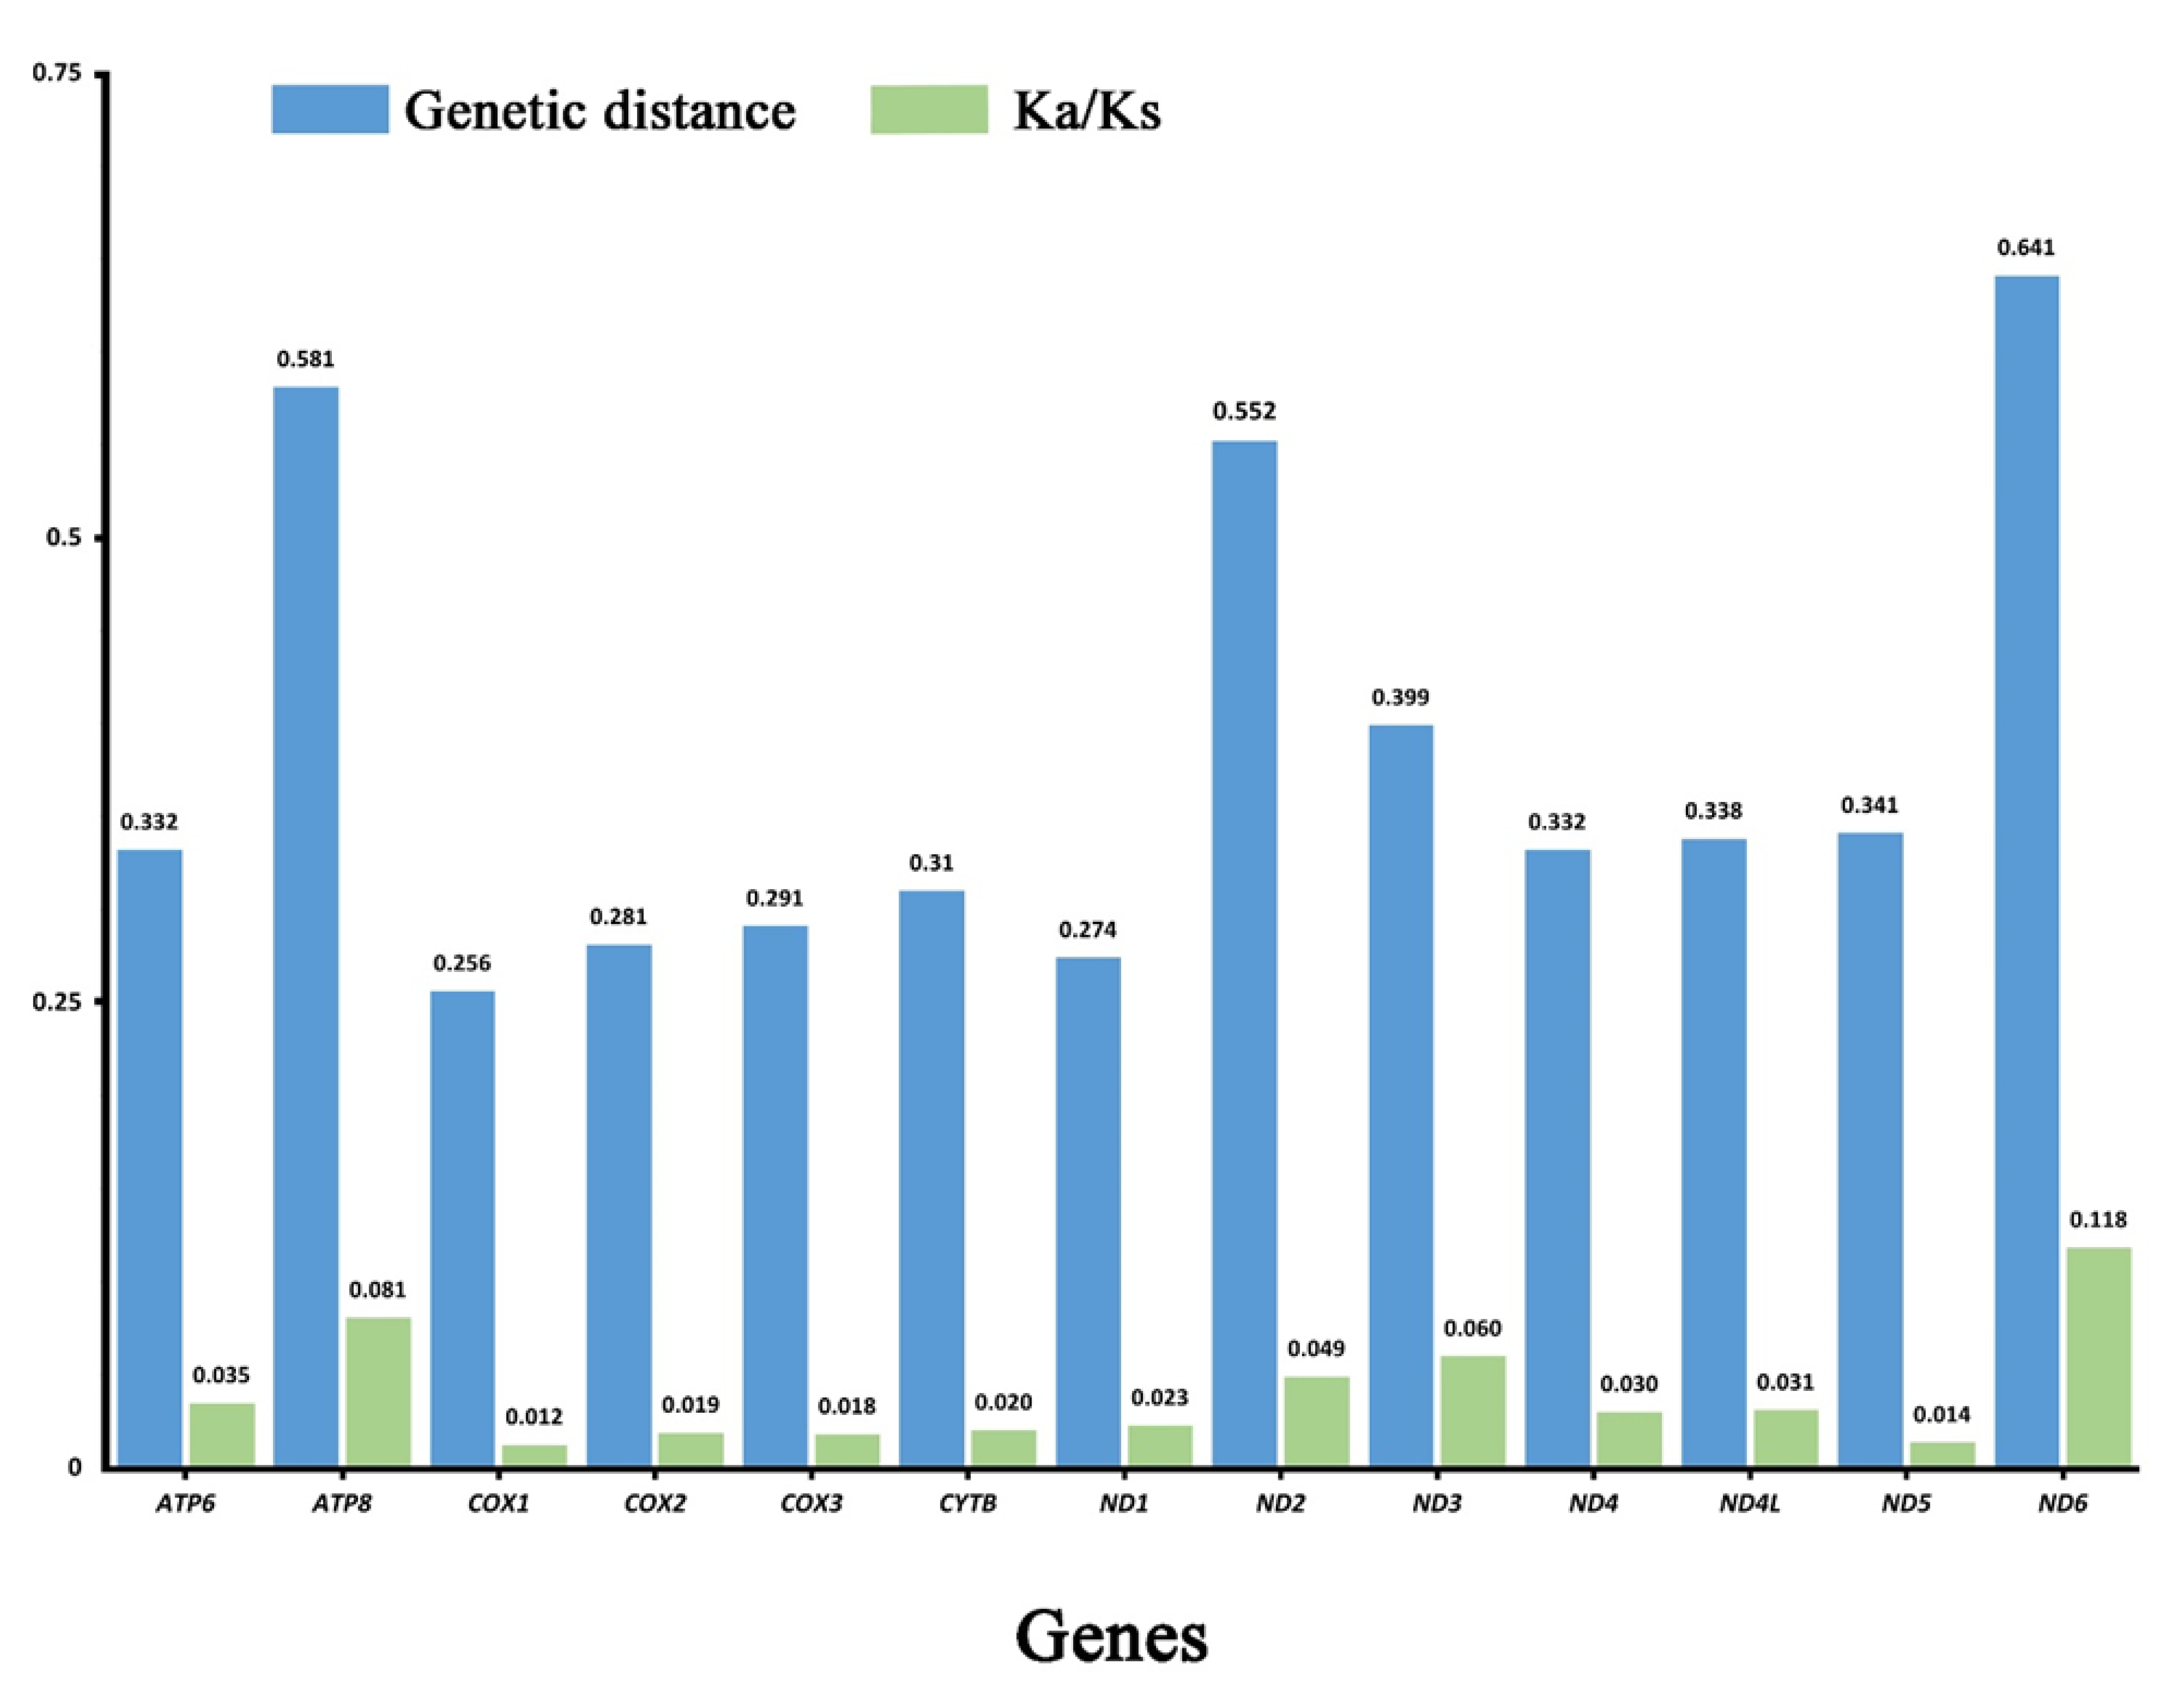
Analysis of pairwise genetic distance showed similar results with ND6 (0.641), ATP8 (0.581), and ND2 (0.552) evolving relatively faster, while COX1 (0.256) and ND1 (0.274) were slower (Figure 3). Average non-synonymous (Ka)/synonymous (Ks) substitution rate ratios can be used to estimate the evolutionary rate of mitogenome PCGs [51]. We calculated Ka/Ks ratios for each PCG of 4 species in this study, which was shown in Figure 3. Ratios ranged from 0.012 for COX1 to 0.118 for ND6, which indicated that all PCGs were under purifying selection [52]. Our results showed ND6 and ATP8 exhibited relaxed purifying selection, while COX1 was under the strongest purifying selection. Analyses of nucleotide diversity, genetic distance, and evolutionary rate are useful for designing specific markers among different groups. Like other Coleoptera [53], our comprehensive analysis showed that COX1 had the lowest evolution rate and evolves under comparative relaxed purifying selection, two genes (ND6 and ATP8) exhibited a faster evolution rate and diversity than other PCGs.
3.3. Transfer RNAs, Ribosomal RNAs, and Control Region
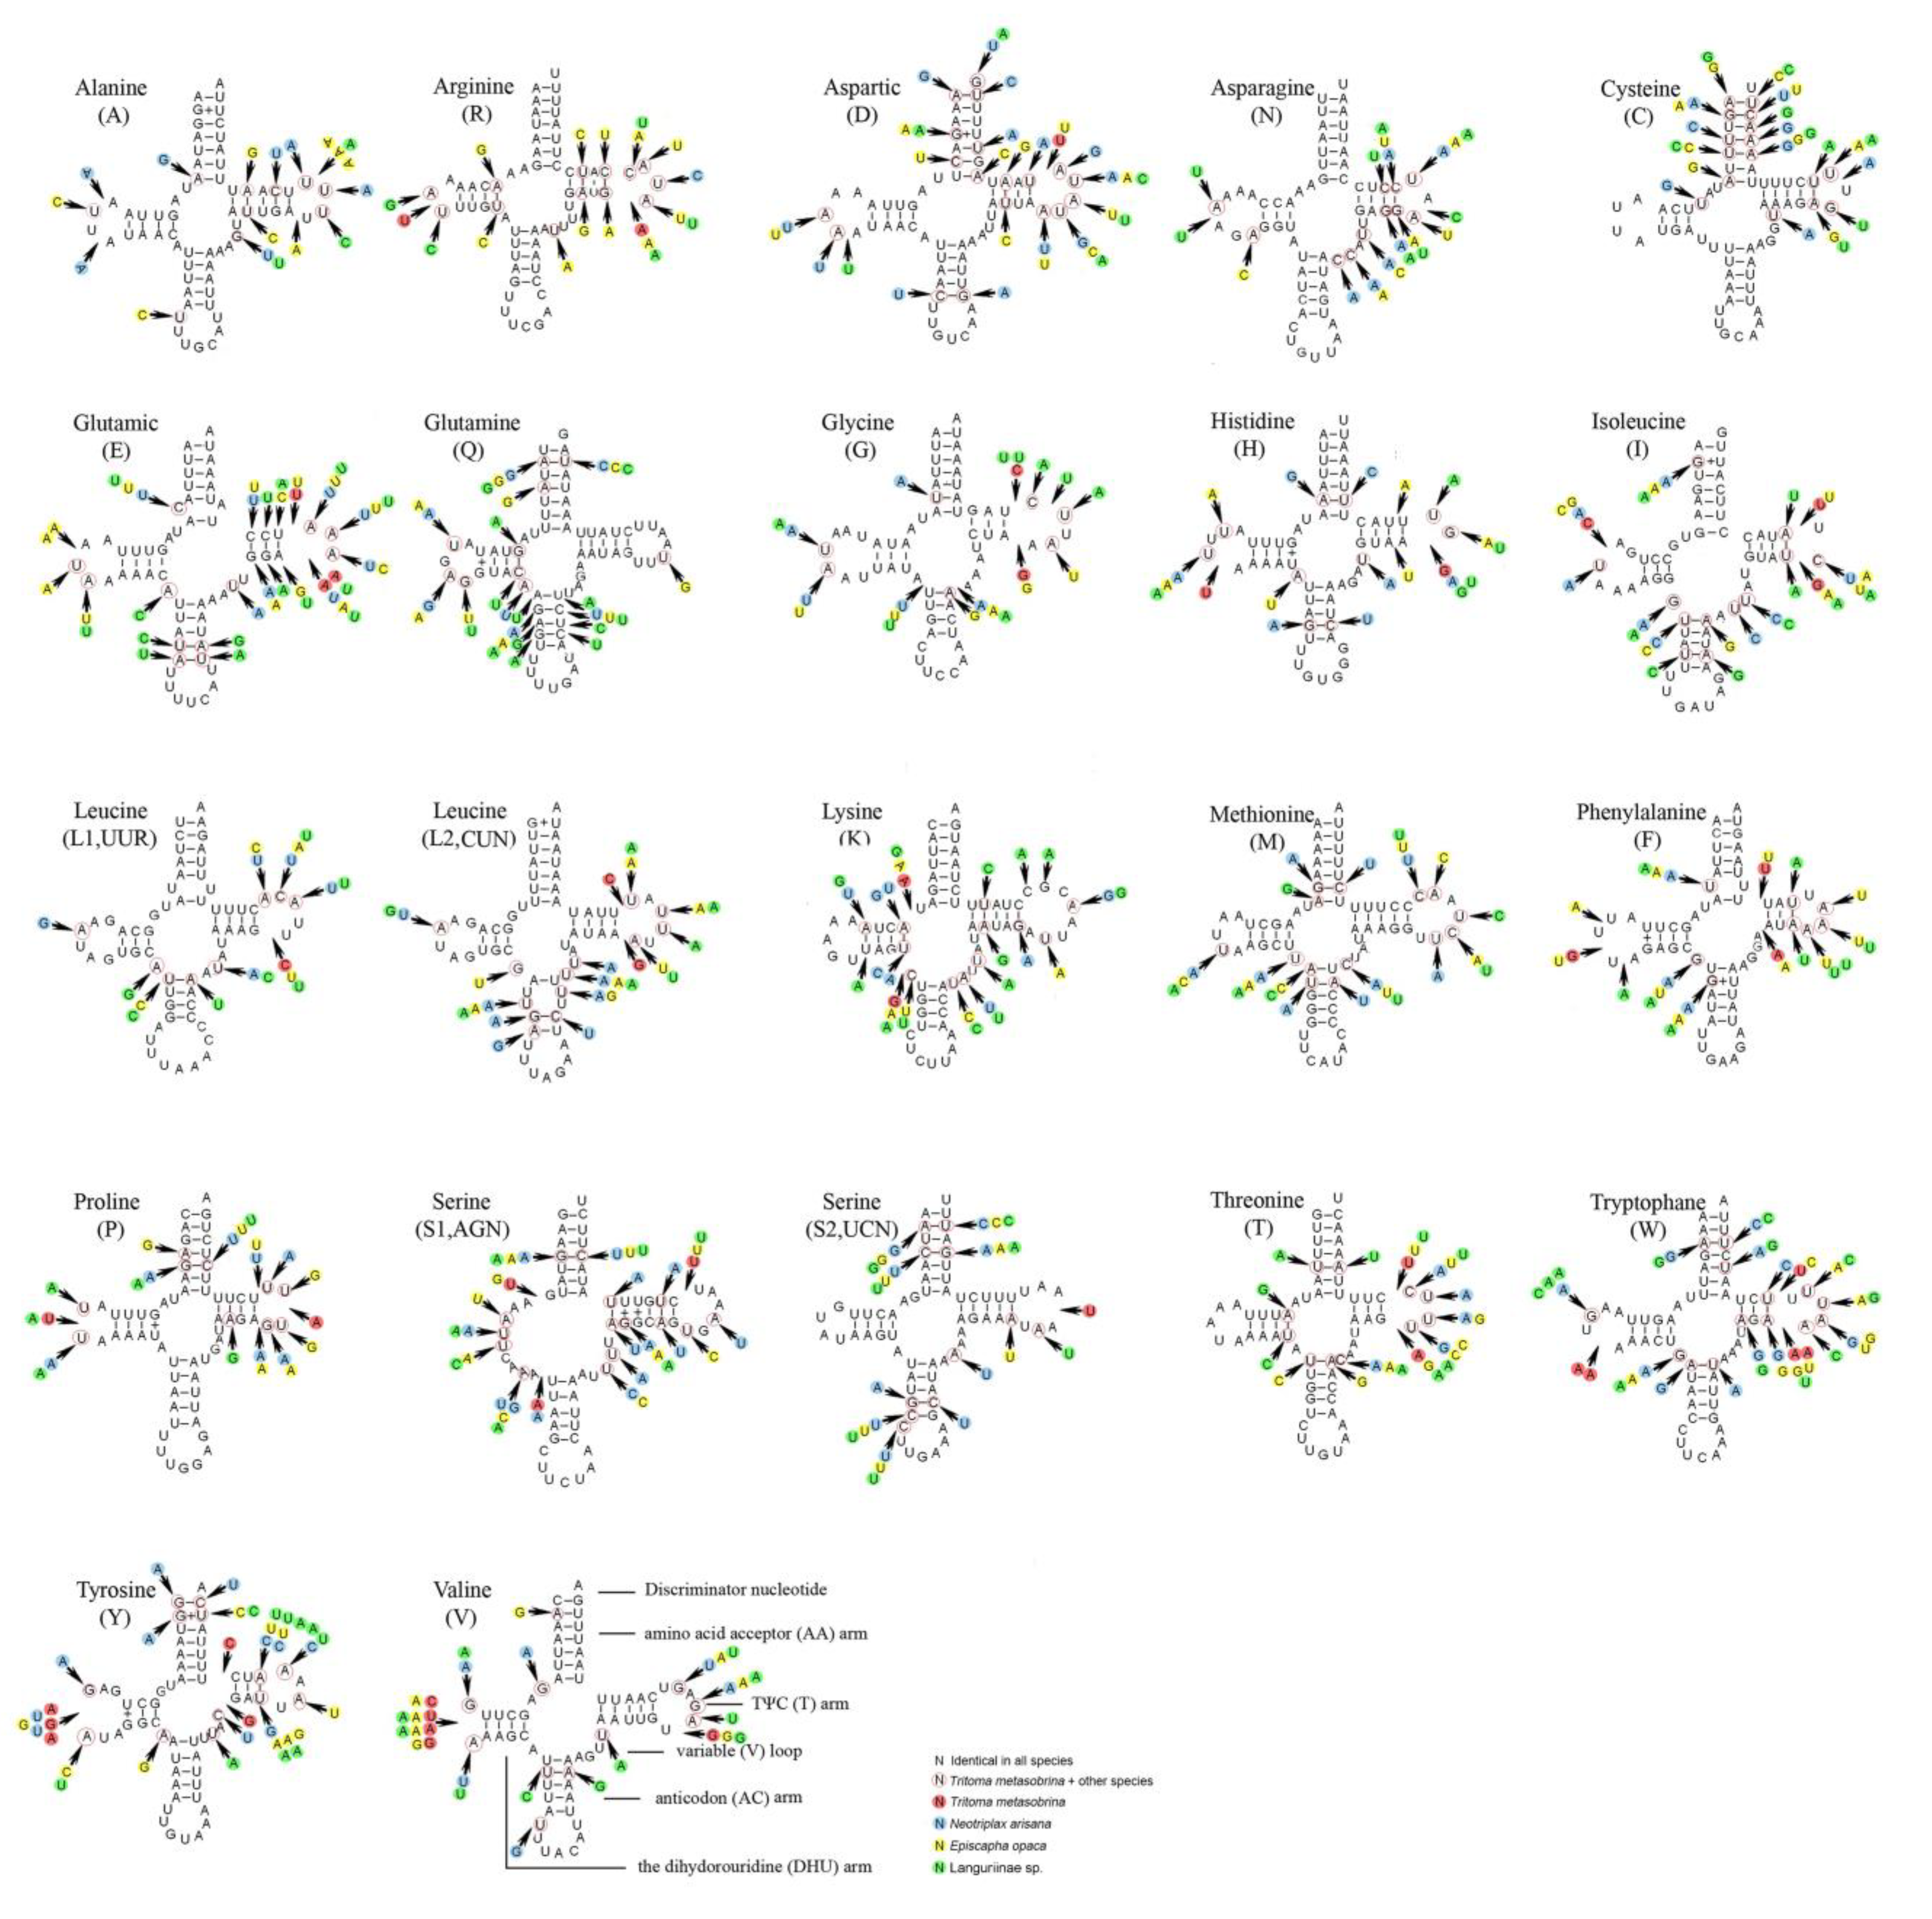
The predicted secondary structures of tRNAs were shown in Figure 4. The 22 tRNAs of four species were typical and included all 20 types of amino acids (aa). Almost all tRNAs could be folded into cloverleaf structures except tRNASer(AGN) whose DHU arm simply formed a loop. In the tRNAs secondary structure of the 4 species, the anticodons were consistent. The anticodon of tRNASer (AGN) was UCU, which was not a common GCU. UCU was used as the anticodon for the polyphagia group, which was the common form of the metazoans [48]. The aminoacyl (AA) stem length was conservatively 7 bp. Anticodon (AC) arm length was 5 bp except for tRNALys, tRNAMet, and tRNALeu(UUR). Almost all tRNAs had the same length of the anticodon (AC) loop (7 nucleotides) except tRNALeu(UUR) (9 nucleotides). The length of the TψC arm varied from 4 to 6 bp while the TψC loop from 3 to 11 nucleotides. The dihydrouridine (DHU) stem varied from 3 to 4 bp except for tRNASer(AGN). 11–13 pairs of G-U which form weak attraction and constitute bonds situated at the T arm, the AA arm, the AC arm, and the DHU arm, respectively.
The rrnL was located in tRNALeu (CUN) and tRNAVal, and its length ranged from 1052 to 1379 bp. The longest rrnL was shown in Languriinae sp. The shortest rrnL was shown in E. opaca. The rrnS was located in tRNAVal and CR in the four mt genomes of Erotylidae with the length ranging from 759 to 777 bp. The shortest rrnS was shown in E. opaca. The longest rrnS was shown in N. arisana. The AT content of rrnL and rrnS ranged from 80.70% to 81.70% and 77.90% to 81.03%, respectively, which showed a high AT bias. The highest AT content of rrnL and rrnS was found in T. metasobrina and E. opaca (Table 3).
The largest noncoding region located between rrnS and tRNAIle was CR, which is the place that controls replication and transcription [54,55]. The length of CRs were determined and ranged from 929 bp in E. opaca to 1785 bp in T. metasobrina (Figure 1). This region contained the highest proportion of A and T, ranging from 75.5% to 81.59%. The AT-skew was −0.02 to 0.17 and the GC-skew was −0.66 to −0.27, which indicated that A and T are more numerous than C and G (Table 3).
3.4. Phylogenetic Analyses
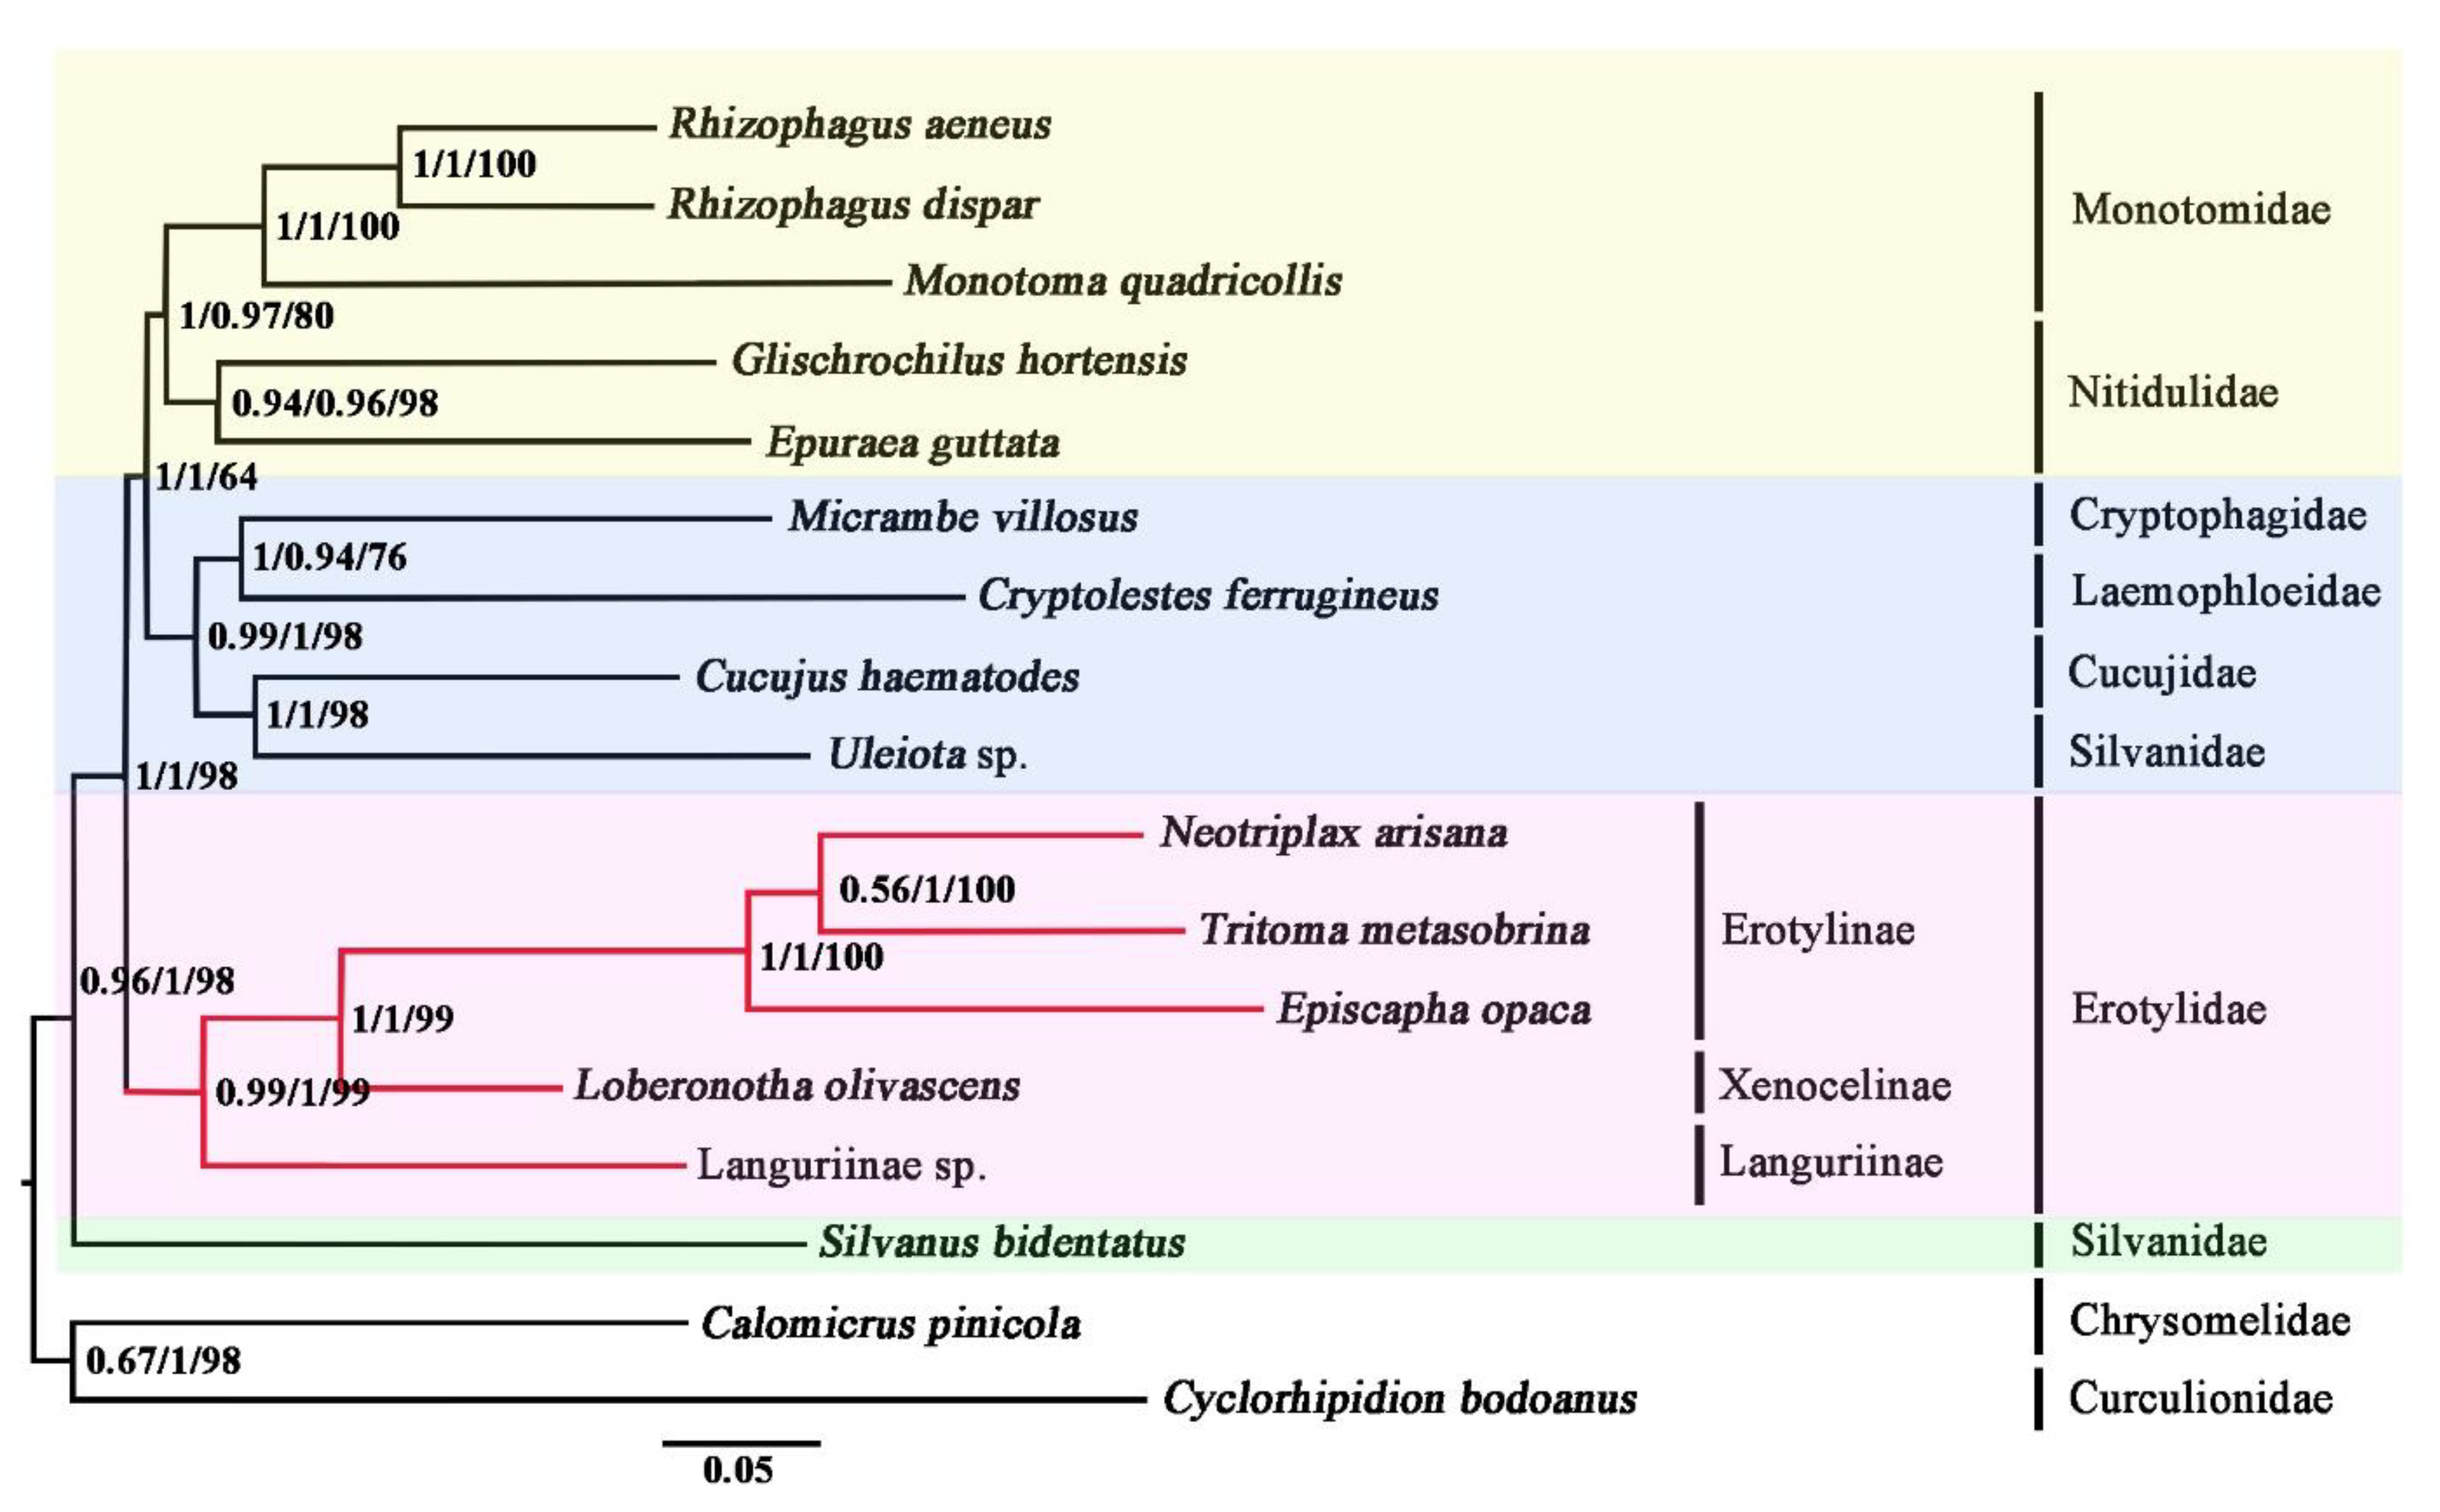
Phylogenetic analyses were performed both on the nucleotide dataset (PCG123R) and the amino acid dataset (AA). The PCG123R dataset includes 12,592 sites for 13 PCGs and two rRNA genes. The AA dataset is composed of 3592 amino acids translated from the PCGs. The results of phylogenetic analyses were shown in Figure 5. Irrespective of the methods used, analyses on the PCG123R dataset and the AA dataset reached the same topology (Figure 5). Most nodes were highly supported.
Erotylidae was recovered as monophyletic in all analyses. This result was also supported based on morphological characters [4,5,6] and molecular evidence [7,8]. The sister-group relationship between Erotylidae and “Cryptophagidae-Laemophloeidae-Cucujidae-Silvanidae’-‘Monotomidae-Nitidulidae’” was highly supported and together being the sister group to Silvanus bidentatus (Silvanidae) in all analyses. The result was also supported by analyzing nuclear protein-coding genes in Coleoptera [56]. Within the family Erotylidae, three species of Erotylinae were as a monophyletic group, sister to Xenoceninae. The sister relationship between Languriinae and other sampled subfamilies (Erotylinae and Xenocelinae) was recovered by analyses of both BI and ML. The result showed that Languriinae should belong to Erotylidae, which supported the earlier results from Crotch, Leschen, Wegrzynowicz, and Robertson [11,12,13,14].
4. Conclusions
The mt genomes sequences of T. metasobrina, E. opaca, N. arisana, and Languriinae sp. were obtained by next-generation sequencing. Their mt genomes had a total length of 16,502 bp in T. metasobrina, 15,581 bp in E. opaca, 16,478 bp in N. arisana, and 16,082 bp in Languriinae sp., respectively. Each of the mt genomes was composed of 13 PCGs, 2 rRNAs, 22 tRNAs, and a control region. In general, mt genomes for members of Erotylidae were similar in genome size and gene order to other species of Cucujoidea. The base composition was biased towards A and T as was commonly found in other insects [48]. However, the content of A + T is the highest in rrnL among four species of Erotylidae were have compared here. Most PCGs were initiated with the typical ATT/ATG codon and terminated with TAA/TAG or T/TA-tRNA. However, the start codon for ND1 of all three species of Erotylinae, T. metasobrina, E. opaca, and N. arisana is TTG, while that for species of Languriinae is ATT. The stop codons for ATP8 are TAG in Languriinae species but are TAA in Erotylinae species. The start codons of ND5 were GTG in Languriinae sp., not typical ATN condon [47]. The phylogenetic reconstructions with BI and ML methods all supported the monophyly of Erotylidae and Erotylinae. This representative of Languriinae fitted well to the clade Erotylidae as shown in previous research. This subfamily was recovered being the sister group to ‘Erotylinae-Xenocelinae’. However, only one mt genome of Languriinae and one mt genome of Xenocelinae were sampled in this study. To better understand the phylogenetic position as well as the relationships within Erotylidae, more mt genomes from Xenocelinae and Languriinae will be needed in the future. Due to the few mt genomes in Cucujoidea, increased taxon sampling is required to resolve the relationships within the superfamily Cucujoidea.
Supplementary Materials
The following is available online at https://www.mdpi.com/article/10.3390/insects12060524/s1, Table S1. Detail of software and kit.
Author Contributions
Conceptualization, J.L. (Jing Li), J.L. (Jing Liu) and Y.W.; methodology, J.L. (Jing Liu) and R.Z.; software, C.S.; validation, W.L.; formal Analysis, J.L. (Jing Liu) and C.S.; investigation, R.Z. and W.L.; resources, M.B; data curation, Y.W.; writing—original draft preparation, J.L. (Jing Liu); writing—review and editing, J.L. (Jing Li) and Y.W.; visualization, M.B.; project administration, J.L. (Jing Li) and M.B.; funding acquisition, M.B. All authors have read and agreed to the published version of the manuscript.
Funding
This research was funded by the National Natural Science Foundation of China (no. 31750002 and no. 31900341).
Informed Consent Statement
Not applicable.
Data Availability Statement
The data that support the findings of this study are openly available in National Center for Biotechnology Information at https://www.ncbi.nlm.nih.gov/nuccore (accessed on 23 April 2021), reference numbers MZ014622−MZ014624. The PCG123R dataset is available in MendeleyData at http://data.mendeley.com/datasets/v5tsxvz9vf/1 (accessed on 25 May 2021) (DOI: 10.17632/v5tsxvz9vf.2).
Acknowledgments
The authors thank Yimei Jin (Hebei Agricultural University, China) for her help. Thanks Xinglong Bai (Hebei University, China) and Xu Yan for providing the specimens.
Conflicts of Interest
The authors declare no conflict of interest.
References
- Leschen, R.A.B.; Skelley, P.E.; McHugh, J.V. Erotylidae Leach 1785. In Band/Volume IV arthropoda: Insectateilband/part 38. Coleoptera, beetles, Volume 2. Morphology and systematics (Polyphagapartim); Leschen, R.A.B., Beutel, R.G., Lawrence, J.F., Eds.; Handbuch der Zoologie/Handbook of Zoology; W. DeGruyter: Berlin, Germany, 2010; pp. 311–319. [Google Scholar]
- Leschen, R.A.B.; Buckley, T.R. Multistate Characters and Diet Shifts: Evolution of Erotylidae (Coleoptera). Syst. Biol. 2007, 56, 97–112. [Google Scholar] [CrossRef] [Green Version]
- Latreille, P.A. Histoire Naturelle, Générale et particulière des Crustacéset des Insectes; De L’Imprimere de F. Dufart: Paris, France, 1802; p. 467. [Google Scholar]
- Leschen, R.A.B.; Lawrence, J.F.; Ślipiński, S.A. Classification of basal Cucujoidea (Coleoptera:Polyphaga): Cladistic analysis, keys and review of new families. Invertebr. Syst. 2005, 19, 17–73. [Google Scholar] [CrossRef]
- Lawrence, J.F.; Newton, A.F. Evolution and Classification of Beetles. Annu. Rev. Ecol. Syst. 1982, 13, 261–290. [Google Scholar] [CrossRef] [Green Version]
- Leschen, R.A.B.; Beutel, R.G.; Lawrence, J.F.; Ślipiński, A. Coleoptera, Beetles, Volume 2, Morphology and Systematics (Elateroidea, Bostrichiformia, Cucujiformia partim); Handbook of Zoology; De Gruyter: Berlin, Germany; New York, NY, USA, 2011. [Google Scholar] [CrossRef]
- McElrath, T.; Robertson, J.A.; Thomas, M.C.; Osborne, J.T.; Miller, K.B.; McHugh, J.; Whiting, M.F. A molecular phylogenetic study of Cucujidae s.l. (Coleoptera: Cucujoidea). Syst. Èntomol. 2015, 40, 705–718. [Google Scholar] [CrossRef]
- Hunt, T.; Bergsten, J.; Gómez-Zurita, J.; Ribera, I.; Barraclough, T.G.; Bocakova, M.; Bocak, L.; Vogler, A.P.; Levkanicova, Z.; Papadopoulou, A.; et al. A Comprehensive Phylogeny of Beetles Reveals the Evolutionary Origins of a Superradiation. Science 2007, 318, 1913–1916. [Google Scholar] [CrossRef]
- Bocak, L.; Barton, C.; Crampton-Platt, A.; Chesters, D.; Ahrens, D.; Vogler, A.P. Building the Coleoptera tree-of-life for >8000 species: Composition of public DNA data and fit with Linnaean classification. Syst. Èntomol. 2013, 39, 97–110. [Google Scholar] [CrossRef]
- Lawrence, J.F.; Ślipiński, A.; Seago, A.E.; Thayer, M.K.; Newton, A.F.; Marvaldi, A.E. Phylogeny of the Coleoptera Based on Morphological Characters of Adults and Larvae. Ann. Zool. 2011, 61, 1–217. [Google Scholar] [CrossRef]
- Crotch, G.R. A revision of the Coleopterous Family Erotylidae. Cistula Entomol. 1876, 1, 359–572. [Google Scholar]
- Leschen, R.A.B. Erotylidae (Insecta: Coleoptera: Cucujoidea): Phylogeny and review. Fauna N. Z. 2003, 47, 108. [Google Scholar]
- Wegrzynowicz, P. Morphology, phylogeny and classification of the family Erotylidae based on adult characters (Coleoptera: Cucujoidea). Genus 2002, 13, 314–319. [Google Scholar] [CrossRef]
- Robertson, J.A.; McHugh, J.V.; Whiting, M.F. A molecular phylogenetic analysis of the pleasing fungus beetles (Coleoptera: Erotylidae): Evolution of colour patterns, gregariousness and mycophagy. Syst. Èntomol. 2004, 29, 173–187. [Google Scholar] [CrossRef]
- Arrow, G.J. Coleoptera. Clavicornia. Erotylidae, Languriidae, and Endomychidae. In The Fauna of British India, including Ceylon and Burma; Taylor and Francis: London, UK, 1925; p. 416. [Google Scholar]
- Crowson, R.A. The Natural Classification of the Families of Coleoptera; Nathaniel Lloyd: London, UK, 1955; p. 187. [Google Scholar]
- Sen, G.T.; Crowson, R.A. A review of classification of the family Languriidae (Coleoptera: Clavicornia) and the place of Languriidae in the natural system of Clavicornia. Mem. Zool. Surv. India 1971, 15, 1–42. [Google Scholar]
- Leschen, R.A.B. Phylogeny and revision of genera of Cryptophagidae (Coleoptera: Cucujoidea). Kans. Sci. Bull. 1996, 55, 549–643. [Google Scholar]
- Drilling, K.; Dettner, K.; Klass, K.-D. Morphology of the pronotal compound glands in Tritoma bipustulata (Coleoptera: Erotylidae). Org. Divers. Evol. 2010, 10, 205–214. [Google Scholar] [CrossRef]
- Wolstenholme, D.R.; Clary, D.O. Sequenece evolution of drosophila mitochondrial DNA. Genetics 1985, 109, 725–744. [Google Scholar] [CrossRef] [PubMed]
- Sankoff, D.; Leduc, G.; Antoine, N.; Paquin, B.; Lang, B.F.; Cedergren, R. Gene order comparisons for phylogenetic inference: Evolution of the mitochondrial genome. Proc. Natl. Acad. Sci. USA 1992, 89, 6575–6579. [Google Scholar] [CrossRef] [PubMed] [Green Version]
- Saccone, C.; De Giorgi, C.; Gissi, C.; Pesole, G.; Reyes, A. Evolutionary genomics in Metazoa: The mitochondrial DNA as a model system. Gene 1999, 238, 195–209. [Google Scholar] [CrossRef]
- Mauro, D.S.; Gower, D.J.; Zardoya, R.; Wilkinson, M. A Hotspot of Gene Order Rearrangement by Tandem Duplication and Random Loss in the Vertebrate Mitochondrial Genome. Mol. Biol. Evol. 2005, 23, 227–234. [Google Scholar] [CrossRef]
- Cameron, S.L.; Lo, N.; Bourguignon, T.; Svenson, G.J.; Evans, T. A mitochondrial genome phylogeny of termites (Blattodea: Termitoidae): Robust support for interfamilial relationships and molecular synapomorphies define major clades. Mol. Phylogenetics Evol. 2012, 65, 163–173. [Google Scholar] [CrossRef] [Green Version]
- Chûjô, M. Descriptions of some new Erotylidae (Coleoptera) from the Japanese Empire. Jpn. J. Entomol. 1941, 15, 10–21. [Google Scholar]
- Miwa, Y. On the Erotylidae of Japan, Formosa, Corea and Saghalien. Trans. Nat. Hist. Soc. Taihoku 1929, 19, 124–127. [Google Scholar]
- Heller, K.M. Beitrag zur Kenntnis der Erotyliden der Indo-Australischen Region mit besonderer Berücksichtigung der Philippinischen Arten. Arch. Nat. 1918, 8, 79–80. [Google Scholar]
- Chen, S.; Zhou, Y.; Chen, Y.; Gu, J. fastp: An ultra-fast all-in-one FASTQ preprocessor. Bioinformatics 2018, 34, i884–i890. [Google Scholar] [CrossRef]
- Meng, G.; Li, Y.; Yang, C.; Liu, S. MitoZ: A toolkit for animal mitochondrial genome assembly, annotation and visualization. Nucleic Acids Res. 2019, 47, e63. [Google Scholar] [CrossRef] [PubMed]
- Schattner, P.; Brooks, A.N.; Lowe, T.M. The tRNAscan-SE, snoscan and snoGPS web servers for the detection of tRNAs and snoRNAs. Nucleic Acids Res. 2005, 33, W686–W689. [Google Scholar] [CrossRef] [PubMed]
- Bellaousov, S.; Reuter, J.S.; Seetin, M.G.; Mathews, D.H. RNAstructure: Web servers for RNA secondary structure prediction and analysis. Nucleic Acids Res. 2013, 41, W471–W474. [Google Scholar] [CrossRef] [Green Version]
- Kearse, M.; Moir, R.; Wilson, A.; Stones-Havas, S.; Cheung, M.; Sturrock, S.; Buxton, S.; Cooper, A.; Markowitz, S.; Duran, C.; et al. Geneious Basic: An integrated and extendable desktop software platform for the organization and analysis of sequence data. Bioinformatics 2012, 28, 1647–1649. [Google Scholar] [CrossRef] [PubMed]
- Kumar, S.; Stecher, G.; Tamura, K. MEGA7: Molecular Evolutionary Genetics Analysis Version 7.0 for Bigger Datasets. Mol. Biol. Evol. 2016, 33, 1870–1874. [Google Scholar] [CrossRef] [PubMed] [Green Version]
- Perna, N.; Kocher, T. Patterns of nucleotide composition at fourfold degenerate sites of animal mitochondrial genomes. J. Mol. Evol. 1995, 41, 353–358. [Google Scholar] [CrossRef]
- Wang, D.; Zhang, Y.; Zhang, Z.; Zhu, J.; Yu, J. KaKs_Calculator 2.0: A Toolkit Incorporating Gamma-Series Methods and Sliding Window Strategies. Genom. Proteom. Bioinform. 2010, 8, 77–80. [Google Scholar] [CrossRef] [Green Version]
- Robertson, J.A.; Ślipiński, A.; Moulton, M.; Shockley, F.; Giorgi, A.; Lord, N.; McKenna, D.D.; Tomaszewska, W.; Forrester, J.; Miller, K.B.; et al. Phylogeny and classification of Cucujoidea and the recognition of a new superfamily Coccinelloidea (Coleoptera: Cucujiformia). Syst. Èntomol. 2015, 40, 745–778. [Google Scholar] [CrossRef]
- Johnson, P.J.; Löbl, I.; Smetana, A. Catalogue of Palaearctic Coleoptera. Volume 3: Scarabaeoidea–Scirtoidea–Dascilloidea–Buprestoidea–Byrrhoidea; and Volume 4: Elateroidea–Derodontoidea–Bostrichoidea–Lymexyloidea–Cleroidea–Cucujoidea. Ann. Èntomol. Soc. Am. 2009, 102, 735–736. [Google Scholar] [CrossRef] [Green Version]
- Thompson, J.D.; Gibson, T.J.; Plewniak, F.; Jeanmougin, F.; Higgins, D.G. The CLUSTAL_X windows interface: Flexible strategies for multiple sequence alignment aided by quality analysis tools. Nucleic Acids Res. 1997, 25, 4876–4882. [Google Scholar] [CrossRef] [Green Version]
- Lartillot, N.; Lepage, T.; Blanquart, S. PhyloBayes 3: A Bayesian software package for phylogenetic reconstruction and molecular dating. Bioinformatics 2009, 25, 2286–2288. [Google Scholar] [CrossRef] [Green Version]
- Lartillot, N.; Philippe, H. A Bayesian Mixture Model for Across-Site Heterogeneities in the Amino-Acid Replacement Process. Mol. Biol. Evol. 2004, 21, 1095–1109. [Google Scholar] [CrossRef] [PubMed]
- Cai, C.; Tihelka, E.; Pisani, D.; Donoghue, P.C. Data curation and modeling of compositional heterogeneity in insect phylogenomics: A case study of the phylogeny of Dytiscoidea (Coleoptera: Adephaga). Mol. Phylogenetics Evol. 2020, 147, 106782. [Google Scholar] [CrossRef]
- Timmermans, M.J.T.N.; Barton, C.; Haran, J.; Ahrens, D.; Culverwell, L.; Ollikainen, A.; Dodsworth, S.; Foster, P.; Bocak, L.; Vogler, A.P. Family-Level Sampling of Mitochondrial Genomes in Coleoptera: Compositional Heterogeneity and Phylogenetics. Genome Biol. Evol. 2016, 8, 161–175. [Google Scholar] [CrossRef] [Green Version]
- Nguyen, L.-T.; Schmidt, H.A.; Von Haeseler, A.; Minh, B.Q. IQ-TREE: A Fast and Effective Stochastic Algorithm for Estimating Maximum-Likelihood Phylogenies. Mol. Biol. Evol. 2015, 32, 268–274. [Google Scholar] [CrossRef] [PubMed]
- Zhang, D.; Gao, F.; Jakovlić, I.; Zhou, H.; Zhang, J.; Li, W.X.; Wang, G.T. PhyloSuite: An integrated and scalable desktop platform for streamlined molecular sequence data management and evolutionary phylogenetics studies. Mol. Ecol. Resour. 2019, 20, 348–355. [Google Scholar] [CrossRef]
- Kalyaanamoorthy, S.; Minh, B.Q.; Wong, T.; Von Haeseler, A.; Jermiin, L.S. ModelFinder: Fast model selection for accurate phylogenetic estimates. Nat. Methods 2017, 14, 587–589. [Google Scholar] [CrossRef] [Green Version]
- Minh, B.Q.; Nguyen, M.A.T.; Von Haeseler, A. Ultrafast Approximation for Phylogenetic Bootstrap. Mol. Biol. Evol. 2013, 30, 1188–1195. [Google Scholar] [CrossRef] [PubMed]
- Rambaut, A. FigTree. Institute of Evolutionary Biology; University of Edinburgh: Edinburgh, UK, 2009; Available online: http://tree.bio.ed.ac.uk/software/figtree (accessed on 25 May 2021).
- Nie, R.E.; Yang, X.K. Research progress in mitochondrial genomes of Coleoptera. Acta Entomol. Sin. 2014, 57, 860–868. [Google Scholar]
- Hassanin, A. Phylogeny of Arthropoda inferred from mitochondrial sequences: Strategies for limiting the misleading effects of multiple changes in pattern and rates ofsubstitution. Mol. Phylogenetics Evol. 2006, 38, 100–116. [Google Scholar] [CrossRef]
- Wolstenholme, D.R. Animal Mitochondrial DNA: Structure and Evolution. Int. Rev. Cytol. 1992, 141, 173–216. [Google Scholar] [CrossRef]
- Hurst, L.D. The Ka/Ks ratio: Diagnosing the form of sequence evolution. Trends Genet. 2002, 18, 486–487. [Google Scholar] [CrossRef]
- Mori, S.; Matsunami, M. Signature of positive selection in mitochondrial DNA in Cetartiodactyla. Genes Genet. Syst. 2018, 93, 65–73. [Google Scholar] [CrossRef] [Green Version]
- Yuan, L.; Ge, X.; Xie, G.; Liu, H.; Yang, Y. First Complete Mitochondrial Genome of Melyridae (Coleoptera, Cleroidea): Genome Description and Phylogenetic Implications. Insects 2021, 12, 87. [Google Scholar] [CrossRef] [PubMed]
- Zhang, D.-X.; Szymura, J.M.; Hewitt, G.M. Evolution and structural conservation of the control region of insect mitochondrial DNA. J. Mol. Evol. 1995, 40, 382–391. [Google Scholar] [CrossRef] [PubMed]
- Zhang, D.-X.; Hewitt, G.M. Insect mitochondrial control region: A review of its structure, evolution and usefulness in evolutionary studies. Biochem. Syst. Ecol. 1997, 25, 99–120. [Google Scholar] [CrossRef]
- Zhang, S.-Q.; Che, L.-H.; Li, Y.; Liang, D.; Pang, H.; Ślipiński, A.; Zhang, P. Evolutionary history of Coleoptera revealed by extensive sampling of genes and species. Nat. Commun. 2018, 9, 1–11. [Google Scholar] [CrossRef] [Green Version]
Figure 1.
Mitochondrial map of T. metasobrina, E. opaca, N. Arisana, and Languriinae sp. The tRNAs, rRNAs, and PCGs are denoted by the color blocks. Genes outside the map are transcribed clockwise, whereas those inside are transcribed counterclockwise.
Figure 1.
Mitochondrial map of T. metasobrina, E. opaca, N. Arisana, and Languriinae sp. The tRNAs, rRNAs, and PCGs are denoted by the color blocks. Genes outside the map are transcribed clockwise, whereas those inside are transcribed counterclockwise.

Figure 2.
Relative synonymous codon usage (RSCU) of 4 species. Codon families are provided on the x-axis.
Figure 2.
Relative synonymous codon usage (RSCU) of 4 species. Codon families are provided on the x-axis.

Figure 3.
Genetic distance (on average) and non-synonymous (Ka) to synonymous (Ks) substitution rates of 13 PCGs among these 4 species.
Figure 3.
Genetic distance (on average) and non-synonymous (Ka) to synonymous (Ks) substitution rates of 13 PCGs among these 4 species.

Figure 4.
Inferred secondary structures of 22 tRNAs of 4 species. The tRNAs are labeled with the abbreviations of their corresponding amino acids. Dash (–) indicates Watson-Crick bonds and symbol (+) indicates GU bonds.
Figure 4.
Inferred secondary structures of 22 tRNAs of 4 species. The tRNAs are labeled with the abbreviations of their corresponding amino acids. Dash (–) indicates Watson-Crick bonds and symbol (+) indicates GU bonds.

Figure 5.
Phylogenetic relationships among Cucujoidea. Shown here is the phylogeny inferred from the AA dataset using PhyloBayes with the CAT-Poisson model. Analyses of the PCG123R dataset using both IQ-Tree with the GTR + F + I + G4 model and PhyloBayes with the CAT-GTR model obtained the same topology as shown here. The first values at each node represent the posterior probabilities from PhyloBayes analysis of the AA dataset with the CAT-Poisson, the second represents the posterior probabilities from PhyloBayes analysis of the PCG123R dataset with the CAT-GTR model, and the third values represent bootstrap supports from IQ-Tree analysis of the PCG123R dataset with the GTR + F + I + G4 model.


Table 1.
List of taxonomic groups used for the phylogenetic analyses in this study.
| Family | Species | Accession No. | Size (bp) |
|---|---|---|---|
| Ingroups | |||
| Cryptophagidae | Micrambe villosus | KX087317.1 | 17,907 bp |
| Cucujidae | Cucujus haematodes | KX087268.1 | 16,120 bp |
| Laemophloeidae | Cryptolestes ferrugineus | KT182067.1 | 15,511 bp |
| Monotomidae | Monotoma quadricollis | NC036266.1 | 16,064 bp |
| Monotomidae | Rhizophagus aeneus | KX087340.1 | 16,454 bp |
| Monotomidae | Rhizophagus dispar | KX035133.1 | 13,423 bp |
| Nitidulidae | Epuraea guttata | KX087289.1 | 16,021 bp |
| Nitidulidae | Glischrochilus hortensis | JX412778.1 | 10,677 bp |
| Silvanidae | Silvanus bidentatus | KX035145.1 | 17,220 bp |
| Silvanidae | Uleiota sp. | KX035149.1 | 14,967 bp |
| Erotylidae | Languriinae sp. | MG193464.1 | 16,082 bp |
| Erotylidae | Loberonotha olivascens | JX412784.1 | 13,039 bp |
| Erotylidae | Tritoma metasobrina | MZ014622 | 16,502 bp |
| Erotylidae | Episcapha opaca | MZ014623 | 15,581 bp |
| Erotylidae | Neotriplax arisana | MZ014624 | 16,478 bp |
| Outgroups | |||
| Curculionidae | Cyclorhipidion bodoanus | NC036295.1 | 15,899 bp |
| Chrysomelidae | Calomicrus pinicola | KX087334.1 | 15,908 bp |
Table 2.
Annotation of the mitochondrial genome of T. metasobrina, E. opaca, N. arisana, and Languriinae sp.
Table 2.
Annotation of the mitochondrial genome of T. metasobrina, E. opaca, N. arisana, and Languriinae sp.
| Gene | Strand | Location | Length (bp) | Anticodon | Codon | Intergenic Sequence (bp) | ||
|---|---|---|---|---|---|---|---|---|
| Start | End | Start | Stop | |||||
| tRNAIle | J | 1 | 74/63/67/63 | 74/63/67/63 | CAT | 145/61/−3/2 | ||
| TrnaGln | N | 220/125/65/66 | 288/193/133/134 | 69 | TTG | 3/0/3/3 | ||
| tRNAMet | J | 292/194/137/138 | 360/262/205/206 | 69 | GAT | 33/18/18/21 | ||
| ND2 | J | 394/281/224/228 | 1369/1271/1217/1221 | 976/991/994/994 | ATA/ATA/ATC/ATA | T-tRNA | 0 | |
| tRNATrp | J | 1370/1272/1218/1222 | 1437/1334/1284/1287 | 68/63/67/66 | TCA | 0/−8/−1/−1 | ||
| tRNACys | N | 1438/1327/1284/1287 | 1501/1389/1348/1350 | 64/63/65/64 | GCA | 21/0/1/2 | ||
| tRNATyr | N | 1523/1390/1350/1353 | 1588/1452/1414/1418 | 66/63/65/66 | GTA | −8/0/1/10 | ||
| COXI | J | 1581/1453/1416/1429 | 3120/2987/2946/2950 | 1540/1535/1531/1522 | ATT/TTG/ATT/TTG | T-tRNA | 0 | |
| tRNALeu(UUR) | J | 3121/2988/2947/2951 | 3185/3051/3011/3015 | 65/64/65/65 | TAA | 18/0/18/0 | ||
| COXII | J | 3204/3052/3030/3016 | 3876/3738/3695/3700 | 673/687/666/685 | ATA/ATT/ATT/ATT | T-tRNA/TAA/TAA/T-tRNA | 0/1/2/0 | |
| tRNALys | J | 3877/3740/3698/3701 | 3947/3809/3767/3770 | 71/70/70/70 | CTT | −1/−1/0/0 | ||
| tRNAAsp | J | 3947/3809/3768/3771 | 4012/3873/3833/3836 | 66/65/66/66 | GTC | 25/18/32/0 | ||
| ATP8 | J | 4038/3892/3866/3837 | 4193/4047/4021/3992 | 156 | ATT/ATT/ATT/ATC | TAA/TAA/TAA/TAG | −4/−7/−4/−7 | |
| ATP6 | J | 4190/4041/4018/3986 | 4855/4712/4683/4657 | 666/672/666/672 | ATA/ATG/ATA/ATG | TAA | −1 | |
| COXIII | J | 4855/4712/4683/4657 | 5642/5498/5469/5445 | 788/787/787/789 | ATG | TA-tRNA/T-tRNA/T-tRNA/TAA | 0/0/0/6 | |
| tRNAGly | J | 5643/5499/5470/5452 | 5708/5561/5534/5517 | 66/63/65/66 | TCC | 9/30/12/0 | ||
| ND3 | J | 5718/5592/5547/5518 | 6062/5913/5886/5871 | 345/322/340/354 | ATA/ATA/ATA/ATT | TAA/T-tRNA/T-tRNA/TAA | 5/0/0/2 | |
| tRNAAla | J | 6068/5914/5887/5874 | 6132/5980/5955/5939 | 65/67/69/66 | TGC | −1 | ||
| tRNAArg | J | 6132/5980/5955/5939 | 6196/6042/6018/6002 | 65/63/64/64 | TCG | −1 | ||
| tRNAAsn | J | 6196/6042/6018/6002 | 6259/6105/6081/6067 | 64/64/64/66 | GTT | 0 | ||
| tRNASer(AGN) | J | 6260/6106/6082/6068 | 6327/6171/6148/6134 | 68/66/67/67 | GCT | 1/0/0/0 | ||
| tRNAGlu | J | 6329/6172/6149/6135 | 6392/6233/6213/6197 | 64/62/65/63 | TTC | −2/−2/−2/15 | ||
| tRNAPhe | N | 6391/6232/6212/6213 | 6455/6293/6277/6277 | 65/62/66/65 | GAA | 0 | ||
| ND5 | N | 6456/6294/6278/6278 | 8124/7968/7901/7991 | 1669/1675/1624/1714 | ATT/ATA/ATA/GTG | T-tRNA | 45/39/90/0 | |
| tRNAHis | N | 8170/8008/7992/7992 | 8233/8068/8055/8055 | 64/61/64/64 | GTG | 0 | ||
| ND4 | N | 8234/8069/8056/8056 | 9568/9401/9388/9388 | 1335/1333/1333/1333 | ATG | TAA/T-tRNA/T-tRNA/T-tRNA | −7 | |
| ND4L | N | 9562/9395/9382/9382 | 9843/9676/9663/9669 | 282/282/282/288 | ATT/ATA/ATT/ATG | TAA | 14/8/8/2 | |
| tRNAThr | J | 9858/9685/9672/6972 | 9921/9746/9738/9734 | 64/62/67/63 | TGT | 0 | ||
| tRNAPro | N | 9922/9747/9739/9735 | 9986/9811/9803/9798 | 65/65/65/64 | TGG | 4/1/1/5 | ||
| ND6 | J | 9991/9813/9805/9804 | 10,491/10,313/10,311/10,307 | 501/501/507/504 | ATA | TAA | 6/11/5/−1 | |
| CytB | J | 10,498/10,325/10,317/10,307 | 11,629/11,453/11,452/11,446 | 1132/1129/1136/1140 | ATA/ATT/ATA/ATG | T-tRNA/T-tRNA/TA-tRNA/TAA | 0 | |
| tRNASer(UCN) | J | 11,630/11,454/11,453/11,447 | 11,697/11,520/11,519/11,513 | 68/67/67/67 | TGA | 16/16/25/24 | ||
| ND1 | N | 11,714/11,537/11,545/11,538 | 12,664/12,487/12,495/12,488 | 951 | TTG/TTG/TTG/ATT | TAG | 1 | |
| tRNALeu(CUN) | N | 12,666/12,489/12,497/12,490 | 12,732/12,550/12,561/12,554 | 67/62/65/65 | TAG | 0/29/0/0 | ||
| rrnL | N | 12,733/12,580/12,562/12,555 | 14,009/13,631/13,846/13,933 | 1365/1052/1285/1379 | 0/197/0/0 | |||
| tRNAVal | N | 14,010/13,829/13,847/13,934 | 14,079/13,893/13,916/14,003 | 70/65/70/70 | TAC | 0/0/0/0 | ||
| rrnS | N | 14,080/13,894/13,917/14,004 | 14,850/14,652/14,693/14,777 | 772/759/777/774 | 0 | |||
| A + T rich-region | 14,851/14,653/14,694/14,778 | 16,502/15,581/16,478/16,082 | 1652/929/1785/1305 | 0 | ||||
Note: N and J indicate that the gene was located in the minor (N) and major (J) strand. The ‘/’ indicated that these from left to right were T. metasobrina, E. opaca, N. arisana, and Languriinae sp. Intergenic sequence: positive numbers/negative numbers indicate intergenic/overlapping regions between adjacent genes.
Table 3.
Base composition and strand bias of these four species.
| Species | CG | PCGs | 16S rRNA | 12S rRNA | CR | ||||||||||
|---|---|---|---|---|---|---|---|---|---|---|---|---|---|---|---|
| A + T (%) | AT Skew | GC Skew | A + T (%) | AT Skew | GC Skew | A + T (%) | AT Skew | GC Skew | A + T (%) | AT Skew | GC Skew | A + T (%) | AT Skew | GC Skew | |
| T. metasobrina | 74.80 | 0.04 | −0.29 | 72.90 | 0.04 | −0.25 | 81.70 | 0.05 | −0.31 | 77.90 | 0.05 | −0.34 | 75.50 | 0.04 | −0.66 |
| E. opaca | 78.70 | 0.03 | −0.20 | 77.79 | −0.12 | −0.01 | 80.70 | −0.04 | 0.31 | 81.03 | 0.00 | 0.32 | 81.59 | 0.17 | −0.27 |
| N. arisana | 75.39 | 0.04 | −0.23 | 73.66 | −0.15 | −0.02 | 81.48 | −0.01 | 0.34 | 79.43 | 0.00 | 0.31 | 77.54 | 0.12 | −0.50 |
| * Languriinae sp. | 76.46 | −0.01 | −0.20 | 74.96 | −0.15 | −0.02 | 81.22 | 0.07 | −0.38 | 78.55 | −0.01 | −0.31 | 79.69 | −0.02 | −0.28 |
Note: AT skew = (A − T)/ (A + T), GC skew = (G − C)/ (G + C); CG = complete mitogenome; CR = control region, also called the A + T-rich region; PCGs =13 Protein-coding genes. ‘*’ indicate the sequence downloaded from NCBI, others sequenced in this study.
Publisher’s Note: MDPI stays neutral with regard to jurisdictional claims in published maps and institutional affiliations. |
© 2021 by the authors. Licensee MDPI, Basel, Switzerland. This article is an open access article distributed under the terms and conditions of the Creative Commons Attribution (CC BY) license (https://creativecommons.org/licenses/by/4.0/).
Share and Cite
MDPI and ACS Style
Liu, J.; Wang, Y.; Zhang, R.; Shi, C.; Lu, W.; Li, J.; Bai, M. Three Complete Mitochondrial Genomes of Erotylidae (Coleoptera: Cucujoidea) with Higher Phylogenetic Analysis. Insects 2021, 12, 524. https://doi.org/10.3390/insects12060524
AMA Style
Liu J, Wang Y, Zhang R, Shi C, Lu W, Li J, Bai M. Three Complete Mitochondrial Genomes of Erotylidae (Coleoptera: Cucujoidea) with Higher Phylogenetic Analysis. Insects. 2021; 12(6):524. https://doi.org/10.3390/insects12060524
Chicago/Turabian StyleLiu, Jing, Yuyu Wang, Ruyue Zhang, Chengmin Shi, Weicheng Lu, Jing Li, and Ming Bai. 2021. "Three Complete Mitochondrial Genomes of Erotylidae (Coleoptera: Cucujoidea) with Higher Phylogenetic Analysis" Insects 12, no. 6: 524. https://doi.org/10.3390/insects12060524
Note that from the first issue of 2016, this journal uses article numbers instead of page numbers. See further details here.