Do Termitaria Indicate the Presence of Groundwater? A Case Study of Hydrogeophysical Investigation on a Land Parcel with Termite Activity


Abstract
:Simple Summary
Abstract

1. Introduction
2. Materials and Methods
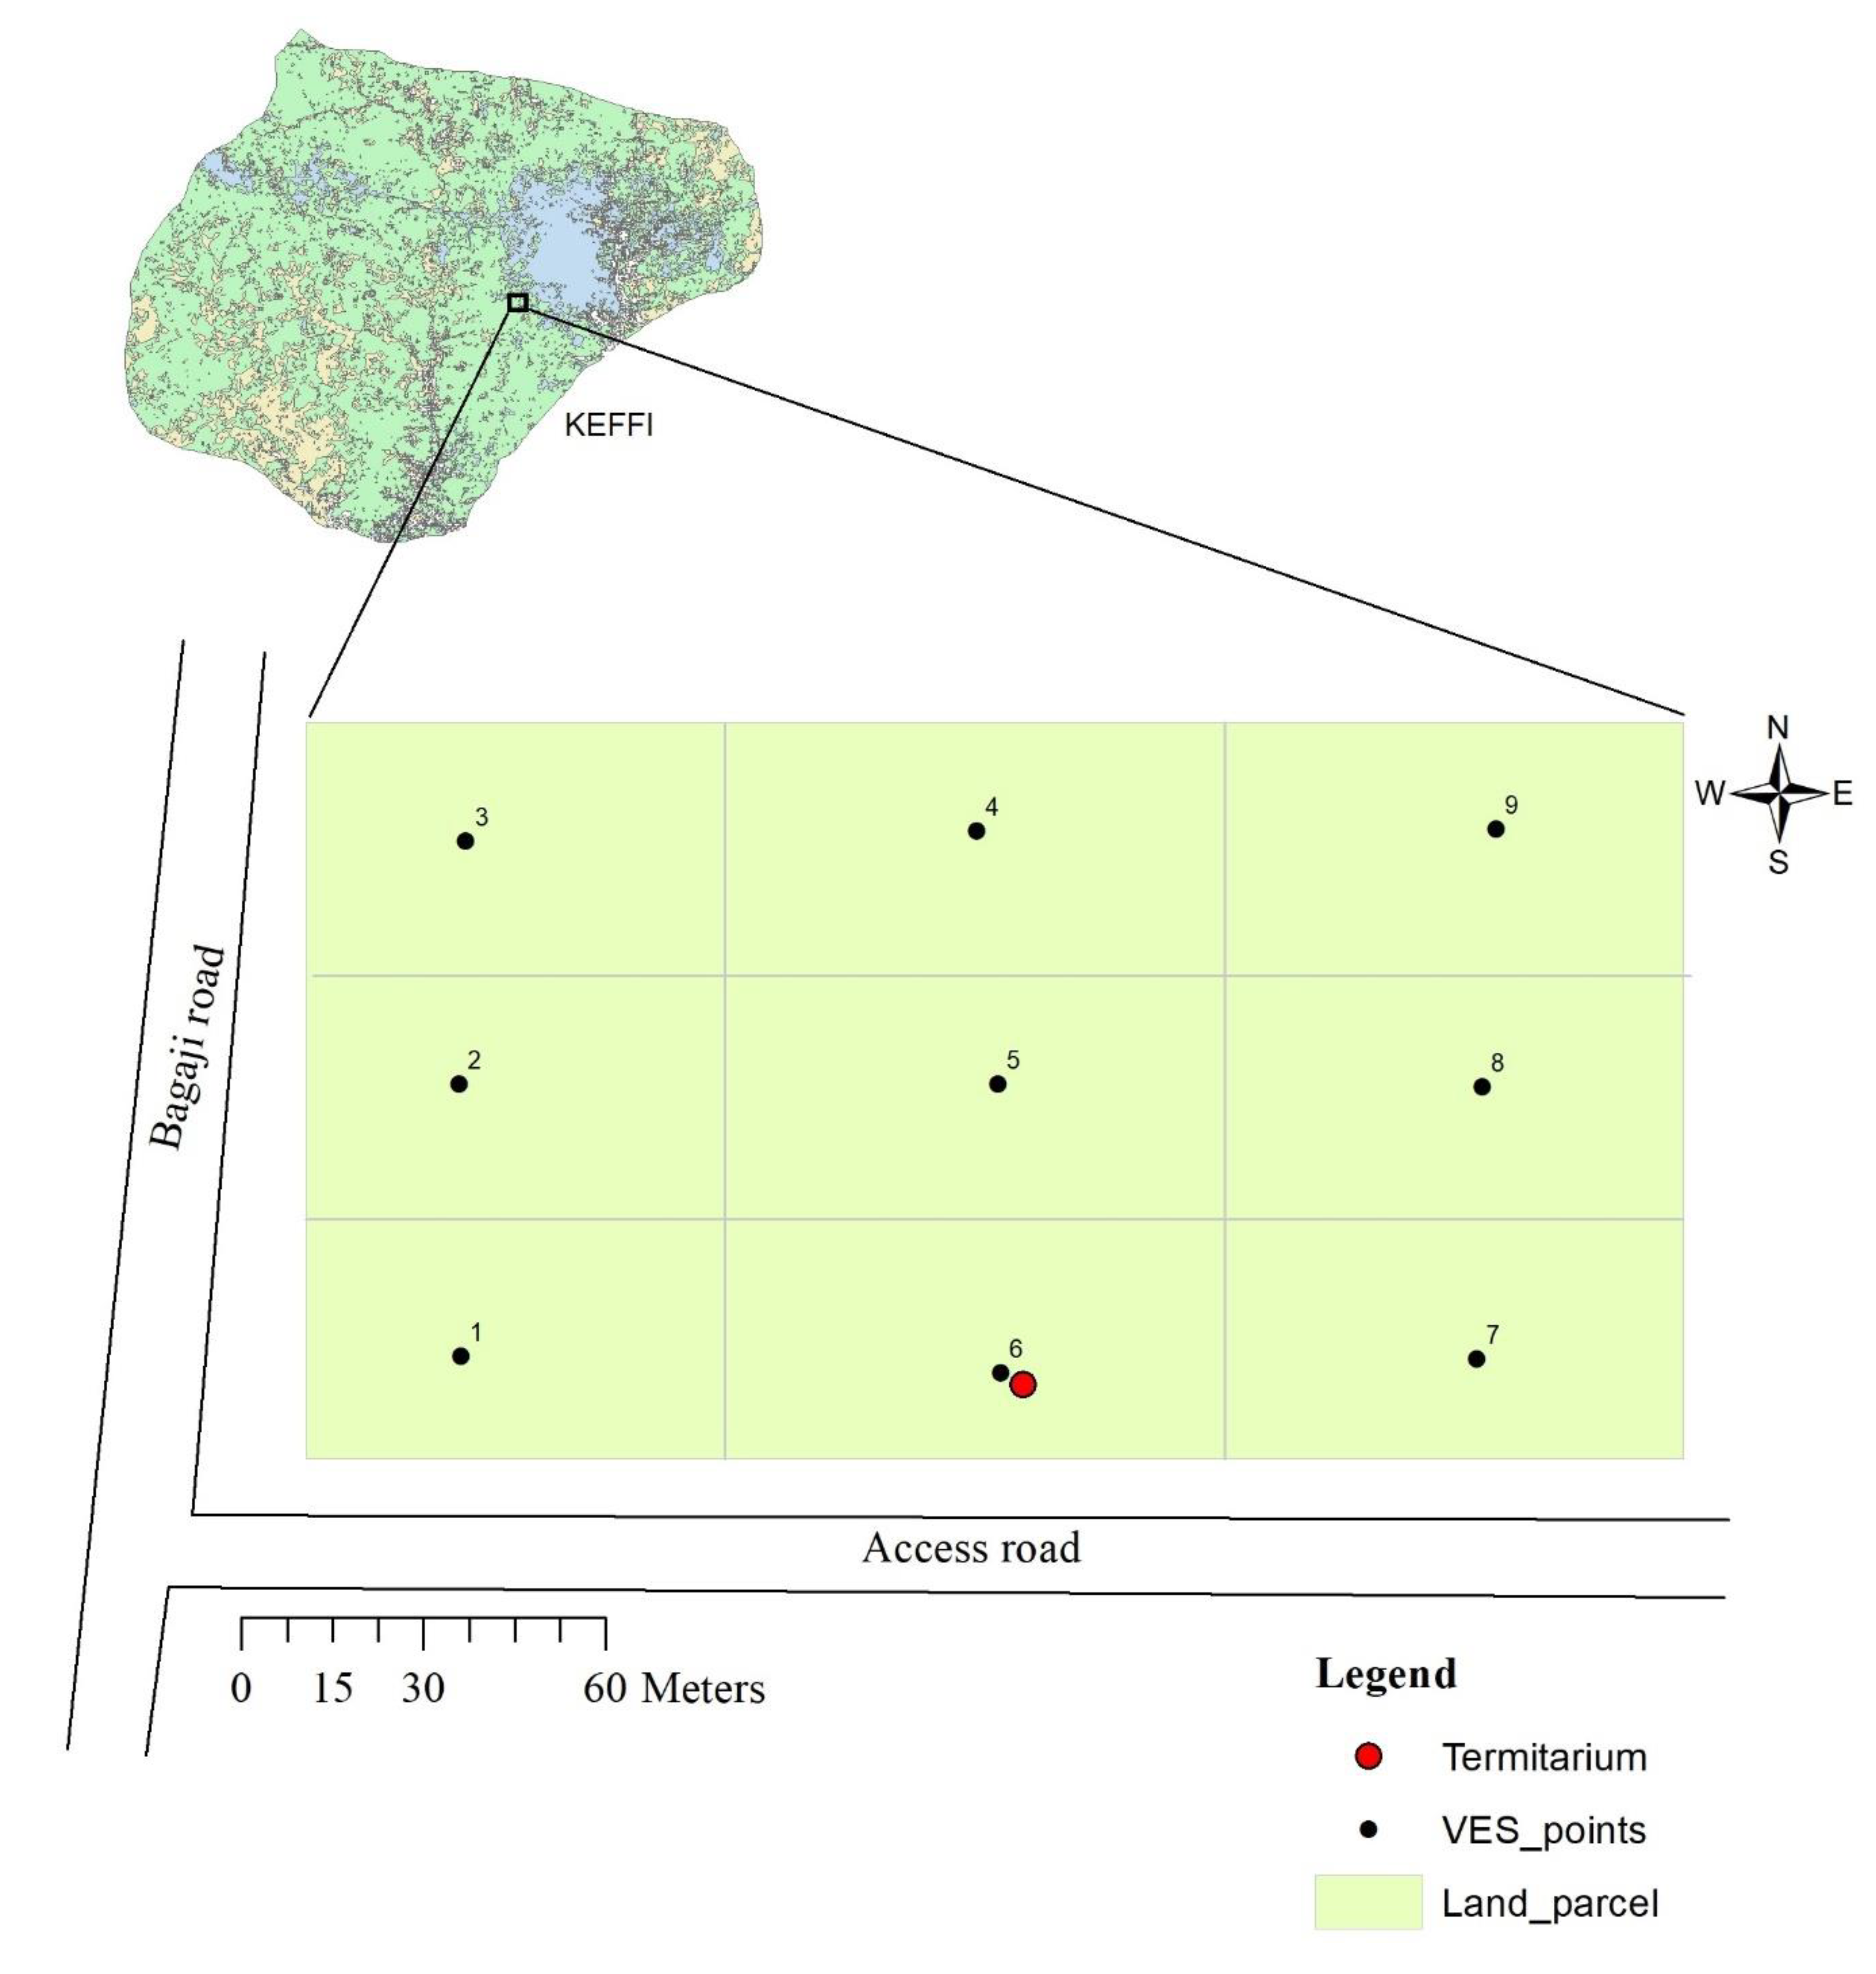
2.1. Study Area
2.2. Geoelectric Data Acquisition
- Field data smoothing, removing electrical noises and matching the generated smoothed field data curves with standard auxiliary curves (e.g., [22]).
- Initial geoelectrical model preparation specifying number of layers, their thicknesses and corresponding resistivity and incorporating the geological and well information of the study area (e.g., [23]).
- Computer iteration to reach the best fit between the smoothed field curve and the calculated one. Thirty (30) iterations were performed on each dataset to produce a root mean square (RMS) error of less than 10% (e.g., [24]).
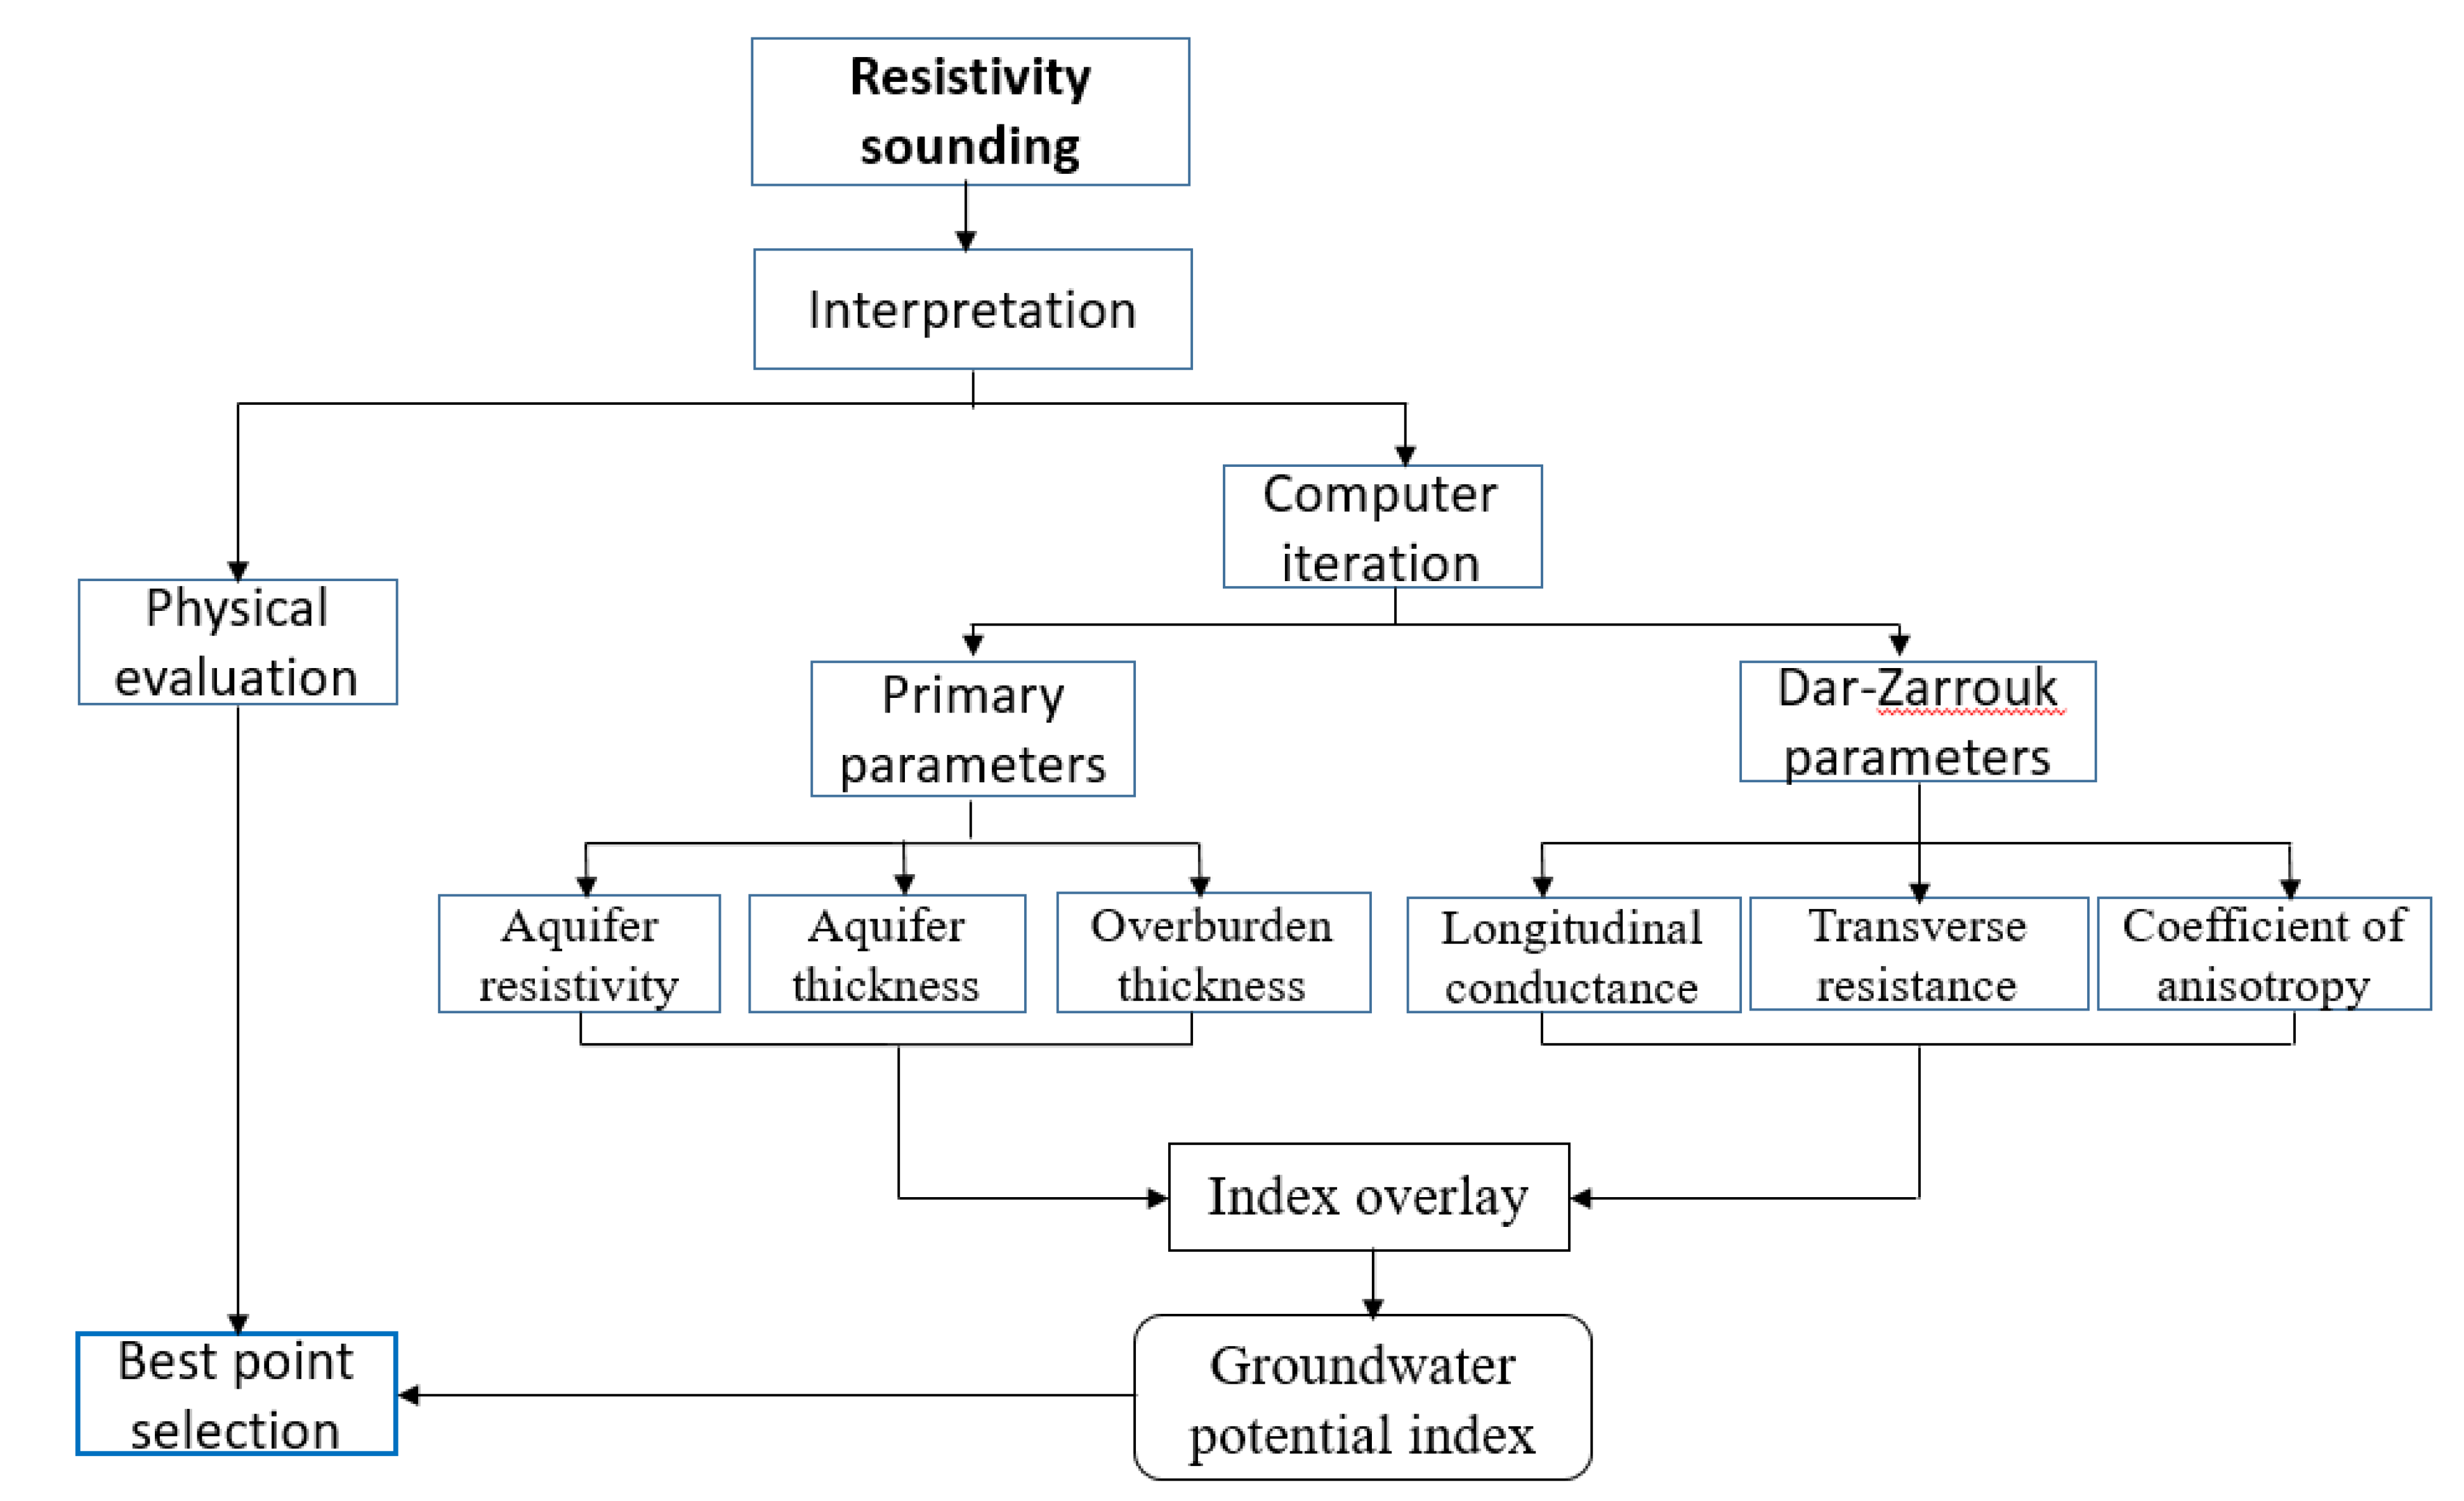
2.3. Geoelectric Parameters
2.4. Groundwater Potential Evaluation
3. Results
3.1. VES Curves
3.2. Physical Evaluation of VES Curves
3.3. Primary Geoelectrical Parameters
3.3.1. Aquifer Layer Resistivity
3.3.2. Aquifer Unit Layer Thickness
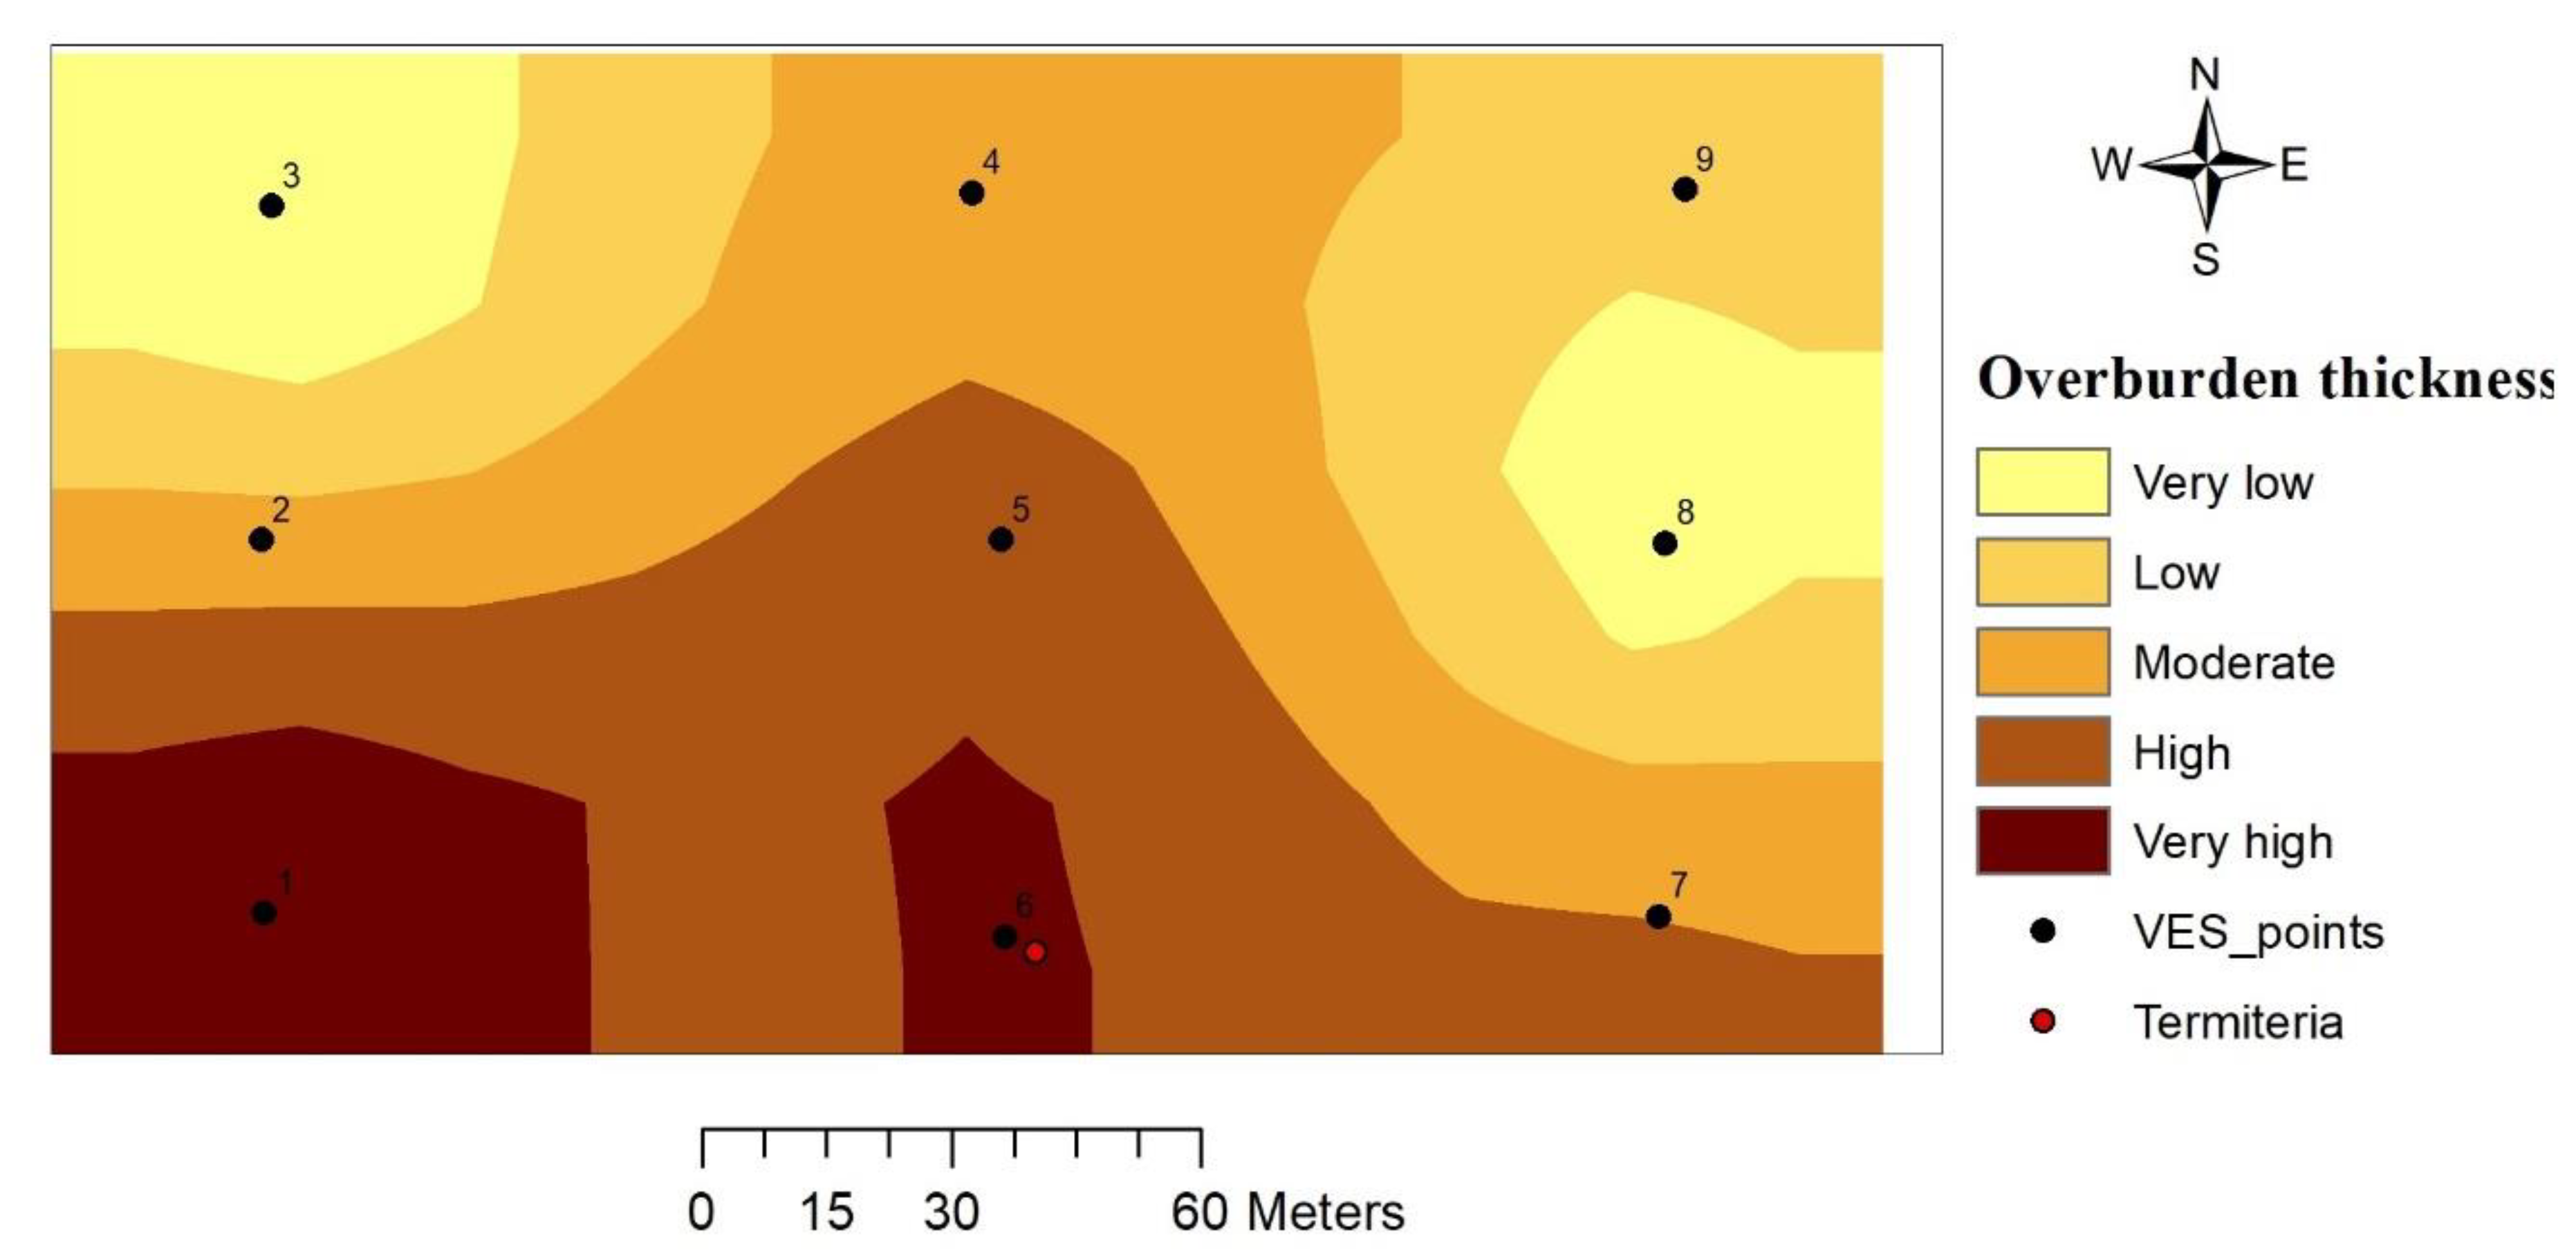
3.3.3. Overburden Thickness
3.4. Secondary Geoelectrical (Dar-Zarrouk) Parameters
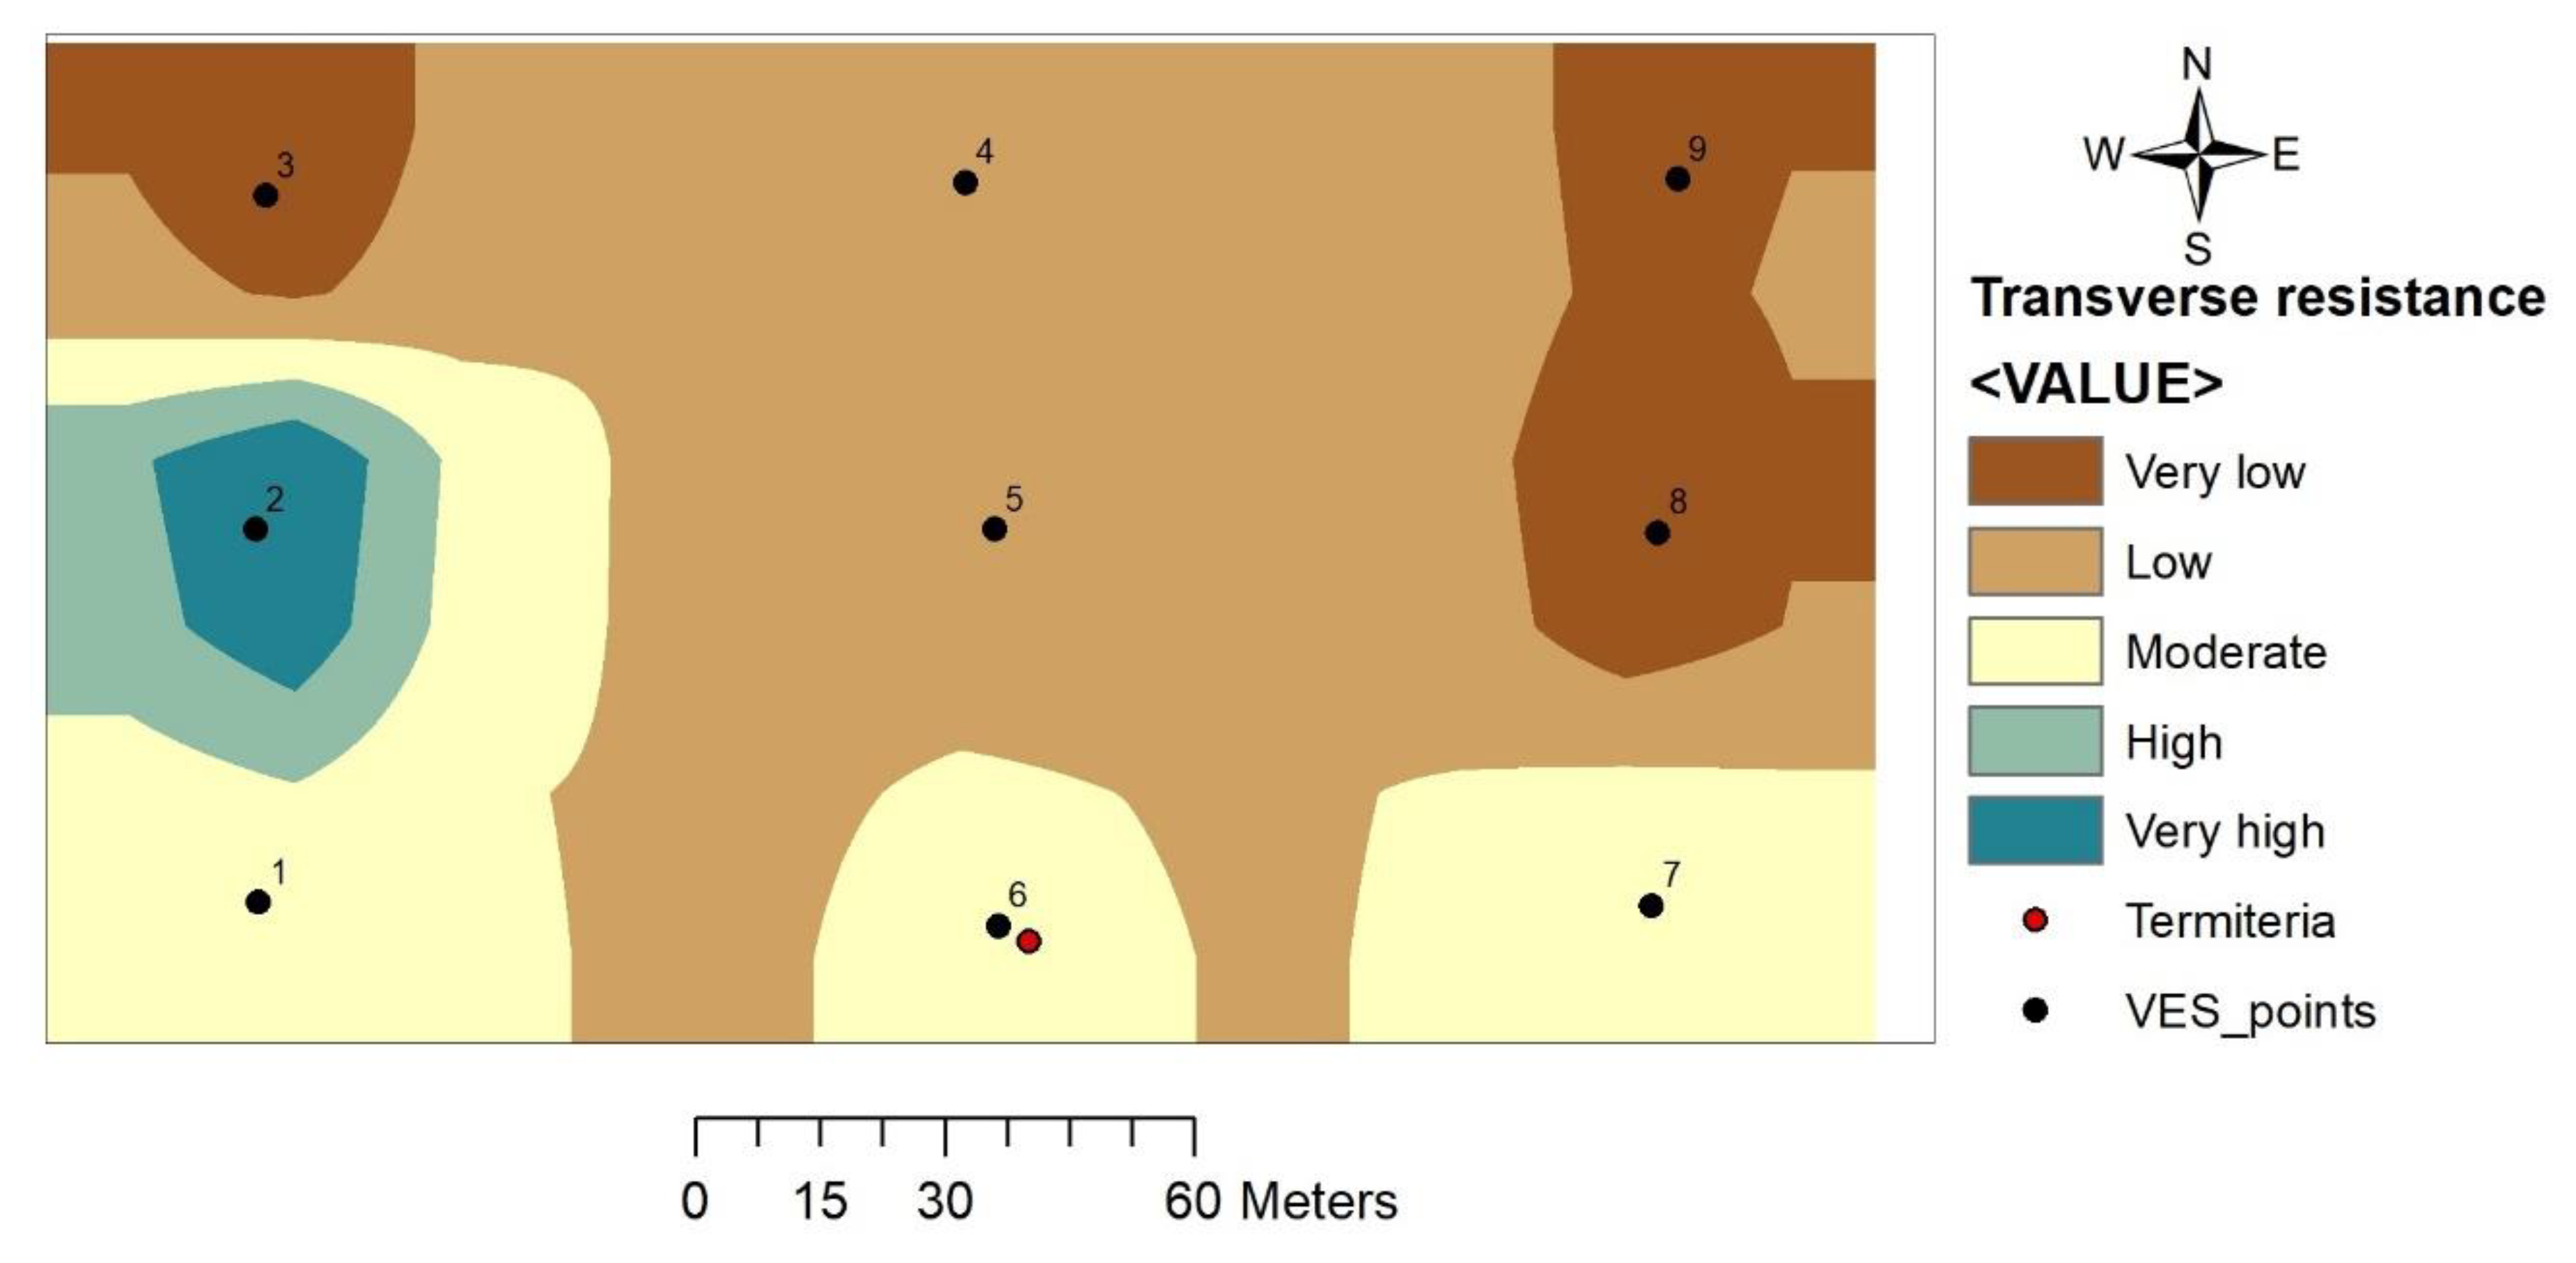
3.4.1. Total Transverse Resistance (T)
3.4.2. Coefficient of Anisotropy (λ)
3.4.3. Longitudinal Conductance (S)
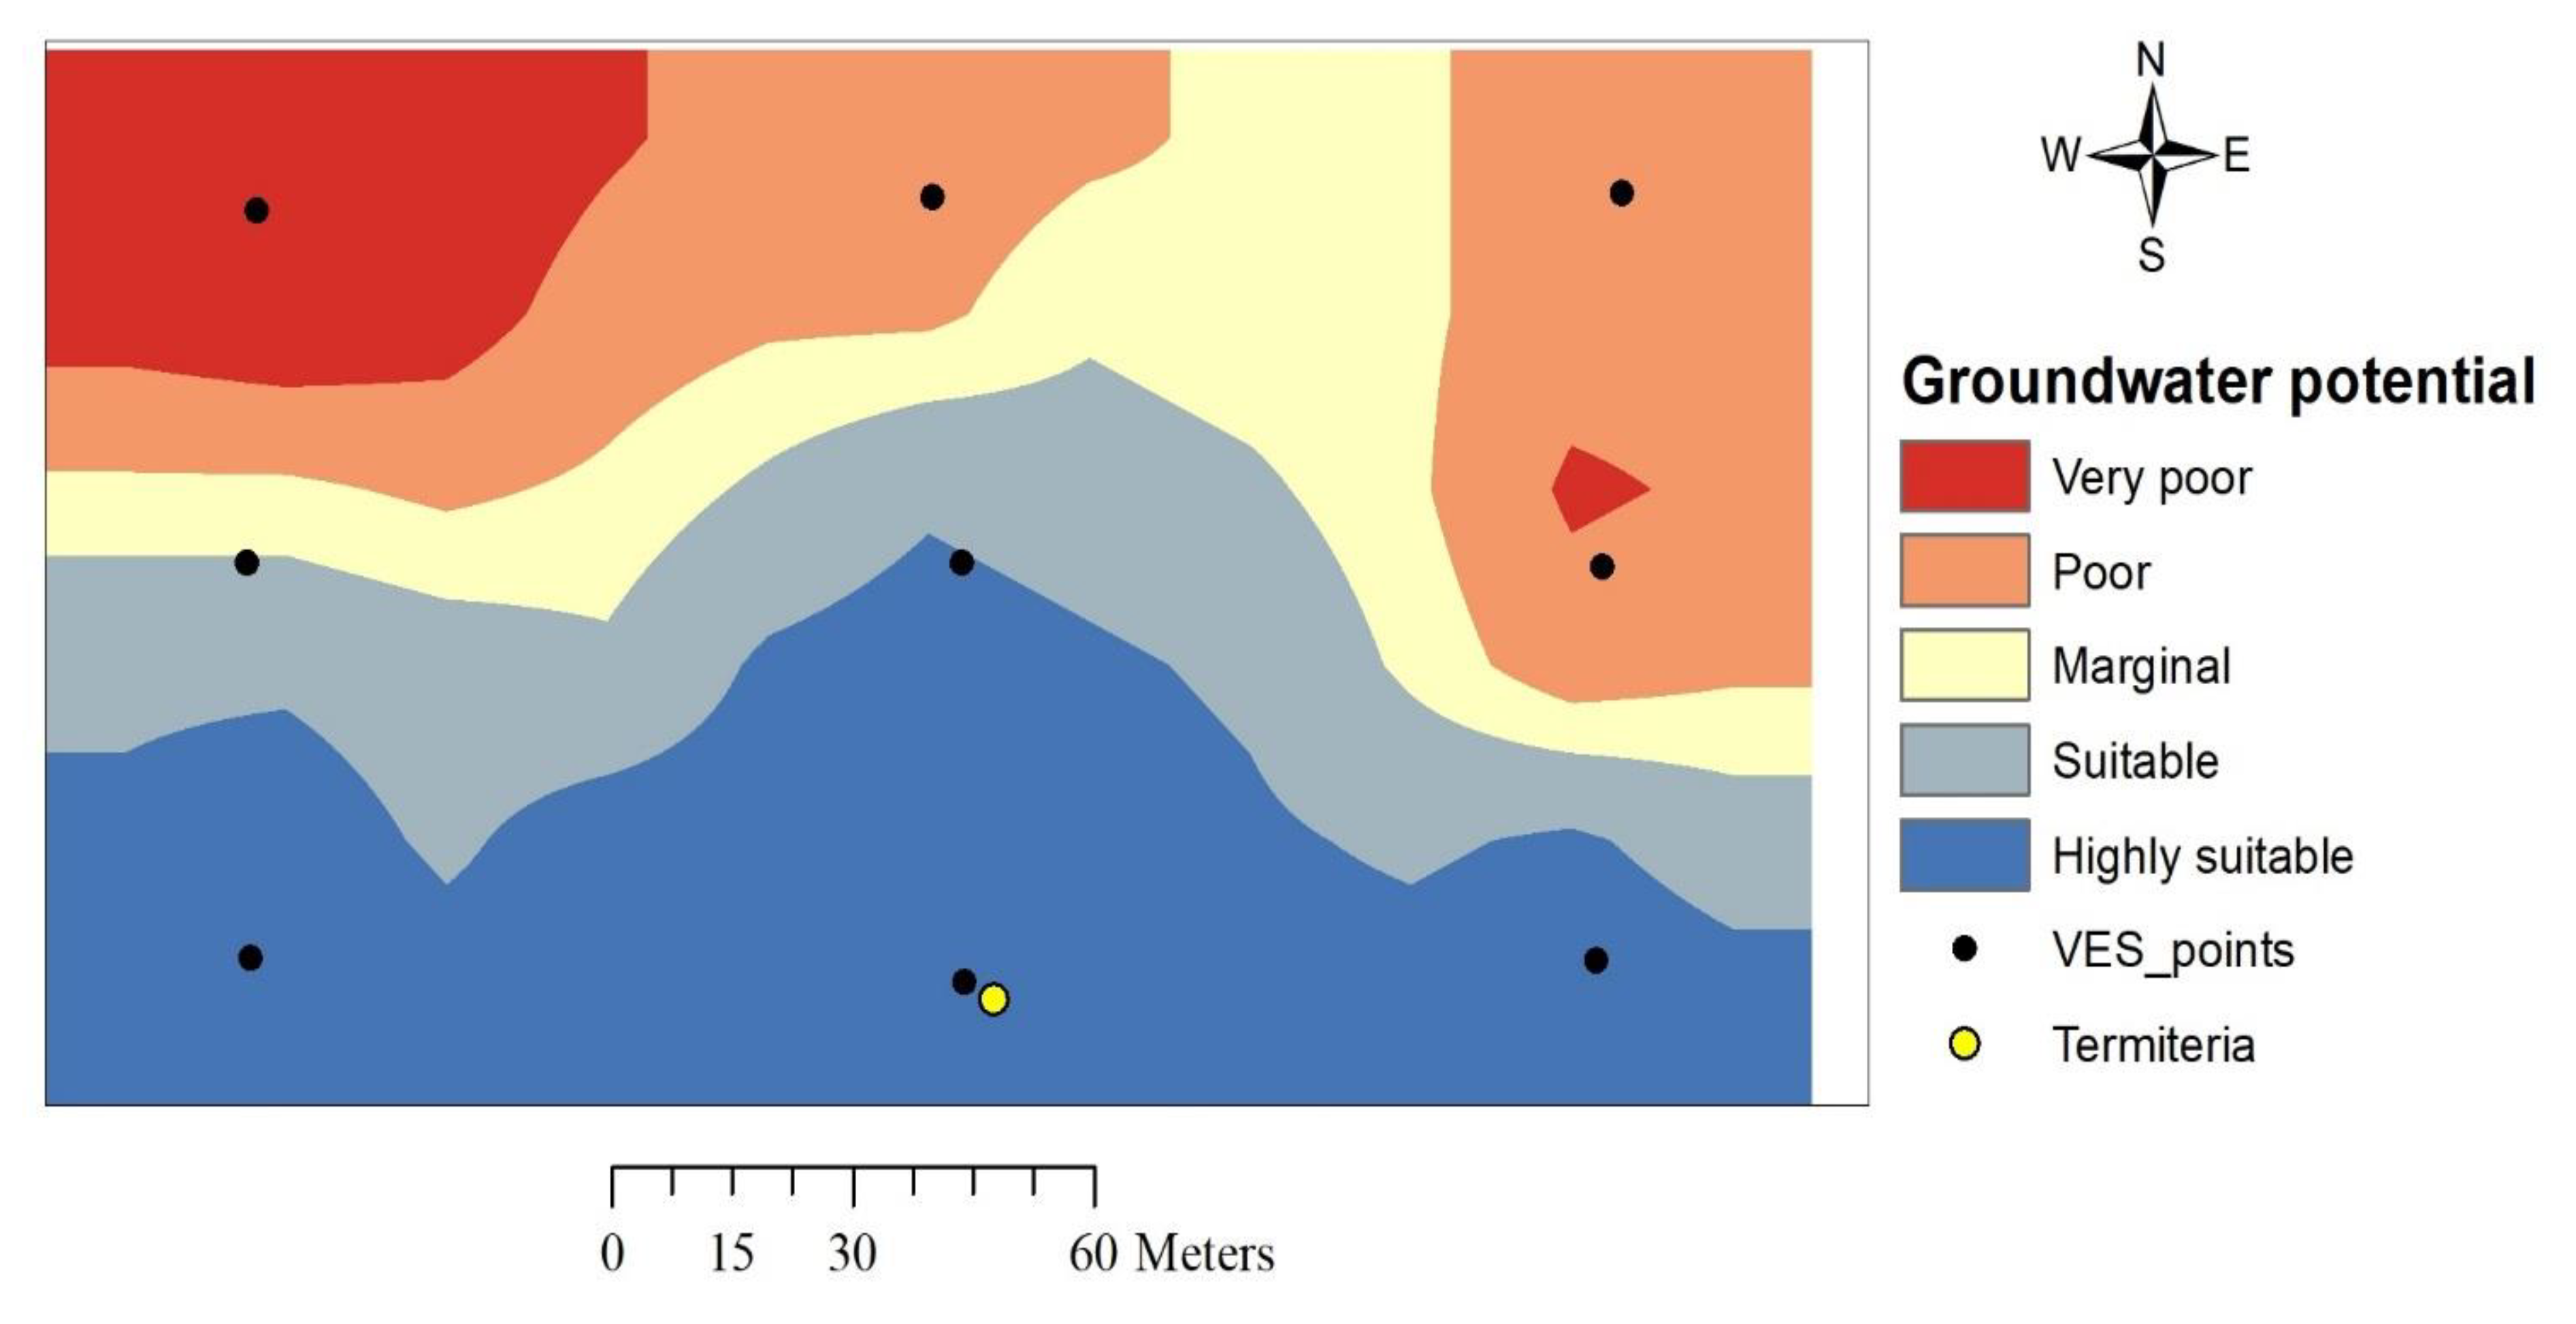
3.5. Groundwater Potential Evaluation
4. Discussion
4.1. Physical Evaluation of VES Curves
4.2. Primary Geoelectrical Parameters
4.2.1. Aquifer Layer Resistivity
4.2.2. Aquifer Unit Layer Thickness
4.2.3. Overburden Thickness
4.3. Dar-Zarrouk Parameters
4.3.1. Total Transverse Resistance (T)
4.3.2. Coefficient of Anisotropy
4.3.3. Total Longitudinal Conductance
4.4. Groundwater Potential
5. Conclusions
Author Contributions
Funding
Acknowledgments
Conflicts of Interest
References
- Moe, S.R.; Mobæk, R.; Narmo, A.K. Mound building termites contribute to savanna vegetation heterogeneity. Plant Ecol. 2009, 202, 31–40. [Google Scholar] [CrossRef]
- Fufa, F.; Alemayehu, E.; Lennartz, B. Defluoridation of Groundwater Using Termite Mound. Water Air Soil Pollut. 2013, 224, 1–15. [Google Scholar] [CrossRef]
- De Figueirêdo, R.E.C.R.; Vasconcellos, A.; Policarpo, I.S.; Alves, R.R.N. Edible and medicinal termites: A global overview. J. Ethnobiol. Ethnomed. 2015, 11, 1–7. [Google Scholar] [CrossRef] [PubMed] [Green Version]
- Noirot, C.; Darlington, J.P.E.C. Termite Nests: Architecture, Regulation and Defence. In Termites: Evolution, Sociality, Symbioses, Ecology; Abe, T., Bignel, D., Higashi, M., Eds.; Springer: Dordrecht, The Netherlands, 2000; pp. 121–139. [Google Scholar]
- Davies, A.B.; Levick, S.R.; Asner, G.P.; Robertson, M.P.; Van Rensburg, B.J.; Parr, C.L. Spatial variability and abiotic determinants of termite mounds throughout a savanna catchment. Ecography 2014, 37, 852–862. [Google Scholar] [CrossRef]
- Neoh, K.-B.; Lee, C. Developmental stages and caste composition of a mature and incipient colony of the drywood termite, Cryptotermes dudleyi (Isoptera: Kalotermitidae). J. Econ. Èntomol. 2011, 104, 622–628. [Google Scholar] [CrossRef]
- Léonard, J.; Rajot, J. Influence of termites on runoff and infiltration: Quantification and analysis. Geoderma 2001, 104, 17–40. [Google Scholar] [CrossRef]
- Choosai, C.; Mathieu, J.; Hanboonsong, Y.; Jouquet, P. Termite mounds and dykes are biodiversity refuges in paddy fields in north-eastern Thailand. Environ. Conserv. 2009, 36, 71–79. [Google Scholar] [CrossRef]
- Hyseni, C.; Garrick, R.C. Ecological Drivers of Species Distributions and Niche Overlap for Three Subterranean Termite Species in the Southern Appalachian Mountains, USA. Insects 2019, 10, 33. [Google Scholar] [CrossRef] [Green Version]
- Rust, M.K.; Su, N.-Y. Managing Social Insects of Urban Importance. Annu. Rev. Èntomol. 2012, 57, 355–375. [Google Scholar] [CrossRef]
- Arhin, E.; Boadi, S.; Esoah, M.C. Identifying pathfinder elements from termite mound samples for gold exploration in regolith complex terrain of the Lawra belt, NW Ghana. J. Afr. Earth Sci. 2015, 109, 143–153. [Google Scholar] [CrossRef]
- West, W.F. Some unconventional ideas on prospecting. Chamb. Mines J. 1965, 7, 40–42. [Google Scholar]
- Watson, J.P. The distribution of gold in termite mounds and soils at a gold anomaly in Kalahari sand. Soil Sci. 1972, 113, 317–321. [Google Scholar] [CrossRef]
- Mège, D.; Rango, T. Permanent groundwater storage in basaltic dyke fractures and termite mound viability. J. Afr. Earth Sci. 2010, 57, 127–142. [Google Scholar] [CrossRef]
- Ahmed, J.B., II; Pradhan, B. Termite Mounds as Bio-Indicators of Groundwater: Prospects and Constraints. Pertanika J. Sci. Technol. 2018, 26, 479–498. [Google Scholar]
- Freymann, B.P.; De Visser, S.N.; Olff, H. Spatial and temporal hotspots of termite-driven decomposition in the Serengeti. Ecography 2010, 33, 443–450. [Google Scholar] [CrossRef] [Green Version]
- Davies, A.B.; Baldeck, C.A.; Asner, G.P. Termite mounds alter the spatial distribution of African savanna tree species. J. Biogeogr. 2015, 43, 301–313. [Google Scholar] [CrossRef]
- Ahmed, I.J.B.; Pradhan, B.; Mansor, S.; Tongjura, J.D.; Yusuf, B. Multi-criteria evaluation of suitable sites for termite mounds construction in a tropical lowland. Catena 2019, 178, 359–371. [Google Scholar] [CrossRef]
- Ii, J.B.A.; Pradhan, B. Spatial assessment of termites interaction with groundwater potential conditioning parameters in Keffi, Nigeria. J. Hydrol. 2019, 578, 1–17. [Google Scholar] [CrossRef]
- Ii, J.B.A.; Pradhan, B.; Mansor, S.; Yusoff, Z.M.; Ekpo, S.A. Aquifer Potential Assessment in Termites Manifested Locales Using Geo-Electrical and Surface Hydraulic Measurement Parameters. Sensors 2019, 19, 2107. [Google Scholar] [CrossRef] [Green Version]
- Ahmed, J.B.; Moumouni, A.; Musa, S.S. Influence of Abattoir Wastes on Groundwater Quality in Keffi, North Central Nigeria. IOSR J. Environ. Sci. Toxicol. Food Technol. 2016, 10, 35–42. [Google Scholar] [CrossRef]
- Adabanija, M.A.; Afolabi, A.O.; Olatunbosun, A.T.; Kolawole, L.L. Integrated approach to investigation of occurrence and quality of groundwater in Ogbomoso North, Southwestern Nigeria. Environ. Earth Sci. 2014, 73, 139–162. [Google Scholar] [CrossRef]
- Loke, M.; Barker, R. Rapid least-squares inversion of apparent rsistivity pseudosections using quasi-Newton method. Geophys. Prospect. 1996, 44, 131–152. [Google Scholar] [CrossRef]
- Barker, R.; Blunk, I.; Smith, I. Geophysical considerations in the design of the UK National Resistivity Sounding Database. First Break 1996, 14, 45–53. [Google Scholar] [CrossRef]
- Oborie, E.; Udom, G. Determination of aquifer transmissivity using geoelectrical sounding and pumping test in parts of Bayelsa State, Nigeria. Peak J. Phys. Environ. Sci. Res. 2014, 2, 32–40. [Google Scholar]
- Mogaji, K.A.; Lim, H.S. Groundwater potentiality mapping using geoelectrical-based aquifer hydraulic parameters: A GIS-based multi-criteria decision analysis modeling approach. Terr. Atmos. Ocean. Sci. 2017, 28, 479–500. [Google Scholar] [CrossRef] [Green Version]
- Maillet, R. The fundamental equations of electrical prospecting. Geophysics 1947, 12, 529–556. [Google Scholar] [CrossRef]
- Mogaji, K.A.; Omosuyi, G.O.; Adelusi, A.O.; Lim, H.S. Application of GIS-Based Evidential Belief Function Model to Regional Groundwater Recharge Potential Zones Mapping in Hardrock Geologic Terrain. Environ. Process. 2016, 3, 93–123. [Google Scholar] [CrossRef]
- Mogaji, K.A. Application of vulnerability modeling techniques in groundwater resources management: A comparative study. Appl. Water Sci. 2018, 8, 127. [Google Scholar] [CrossRef] [Green Version]
- Adeyemo, I.A.; Omosuyi, G.O.; Ojo, B.T.; Adekunle, A. Groundwater Potential Evaluation in a Typical Basement Complex Environment Using GRT Index—A Case Study of Ipinsa-Okeodu Area, near Akure, Nigeria. J. Geosci. Environ. Prot. 2017, 5, 240–251. [Google Scholar] [CrossRef]
- Jatau, B.S.; Bajeh, I. Hydrogeological appraisal of parts of Jemaa Local Government Area, North-Central Kaduna State, Nigeria. Res. J. Appl. Sci. 2007, 2, 1174–1181. [Google Scholar]
- Anudu, G.K.; Essien, B.I.; Obrike, S.E. Hydrogeophysical investigation and estimation of groundwater potentials of the Lower Palaeozoic to Precambrian crystalline basement rocks in Keffi area, north-central Nigeria, using resistivity methods. Arab. J. Geosci. 2012, 7, 311–322. [Google Scholar] [CrossRef]
- Barker, R.D.; White, C.; Houston, J.F.T. Borehole siting in an African Accelerated Drought Relief Project. Hydrogeology of crystalline basement aquifers in Africa. Geol. Soc. Lond. 1992, 66, 183–201. [Google Scholar] [CrossRef]
- Olayinka, A.; Amidu, S.; Oladunioye, M. Use of electromagnetic profiling and resistivity sounding for groundwater exploration in the crystalline basement area of Igbeti, Southwestern Nigeria. Glob. J. Geol. Sci. 2004, 2, 243–253. [Google Scholar] [CrossRef]
- Amigun, J.O.; Faruwa, R.A.; Komolafe, A.A. Integrated Landsat Imagery and Geophysical Exploration for Groundwater Potential Evaluation of Okene and Its Environs, Southwestern Nigeria. Int. J. Geosci. 2015, 6, 209–229. [Google Scholar] [CrossRef] [Green Version]
- Kayode, J.; Adelusi, A.; Nawawi, M.; Bawallah, M.; Olowolafe, T. Geo-electrical investigation of near surface conductive structures suitable for groundwater accumulation in a resistive crystalline basement environment: A case study of Isuada, southwestern Nigeria. J. Afr. Earth Sci. 2016, 119, 289–302. [Google Scholar] [CrossRef]
- Kinwumiju, A.S.A.; Olorunfemi, M.O.; Afolabi, O. GIS-Based Integrated Groundwater Potential Assessment of Osun Drainage Basin, Southwestern Nigeria. Ife J. Sci. 2016, 18, 147–168. [Google Scholar]
- Jayeoba, A.; Oladunjoye, M.A. Hydro-geophysical evaluation of groundwater potential in hard rock terrain of southwestern Nigeria. RMZ Mater. Geoenviron. 2013, 60, 271–285. [Google Scholar]
- Suneetha, N.; Gupta, G.; Laxminarayana, M. Evaluation of geoelectric parameters to delineate the subsurface fractures for groundwater exploration around coastal Maharashtra, India. J. Coast. Sci. 2017, 4, 9–16. [Google Scholar]
- Zohdy, A.A.; Eaton, G.P.; Mabey, D.R. Application of Surface Geophysics to Ground-Water Investigations; US Geological Survey: Reston, VA, USA, 1974.
- Bayewu, O.O.; Oloruntola, M.O.; Mosuro, G.O.; Laniyan, T.A.; Ariyo, S.O.; Fatoba, J.O. Assessment of groundwater prospect and aquifer protective capacity using resistivity method in Olabisi Onabanjo University campus, Ago-Iwoye, Southwestern Nigeria. NRIAG J. Astron. Geophys. 2018, 7, 347–360. [Google Scholar] [CrossRef]
- Bayewu, O.O.; Oloruntola, M.O.; Mosuro, G.O.; Laniyan, T.A.; Ariyo, S.O.; Fatoba, J.O. Geophysical evaluation of groundwater potential in part of southwestern Basement Complex terrain of Nigeria. Appl. Water Sci. 2017, 7, 4615–4632. [Google Scholar] [CrossRef] [Green Version]
- Ejepu, J.; Olasehinde, P.; Okhimamhe, A.A.; Okunlola, I. Investigation of Hydrogeological Structures of Paiko Region, North-Central Nigeria Using Integrated Geophysical and Remote Sensing Techniques. Geosciences 2017, 7, 122. [Google Scholar] [CrossRef] [Green Version]


| VES No. | ρ1 (Ωm) | ρ2 (Ωm) | ρ3 (Ωm) | ρ4 (Ωm) | h1 (m) | h2 (m) | h3 (m) | Σhi (m) | S (1/Ω) | T (Ωm2) | Λ |
|---|---|---|---|---|---|---|---|---|---|---|---|
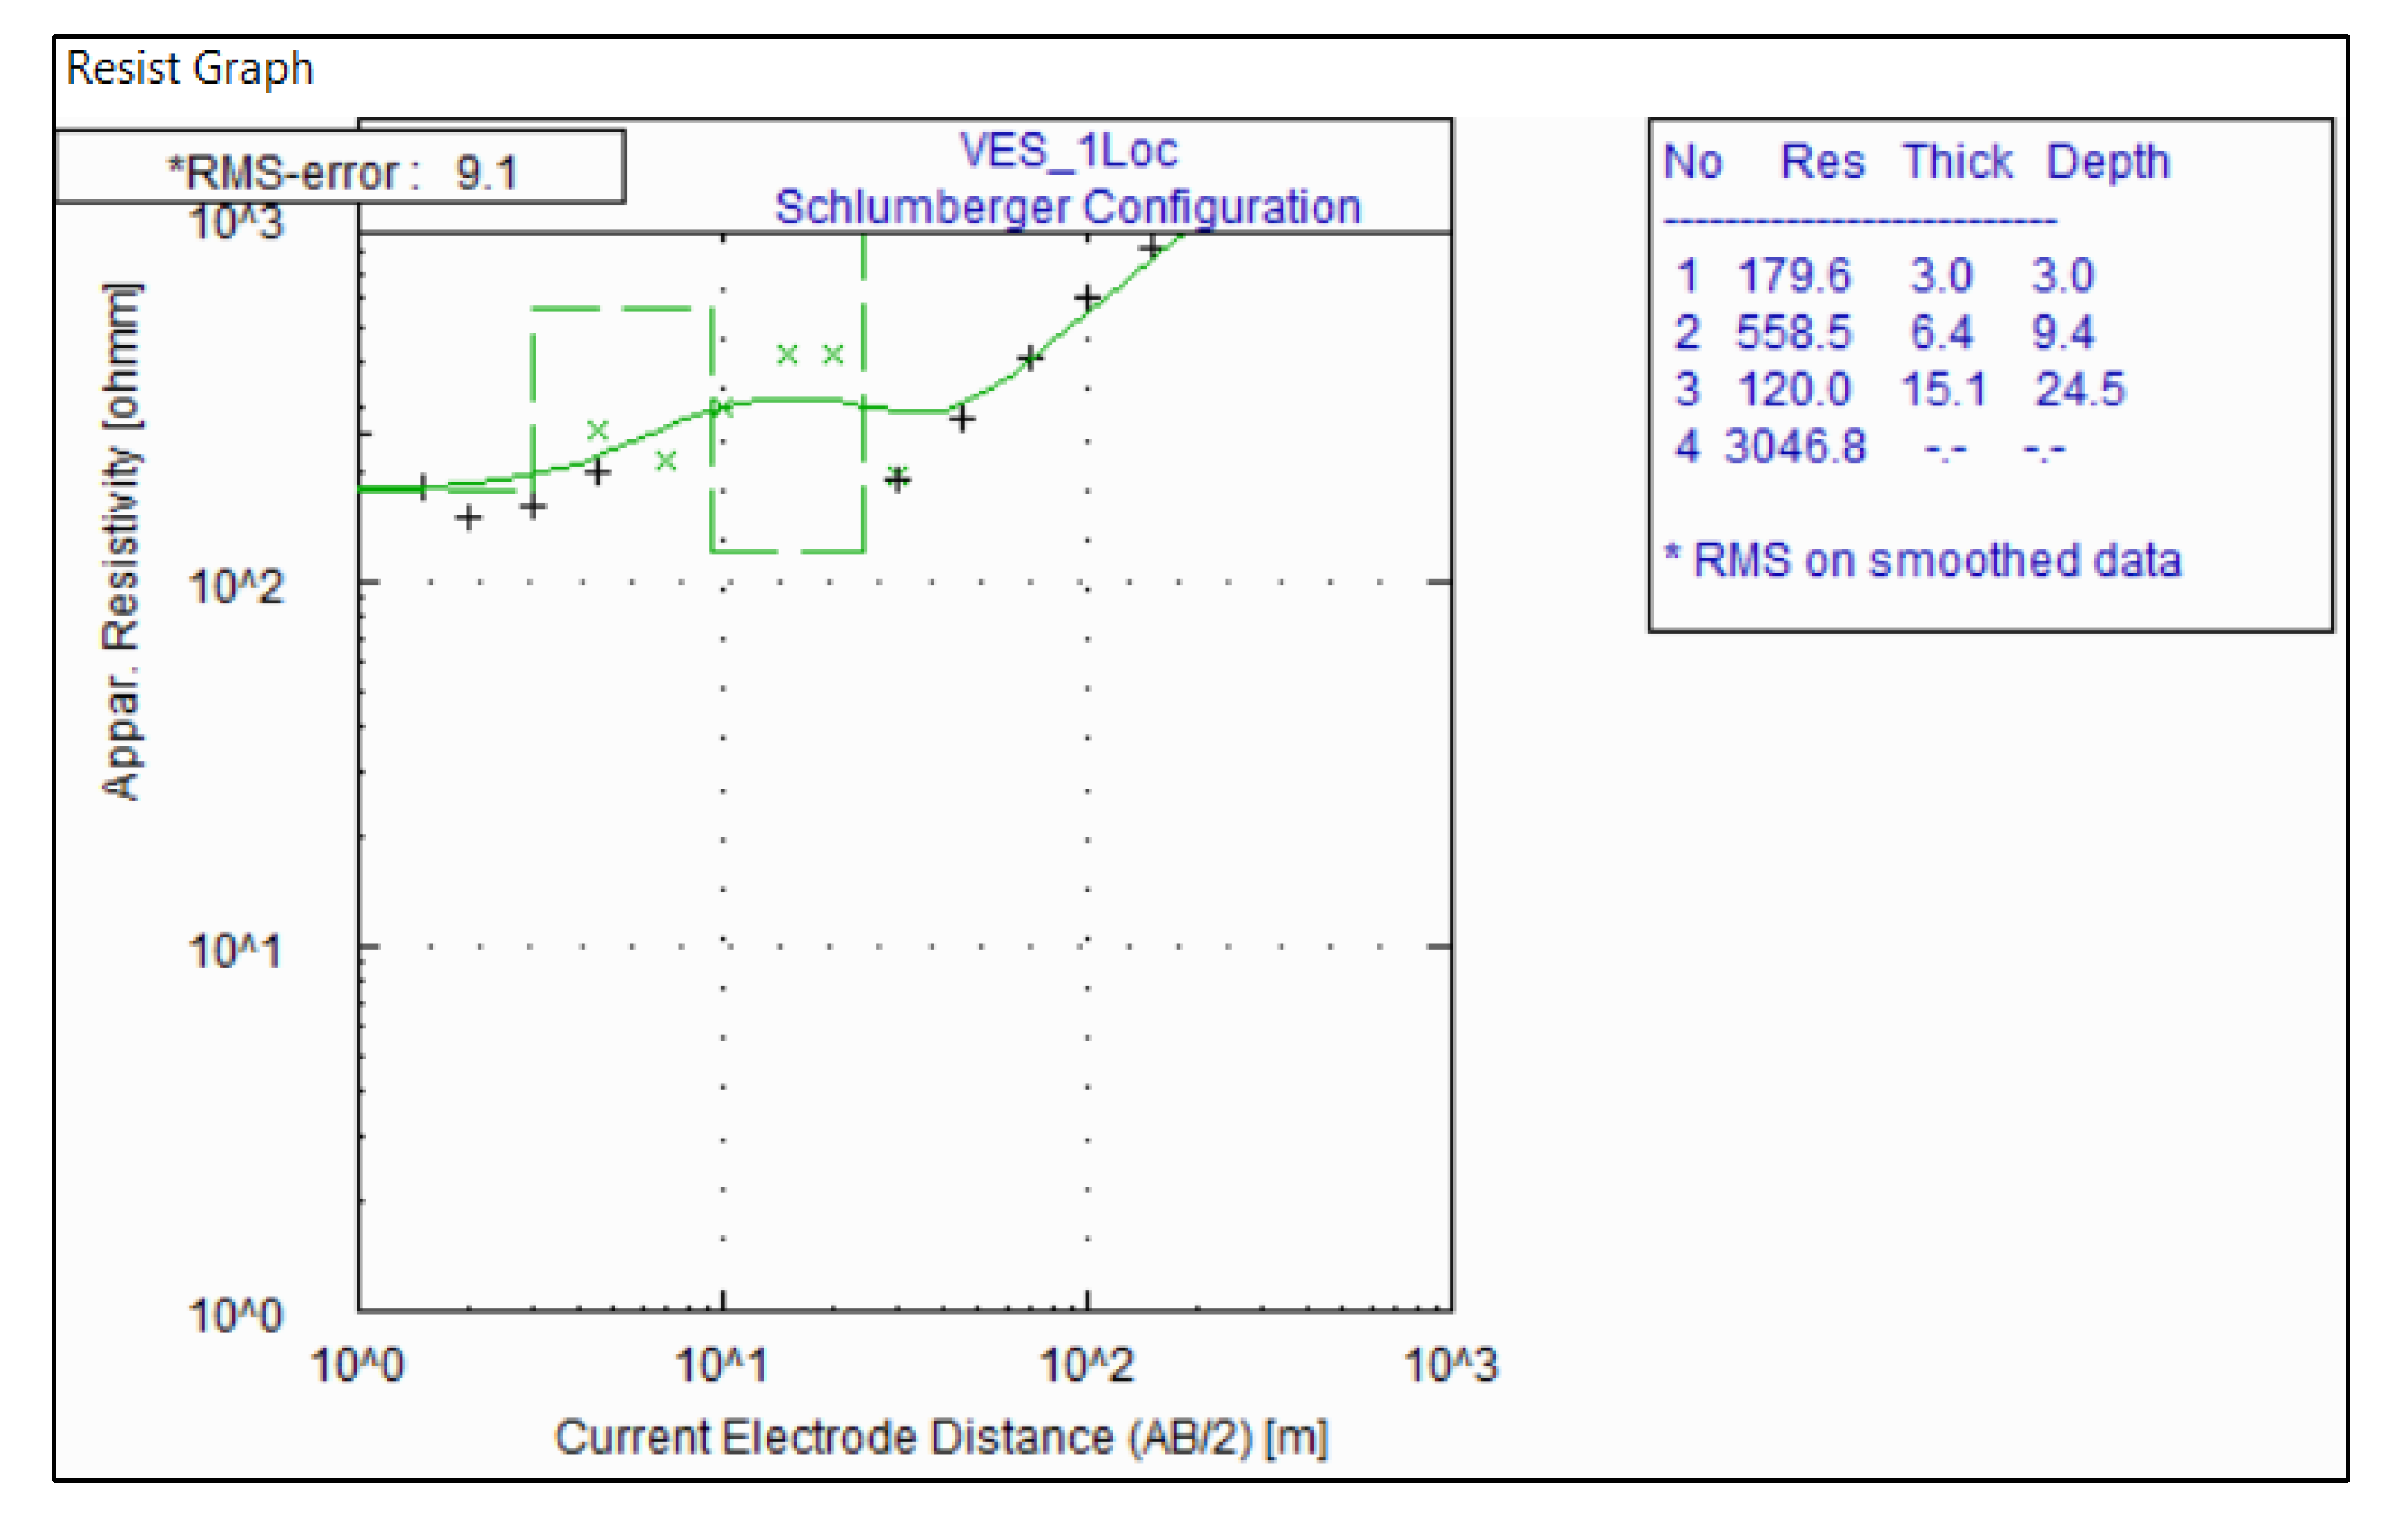
| 1. | 179.6 | 558.5 | 120.0 | 3046.8 | 3.0 | 6.4 | 15.1 | 24.5 | 0.154 | 5925.2 | 1.23 |
| 2. | 539.9 | 2905.3 | 104.1 | 5111.4 | 1.3 | 2.5 | 12.9 | 16.7 | 0.127 | 9308.0 | 2.06 |
| 3. | 134.7 | 1283.2 | 35.4 | 6750.2 | 0.5 | 1.3 | 6.8 | 8.5 | 0.197 | 1976.3 | 2.32 |
| 4. | 733.8 | 70.3 | 6724.9 | - | 5.2 | 10.5 | - | 15.7 | 0.156 | 4553.9 | 1.70 |
| 5. | 413.4 | 107.9 | 5662.2 | - | 7.9 | 11.9 | - | 19.9 | 0.129 | 4549.9 | 1.22 |
| 6. | 359.5 | 158.5 | 7567.8 | - | 7.7 | 13.7 | - | 21.3 | 0.107 | 4939.6 | 1.08 |
| 7. | 695.7 | 243.0 | 4661.7 | - | 2.0 | 17.6 | - | 19.6 | 0.075 | 5668.2 | 1.11 |
| 8. | 511.4 | 61.1 | 14,981.5 | - | 3.4 | 6.0 | - | 9.4 | 0.105 | 2105.4 | 1.58 |
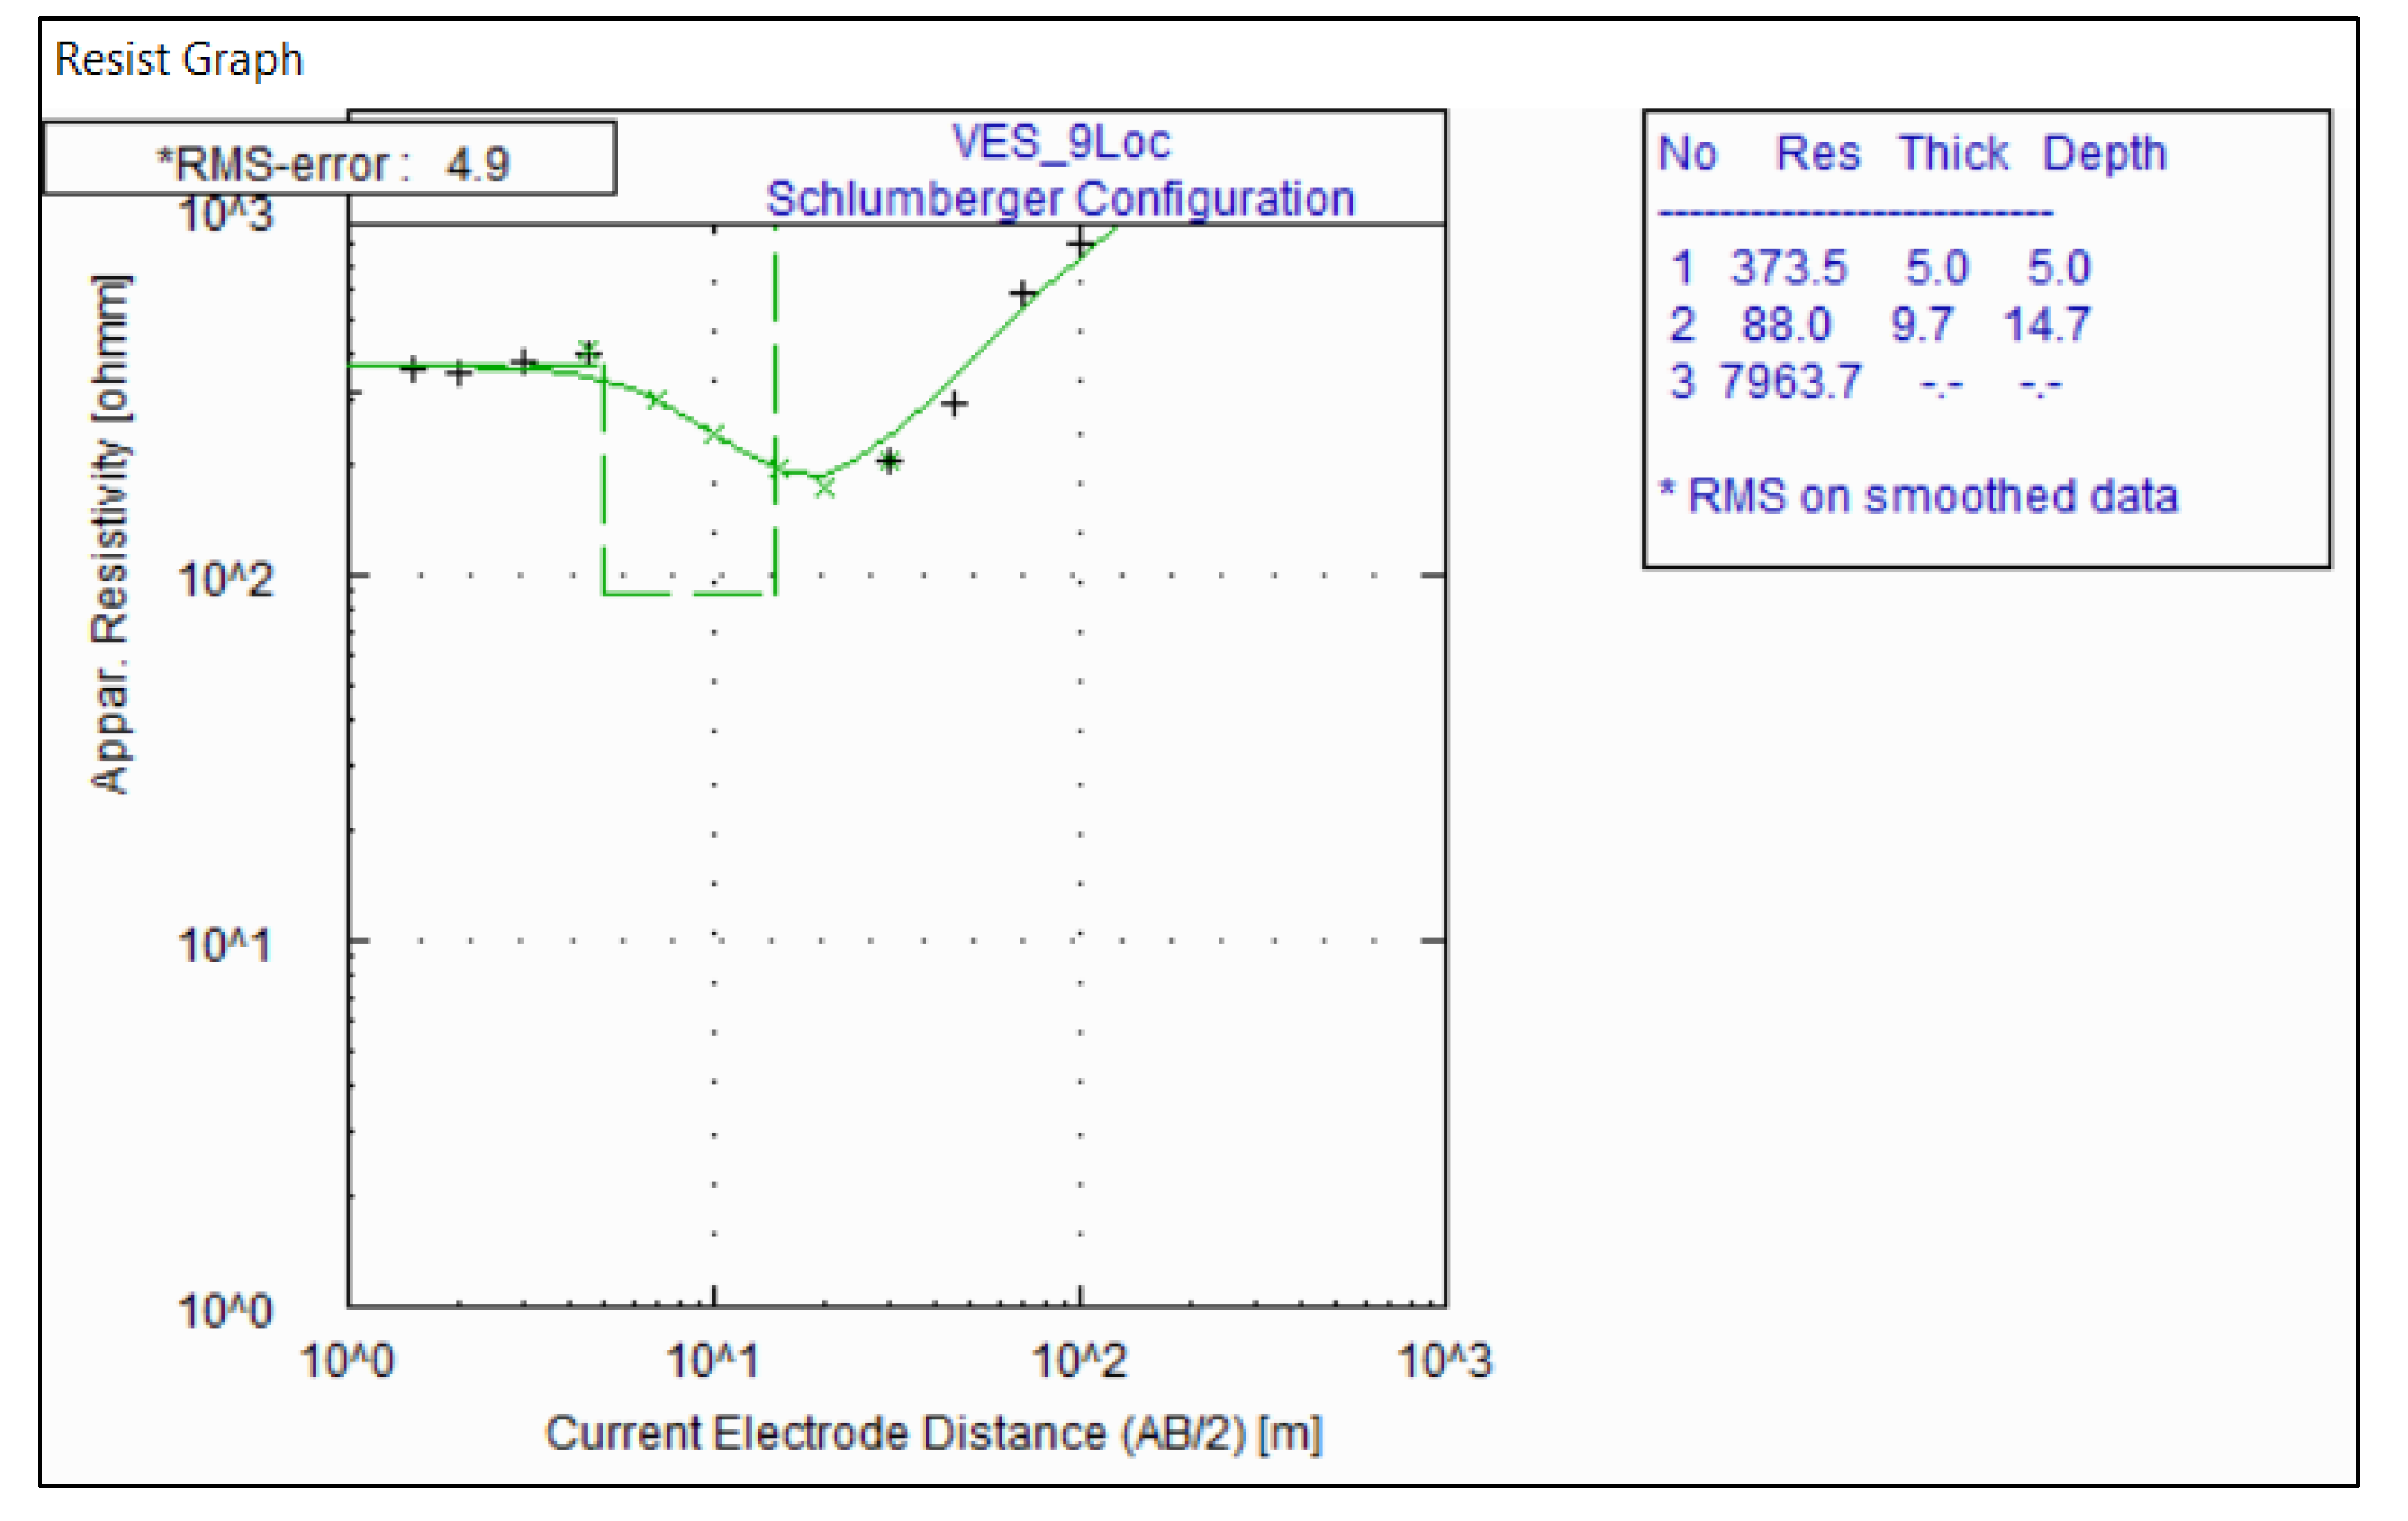
| 9. | 373.5 | 88.0 | 7963.7 | - | 5.0 | 9.7 | - | 14.7 | 0.124 | 2721.1 | 1.25 |
| VES Point | Curve Type | Expert 1 Rank | Expert 2 Rank | Expert 3 Rank |
|---|---|---|---|---|
| 1 | KH | 1st | 1st | 2nd |
| 2 | KH | 2nd | 4th | 3th |
| 3 | KH | 4th | 7th | 6th |
| 4 | H | 6th | 5th | 7th |
| 5 | H | 5th | 3th | 5th |
| 6 | H | 3th | 2nd | 1st |
| 7 | H | 9th | 6th | 4th |
| 8 | H | 7th | 8th | 9th |
| 9 | H | 8th | 9th | 8th |
Publisher’s Note: MDPI stays neutral with regard to jurisdictional claims in published maps and institutional affiliations. |
© 2020 by the authors. Licensee MDPI, Basel, Switzerland. This article is an open access article distributed under the terms and conditions of the Creative Commons Attribution (CC BY) license (http://creativecommons.org/licenses/by/4.0/).
Share and Cite
Ahmed, J.B., II; Salisu, A.; Pradhan, B.; Alamri, A.M. Do Termitaria Indicate the Presence of Groundwater? A Case Study of Hydrogeophysical Investigation on a Land Parcel with Termite Activity. Insects 2020, 11, 728. https://doi.org/10.3390/insects11110728
Ahmed JB II, Salisu A, Pradhan B, Alamri AM. Do Termitaria Indicate the Presence of Groundwater? A Case Study of Hydrogeophysical Investigation on a Land Parcel with Termite Activity. Insects. 2020; 11(11):728. https://doi.org/10.3390/insects11110728
Chicago/Turabian StyleAhmed, Jamilu Bala, II, Abdullahi Salisu, Biswajeet Pradhan, and Abdullah M. Alamri. 2020. "Do Termitaria Indicate the Presence of Groundwater? A Case Study of Hydrogeophysical Investigation on a Land Parcel with Termite Activity" Insects 11, no. 11: 728. https://doi.org/10.3390/insects11110728