Article

New Carboxylate Anionic Sm-MOF: Synthesis, Structure and Effect of the Isomorphic Substitution of Sm3+ with Gd3+ and Tb3+ Ions on the Luminescent Properties

by
Anna A. Ivanova
1,
Victoria E. Gontcharenko
1,2,
Alexey M. Lunev
1,
Anastasia V. Sidoruk
1,
Ilya A. Arkhipov
1,
Ilya V. Taydakov
2 and
Yuriy A. Belousov
1,2,*
1
Chemistry Department, Moscow State University, Leninskie Gory, 119991 Moscow, Russia
2
P. N. Lebedev Physical Institute of Russian Academy of Sciences, 119991 Moscow, Russia
*
Author to whom correspondence should be addressed.
Inorganics 2022, 10(8), 104; https://doi.org/10.3390/inorganics10080104
Submission received: 6 July 2022 / Revised: 20 July 2022 / Accepted: 22 July 2022 / Published: 25 July 2022

Abstract

:
Two new compounds, namely {(NMe2H2)}[Ln(TDA)(HCOO)] 0.5H2O, Ln = Sm3+ (Sm-TDA) and Gd3+ (Gd-TDA), where TDA3− is the anion of 1H-1,2,3-triazole-4,5-dicarboxylic acid (H3TDA), were synthesized by the solvothermal method in a DMF:H2O mixture. According to single-crystal X-ray diffraction data, the compounds are 3d-MOFs with an anionic lattice and dimethylammonium cations occupying part of the cavities. Based on these compounds, two series of mixed-metal complexes, [NMe2H2][SmxLn1-x(TDA)(HCOO)], (x = 0.9 (Sm0.9Ln0.1-TDA), x = 0.8 (Sm0.8-Ln0.2-TDA)…Sm0.02Ln0.98-TDA, Ln = Tb, Gd), were also obtained and characterized by powder XRD. The luminescent properties of the compounds were studied and it was shown that the resulting compounds are two- or three-component emitters with the possibility of fine color tuning by changing the intensities of fluorescence and phosphorescence of the ligand, as well as the luminescence of Sm3+ and Tb3+ f-ions.

Graphical Abstract

1. Introduction

Coordination compounds of lanthanides have been proposed as functional materials for luminescent light emitters [1,2,3,4,5], biomedical imaging [6,7,8], sensors [9,10,11,12], luminescent thermometers [13,14,15,16], and as materials for the protection of banknotes and security [17] due to their unique luminescent properties corresponding to partially filled f-shells of lanthanide ions. The main strategies to improve the luminescent characteristics of Ln3+ complexes are by designing a ligand with suitable antenna characteristics [18,19], reducing the efficiency of vibrational relaxation by minimizing the number of C-H, N-H, and O-H bonds [20], and suppressing concentration quenching by diluting the luminescent Ln3+ ion with optically inactive La3+ [21,22], Gd3+ [20,23], or Y3+ ions [5,24,25]. A great deal of work on luminescent lanthanide compounds is devoted to molecular complexes, especially β-diketonates [1,26,27] and acylpyrazolonates [20,28,29,30]. The transition to metal–organic frameworks (MOF) allows us to significantly expand the possibilities of application in the field of creating sensor materials, but this requires the use of polydentate ligands, such as polycarboxylic acids [31,32]. The advantage of complexes based on aromatic carboxylic acids is the presence of a strong chromophore in the ligand molecule that effectively absorbs the excitation energy, which makes the increase in the luminescence intensity of the complexes [17,31] possible. Due to this, MOFs based on aromatic [33,34] and heteroaromatic carboxylic acids [32,35] have good light absorbing properties, as well as thermal stability exceeding that of β-diketonates. To create effectively luminescent Ln-MOF, it is necessary to minimize the number of OH, CH, and NH bonds in the structure of the complex, since they contribute to the effective quenching of the luminescence of Ln3+ ions [36]. Some azolpolycarboxylic acids have these requirements—for example, [1H]-1,2,3-triazole-4,5-dicarboxylic acid (H3TDA) [10,23,37,38,39,40,41], for which it is possible to implement various coordination modes [32]. In addition, the fully deprotonated ion TDA3– does not contain CH-, NH-, and OH-groups that cause luminescence quenching. Despite the attractiveness and synthetic availability, lanthanide complexes with H3TDA have not been studied extensively. Thus, depending on the synthesis conditions, linear polymers {[Ln(H2O)4(HTDA)(H2TDA)]} [37,38,39] containing partially deprotonated ligand anions, and three-dimensional polymers {[Ln(TDA)(H2O)n]} [10,38,41] with the anion TDA3-, can be obtained. Both of these families of compounds contain intraspheric water molecules that reduce the luminescence efficiency. To exclude water from the coordination sphere, we previously proposed synthesis in the presence of DMF, leading to a three-dimensional MOF {(NMe2H2)[Eu(TDA)(HCOO)] 0.5H2O} [23]. For this compound, the lifetime of the excited state τobs of Eu3+ ions has been increased by 2.2 times compared to the {[Eu(TDA)(H2O)3](H2O)} complex containing intraspheric water molecules. Study of the photoluminescent properties of a series of isostructural compounds (NMe2H2)[EuxGd1-x(TDA)(HCOO)] 0.5H2O (x = 0.1–0.9) showed that the introduction of Gd3+ ions also significantly (by 2.35 times at x = 0.9) increases the lifetime of the excited state of Eu3+ ions by suppressing concentration quenching.
Sm3+ and Eu3+ ions are united not only by the proximity of the ionic radii, but also by a certain similarity in luminescent properties (red-orange color of luminescence, proximity of the energies of resonant levels) [17]. At the same time, the values of the quantum yields of luminescence and the lifetime of the excited state τobs of Sm3+ complexes in most cases are significantly inferior to those of Eu3+ compounds [17,32]. The aim of this work was to synthesize the samarium complex with H3TDA in the H2O–DMF medium, as well as to establish the possibility of controlling the luminescent properties by partial substitution of Sm3+ ions with Gd3+ ions and Tb3+. As a result of the work, optimal conditions for obtaining pure phases {(NMe2H2)[Ln(TDA)(HCOO)] 0.5H2O} (Ln = Sm(Sm-TDA), Gd(Gd-TDA), SmxGd1-x, SmxTb1-x) were found, the crystal structure of complexes Sm-TDA and Gd-TDA was studied, and the luminescent properties of monometallic compounds Sm-TDA and Gd-TDA were investigated, as well as a series of mixed-metal complexes, SmxGd1-x-TDA, SmxTb1-x-TDA (x = 0.02–0.9).

2. Results

2.1. Synthesis and Composition

The high coordination numbers of Ln3+ ions are achieved in many cases due to the coordination of water molecules. Synthesis performed in the presence of a non-aqueous polar solvent may lead to the exclusion of water from the coordination sphere. N,N-dimethylformamide in solvothermal conditions can act as a source of NMe2H2+ [34,42] and HCOO [34,42,43,44] ions included in the structure of some MOFs. In some cases, the unchanged DMF molecule is embedded in the polymer structure, helping the central atom to achieve a high coordination number [35,45].
It was discovered that during solvothermal synthesis in the H2O:DMF system (1:1), a crystalline precipitate of the composition [(CH3)2NH2]+[Sm(TDA)(HCOO)]·0.5H2O is formed from a mixture of Sm(NO3)3, H3TDA, and NaOH.
To confirm the composition, complex Sm-TDA was investigated by the DTA method with mass spectrometric detection of volatile products (Figure 1). In the range of 42–150 °C, water loss occurs (the loss of less than 0.5 water molecules per one formula unit Sm-TDA 0.5H2O is calc. 2.22%, exp. 1.16%). The substance is stable upon further heating, and only at temperatures above 330 °C does its decomposition begin, followed by oxidation to Sm2O3, CO2, H2O, and N2 (mass loss: calc. 56.9%, exp. 55.6%) Thus, the decomposition of dimethylamine occurs only simultaneously with the combustion of the complex, which indicates the high stability of the compound under study.
Initially, several attempts to perform single-crystal XRD showed the presence of only crystals of samarium formate isostructural to the described REE formates [46]. PXRD data did not show the presence of this impurity phase in the synthesis product, which can be explained by the presence of a small (<5%) number of large well-formed crystals {Sm(HCOO)3}, which, due to their satisfactory size and shape, were selected for single-crystal XRD. To obtain the pure phase of Sm-TDA, a number of syntheses were carried out with varying pH values (1.5–8 in increments of 0.5 ± 0.1). It was found that synthesis at a pH of 1.5 leads to the formation of large single crystals of Sm-TDA, pure from the impurity {Sm(HCOO)3}, not only according to the PXRD, but also optical microscopy (Figure 2). A decrease in the pH of the solution contributes to a decrease in the concentration of the ligand anion TDA3−, which slows down the MOF formation reaction and promotes the growth of larger crystals suitable for X-ray. This optimized technique was applied to the synthesis of mixed-metal compounds SmxGd1-xTDA and SmxTb1-xTDA.
Due to the proximity of ionic radii, in the absence of thermodynamic control conditions [47], mixtures containing ions of various REE crystallize, as a rule, as mixed-metal compounds with statistical distribution over positions [10,20,21,22,23,24,25,48,49]. According to the PXRD data, phase separation is not observed in systems SmxGd1-xTDA and SmxTb1-xTDA. According to the EDX of crystals, the ratio of Sm:Gd and Sm:Tb is preserved for individual crystals in the powder. ICP MS spectrometry data confirmed the compliance of the Ln1:Ln2 embedded during synthesis.
All synthesized complexes, Sm-TDA, x = 0.1 (Sm0.9Ln0.1-TDA), x = 0.2 (Sm0.8-Ln0.2-TDA)…Sm0.1Ln0.9-TDA, Ln = Tb, Gd, were found to be isostructural, which was confirmed by PXRD data. The diffractograms of the compounds correlate well with the theoretical one calculated from the Sm-TDA crystal structure data. The PXRD of the series of mixed-metal complexes and the theoretical PXRD calculated for structure Sm-TDA are shown in Figure 3. A small difference in the relative intensities of individual reflexes is associated with the texture of the sample and the presence of a variable number of water molecules in the cavities.
The IR spectra of compounds SmxGd1-xTDA and SmxTb1-xTDA consist of bands corresponding to various stretching and deformation vibrations (Figures S1 and S2). The broadened band of stretching vibrations of OH bonds (3650–3200 cm−1) indicates the involvement of lattice H2O molecules in the network of hydrogen bonds. Symmetric vibrations (νs) of the CH3 groups occur at 3041, 2942, 2868 cm−1. Broad stretching vibrations of the N-H bonds of the dimethylammonium cation corresponded to 2720 cm−1. The HCOO group is characterized by stretching vibrations (νs) at 2826 cm−1. νs and asymmetric (νas) vibrations of the COO anion appear at 1560 cm−1 and 1420 cm−1; the difference between these frequencies indicates the manifestation of the carboxyl group of both chelate and bridging functions. Stretching vibrations of the aromatic C = C, N = N, C = N bonds of triazole ring occur at 1445, 1460, 1478, and 820 cm−1.

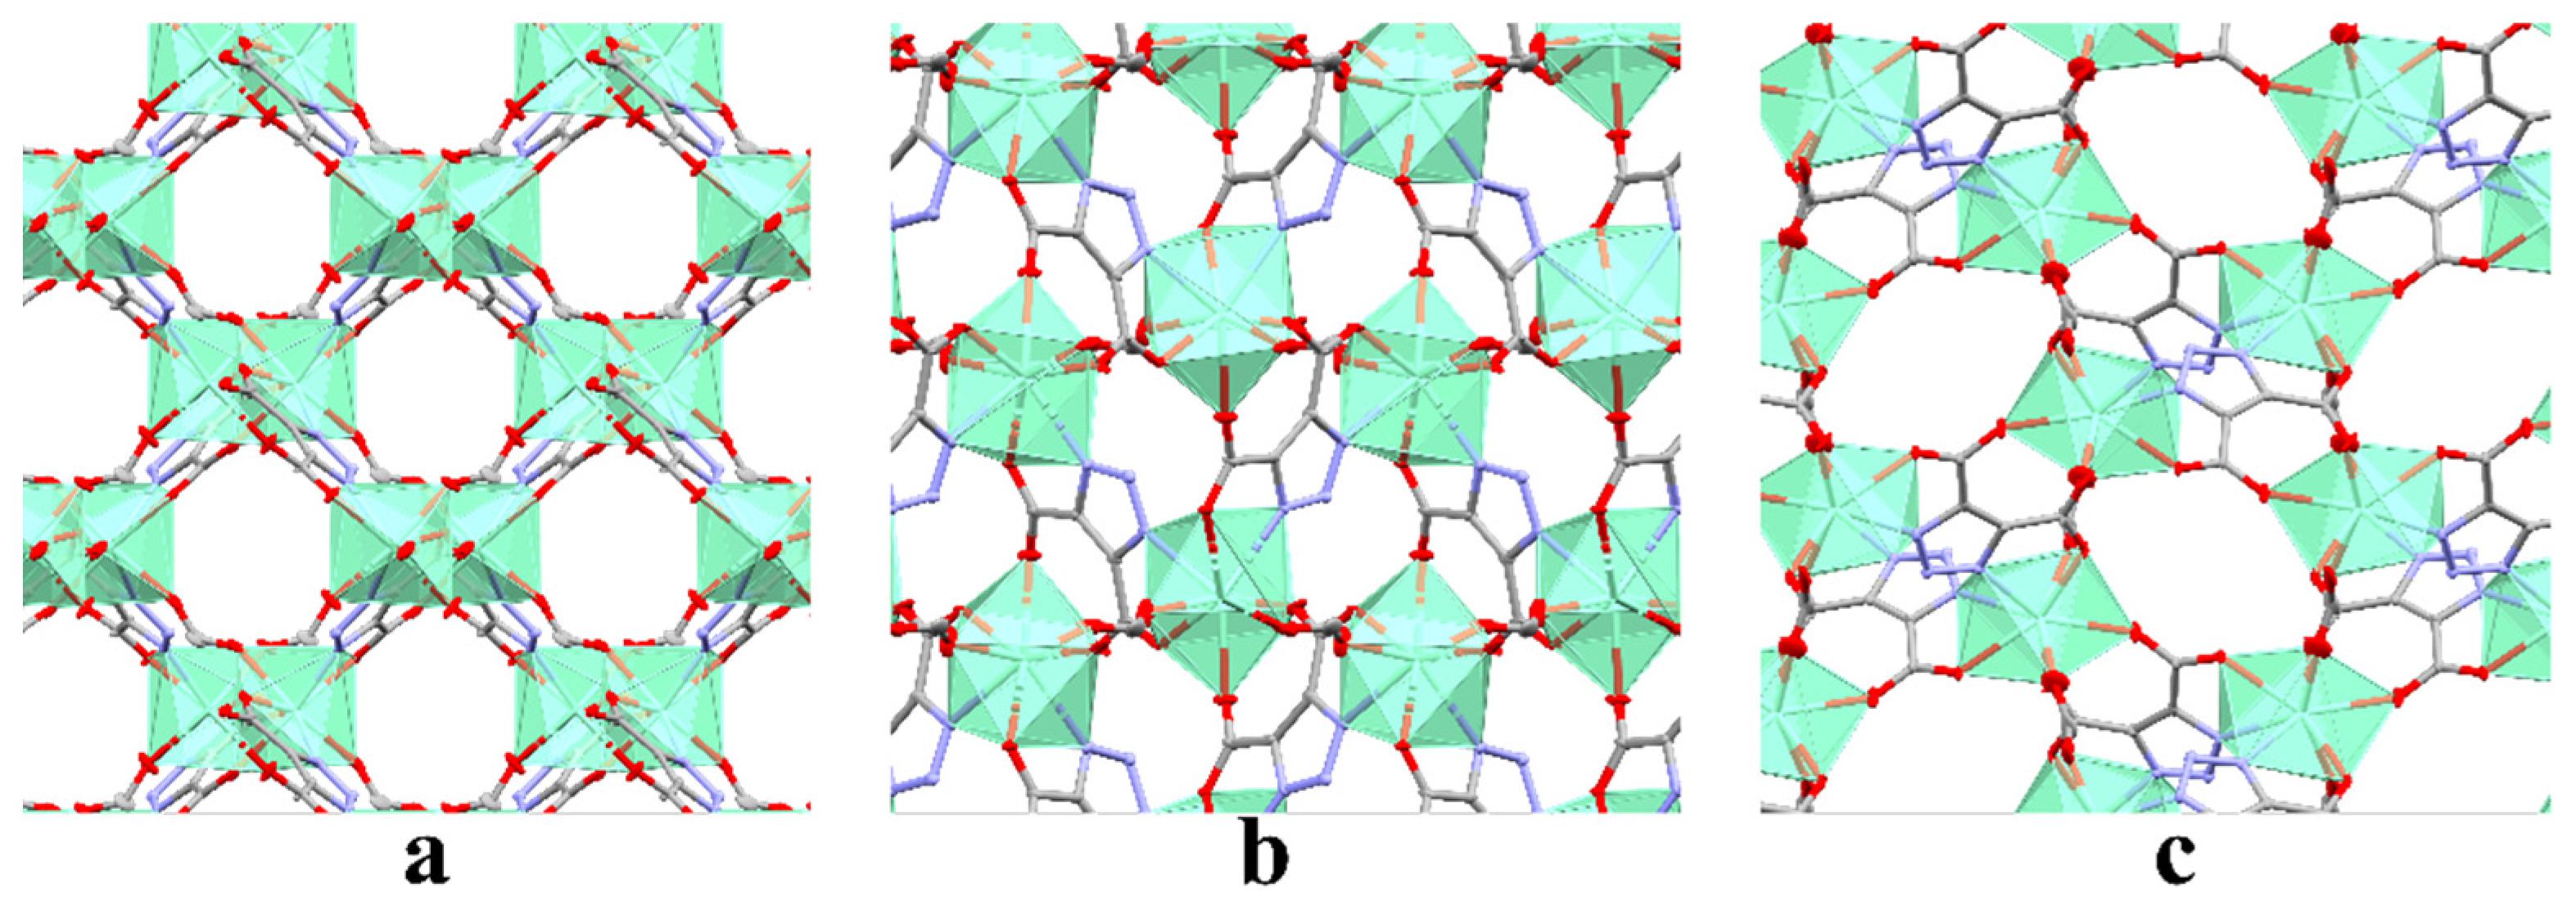
2.2. Crystal Structure

Since all complexes are isostructural, the description is given by the example of complex Sm-TDA.
Structure Sm-TDA is based on an anionic framework [Sm(TDA)(HCOO)]- and contains NMe2H2+ cations and water molecules in the cavities (Figure 4). Samarium cations are situated in a low-symmetric coordination environment. The coordination polyhedron of the central atom can be described as a distorted two-lobed trigonal prism with bases N(1), O(1), O(5); N(3), O(2), O(6) and vertices O(4), O(3). Some parameters of the crystal structures, as well as the structure of the europium complex, which was described earlier [23], are given in Table 1. It can be noted that for samarium, the unit cell parameters and bond lengths are greater, which is consistent with the radius change caused by lanthanide contraction.
All TDA3− anions are equivalent, and each coordinates the samarium cation with two donor atoms: either two oxygen atoms (O(3) and O(2)), or an oxygen atom and a nitrogen atom (O(1), N(1) and O(4), N(3)). Formate anions, binding two samarium cations, play the role of bridging ligands. The structure of the synthesized complexes contains a system of channels, the maximum size of which is ~7 × 7 Å, which is associated with the tendency of the H3TDA ligand to form framed polymer compounds. The view along the b axis of the polymer structure of the MOF is shown in Figure 5. Dimethylammonium cations in the structure are disordered, and the displacement of nitrogen atoms between the two positions is 1.255 Å. The disordering can be explained by the fact that the size of the cavities in the frame is much larger than the size of the dimethylammonium cation.

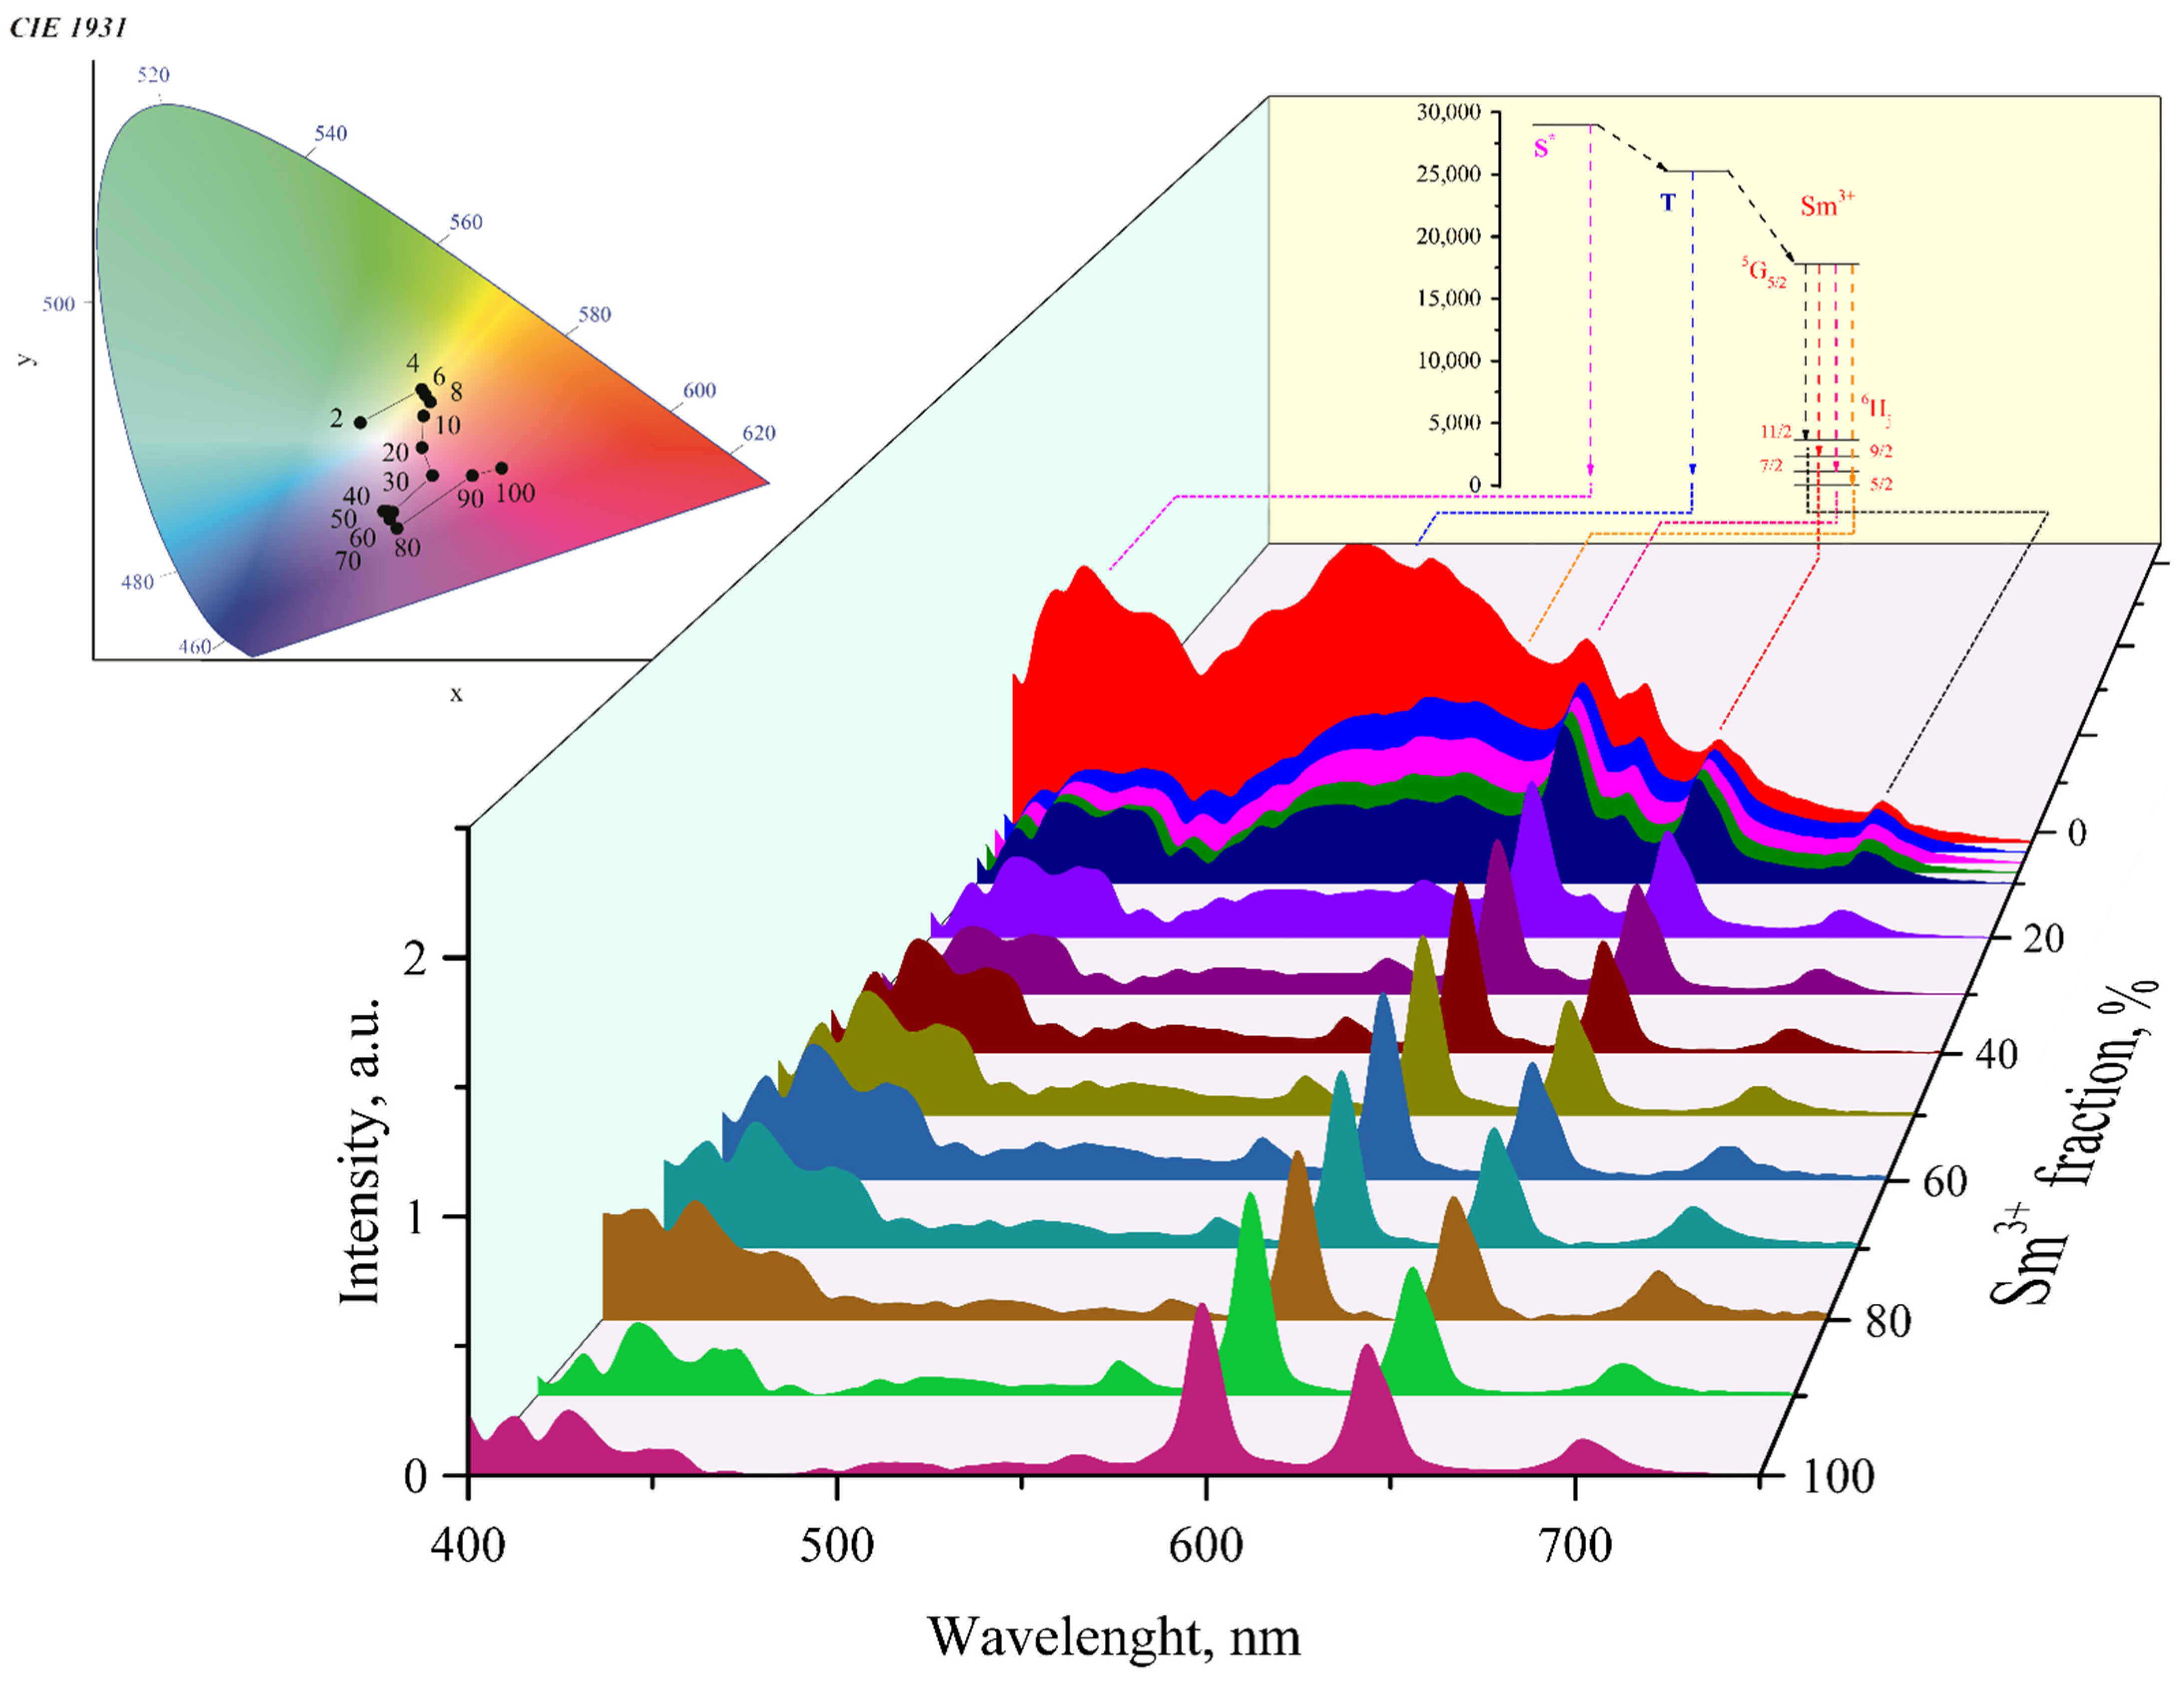
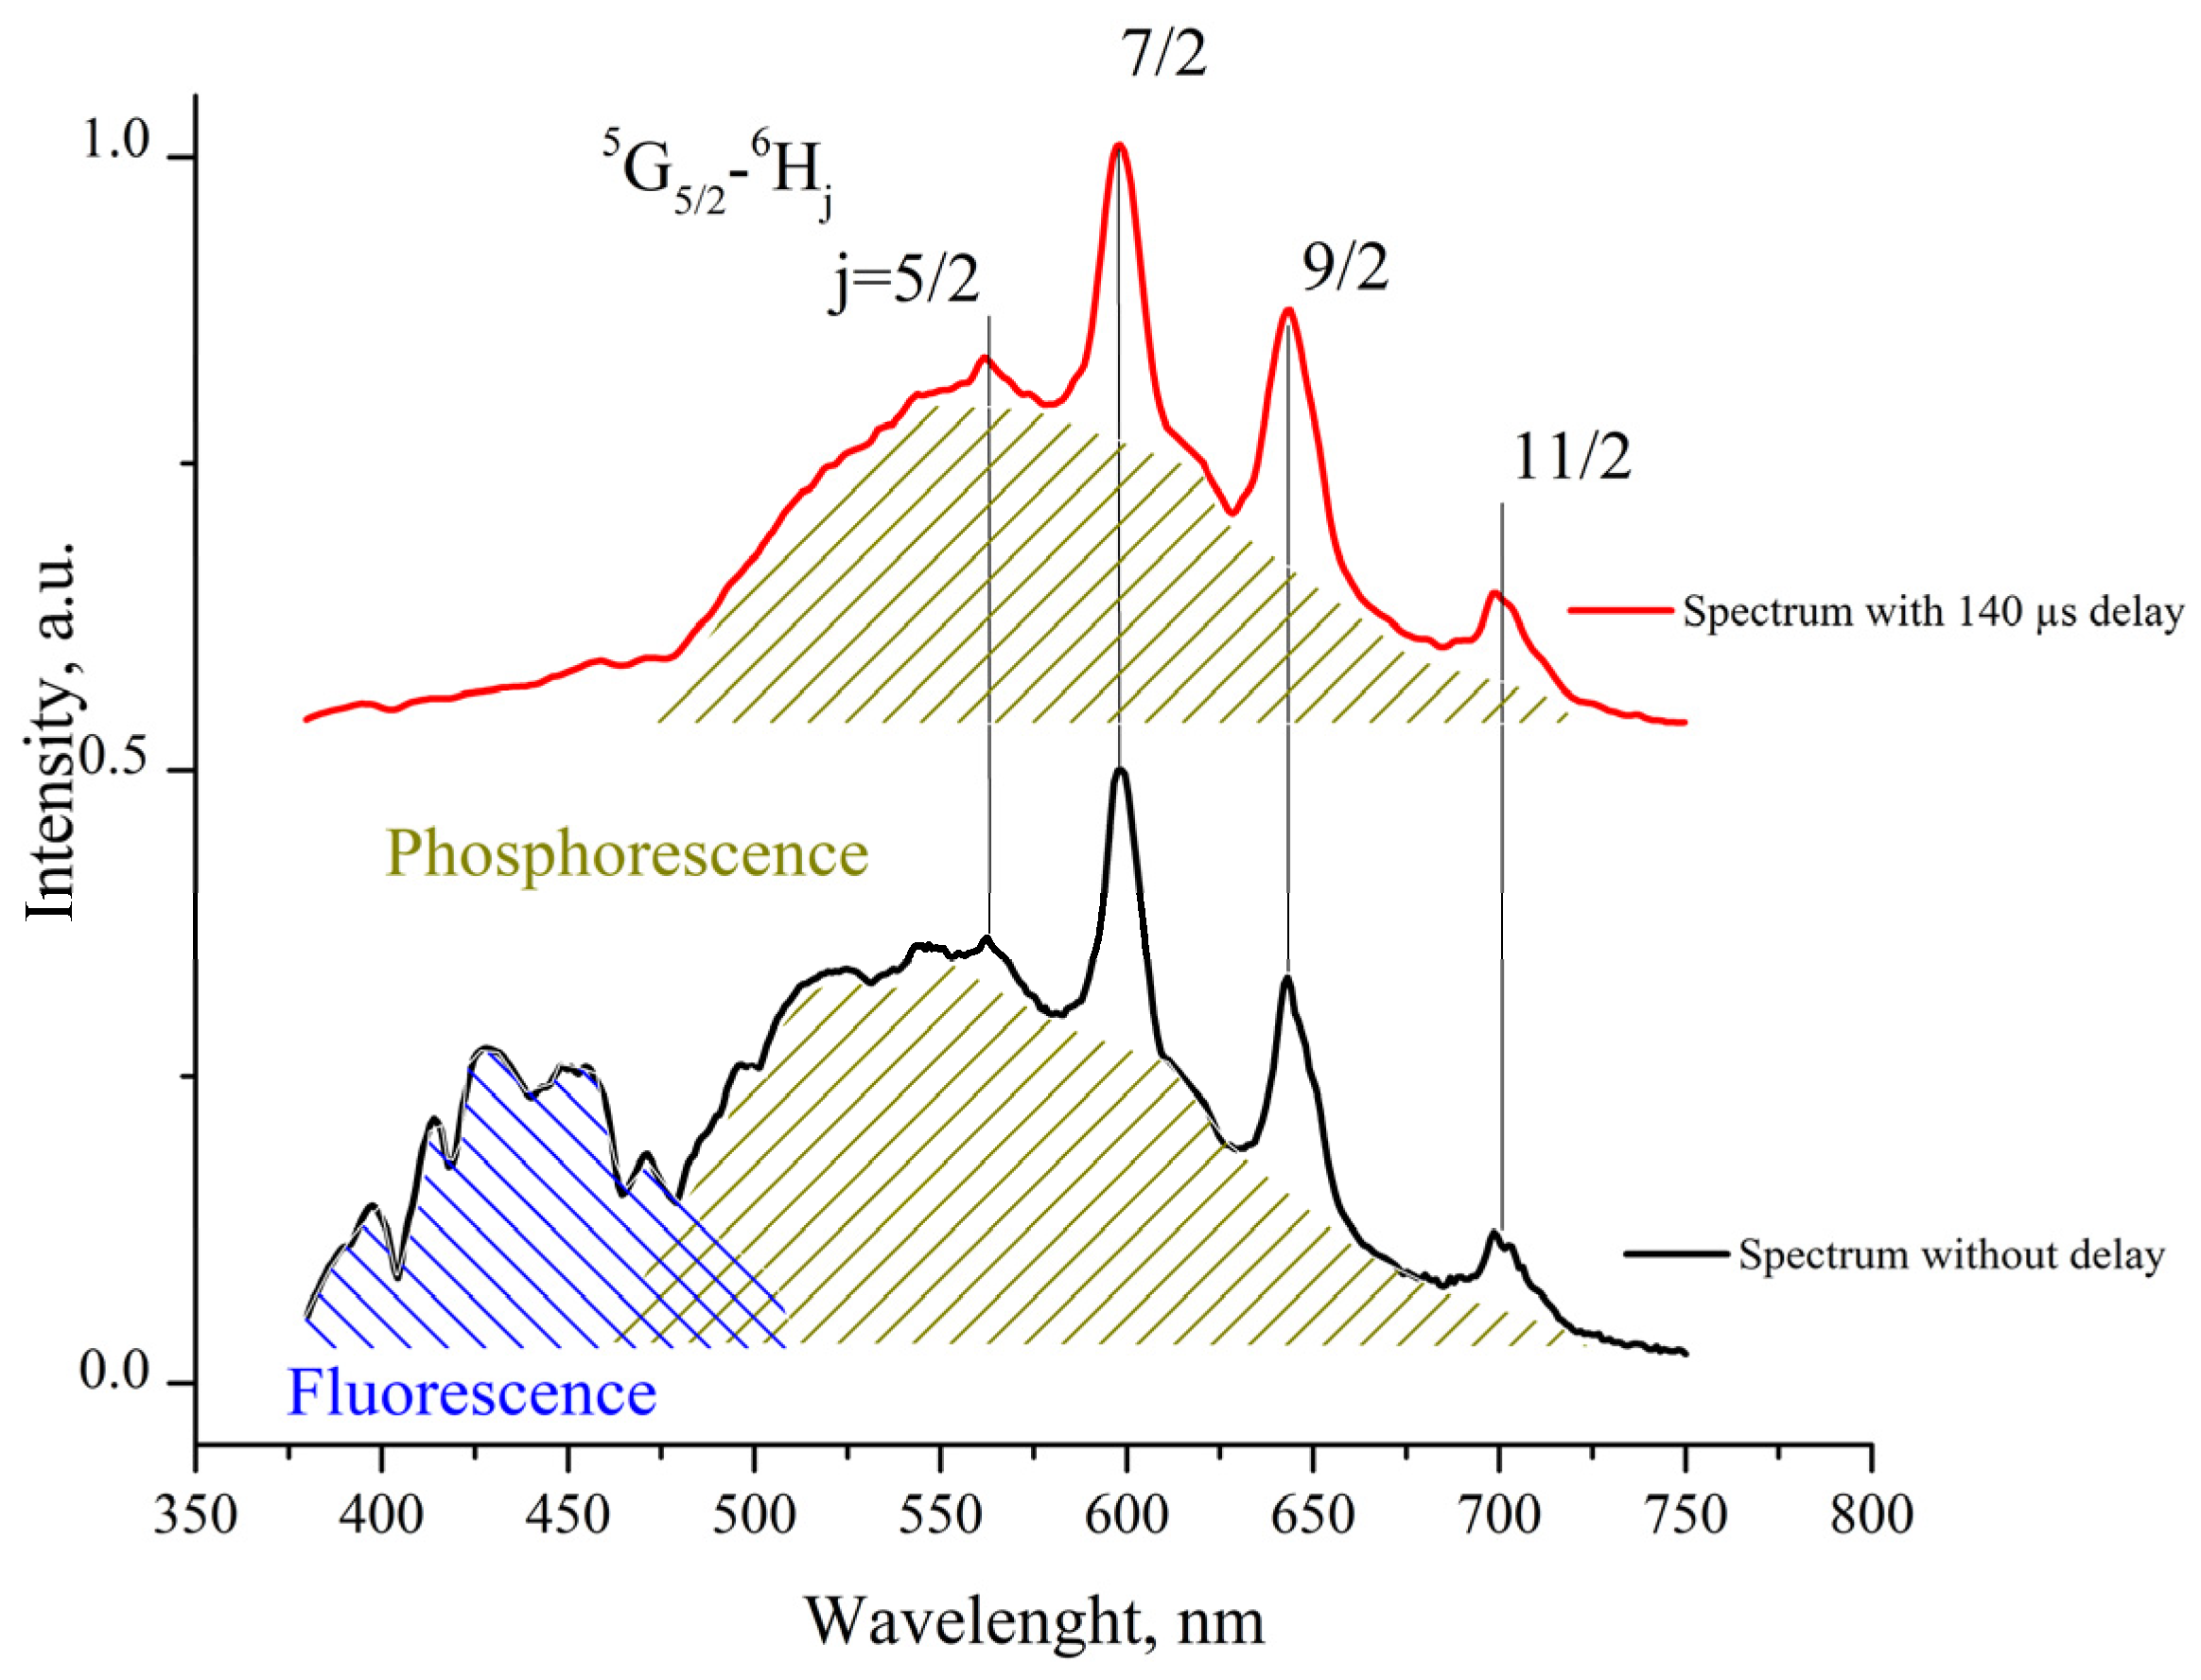
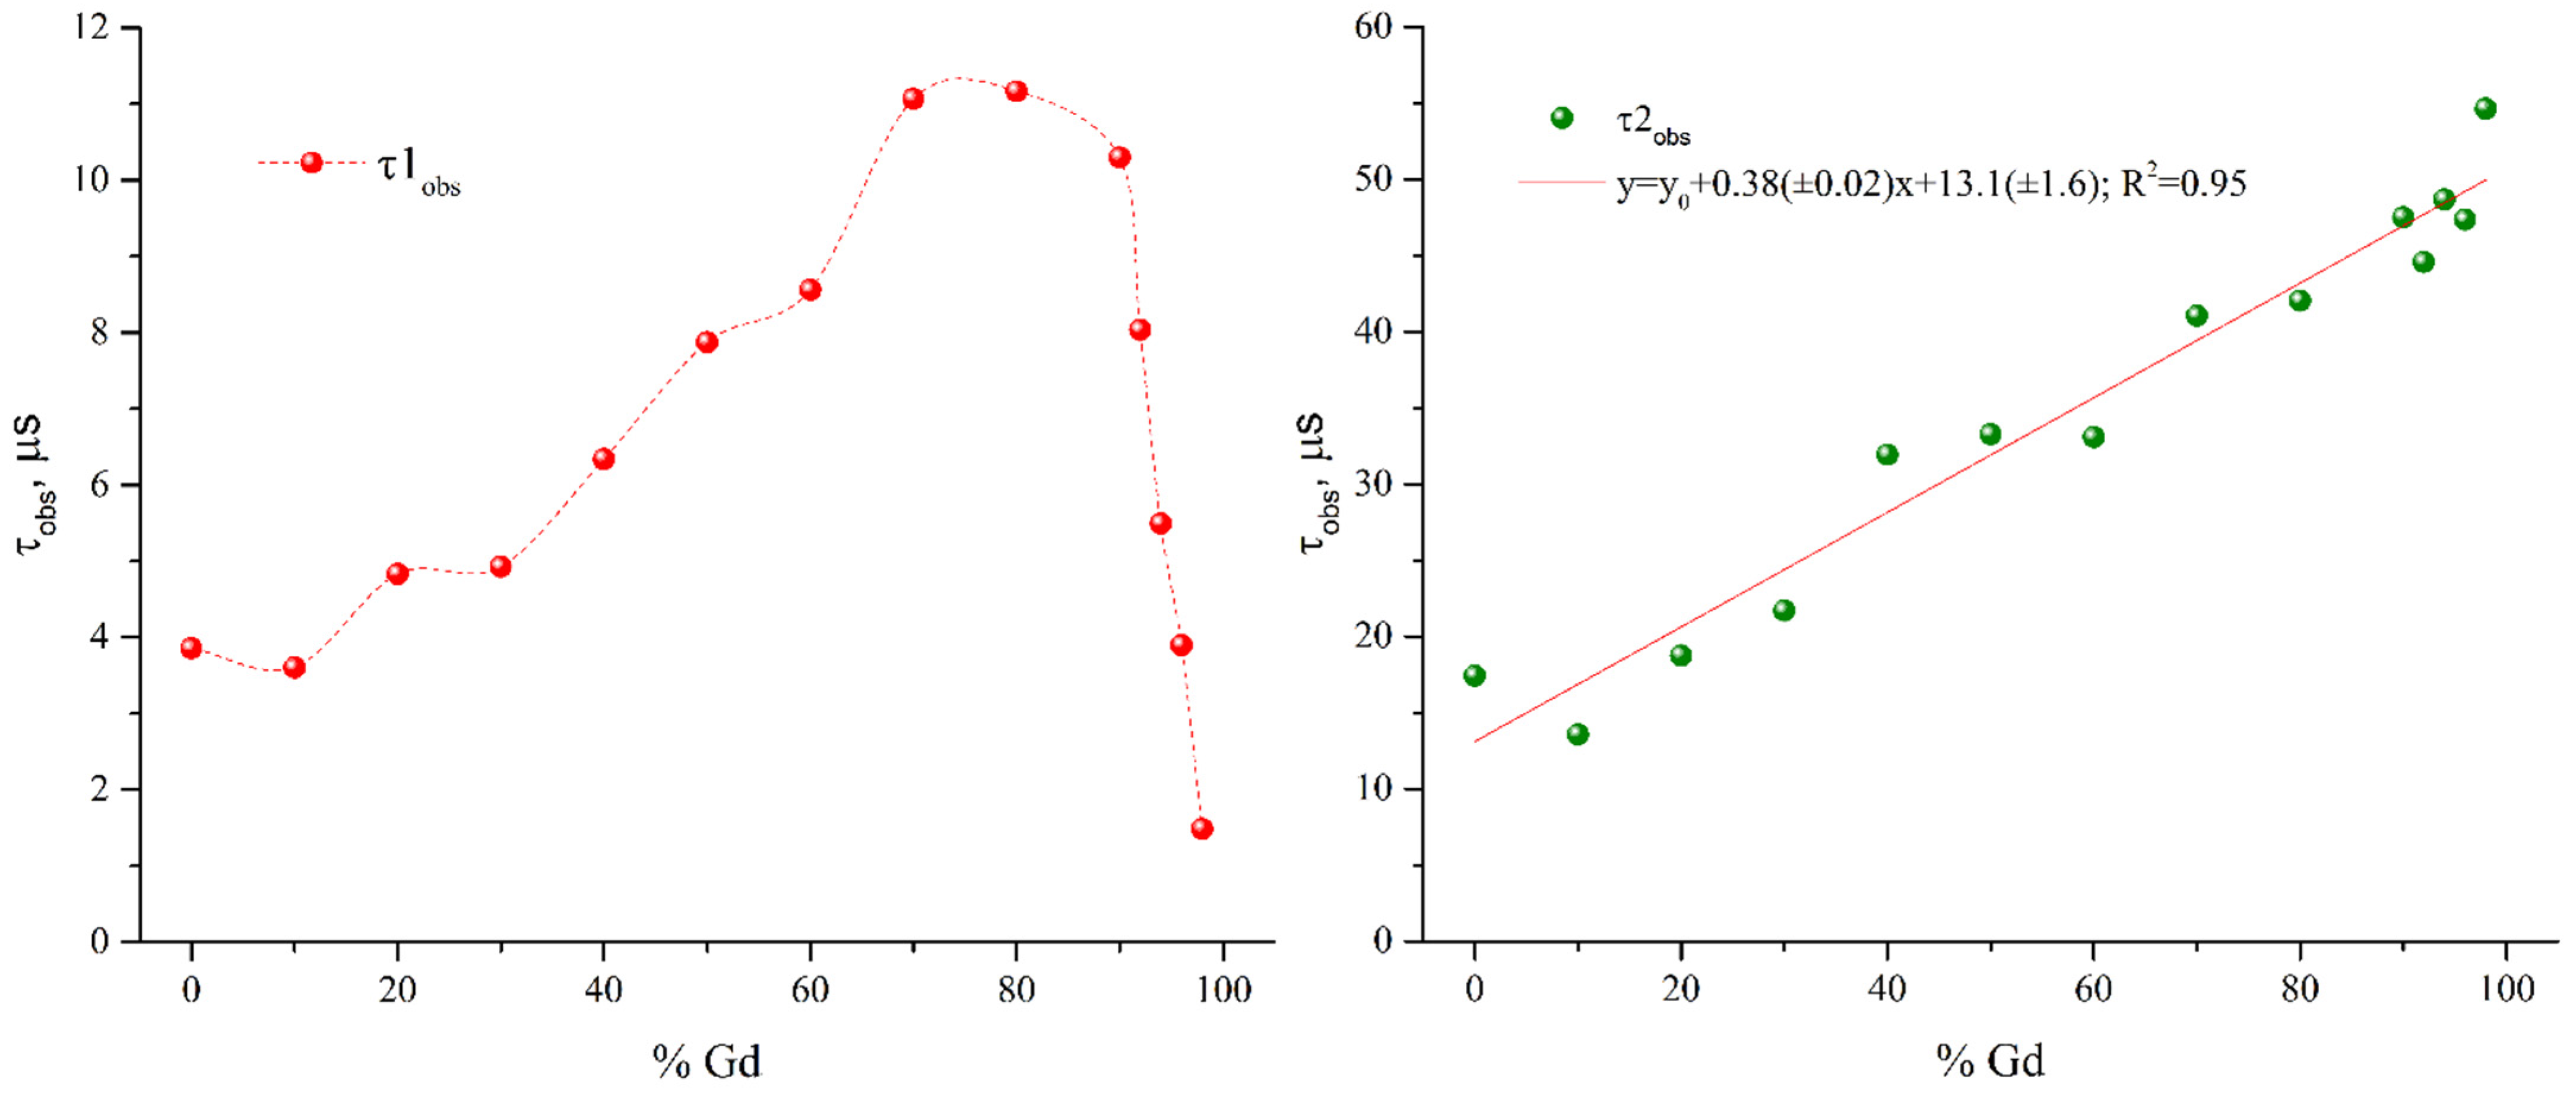
2.3. Luminescent Properties

All of the obtained compounds exhibit photoluminescence upon excitation with UV light. The Sm-Gd compounds under UV irradiation exhibit luminescence, the color of which varies from orange-red (Sm100%), characteristic of samarium complexes, to almost white, with a large dilution of Sm3+ ions with Gd3+ ions. The luminescence spectra of SmxGd1-x-TDA series samples contain bands of fluorescence and phosphorescence of the ligand, with maxima at ~430 and ~550 nm (Figure 6). The fluorescent nature of the first band is confirmed by comparing the emission spectra recorded in the fluorescence and phosphorescence mode (Figure 7). A complicated oscillatory structure is observed in the fluorescence and phosphorescence bands, which indicates the high rigidity of the framework. The contribution of the fluorescent band remains significant for any Sm3+:Gd3+ ratios, while the contribution of the phosphorescent band is significant only at high concentrations of gadolinium. This is due to the role of Gd3+ ions in the “paramagnetic effect”, which enhances the phosphorescence of and reduces the intensity of ligand fluorescence by increasing the rate of intersystem crossing (ISC) between the singlet and triple spin states [50,51,52]. This explains the unusual dependence of the color coordinates (Figure 6, inset) from the Sm3+ fraction. Color coordinates of the sample Sm02Gd98-TDA (0.290, 0.356) were found to be quite close to the white color (0.333, 0.333). In addition to ligand bands, the luminescence spectrum contains bands corresponding to the samarium transitions 4G5/24Hj, j = 5/2 (λmax = 562 nm), 7/2 (λmax = 600 nm, the most intense), 9/2 (λmax = 643 nm), 11/2 (λmax = 705–705 nm, the least intense). The presence of both ligand and lanthanide emission bands is associated with the insufficiently effective transfer of excitation energy from the ligand to the Sm3+ ion. It can be explained by high energy gap between the triplet level of the ligand (25,300 cm−1 [23]) and the resonant level of the Sm3+ ion (17,800 cm−1 [17]), although, in the case of the europium complex studied earlier (the energy of the resonance level of 17,240 cm−1), phosphorescence of the ligand was not observed [23]. Despite this fact, the luminescence of samarium complexes is usually less intense than that of the corresponding europium derivatives [17,32].
The kinetics of the luminescence decay of Sm3+ in SmxGd1-xTDA is satisfactorily described by the exponential law
I = y 0 + A 1 e t τ 1 + A 2 e t τ 2
where τ1 and τ2 are the observed lifetimes of the excited state (Figure S4, Table S2). The dependence of τ1 and τ2 on the concentration of Gd3+ ions is shown in Figure 8. In all cases, τ2 is significantly greater than τ1 in the order of magnitude of tens of µs for τ2, units of µs for τ1, and it can be concluded that τ1 refers to the luminescence of Sm3+ ions, and τ2 is associated with the phosphorescence of the ligand. For the Gd3+ complex, we observed the lifetime of the excited state of the order of 100 µs [23]; the drop is due to the transfer of excitation energy to the Sm3+ ion. The value of τ1 increases almost linearly with an increase in the concentration of Gd3+ up to a content of 60–70%, after which it drops sharply. In this case, two processes act in opposite directions: on the one hand, dilution of Sm3+ ions with Gd3+ ions leads to a decrease in concentration quenching; on the other hand, an increase in the proportion of Gd3+ increases the probability of phosphorescence of the ligand, which is confirmed by luminescence spectra. The ratio of the pre-exponential factors A1:(A1 + A2) also demonstrates a dramatic transition: at the concentration of Gd3+ more than 70%, the contribution of the ligand’s own luminescence begins to dominate the Sm3+ radiation (Figure 9).
This phenomenon is typical for weakly emitting Sm3+ and Dy3+ ions [20]. Despite this, the lifetime of the excited state of the Sm3+ ion increases with an increase in the fraction of Gd3+. This indicates the suppression of concentration quenching.
In the luminescence spectra of the Sm-Tb compounds (SmxTb1-xTDA) (Figure 10), the emission of both Sm3+ and Tb3+ ions is evident, and even with a content of Tb3+ of 98%, the intensity of the samarium bands is comparable to those of terbium (Figure 11).
Unlike series SmxGd1-x-TDA, the emission of the ligand is quenched, and its intensity decreases rapidly with an increase in the relative concentration of Tb3+. This is due to the efficient transfer of energy from the triplet level of the ligand to the resonance level of Tb3+ ions. Alongside bands corresponding to Sm3+ transitions, the luminescence excitation spectra of Sm3+ also contain bands corresponding to Tb3+ transitions, which indicates the sensitization of the luminescence of samarium ions by terbium ions. Kinetic measurements confirm this hypothesis. The decay curves of Tb3+ ions (Figure S5, Table S3) are described as biexponential dependences, both components of which increase significantly only with an increase in the fraction of terbium to 90% and higher (Figure 12).
On the other hand, for samarium luminescence, there is an initial growth period, which we previously observed in terbium–europium bimetallic complexes [49]. The presence of this growth period makes it difficult to determine the radiative lifetime of Sm3+ ions, but confirms the presence of the sensitization of the luminescence of samarium ions by Tb3+ ions. For the sample with the highest Tb:Sm ratio, Sm02Tb98-TDA, it is possible to successfully apply the energy transfer model proposed earlier (Figure 13). In this case, the decay of samarium luminescence is described with an equation:
I = y 0 + A 1 e t τ 1 A 2 e t τ 2  
where the second exponent corresponds to the transfer of energy from terbium to samarium.
This makes it possible to estimate the radiative time of samarium (τ1) as 50.8 μs, which is 34 times greater than the radiative time in the Sm02Gd98-TDA sample. For samples with a higher content of samarium, such an analysis cannot be carried out, since the decay process is too fast, but Figure S8 allows us to definitively state that dilution with terbium ions dramatically increases the radiative lifetime of Sm3+ ions.
The excitation spectra of complexes SmxGd1-x-TDA and SmxTb1-x-TDA (Figures S4 and S5, respectively) contain both a wide band of π-π* transitions of the ligand (260–290 nm) and bands corresponding to direct excitation through f-f transitions of lanthanides. The relative intensity of the ligand excitation band is the highest at the lowest fraction of samarium (2%), while, for samples with a high metal content, the excitation through the transitions of the latter has comparable intensity. This is due to the fact that, for samples with low content of Sm3+, the concentration of the chromophore ligand is higher, which makes the sensitization of samarium luminescence more efficient. For SmxTb1-x-TDA compounds, when registering the luminescence at 648 nm, which corresponds to the 5G5/2-6H9/2 transition of samarium, excitation is observed both through the Sm3+ and Tb3+ transitions. This indicates the sensitization of the samarium luminescence by terbium ions.

3. Materials and Methods

Commercially available reagents and solvents (Sigma-Aldrich, Burlington, MA, USA) were used. Lanthanide nitrates were obtained by the dissolving of the corresponding oxides (99.999%, LANHIT, Moscow, Russia) in concentrated nitric acid (reagent-grade, XPC). The concentration of the Ln(NO3)3 solutions was determined by complexometric titration (indicator—Xylenole Orange). Solutions were prepared using deionized (18 MΩ·cm) water.
IR spectra were recorded on an IR-Fourier spectrometer FT-IR Spectrum One Perkin-Elmer spectrum in KBr tablets of the 400–4000 cm–1 region with a resolution of 0.5 cm–1.
Thermal analysis was carried out on a NETZSCHSTA 409 PC/PG device in an air atmosphere, at a heating rate of 10 °C/min. Powder diffractograms were recorded using a diffractometer of the Bruker D8 Advance model (CuKα, λ = 1.5418 Å).
ICP-MS was performed using an inductively coupled plasma mass spectrometer ELAN mod. 9000, DRC II, DRC-e. To carry out the analysis, a sample of ~0.2000 g of the complex was calcinated in air in a porcelain crucible at 600 °C; the remainder was quantitatively transferred to 10 mL volumetric flasks and dissolved in 3–5 mL of distilled HNO3, after which the solutions were diluted the required number of times. Calibration solutions were prepared based on Ln(NO3)3*6H2O crystallohydrates, setting the concentration by complexometric titration. To reduce the errors associated with the instability of the solution inside the ionizer, an internal standard with a solution of rhodium sulfate with a concentration of 1.13·10−2 M was used.
The pH of the solutions was established using the pH meter I-160MI (Measuring Equipment, Moscow, Russia).
Photoluminescence spectra and lifetimes of excited states of powdered samples were measured using a Horiba-Jobin-Yvon Fluorolog-QM spectrofluorimeter (Palaiseau, France) equipped with a 75 W ArcTune xenon lamp and a Hamamatsu R-FL-QM-R13456 photomultiplier sensitive in the radiation range of 200–980 nm.
The data were collected using a Bruker D8 Quest diffractometer with a Photon III detector at a temperature of 100 (2) (Sm-TDA) and 120(2) (Gd-TDA) K, MoKα radiation (λ = 0.71073 Å), φ and ω scanning mode. Single crystals of compounds Sm-TDA and Gd-TDA were obtained as a result of solvothermal synthesis. The structure was solved with direct methods and refined by the least-squares method in the full-matrix anisotropic approximation on F2 with the use of SHELXTL и Olex2 software packages [53,54,55]. Crystals of Sm-TDA and Gd-TDA are racemic twins with a component ratio of 0.55:0.45 (Sm-TDA) and 0.60:0.40 (Gd-TDA). In addition, the crystal structures are pseudosymmetric due to the arrangement of heavy samarium and gadolinium atoms, approximately (by 87%, according to checkCif) corresponding to the more highly symmetric Pnma group. The hydrogen atoms were placed in the calculated positions and refined using the “riding” model. The crystallographic data, experimental parameters, and structural refinements are given in Table S1. The atomic coordinates, bond lengths, valence angles, and thermal displacement parameters are deposited in the Cambridge Structural Data Bank (CCDC No. 2097364, No. 2177609).
The synthesis of H3TDA was carried out according to the modified method described for 1-methyl-[1H]-1,2,3-triazole-4,5-dicarboxylic acid [56]:
First, 5.96 g (50.0 mmol) of [1H]-1,2,3-benzotriazole was dissolved in 350 mL of distilled water. After heating the solution to 80 °C with constant stirring, 44.3 g (282 mmol) of potassium permanganate was added in small portions. A day later, at reduced pressure, the solution was separated from the precipitated MnO2 by filtration. The filtrate was acidified with concentrated hydrochloric acid to pH = 1. The white crystalline precipitate of triazole dicarboxylic acid was filtered at reduced pressure and dried. The yield was 70%. The melting point was 200 °C (with decomposition), which coincides with the literature data [57]. IR (KBr, ν, cm–1): 3542 s, 2900–2400 m, 1720 m, 1585 m, 1534, 1395 w, 1295 m, 995 s; NMR 13C (DMSO-d6; δ, m.d.): 161.5, 137.8.
Synthesis of complexes Sm-TDA, Gd-TDA, SmxLn1-x-TDA x = 0.1 (Sm0.9Ln0.1-TDA), x = 0.2 (Sm0.8-Ln0.2-TDA)…Sm0.1Ln0.9-TDA, Ln=Tb, Gd was carried out according to a modified method of synthesis of the europium complex [23]: in a Teflon container (10 mL) was placed 78.5 mg (0.5 mmol) H3TDA, 3.00 mL DMF, and 2.5 mL 0.2 M Sm(NO3)3 solution or required volumes of Sm(NO3)3 (0.2 M) and Gd(NO3)3 (0.2 M) or Tb(NO3)3 (0.2 M) solutions. A 5% HNO3 solution was added until pH 1.5 was reached. The container was sealed, placed in a steel autoclave, heated to 160 °C (50 °C/h), and kept at 160 °C for 48 h. Then, the container was cooled (2 °C/h) to room temperature. The resulting white precipitate was filtered under vacuum, washed with water (5 × 10 mL) and ethanol (2 × 10 mL), and dried in vacuo over P4O10 for 48 h.

4. Conclusions

In summary, as a result of replacing water with a water–DMF mixture during solvothermal synthesis, new MOFs based on [1H]-1,2,3-triazole-4,5-dicarboxic acid containing dimethylammonium cations and formate anions were obtained. The resulting compounds do not contain water or DMF in the inner coordination sphere of the REE, which prevents the vibrational quenching of the samarium complex. Mixed-metal systems SmxGd1-x-TDA and SmxTb1-x-TDA demonstrate multicomponent emission, which includes, in addition to the emission of samarium, in the first case, the fluorescence and phosphorescence of the ligand, and in the second case, the emission of terbium. This allows one to finely tune the color coordinates of the luminescence by changing the ratio of lanthanides. In addition to the color coordinates, there is also a change in the lifetime of the excited state of samarium, which increases with an increase in the concentration of gadolinium and terbium ions, which is associated with both the suppression of concentration quenching and the sensitization of samarium luminescence by terbium ions.

Supplementary Materials

The following supporting information can be downloaded at: https://www.mdpi.com/article/10.3390/inorganics10080104/s1, Table S1 Selected crystal data and parameters for structure refinement of the Sm-TDA and Gd-TDA; Table S2 Sm3+ luminescence fitting parameters for SmxGd1-x-TDA; Table S3 Tb3+ luminescence fitting parameters for SmxTb1-x-TDA; Figure S1 IR spectra of complexes SmxGd1-x-TDA and free H3TDA ligand; Figure S2 IR spectra of complexes SmxTb1-x-TDA and free H ligand; Figure S3 Excitation spectra of SmxGd1-x-TDA complexes (λem 648 nm); Figure S4 Sm3+ decay curves for SmxGd1-x-TDA; λex = 280 nm, λem = 648 nm; Figure S5 Tb3+ decay curves for SmxTb1-x-TDA; λex = 280 nm, λem = 545 nm; Figure S6 Sm3+ decay curves for SmxTb1-x-TDA; λex = 280 nm, λem = 648 nm.

Author Contributions

Conceptualization, Y.A.B., A.A.I. and A.M.L.; formal analysis, A.A.I., I.A.A. and A.V.S.; investigation, A.A.I., A.V.S., V.E.G. and I.A.A.; resources, Y.A.B. and I.V.T.; data curation, Y.A.B., V.E.G. and A.M.L.; writing—original draft preparation, A.A.I. and Y.A.B.; writing—review and editing, Y.A.B., V.E.G., A.A.I., A.M.L. and I.V.T.; visualization, Y.A.B., A.M.L. and A.V.S.; supervision, Y.A.B. and I.V.T.; project administration, Y.A.B.; funding acquisition, Y.A.B. and I.V.T. All authors have read and agreed to the published version of the manuscript.

Funding

The reported study was funded by RFBR, project number 19-03-00263. Photophysical measurements were supported by the Russian Science Foundation, project number 19-13-00272.

Institutional Review Board Statement

Not applicable.

Informed Consent Statement

Not applicable.

Data Availability Statement

Not applicable.

Acknowledgments

This work was supported in part by the M.V. Lomonosov Moscow State University Program of Development. The authors thank Anna M. Shmykova for her help in preparing the graphical abstract.

Conflicts of Interest

The authors declare no conflict of interest.

References

  1. Nehra, K.; Dalal, A.; Hooda, A.; Bhagwan, S.; Saini, R.K.; Mari, B.; Kumar, S.; Singh, D. Lanthanides β-Diketonate Complexes as Energy-Efficient Emissive Materials: A Review. J. Mol. Struct. 2022, 1249, 131531. [Google Scholar] [CrossRef]
  2. Álvarez, Á.L.; Coya, C. OLEDs Based on Ln(III) Complexes for near-Infrared Emission. In Lanthanide-Based Multifunctional Materials; Elsevier: Amsterdam, The Netherlands, 2018; pp. 133–170. ISBN 9780128138403. [Google Scholar]
  3. Zinna, F.; Pasini, M.; Galeotti, F.; Botta, C.; Di Bari, L.; Giovanella, U. Design of Lanthanide-Based OLEDs with Remarkable Circularly Polarized Electroluminescence. Adv. Funct. Mater. 2017, 27, 1603719. [Google Scholar] [CrossRef]
  4. Taydakov, I.V.; Akkuzina, A.A.; Avetisov, R.I.; Khomyakov, A.V.; Saifutyarov, R.R.; Avetissov, I.C. Effective Electroluminescent Materials for OLED Applications Based on Lanthanide 1.3-Diketonates Bearing Pyrazole Moiety. J. Lumin. 2016, 177, 31–39. [Google Scholar] [CrossRef]
  5. Thejo Kalyani, N.; Dhoble, S.J.; Pode, R.B. Fabrication of Red Organic Light Emitting Diodes (OLEDs) Using EuxY(1-x)(TTA)3Phen Organic Complexes for Solid State Lighting. Adv. Mater. Lett. 2011, 2, 65–70. [Google Scholar] [CrossRef]
  6. DaCosta, M.V.; Doughan, S.; Han, Y.; Krull, U.J. Lanthanide Upconversion Nanoparticles and Applications in Bioassays and Bioimaging: A Review. Anal. Chim. Acta 2014, 832, 1–33. [Google Scholar] [CrossRef]
  7. Bünzli, J.C.G. Luminescence Bioimaging with Lanthanide Complexes; John Wiley & Sons, Inc.: Hoboken, NJ, USA, 2014; Volume 9781119950, ISBN 9781118682760. [Google Scholar]
  8. Ning, Y.; Zhu, M.; Zhang, J.L. Near-Infrared (NIR) Lanthanide Molecular Probes for Bioimaging and Biosensing. Coord. Chem. Rev. 2019, 399, 213028. [Google Scholar] [CrossRef]
  9. Wang, J.; Yu, M.; Chen, L.; Li, Z.; Li, S.; Jiang, F.; Hong, M. Construction of a Stable Lanthanide Metal-Organic Framework as a Luminescent Probe for Rapid Naked-Eye Recognition of Fe3+ and Acetone. Molecules 2021, 26, 1695. [Google Scholar] [CrossRef]
  10. Gontcharenko, V.E.; Lunev, A.M.; Taydakov, I.V.; Korshunov, V.M.; Drozdov, A.A.; Belousov, Y.A. Luminescent Lanthanide-Based Sensor for H2O Detection in Aprotic Solvents and D2O. IEEE Sens. J. 2019, 19, 7365–7372. [Google Scholar] [CrossRef]
  11. Xia, T.; Wan, Y.; Li, Y.; Zhang, J. Highly Stable Lanthanide Metal–Organic Framework as an Internal Calibrated Luminescent Sensor for Glutamic Acid, a Neuropathy Biomarker. Inorg. Chem. 2020, 59, 8809–8817. [Google Scholar] [CrossRef]
  12. Lunev, A.M.; Belousov, Y.A. Luminescent Sensor Materials Based on Rare-Earth Element Complexes for Detecting Cations, Anions, and Small Molecules. Russ. Chem. Bull. 2022, 71, 825–857. [Google Scholar] [CrossRef]
  13. Brites, C.D.S.; Balabhadra, S.; Carlos, L.D. Lanthanide-Based Thermometers: At the Cutting-Edge of Luminescence Thermometry. Adv. Opt. Mater. 2019, 7, 1801239. [Google Scholar] [CrossRef] [Green Version]
  14. Bao, G.; Wong, K.-L.; Jin, D.; Tanner, P.A. A Stoichiometric Terbium-Europium Dyad Molecular Thermometer: Energy Transfer Properties. Light Sci. Appl. 2018, 7, 96. [Google Scholar] [CrossRef] [PubMed]
  15. Runowski, M. Pressure and Temperature Optical Sensors: Luminescence of Lanthanide-Doped Nanomaterials for Contactless Nanomanometry and Nanothermometry. In Handbook of Nanomaterials in Analytical Chemistry: Modern Trends in Analysis; Elsevier: Amsterdam, The Netherlands, 2019; pp. 227–273. ISBN 9780128166994. [Google Scholar]
  16. Lyubov, D.M.; Carneiro Neto, A.N.; Fayoumi, A.; Lyssenko, K.A.; Korshunov, V.M.; Taydakov, I.V.; Salles, F.; Guari, Y.; Larionova, J.; Carlos, L.D.; et al. Employing Three-Blade Propeller Lanthanide Complexes as Molecular Luminescent Thermometers: Study of Temperature Sensing through a Concerted Experimental/Theory Approach. J. Mater. Chem. C 2022, 10, 7176–7188. [Google Scholar] [CrossRef]
  17. Bünzli, J.; Eliseeva, S. V Basics of Lanthanides Photophysics. In Lanthanide Luminescence; Springer Series on Fluorescence: Methods and Applications; Hänninen, P., Härmä, H., Eds.; Springer: Berlin/Heidelberg, Germany, 2010; Volume 7, pp. 1–45. [Google Scholar] [CrossRef] [Green Version]
  18. Latva, M.; Takalob, H.; Mukkala, V.M.; Matachescu, C.; Rodríguez-Ubis, J.C.; Kankare, J. Correlation between the Lowest Triplet State Energy Level of the Ligand and Lanthanide(III) Luminescence Quantum Yield. J. Lumin. 1997, 75, 149–169. [Google Scholar] [CrossRef]
  19. Shi, M.; Li, F.; Yi, T.; Zhang, D.; Hu, H.; Huang, C. Tuning the Triplet Energy Levels of Pyrazolone Ligands to Match the 5D0 Level of Europium (III). Inorg. Chem. 2005, 44, 8929–8936. [Google Scholar] [CrossRef]
  20. Belousov, Y.A.; Korshunov, V.M.; Metlin, M.T.; Metlina, D.A.; Kiskin, M.A.; Aminev, D.F.; Datskevich, N.P.; Drozdov, A.A.; Pettinari, C.; Marchetti, F.; et al. Towards Bright Dysprosium Emitters: Single and Combined Effects of Environmental Symmetry, Deuteration, and Gadolinium Dilution. Dye. Pigment. 2022, 199, 110078. [Google Scholar] [CrossRef]
  21. Rodrigues, C.V.; Luz, L.L.; Dutra, J.D.L.; Junior, S.A.; Malta, O.L.; Gatto, C.C.; Streit, H.C.; Freire, R.O.; Wickleder, C.; Rodrigues, M.O. Unusual Photoluminescence Properties of the 3D Mixed-Lanthanide-Organic Frameworks Induced by Dimeric Structures: A Theoretical and Experimental Approach. Phys. Chem. Chem. Phys. 2014, 16, 14858–14866. [Google Scholar] [CrossRef]
  22. Litsis, O.O.; Ovchynnikov, V.A.; Scherbatskii, V.P.; Nedilko, S.G.; Sliva, T.Y.; Dyakonenko, V.V.; Shishkin, O.V.; Davydov, V.I.; Gawryszewska, P.; Amirkhanov, V.M. Lanthanide Mixed-Ligand Complexes of the [Ln(CAPh)3(Phen)] and [LaxEu1-x(CAPh)3(Phen)] (CAPh = Carbacylamidophosphate) Type. A Comparative Study of Their Spectral Properties. Dalt. Trans. 2015, 44, 15508–15522. [Google Scholar] [CrossRef]
  23. Belousov, Y.A.; Goncharenko, V.E.; Lunev, A.M.; Sidoruk, A.V.; Bezzubov, S.I.; Taidakov, I.V. New Heteroligand Europium and Gadolinium Formate Triazole Dicarboxylates: Synthesis, Structures, and Luminescence Properties. Russ. J. Coord. Chem. Khimiya 2020, 46, 394–401. [Google Scholar] [CrossRef]
  24. Demakov, P.A.; Vasileva, A.A.; Volynkin, S.S.; Ryadun, A.A.; Samsonenko, D.G.; Fedin, V.P.; Dybtsev, D.N. Cinnamal Sensing and Luminescence Color Tuning in a Series of Rare-Earth Metal−organic Frameworks with Trans-1,4-Cyclohexanedicarboxylate. Molecules 2021, 26, 5145. [Google Scholar] [CrossRef]
  25. Demakov, P.A.; Ryadun, A.A.; Dorovatovskii, P.V.; Lazarenko, V.A.; Samsonenko, D.G.; Brylev, K.A.; Fedin, V.P.; Dybtsev, D.N. Intense Multi-Colored Luminescence in a Series of Rare-Earth Metal-Organic Frameworks with Aliphatic Linkers. Dalt. Trans. 2021, 50, 11899–11908. [Google Scholar] [CrossRef] [PubMed]
  26. Varaksina, E.A.; Taydakov, I.V.; Ambrozevich, S.A.; Selyukov, A.S.; Lyssenko, K.A.; Jesus, L.T.; Freire, R.O. Influence of Fluorinated Chain Length on Luminescent Properties of Eu3+ β-Diketonate Complexes. J. Lumin. 2018, 196, 161–168. [Google Scholar] [CrossRef]
  27. Andrews, P.C.; Deacon, G.B.; Gee, W.J.; Junk, P.C.; Urbatsch, A. Synthesis and Characterisation of Thiophene-Functionalised Lanthanoid Diketonate Clusters with Solvent-Modulated Europium Luminescence. Eur. J. Inorg. Chem. 2012, 2012, 3273–3282. [Google Scholar] [CrossRef]
  28. Belousov, Y.A.; Utochnikova, V.V.; Kuznetsov, S.S.; Andreev, M.N.; Dolzhenko, V.D.; Drozdov, A.A. New Rare-Earth Metal Acyl Pyrazolonates: Synthesis, Crystals Structures, and Luminescence Properties. Russ. J. Coord. Chem. Khimiya 2014, 40, 627–633. [Google Scholar] [CrossRef]
  29. Belousov, Y.A.; Drozdov, A.A. Lanthanide Acylpyrazolonates: Synthesis, Properties and Structural Features. Russ. Chem. Rev. 2012, 81, 1159–1169. [Google Scholar] [CrossRef]
  30. Belousov, Y.A.; Drozdov, A.A.; Verteletskii, P.P.; Prishchenko, A.A.; Livantsova, L.I.; Novikova, O.P. Mixed-Ligand Lanthanide Complexes with Acylpyrazolones and Phosphorus-Containing Ligands. Russ. J. Coord. Chem. Khimiya 2013, 39, 278–282. [Google Scholar] [CrossRef]
  31. Hu, Z.; Deibert, B.J.; Li, J. Luminescent Metal-Organic Frameworks for Chemical Sensing and Explosive Detection. Chem. Soc. Rev. 2014, 43, 5815–5840. [Google Scholar] [CrossRef] [Green Version]
  32. Belousov, Y.A.; Drozdov, A.A.; Taydakov, I.V.; Marchetti, F.; Pettinari, R.; Pettinari, C. Lanthanide Azolecarboxylate Compounds: Structure, Luminescent Properties and Applications. Coord. Chem. Rev. 2021, 445, 214084. [Google Scholar] [CrossRef]
  33. Janicki, R.; Mondry, A.; Starynowicz, P. Carboxylates of Rare Earth Elements. Coord. Chem. Rev. 2017, 340, 98–133. [Google Scholar] [CrossRef]
  34. Barsukova, M.O.; Samsonenko, D.G.; Fedin, V.P. Crystal Structure of Metal-Organic Frameworks Based on Terbium and 1,4-Naphthalenedicarboxylic Acid. J. Struct. Chem. 2020, 61, 1090–1096. [Google Scholar] [CrossRef]
  35. Yudina, Y.A.; Samsonova, A.M.; Bolotov, V.A.; Demakov, P.A.; Samsonenko, D.G.; Fedin, V.P.; Dybtsev, D.N. Metal-Organic Coordination Polymers of Lanthanides(Iii) With Thienothiophendicarboxylate Ligands. J. Struct. Chem. 2021, 62, 1599–1606. [Google Scholar] [CrossRef]
  36. Beeby, A.; Clarkson, I.M.; Dickins, R.S.; Faulkner, S.; Parker, D.; Royle, L.; De Sousa, A.S.; Williams, J.A.G.; Woods, M. Non-Radiative Deactivation of the Excited States of Europium, Terbium and Ytterbium Complexes by Proximate Energy-Matched OH, NH and CH Oscillators: An Improved Luminescence Method for Establishing Solution Hydration States. J. Chem. Soc. Perkin Trans. 2 1999, 2, 493–503. [Google Scholar] [CrossRef]
  37. Chen, C.; Zhang, S.Y.; Song, H.-B.; Shi, W.; Zhao, B.; Cheng, P. One-Dimensional Lanthanide Coordination Polymers as Promising Luminescent Materials. Inorg. Chim. Acta 2009, 362, 2749–2755. [Google Scholar] [CrossRef]
  38. Zhang, X.; Xu, N.; Zhang, S.-Y.; Zhao, X.-Q.; Cheng, P. From 1D Zigzag Chains to 3D Chiral Frameworks: Synthesis and Properties of Praseodymium(iii) and Neodymium(iii) Coordination Polymers. RSC Adv. 2014, 4, 40643–40650. [Google Scholar] [CrossRef]
  39. Shi, W.; Chen, X.Y.; Xu, N.; Song, H.-B.; Zhao, B.; Cheng, P.; Liao, D.Z.; Yan, S.P. Synthesis, Crystal Structures, and Magnetic Properties of 2D Manganese(II) and 1D Gadolinium(III) Coordination Polymers with 1H-1,2,3-Triazole-4,5- Dicarboxylic Acid. Eur. J. Inorg. Chem. 2006, 4931–4937. [Google Scholar] [CrossRef]
  40. Yuan, G.; Shao, K.Z.; Wang, X.L.; Lan, Y.Q.; Du, D.Y.; Su, Z.M. A Series of Novel Chiral Lanthanide Coordination Polymers with Channels Constructed from 16Ln-Based Cage-like Building Units. Cryst. Eng. Comm. 2010, 12, 1147–1152. [Google Scholar] [CrossRef]
  41. Chen, C.-J.; Gao, J.-Y.; Zhao, X.; Chang, L.-M.; Liu, Y.-L.; Mo, H.-H.; Yue, S.-T. 3D Coordination Polymers with Chiral Structures, [Ln2(Tda)2(H2O)3]·5H2O: Hydrothermal Synthesis, Structural Characterization, and Luminescent Properties. Z. Anorg. Allg. Chem. 2012, 638, 2324–2328. [Google Scholar] [CrossRef]
  42. Zou, J.Y.; Shi, W.; Xu, N.; Gao, H.L.; Cui, J.Z.; Cheng, P. Cobalt(II)-Lanthanide(III) Heterometallic Metal-Organic Frameworks with Unique (6,6)-Connected Nia Topologies with 1H-1,2,3-Triazole-4,5-Dicarboxylic Acid: Syntheses, Structures and Magnetic Properties. Eur. J. Inorg. Chem. 2014, 2014, 407–412. [Google Scholar] [CrossRef]
  43. Cao, X.X.; Chen, L.Z.; Pan, Q.J.; Huang, Y. Synthesis, Structures, Luminescent and Dielectric Properties of Lanthanide Coordination Polymers. J. Coord. Chem. 2016, 69, 2580–2590. [Google Scholar] [CrossRef]
  44. Jin, J.C.; Tong, W.Q.; Fu, A.Y.; Xie, C.G.; Chang, W.G.; Wu, J.; Xu, G.N.; Zhang, Y.N.; Li, J.; Li, Y.; et al. Four Unexpected Lanthanide Coordination Polymers Involving in Situ Reaction of Solvent N, N-Dimethylformamide. J. Solid State Chem. 2015, 225, 216–221. [Google Scholar] [CrossRef]
  45. Demakov, P.A.; Ryadun, A.A.; Samsonenko, D.G.; Dybtsev, D.N.; Fedin, V.P. Structure and Luminescent Properties of Europium(III) Coordination Polymers With Thiophene Ligands. J. Struct. Chem. 2020, 61, 1965–1974. [Google Scholar] [CrossRef]
  46. Kistaiah, P.; Sathyanarayana Murthy, K.; Iyengar, L.; Krishna Rao, K.V. X-Ray Studies on the High Pressure Behaviour of Some Rare-Earth Formates. J. Mater. Sci. 1981, 16, 2321–2323. [Google Scholar] [CrossRef]
  47. Bezzubov, S.I.; Churakov, A.V.; Belousov, Y.A.; Bilyalova, A.A.; Lavrova, M.A.; Zharinova, I.S.; Kiselev, Y.M.; Dolzhenko, V.D. L -Alanine/Nickel-Induced Size Sorting of Lanthanide(III) Ions in 4f-4f′ Heterometallic Complexes. Cryst. Growth Des. 2017, 17, 1166–1172. [Google Scholar] [CrossRef]
  48. Wang, Y.; Xing, S.-H.; Bai, F.-Y.; Xing, Y.-H.; Sun, L.-X. Stable Lanthanide–Organic Framework Materials Constructed by a Triazolyl Carboxylate Ligand: Multifunction Detection and White Luminescence Tuning. Inorg. Chem. 2018, 57, 12850–12859. [Google Scholar] [CrossRef] [PubMed]
  49. Gontcharenko, V.E.; Kiskin, M.A.; Dolzhenko, V.D.; Korshunov, V.M.; Taydakov, I.V.; Belousov, Y.A. Mono- and Mixed Metal Complexes of Eu3+, Gd3+, and Tb3+ with a Diketone, Bearing Pyrazole Moiety and Chf2-Group: Structure, Color Tuning, and Kinetics of Energy Transfer between Lanthanide Ions. Molecules 2021, 26, 2655. [Google Scholar] [CrossRef]
  50. Tobita, S.; Arakawa, M.; Tanaka, I. Electronic Relaxation Processes of Rare Earth Chelates of Benzoyltrifluoroacetone. J. Phys. Chem. 1984, 88, 2697–2702. [Google Scholar] [CrossRef]
  51. Tobita, S.; Arakawa, M.; Tanaka, I. The Paramagnetic Metal Effect on the Ligand Localized S1.Apprx..Fwdarw. T1 Intersystem Crossing in the Rare-Earth-Metal Complexes with Methyl Salicylate. J. Phys. Chem. 1985, 89, 5649–5654. [Google Scholar] [CrossRef]
  52. Huang, H.; Bu, Y. Effect of Paramagnetic Open-Shell Gadolinium(III) Texaphyrin on Its Kinetics and Electronic Structures in Fluorescence and Phosphorescence Emission States. J. Phys. Chem. C 2019, 123, 28327–28335. [Google Scholar] [CrossRef]
  53. Sheldrick, G.M. SHELXT—Integrated Space-Group and Crystal-Structure Determination. Acta Crystallogr. Sect. A Found. Crystallogr. 2015, 71, 3–8. [Google Scholar] [CrossRef] [Green Version]
  54. Spek, A.L. Platon Squeeze: A Tool for the Calculation of the Disordered Solvent Contribution to the Calculated Structure Factors. Acta Crystallogr. Sect. C Struct. Chem. 2015, 71, 9–18. [Google Scholar] [CrossRef] [Green Version]
  55. Dolomanov, O.V.; Bourhis, L.J.; Gildea, R.J.; Howard, J.A.K.; Puschmann, H. OLEX 2: A Complete Structure Solution, Refinement and Analysis Program. J. Appl. Crystallogr. 2009, 42, 339–341. [Google Scholar] [CrossRef]
  56. Plaut, G.W.E. The Preparation of 1,5,6-Trimethylbenzotriazole and 1-Methyl-V-Triazole-4,5-Dicarboxylic Acid. J. Am. Chem. Soc. 1954, 76, 5801–5802. [Google Scholar] [CrossRef]
  57. Zincke, T.; Helmert, B. Ueber Azimidoverbindungen; Ueber Azimidouramidobenzoësäuren Und Azimidobenzoësäuren. Justus Liebig’s Ann. Chem. 1896, 291, 313–342. [Google Scholar] [CrossRef] [Green Version]
Figure 1. Curves of mass loss (TG), DTA, as well as signals from the mass spectrometric detector of thermal decomposition products.
Inorganics 10 00104 g001
Figure 2. Crystals of Sm-TDA obtained at pH 5 (left) and 1.5 (right). The crystal of the impurity {Sm(HCOO)3} is visible in the left photo (marked with a yellow oval).
Inorganics 10 00104 g002
Figure 3. (a)—PXRD patterns of SmxGd1-x-TDA and simulated from single-crystal data of Sm-TDA and Gd-TDA; (b)—PXRD patterns of SmxTb1-x-TDA and simulated from single-crystal data of Sm-TDA.
Inorganics 10 00104 g003
Figure 4. Fragment of the polymeric structure of Sm-TDA. The NMe2H2+ cation is shown, as well as the [Sm(TDA)(HCOO)] anion. Distorted H2O molecule is omitted for clarity.
Inorganics 10 00104 g004
Figure 5. Crystal structure of Sm-TDA. View along the crystallographic axis (ac). Hydrogen atoms and NMe2H2+ cations are omitted for clarity.
Inorganics 10 00104 g005
Figure 6. Emission spectra of SmxGd1-x-TDA complexes and Jabłoński diagram. Inset: CIE color coordinates.
Inorganics 10 00104 g006
Figure 7. Luminescence spectra of Sm04Gd96-TDAex 280 nm) recorded in the fluorescence (black line) and phosphorescence (red line) modes.
Inorganics 10 00104 g007
Figure 8. Dependence of the observed lifetime of Sm3+ on the concentration of Gd3+. The component τ1 on the left, the component τ2 on the right.
Inorganics 10 00104 g008
Figure 9. Change in the contribution of τ1 component from Gd3+ concentration in series SmxGd1-xTDA.
Inorganics 10 00104 g009
Figure 10. Emission spectra of SmxTb1-x-TDA complexes and Jabłoński diagram. Inset: CIE color coordinates.
Inorganics 10 00104 g010
Figure 11. Dependence of the ratio of integral intensities of the strongest transitions of samarium (5G5/2-6H7/2) and terbium (5D4-7F5) on the fraction of terbium in the complexes SmxTb1-x-TDA.
Inorganics 10 00104 g011
Figure 12. Dependence of the observed lifetime of Tb3+ on the concentration for SmxTb1-x-TDA series.
Inorganics 10 00104 g012
Figure 13. Sm3+ luminescence decay curve for Sm02Tb98-TDA, λex 280 nm, λem 648 nm.
Inorganics 10 00104 g013
Table 1. Comparison of some parameters of Sm, Eu, Gd complexes.
{[NMe2H2][Ln(TDA)(HCOO)]}GdSmEu [23]
Space group Pna21
a, Å12.8145(9)12.8521(5)12.7834(4)
b, Å 9.9105(6)10.0035(5)10.0323(3)
c, Å8.8666(6)8.9281(7)8.8998(4)
α, β, γ 90°
1O-Ln, Å2.44(1)2.443(7)2.440(7)
1N-Ln, Å2.58(5)2.58(1)2.572(6)
5O-Ln, Å2.36(1)2.36(1)2.31(1)
6O-Ln, Å2.32(2)2.334(9)2.333(9)
3O-Ln, Å2.379(6)2.37(4)2.374(4)
4O-Ln, Å2.438(8)2.435(4)2.432(5)
2O-Ln, Å2.33(1)2.33(1)2.36(1)
3N-Ln, Å2.54(1)2.555(5)2.554(6)
Publisher’s Note: MDPI stays neutral with regard to jurisdictional claims in published maps and institutional affiliations.

