Bayesian Integrative Modeling of Genome-Scale Metabolic and Regulatory Networks


1
Laboratory of Digital Sciences of Nantes-LS2N UMR 6004, Université de Nantes, Centrale Nantes, CNRS, F-44000 Nantes, France
2
Faculté des Sciences Mathématiques, Physiques et Naturelles de Tunis, Université de Tunis El-Manar, 2092 Tunis, Tunisie
3
Laboratoire de Technologies de l’Information et de la Communication et Génie Electrique (LaTICE, ENSIT), Université de Tunis, 1008 Tunis, Tunisie
4
Faculté des Sciences Economiques et de Gestion de Tunis (FSEGT), Université de Tunis El-Manar, 2092 Tunis, Tunisie
*
Author to whom correspondence should be addressed.
Informatics 2020, 7(1), 1; https://doi.org/10.3390/informatics7010001
Submission received: 13 November 2019
/
Revised: 4 January 2020
/
Accepted: 10 January 2020
/
Published: 14 January 2020
(This article belongs to the Section Health Informatics)
Abstract
:The integration of high-throughput data to build predictive computational models of cellular metabolism is a major challenge of systems biology. These models are needed to predict cellular responses to genetic and environmental perturbations. Typically, this response involves both metabolic regulations related to the kinetic properties of enzymes and a genetic regulation affecting their concentrations. Thus, the integration of the transcriptional regulatory information is required to improve the accuracy and predictive ability of metabolic models. Integrative modeling is of primary importance to guide the search for various applications such as discovering novel potential drug targets to develop efficient therapeutic strategies for various diseases. In this paper, we propose an integrative predictive model based on techniques combining semantic web, probabilistic modeling, and constraint-based modeling methods. We applied our approach to human cancer metabolism to predict in silico the growth response of specific cancer cells under approved drug effects. Our method has proven successful in predicting the biomass rates of human liver cancer cells under drug-induced transcriptional perturbations.
1. Introduction
Understanding and predicting how genetic and environmental perturbations alter the behavior and subsequently the phenotype of an organism is a major goal of systems biology. Given the flood of biological data (genomic, proteomic, and transcriptomic) and interaction knowledge presented in pathway databases, significant efforts have been made in reconstructing different genome-scale networks for a wide variety of organisms ranging from bacteria to humans [1,2,3,4]. Due to their central role in the functioning of an organism, metabolic and gene regulatory networks have been extensively studied recently. Metabolic networks describe all the biochemical reactions that operate in a living organism; they are typically reconstructed from annotated genome sequences with the available biochemical knowledge. However, modeling and simulating the genome-scale metabolic network remains a significant challenge due to its size and complexity. Cellular metabolism is regulated through the control of enzyme activity by either activation or inhibition of the transcription of enzyme-coding metabolic genes. In the present work, we mainly focus on regulation occurring at the level of gene transcription, which has received much attention in the past decade due to its primary role in the regulation of metabolism [5]. Over the years, various methods have been developed to model transcriptional regulatory networks (TRN) [6] that describe the interactions between transcription factors (TFs) and their target genes. Such interactions are typically retrieved based on DNA–protein interaction data and on statistical inference from genomic and transcriptomic data [7]. Reconstructing a gene regulatory network allows to better decipher the underlying molecular processes and to accurately predict the responses of a cell to different alterations. The consideration of genetic regulation in the modeling of metabolic networks has improved our understanding of the cellular mechanisms that control its evolution and interactions with the environment [8,9,10]. Thus far, a wide range of approaches have been proposed to integrate transcriptional regulatory information into constraint-based models of metabolic networks [11]. As shown in Table 1, these approaches can be classified into two categories. The first category includes the methods that have been used for building context-specific metabolic models; these methods have proven successful in constructing models for human-specific tissue to study diseases [12]. The second category includes methods where transcriptomic data can be used to improve the prediction of the metabolic response to environmental and genetic perturbations. For these methods, transcript levels are used to determine the activity of genes in a given condition or between different conditions. Such information is then used to set bounds on reaction fluxes catalyzed by associated enzymes and to return a metabolic flux distribution that is consistent with the gene expression data. As presented in Table 1, there exist some methods that belong to both categories.
In this work, we are interested in integrative modeling of genome-scale metabolic and transcriptional regulatory networks with the purpose of studying growth phenotypes under the effect of genetic perturbations. Therefore, we focus on methods that fall on the second category which are predictive rather than descriptive and, more especially, those that integrate available regulatory information within Flux Balance Analysis (FBA)framework [20] as additional flux constraint.
The earliest and the most commonly used approaches, regulatory FBA (rFBA) [10], steady-state rFBA (SR-FBA) [9], and integrated FBA (iFBA) [15], model the interplay between metabolic and regulatory networks by incorporating regulatory constraints into traditional constraint-based modeling of metabolic networks (FBA).
rFBA is the first attempt to integrate FBA with regulation; it predicts a series of steady-state flux distributions under different growth environments by incorporating TRNs as a Boolean network. Thus, the metabolic network is restricted not only by stoichiometry, thermodynamic, and enzymatic capacity constraints but also by the gene regulatory network that controls it. Using rFBA, the regulatory state of genes (active or not) is determined based on logical rules in the Boolean regulatory network; next, flux balance analysis is iterated by splitting the growth phase into discrete time steps. At each time step, the updated regulatory states are used to constrain the reaction fluxes.
To improve the predictive ability of integrated models, integrated FBA (iFBA) [15] and steady-state RFBA (SR-FBA) [9] have been developed. SR-FBA uses the same integrated metabolic regulatory network as rFBA but characterizes its steady-state behavior by adding Boolean rules to FBA constraints while iFBA uses differential equations to model a specific subnetwork to combine them with rFBA.
There are several shortcomings in performing integrated modeling using rFBA and its allied approaches. They are all based on Boolean logic and manually constructed regulatory rules. Indeed, the process of reconstruction of a TRN in terms of Boolean rules is time consuming and difficult. These boolean logic-based methods allow only two states (on/off) of gene and reaction flux. This discrete restriction is a simplified view of the system that does not allow to capture the complex regulation of enzymes. For this reason, data-driven approaches have been used extensively recently. Several approaches have been developed, such as Probabilistic Regulation Of Metabolism (PROM) [13], FlexFlux [11], integrative Metabolic Analysis Tool (iMAT) [11], and Gene Inactivity Moderated by Metabolism and Expression (GIMME) [16] that use the information available from gene expression and regulatory networks together to improve the prediction ability of their models.
With the abundance of transcriptomic data in the form of RNA-seq and ChIP-seq (Chromatin ImmunoPrecipitation) data [21], automated approaches integrating available transcriptional regulatory information within metabolic networks are most appropriate for accurate predictive integrative models. In this direction, we focus on the Probabilistic Regulation of Metabolism (PROM) [13], which is the first approach that accounts for genetic variations on the metabolic network in an automated fashion. For this, information on TRN architecture and gene expression data are combined along with the FBA framework to build the integrated model. Rather than simple on/off rules, PROM enables a more quantitative description of regulatory effects. It requires a functional genome-scale metabolic model, a regulatory network structure describing direct interactions between TFs and target genes, and a set of expression data across multiple conditions. Expression data is used to predict the likelihood of expression of a target gene conditional to the state of its regulating TFs. Using PROM, the marginal probabilities are estimated by simply accounting for the number of times the target state is on or off for each TF state. For example, would be as follows:
where both targets and TFs are binary variables and where N is the number of times the event is observed. These probabilities are then used to constrain the flux bounds through reactions associated with the target gene(s). Although PROM has proved successful in predicting TF perturbation phenotypes for M. tuberculosis and E. coli [13], this method suffers from several major drawbacks that are limiting in practice. First, their predictions are limited to metabolic genes and associated reactions. Second, PROM considers only direct interactions between TFs and the target genes, the activity of which alone determines the flux bounds, independently of all other genes. Third, the way that PROM calculates the probability in Equation (1) presents some limitations; the probability of a gene being turned on is only predicted if it is directly connected to the knocked out transcription factor. Moreover, PROM is designed to integrate high confidence regulatory interactions from manually reconstructed TRNs through an extensive literature search. To deal with these issues and to consider regulations within the context of the whole regulatory network, we propose a new method called BayRegMet that enables the integration of transcriptional regulatory and metabolic networks by automatically quantifying the interactions from high throughput RNA sequencing data. Our model framework combines constraint-based analysis for metabolic modeling, derived from the Flux Balance Analysis (FBA) theory, semantic web technologies for the exhaustive construction of the transcriptional regulatory network, and Bayesian Networks to catch the complexity of gene regulation processes. Furthermore, a range of RNA sequencing data is used to parametrize a probabilistic model able to account for more complex interactions between genes compared to PROM. We also demonstrate the predictive power of our framework to determine how the metabolic mechanisms of the hepatocellular carcinoma tumoral cells are affected by some specific drugs that are known to affect gene regulation. As a whole, our framework address the challenge of integrative modeling to study in silico the effect of transcriptional perturbations on the metabolic network behavior and to make hypotheses that could provide insights into the mechanisms underlying metabolic disorders.
2. Methods
2.1. Constraint-Based Modeling of Metabolic Networks
The availability of annotated sequenced genomes which provides knowledge about metabolic enzymes has made possible the reconstruction of genome-scale metabolic networks. Such knowledge allows to link a gene to metabolic reactions via Gene–Protein Reaction (GPR) relationships, more specifically through the enzymes catalyzing each of the metabolic reactions. These enzymes are obtained through the transcription, the translation, and eventually the post-transcriptional modifications of genes. It should be noted, however, that enzymes are poorly represented in metabolic models where focus is mainly made on direct relationships between genes and reactions. In general, for studying a metabolism, we often are interested in the rates of the metabolic reactions that import nutrients from the environment and that carry out step by step transformation of the initial metabolites to convert them into other needed molecules. Unfortunately, determining these reaction rates is a complex experimental task and their prediction is hampered by the absence of detailed kinetic information [22]. On the other hand, constraint-based modeling has attracted big interest due to its capacity to analyze genome-scale metabolic networks while using few information. This approach is based on the assumption that the metabolic pathways are subject to a set of physicochemical constraints. Namely, under steady-state conditions, we assume that there is no net change in the concentration of the internal metabolites, so the rate of production of each internal metabolite in the network must be equal to the rate of its consumption. This can be expressed using the following flux balance equation:
where S stands for the stoichiometric matrix of the metabolic network and v denotes the flux vector with elements corresponding to the n fluxes through reactions. In addition to the steady-state constraints, flux capacity constraints are often considered to place bounds on the reactions rates in the following form:
where the bounds and are the minimim and maximum of flux capacities. According to Flux Balance Analysis (FBA), the metabolism of an organism has been evolved in such a way that a predefined objective like the biomass production is maximized. Accordingly, the optimal metabolic pathway displayed by the organism can be determined by solving the following linear program:
where c stands for the vector that defines the objective function by means of costs of or benefits derived from the fluxes (biomass production or growth rate, for instance). Due to the convex shape of the solution space of the underlying linear programming problem, the optimal value of the objective function is necessarily unique and it can be obtained by a deterministic algorithm. Notice that this optimal value could be obtained for infinitely many points of the solution space. In that case, they all belong to an edge or a face of the solution space. It is worth noting that, although the optimal value of the objective function is unique, the optimal flux distribution is often not unique due to the inherent structural robustness and redundancy of metabolic networks. Nevertheless, the space of all these optimal metabolic pathways can be assessed using Flux Variability Analysis (FVA) [23]. Indeed, for each reaction with , the minimum (respectively maximum) flux (respectively ) of reaction can be obtained by solving the following linear program:
where is the optimal value of the objective function using FBA.
2.2. Bayesian Modeling of Transcriptional Regulatory Networks
Cells need to respond to environmental changes rapidly by activating specific genes that are required for each condition. Regulatory proteins called Transcription Factors (TFs) have an important role in gene regulation. By attaching to DNA and forming complexes with each other, TFs activate (positive effect) or inhibit (negative effect) the transcription of their target genes. Regulators can themselves be regulated, and in such a case, they participate in a genetic regulatory pathway. A target gene is generally regulated by several TFs, and a TF can regulate different target genes. It is, therefore, possible to qualitatively represent a transcriptional regulatory network as a graph in which the nodes are TFs and their target genes and the oriented edges represent regulatory interactions between them. Gene regulatory networks have been recognized to be highly complex, and efficient computational methods are needed to reliably predict the activities of the genes. A variety of computational approaches have been proposed to analyze gene regulatory networks [24]. Probabilistic graphical models and bayesian network (BN) [25,26] in particular are widely used to model genetic regulatory networks. Due to their causal structure and their ability to reflect the stochastic nature of gene regulation, we have chosen to use Bayesian networks in our pipeline to describe the regulatory interactions. Therefore, our proposed approach can take into account linear and nonlinear regulatory relationships and our predictions will be robust to noisy data. In addition, using Bayesian networks is an efficient way to avoid overfitting [27]. For modeling a TRN using a bayesian network, the interactions between genes are encoded in the structure of a directed acyclic graph (DAG) G(X, E), where the vertices represent random variables encoding transcription levels of genes and the edges denote the direct dependencies between the target gene and its regulators.
The graphical structure of the DAG, which is the first basic component of the BN, encodes a set of conditional independences between variables that rely on Markov assumption: each random variable is independent of its non-descendants conditionally to its parents. This means that, if there is no edge in the DAG linking the random variables X and Y, then X and Y are independent conditionally to the parents of X (incoming edges). In the context of gene regulation, a target gene is independent of its non-descendant genes conditionally to its direct regulators.
The second component of the BN describes the statistical relationships between each target gene and its regulators. It consists of the conditional probability distribution (CPD), for each variable which is consistent with the graph topology. This CPD specifies the probability distribution over the values of given any possible assignment of values of its parents. CPD may be represented in various ways depending on the types (discrete or continuous) of the DAG variables. In our study, we handle discrete variables, where the target gene and its regulators have two possible states (active or inactive) depending on their transcriptional level. In such a case, the CPD is represented as a conditional probability table (CPT) associated with each gene in the DAG that specifies the probability of an event based on frequency counts of its occurrence in the training data. It is important to note that learning CPT from gene expression data presents a computational challenge in the BN since the size of the CPT grows exponentially with the number of immediate regulators of each target gene. Prior knowledge about the direct relationships between genes and their regulators encoded in the CPTs is used to infer more complex regulatory interactions between genes. The inference task in the BN consists of computing the posterior probability distribution over a subset of variables of interest given an assignment to another subset called the evidence set. For this purpose, various inference methods have been developed; they can be divided into two categories: exact methods and approximate methods. However, in the case of large BNs with many dependencies between their variables, exact inference methods are not applicable. In such a case, we must resort to an approximate inference that only computes an approximation to the inference query.
3. Results
As shown in Figure 1, the construction of an integrated metabolic-regulatory network using BayRegMet requires (i) a functional reconstructed genome-scale metabolic network formally represented by the stoichiometric matrix, wherein the rows correspond to the metabolites and the columns correspond to the reactions; (ii) a TRN structure modeled as a directed graph describing the regulatory interactions between TFs and their target genes; and (iii) a set of RNA sequencing data measured under different conditions.
3.1. Reconstruction of Regulatory Networks
A crucial step in our integrated model is the reconstruction of the transcriptional regulatory network. Nowadays, the large amount of information related to gene regulatory interactions has been stored in various biological databases [28,29,30]. Nevertheless, to more efficiently exploit such knowledge, there is a need to exchange and integrate this information from several database resources in an automated fashion. In fact, our main idea is to retrieve an exhaustive overview of possible regulators (TFs) associated with a subset of target genes of interest. Web semantic technologies that have a significant impact on knowledge integration is an efficient way for this purpose [31]. These technologies are now available to interconnect various and heterogeneous sources of data. They have been applied for biological knowledge management by integrating and querying disparate biological databases.
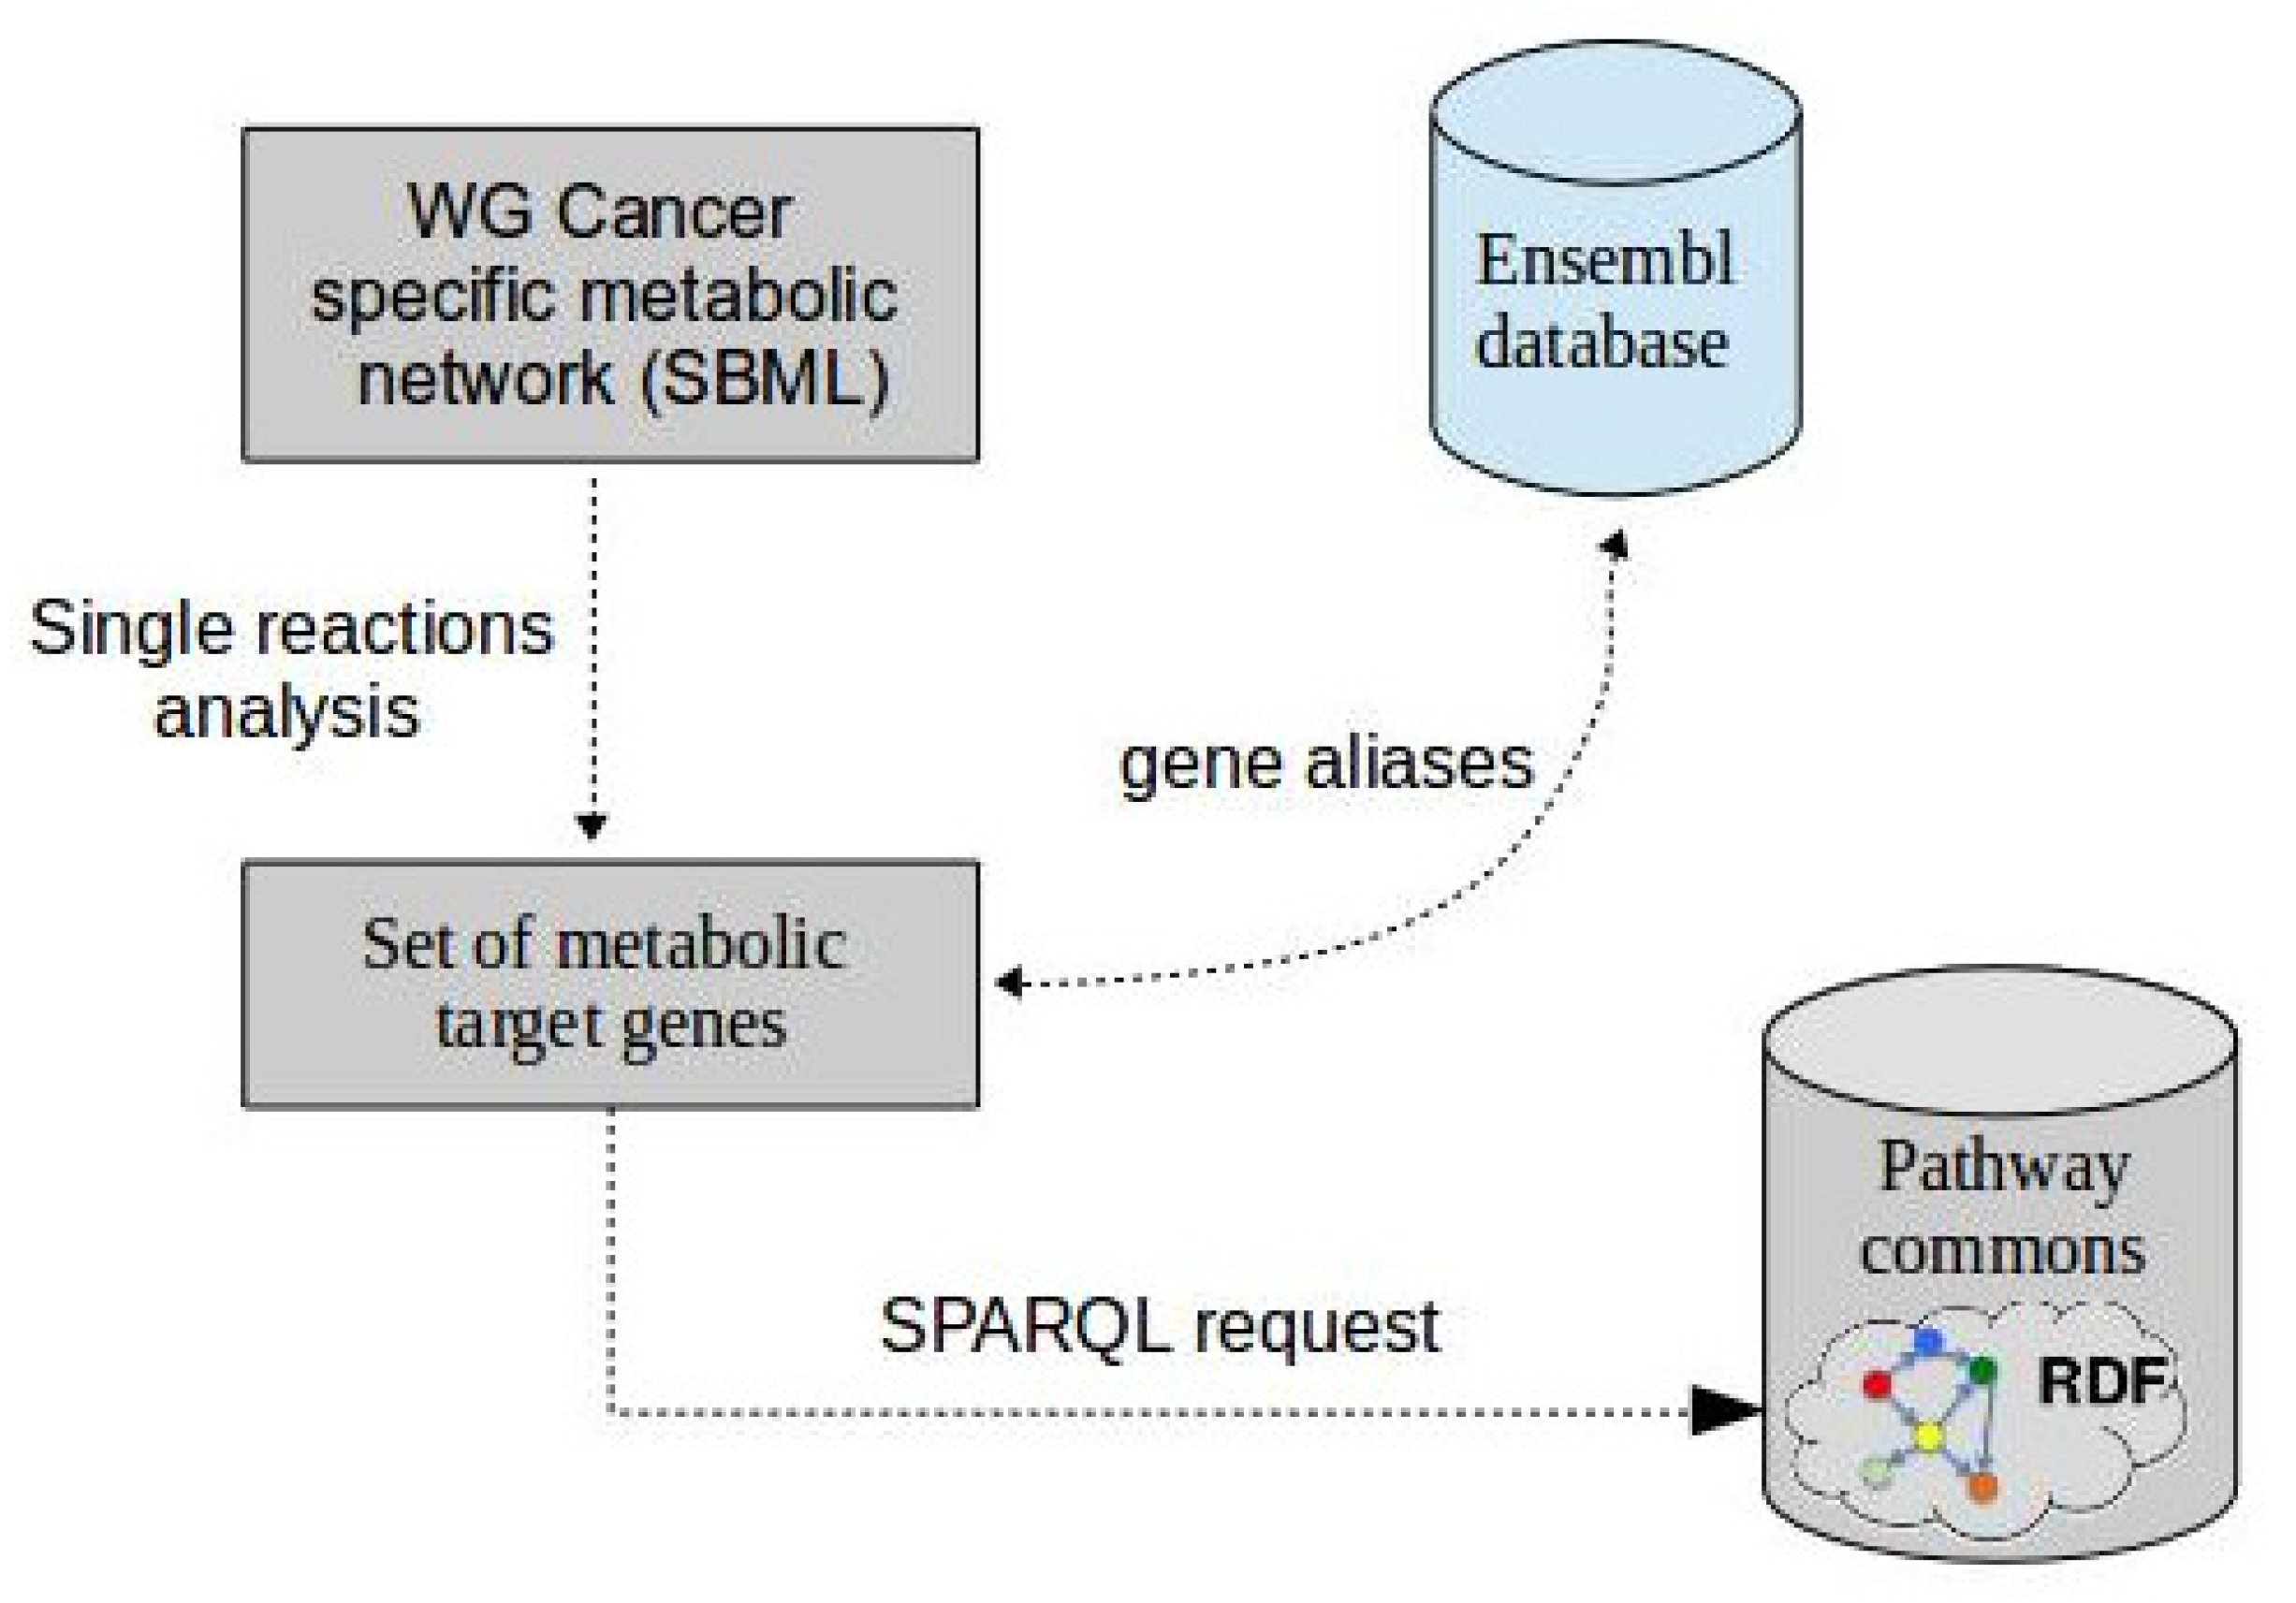
In order to build the structure of a transcriptional regulatory network (Figure 2), we first extract a set of relevant metabolic target genes. For this purpose, we performed a single reaction analysis [32] to identify important reactions of which the removal drastically reduces biomass production. Next, we select all the enzymes that catalyze these reactions and consequently the genes that regulate these enzymes. Despite these correspondences between reactions, proteins and genes are not always available in the metabolic model; it is often possible to retrieve it by automatically querying the literature databases. Considering only a set of relevant genes, denoted later by , allows us to reduce the size of the network and thus the computational complexity of the remaining steps of the BayRegMet framework.
The second step of the reconstruction process consists of using semantic web technologies in order to reconstruct the upstream regulatory network. The main idea behind these technologies is to describe data in the Resource Description Format (RDF) and to query them using the SPARQL language [33].
Therefore, to perform exploratory searches of TF-target gene interactions, Pathway Commons database [34] is iteratively interrogated by performing SPARQL queries on RDF data in order to identify all the known regulators of a given set of genes. The following SPARQL query (Algorithm 1) is the basis of the GetTFcontrollers(g) that aims to return the regulatory ancestors of a given gene.
| Algorithm 1: A SPARQL query on the Pathway Commons endpoint. |
| Input: a gene g identified later by ENTITY Output: List of genes that regulates g PREFIX bp: <http://www.biopax.org/release/biopax-level3.owl#> SELECT ?source_name WHERE { ?regul rdf:type bp:TemplateReactionRegulation . ?regul bp:controller ?source . ?source bp:displayName ?source_name . ?regul bp:controlled ?target . ?target bp:displayName ?target_name . FILTER (regex(?target_name, "ENTITY", "i")) } |
The basic steps of the gene network reconstruction are described in the algorithm below Algorithm 2. As a result, we obtain a directed graph encoding the regulatory effects that impact the activity of genes in the set .
| Algorithm 2: Reconstruction of regulatory network using Pathway Commons SPARQL endpoint. |
| Input: Set of relevant metabolic target genes = Output: List of TF-genes interactions Initialization: GenesToBeExplored:=, Interactions:= ∅ while GenesToBeExplored do let g in GenesToBeExplored remove g from GenesToBeExplored TF=GetTFcontrollers(g) /* perform the above SPARQL query */ for all r in TF do add to Interactions if r is not in GenesToBeExplored add r to GenesToBeExplored end if end for end while |
It is worth noting that the SPARQL query can easily be enhanced by using a filter based on values instead of filters based on regular expressions and by using all gene aliases instead of a single name. The proposed algorithm can also be improved using parallelization techniques. All these points can significantly speed up the gene network reconstruction by several orders of magnitude.
3.2. Probabilistic Transcriptional Regulatory Network
As discussed above, the interplay between metabolism and transcriptional regulation consists roughly in controlling the abundance of enzymes that catalyze biochemical reactions. Indeed, the activity of each gene is determined by the state of its regulating genes coding for TFs. In Chandrasekaran and Price [13], the authors use a notion of probabilistic enzyme activity conditionally to some given gene states. Here, we revisit this notion by considering the reconstructed regulatory network. This network plays the role of a bayesian network skeleton. In the present study, we chose to focus on a discrete Bayesian network; thus, discretization of the original continuous gene expression values is performed as a preprocessing step for learning the BN parameters from data. A binary discretization is performed on all transcription levels of normalized RNA-seq dataset reflecting whether a gene is activated or repressed in a given sample. Moreover, the first component of BNs is a directed acyclic graph that contains only directed edges and no cycles. Therefore, we need to ensure that the resulting TRN structure does not involve any directed cycles. For this task, we refer to the greedy method to reconstruct the BN structure from the original TRN resulting from SPARQL queries. TF-target interactions are iteratively added to the DAG if and only if there is no feedback loop or path between a regulated gene and their TFs [35]. Once we have the structure of the BN that determines the set of TFs for each gene, the out task now is to learn the BN parameters that define the CPDs for this structure. Thus, given the dependency structure and the discrete training data, we follow the standard approach of maximum likelihood estimation to estimate the parameters of the different CPDs. Since the exact inference of marginal probabilities over the variables of interest quickly becomes infeasible for our network, we used approximation techniques based on statistical sampling [36]. This part has been implemented in Python by using the pgmpy library [37] that enables us to handle large-scale probabilistic graphical models.
Next, we compute the probability for a given gene to be active or inactive in the absence of stimuli, which in this case corresponds to a computation of the marginal probabilities. Complementary to this, it is also possible to compute the probability for the same gene to be active or inactive under a given stimulus that consists in assuming that several genes that are known to be targeted by a given drug are active or not. In the end, one obtains a relative activity factor for each gene by dividing the probability computed under stimuli by the probability computed without any stimuli. Notice that, in this study, we do not consider activity factors that are greater than 1. In analogy to the PROM approach [13], these activity factors are then integrated into the FBA framework. Indeed, our model is framed as a linear programming problem which finds a flux distribution that satisfies the same constraints as FBA plus additional constraints to account for the transcriptional regulation. These constraints are considered as “soft” constraints that refer to those constraints that are imposed by the cells upon themselves to direct their behavior [38]. Therefore, these constraints can be violated to optimize a given metabolic objective but with a penalty. The formulation of the linear optimization problem is described below:
where and are the true maximum and minimum fluxes through reaction and are determined using Flux Variability Analysis (FVA) of the metabolic model without taking into account regulatory constraints and where and are the flux capacity bounds in the metabolic model. A vector of conditional probabilities (of length of the number of enzymes associated with the reaction) is obtained for each reaction. Thus, and denote the minimum and maximum conditional probabilities of a reaction being active given evidence supporting the activity of TFs. and stands for the penalty deviation from the regulatory constraints.
4. Case Study: Hepatocellular Carcinoma (HCC): Results and Discussion
Human metabolism and its regulation are the subjects of a large research effort due to the emergence of diseases such as cancer. Mapping between gene regulatory and resulting metabolic changes in specific cancers will allow the identification of diagnostic marker candidates and novel therapeutic targets. However, to our knowledge, until now, there is no attempt to provide quantitative integration of hight-throughput transcriptomic data in constraint-based modeling for human cancer tissue. According to existing studies, one of the major reasons for altered metabolism in a cancer cell is the expression perturbations of enzymes-coding genes involved in diverse metabolic pathways [39,40]. These perturbations are driven by environmental factors and/or genetic variations. In the present work, we focus on studying at a genome-scale level how such gene perturbations are translated into flux responses at the metabolic level.
As a case study, we are interested in the common type of the primary human liver cancer which is Hepatocellular Carcinoma (HCC) [41]. For this purpose, we used our approach BayRegFlux to generate a regulatory-metabolic integrated predictive model that enables us to predict the responses of the tumor cells to diverse treatments.
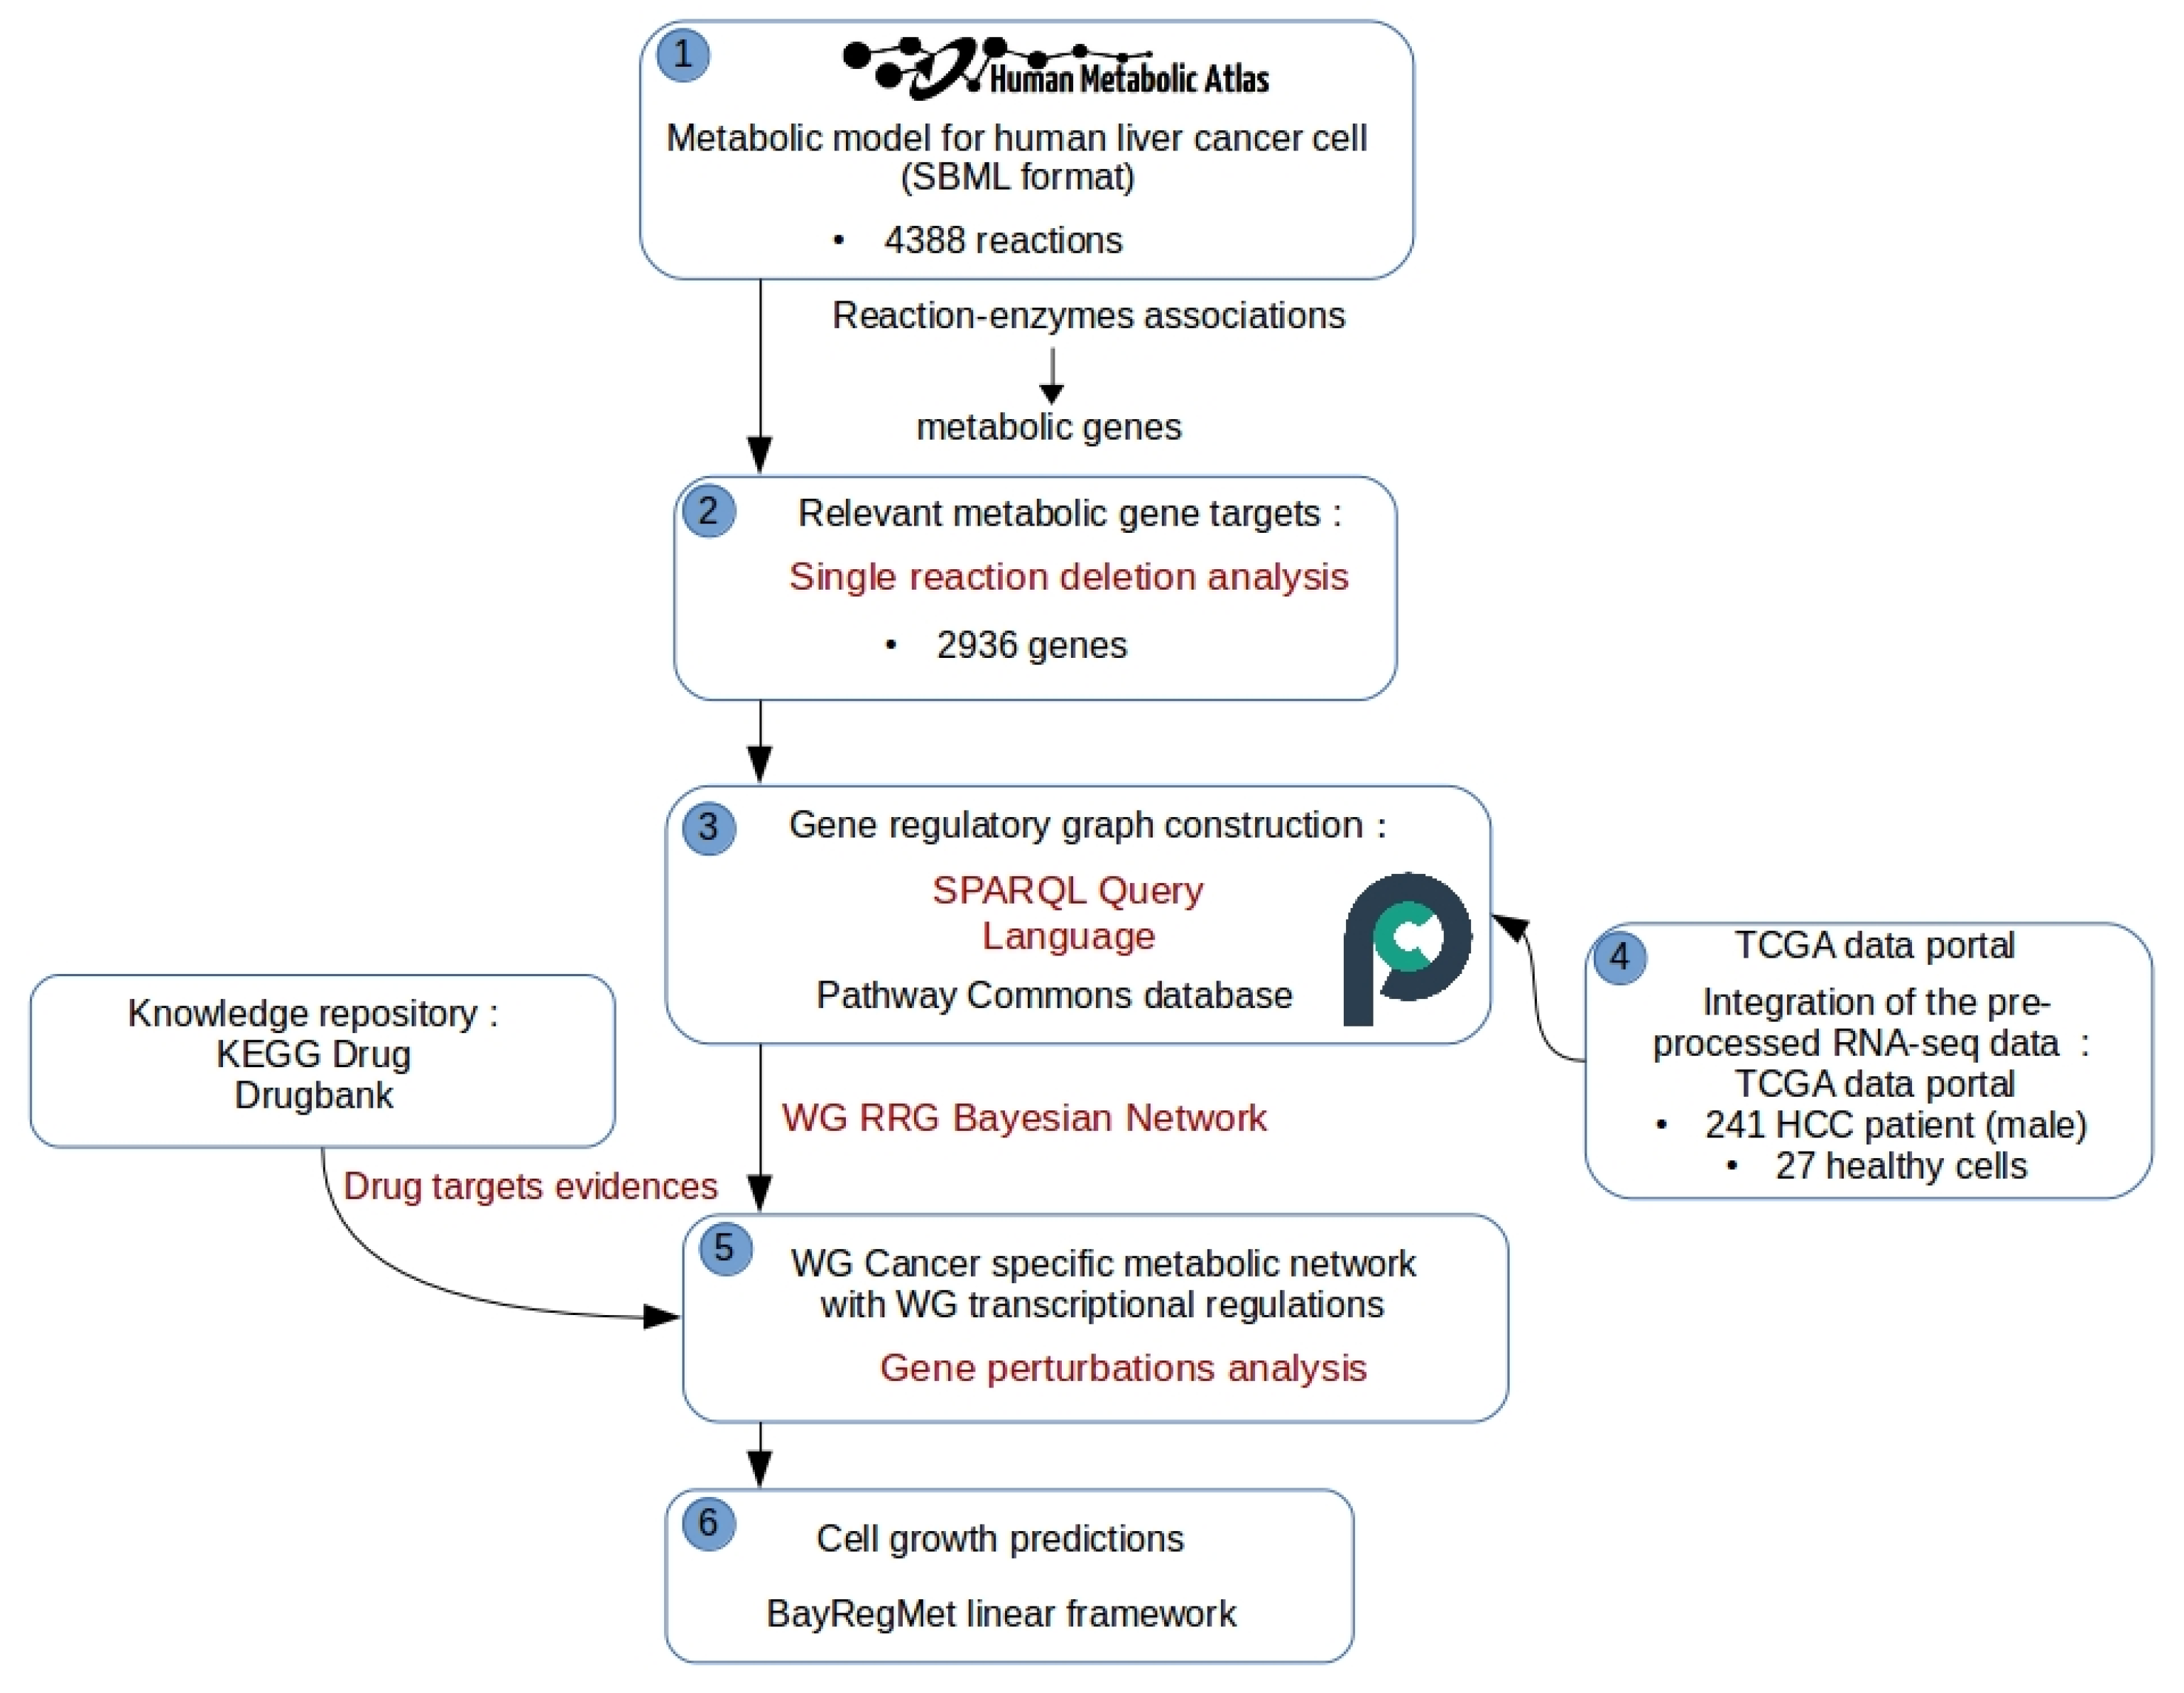
As discussed above, several methods have been proposed to simulate the regulatory effects on cell growth. Such simulation consists in deleting one or more biochemical reactions by inhibiting the catalyzing enzymes [32] or by using the concept of antimetabolites [42]. However, one of the main drawbacks of the methods proposed for this purpose is that the deleted genes of interest must be in direct interaction with one of the enzymes. This restricted overview of the gene regulatory network may discard genes that can be considered as potential therapeutic targets. For this purpose, by using our BayRegMet tool, the single reaction deletion analysis is extended to simulate the effect of the inhibition of genes that are not directly related to the produced enzyme. Note that the metabolic analysis in this case study is based on simulating growth phenotype in order to predict the biomass growth of the tumor cell under diverse drug effects. To achieve this challenge, we need a functional reconstructed metabolic network that can be downloaded from different model repositories like Human Metabolic Atlas [43] and Virtual Metabolic Human [44] for instance.
As shown in Figure 3, once we have the metabolic model, the single reaction deletion analysis step is performed to identify which reactions have an impact on the cell growth and therefore define the set of relevant target genes that encode metabolic enzymes. Then, a reverse-engineering technique based on SPARQL querying language is used to identify functional relationships between transcription factors and target genes in .
The resulting network is transformed into a directed acyclic graph (DAG) that can be explored using a bayesian network framework. However, complementary to the graph structure, a set of transcriptomic data is needed to calculate marginal likelihood distribution through all nodes in the DAG in order to predict the posterior probability of the enzyme activity in a given context. In our study, RNA-Seq data for liver cancer, are obtained from the TCGA data portal. They are emerged from the treatment of the BAM alignment files [45] to generate a read count matrix, which has genes along the rows and samples along the columns. The entries in the matrix give how many reads for a given gene in a given sample can be uniquely aligned. Based on the metadata file associated with counts files, we divided samples into four phenotypic groups: (male/female) × (primary tumor tissues/healthy tissues). Once we have raw counts for these samples, a normalization step is performed in order to remove systematic technical differences between samples and to thus reduce the impact of technical bias on the results. For this, the DESeq normalization method from the DESeq Bioconductor package [46] is performed on the htseq-counts data. The next step consists in identifying the active/inactive states of genes. For this, binary discretization was performed on normalized data based on each log gene’s transcription level mean over all 268 samples. Thus, all genes were assigned two states: 0 was assigned to genes with number of reads less than the mean and 1 otherwise.
A basic step on BayRegMet workflow is to quantify the interactions between regulators and their target genes by learning a Bayesian network from the discrete transcriptomic data. This step consists in inferring the posterior probability of the enzymatic activities given evidence, which is the drug effect in our case study. Indeed, for a given drug with known target genes, conditional probabilities of an enzyme being expressed when the corresponding drug target genes are knockout are determined. As an exact inference is NP-hard, we used approximate inference based on the likelihood weighted sample algorithm [36].
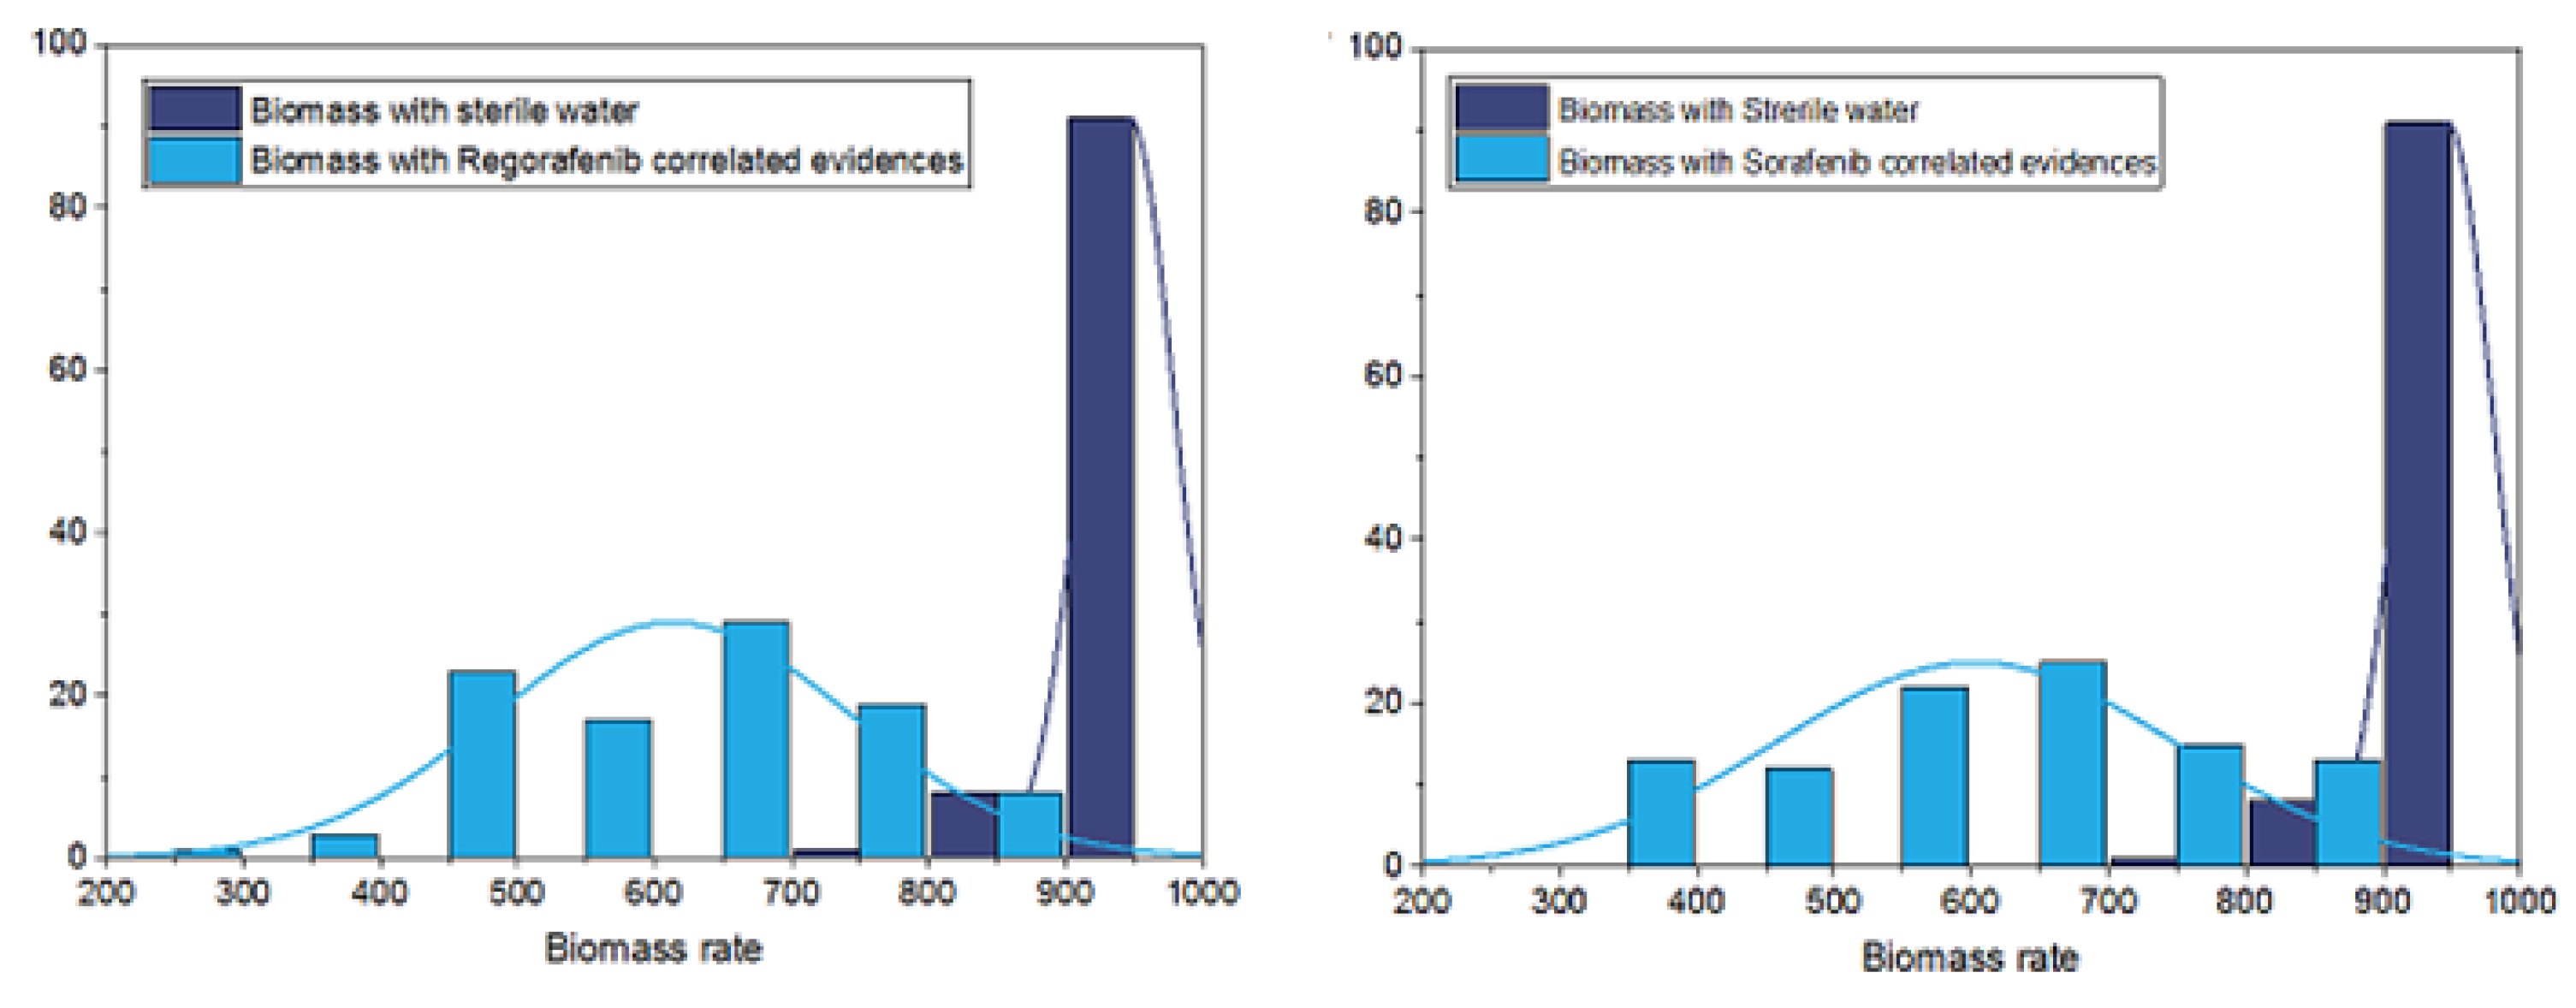
The final step consists in predicting the impact of such gene perturbations induced by drug effects on cell growth. The inferred probabilities are then translated into bounds to constrain the fluxes through the reaction controlled by the target gene. The main metabolic task in this study case is the biomass production; thus, according to the biomass objective function defined in the HCC metabolic model, the optimal growth rate of tumor cells while taking into account the model stoichiometry, steady-state assumption, and the predicted activities of enzymes under drug effect is thus obtained by solving a linear optimization problem as described in the section above. Potential drugs and their targets are available in diverse databases such as KEGG DRUG [28] and DrugBank [47]. We have listed two approved drugs with known effects on HCC cancer: Sorafenib(USAN/INN) and Regorafenib(USAN/INN). To predict the growth rate of HCC tumor cells under the effect of those drugs, BayRegNet systematically knocked out all the TFs that control the transcription of known drug target genes. Accounting for transcriptional perturbations induced by drug effects, we expect that BayRegMet would return a growth rate that is significantly lower than the one obtained under sterile water without evidence genes.
As discussed previously, approximate inference based on the likelihood weighting sampling algorithm is used to estimate the posterior probabilities given a fixed evidence genes . However, the predicted biomass growth of tumor cell depends on the weights assigned to samples for each simulation; such weights arise from the probabilities of evidence obtained over the sampling process. For this, using BayRegMet, simulations were performed over 100 iterations for Sorafenib and Regorafenib drugs as for sterile water.
For both treatments, the number of evidence samples on which the posterior probabilities are based is relatively smaller compared to the size of the bayesian network. Thus, to ensure efficient propagation of the effect of the drug across inferred probabilities, we proposed to extend the set of approved drug targets by taking into account genes that are significantly correlated with this evidence. In fact, instead of performing BayRegMet on only known drug targets , normalized RNA-seq data are used to select closely correlated genes with each gene in . Therefore, to measure the similarity of genes transcription profiles, we performed Pearson correlation coefficient test [48]. The score cutoff of this test was set to 0.5, which provides respectively a set of 55 and 75 genes instead of 7 and 12 approved direct targets of Sorafenib and Regorafenib drugs. All selected genes with correlation coefficient over the fixed threshold are significantly correlated with p-values less than 0.0005. Therefore, to simulate the effect of drugs on the biomass production of HCC tumor cells, BayRegNet systematically knock out all TFs that regulate genes in the resulting evidence set.
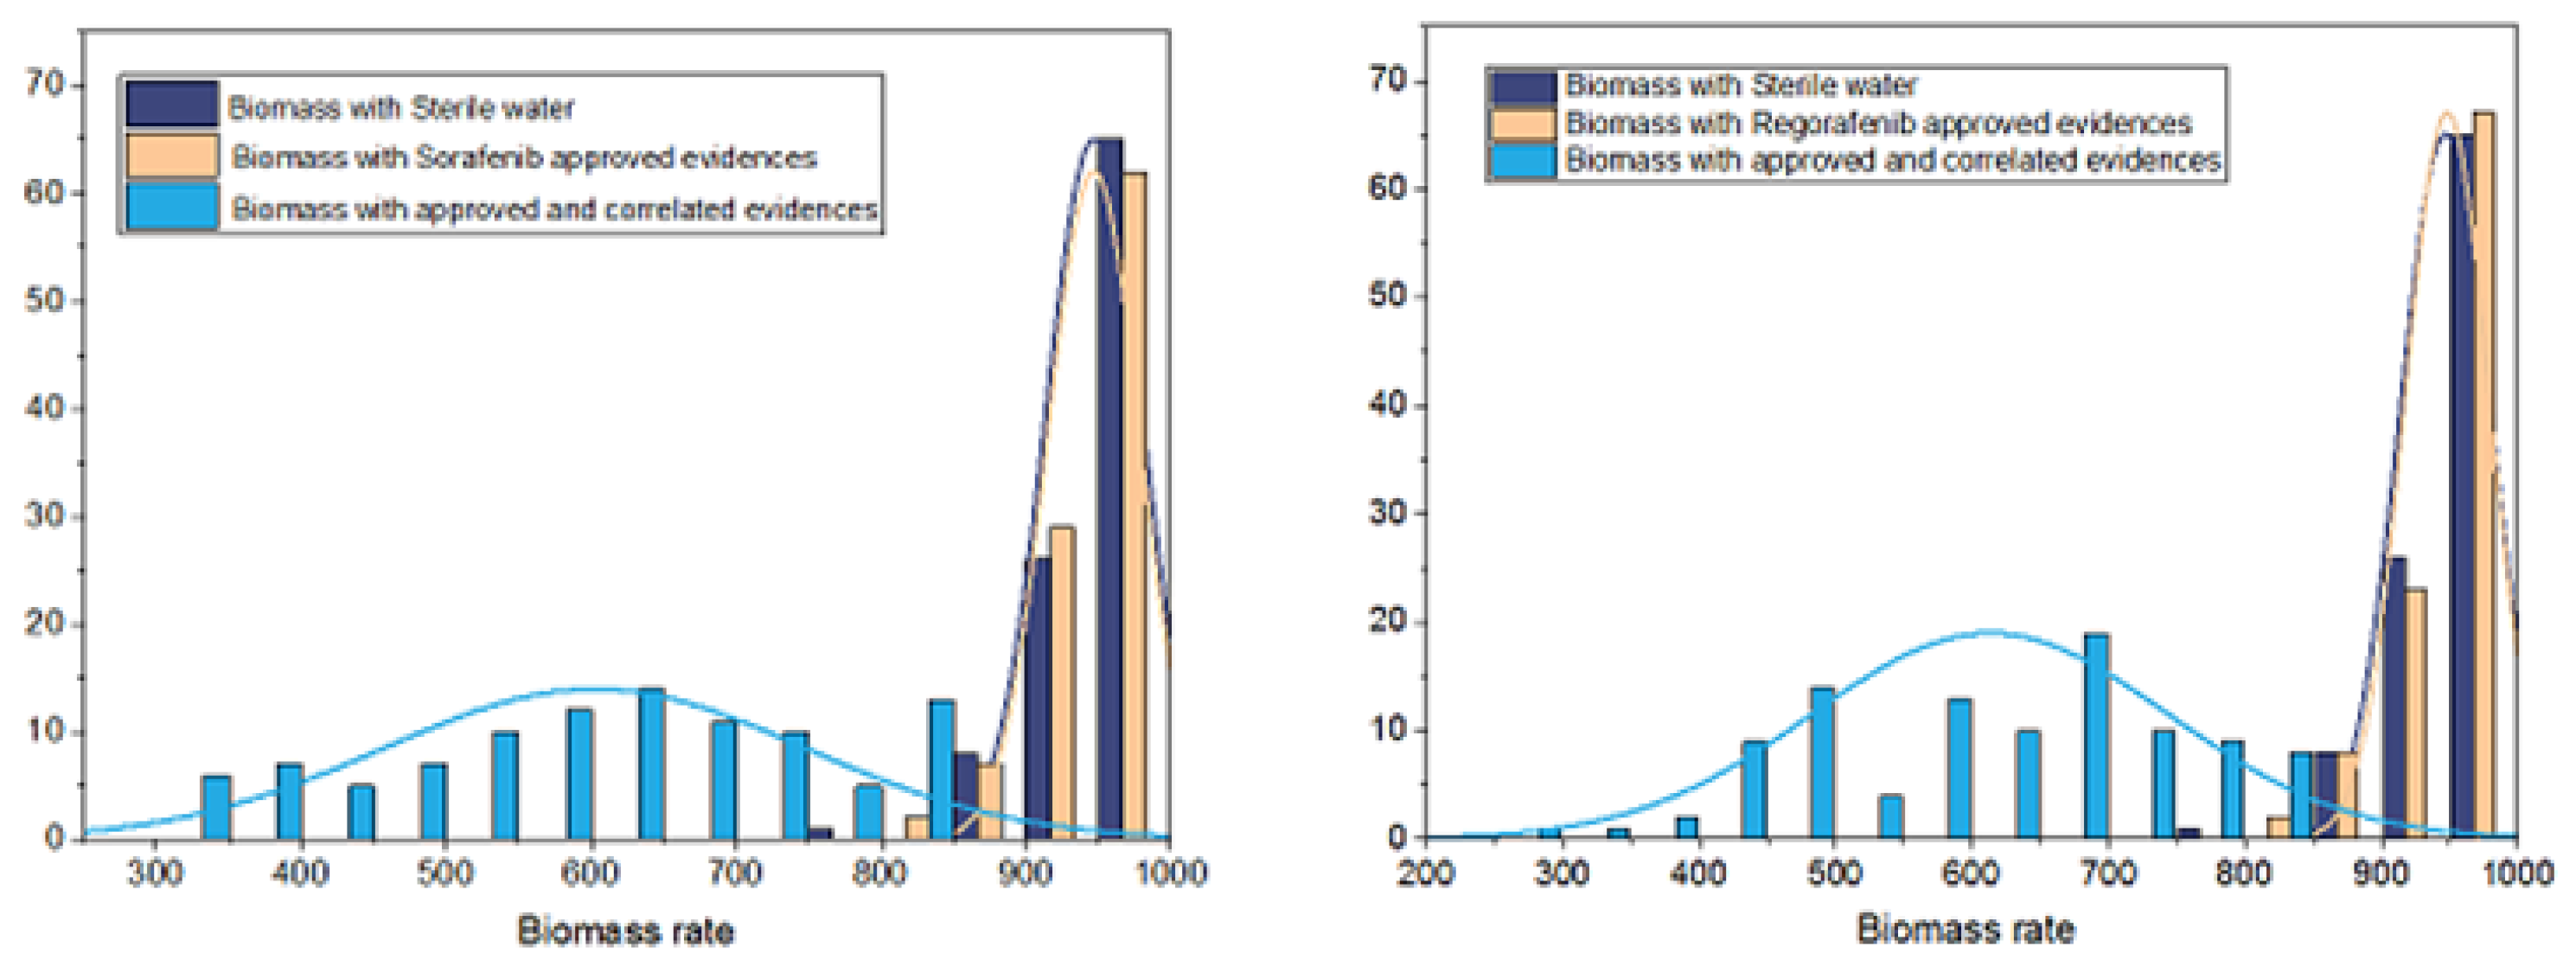
As shown in Figure 4, for both treatments, there is a significant difference between growth predictions that account for transcriptional gene perturbations and those obtained under sterile water, with a p-value using pairwise student test. Moreover, Figure 5 shows that, for the two drugs, predicted growth rates obtained with only direct approved drug targets and without accounting for correlated genes are not significantly different from those predicted under sterile water (p-value of 0.97 using pairwise student test).
Another experiment was performed to assess whether extending the set of known drug targets with genes that correlate with them based on RNA-seq profiles significantly reduces the growth rate of HCC cancer cells. To this end, a set of genes different from those obtained from correlation test was randomly generated. Bayesian learning process is performed with a set of evidences that consists of approved drug targets with the random generated genes. To predict the growth rates using BayRegNet, a simulation was performed over 100 iterations with 20 different random sets of evidences.
As shown in Figure 6, the average values of biomass rates with random evidences set across all the 20 simulations are always higher than that obtained with the known drug targets and their correlated genes. These results pave the way to study the individual features of each gene in the correlated set and their associated pathways that may therefore aid in identifying new potential therapeutic targets which could inhibit tumor growth.
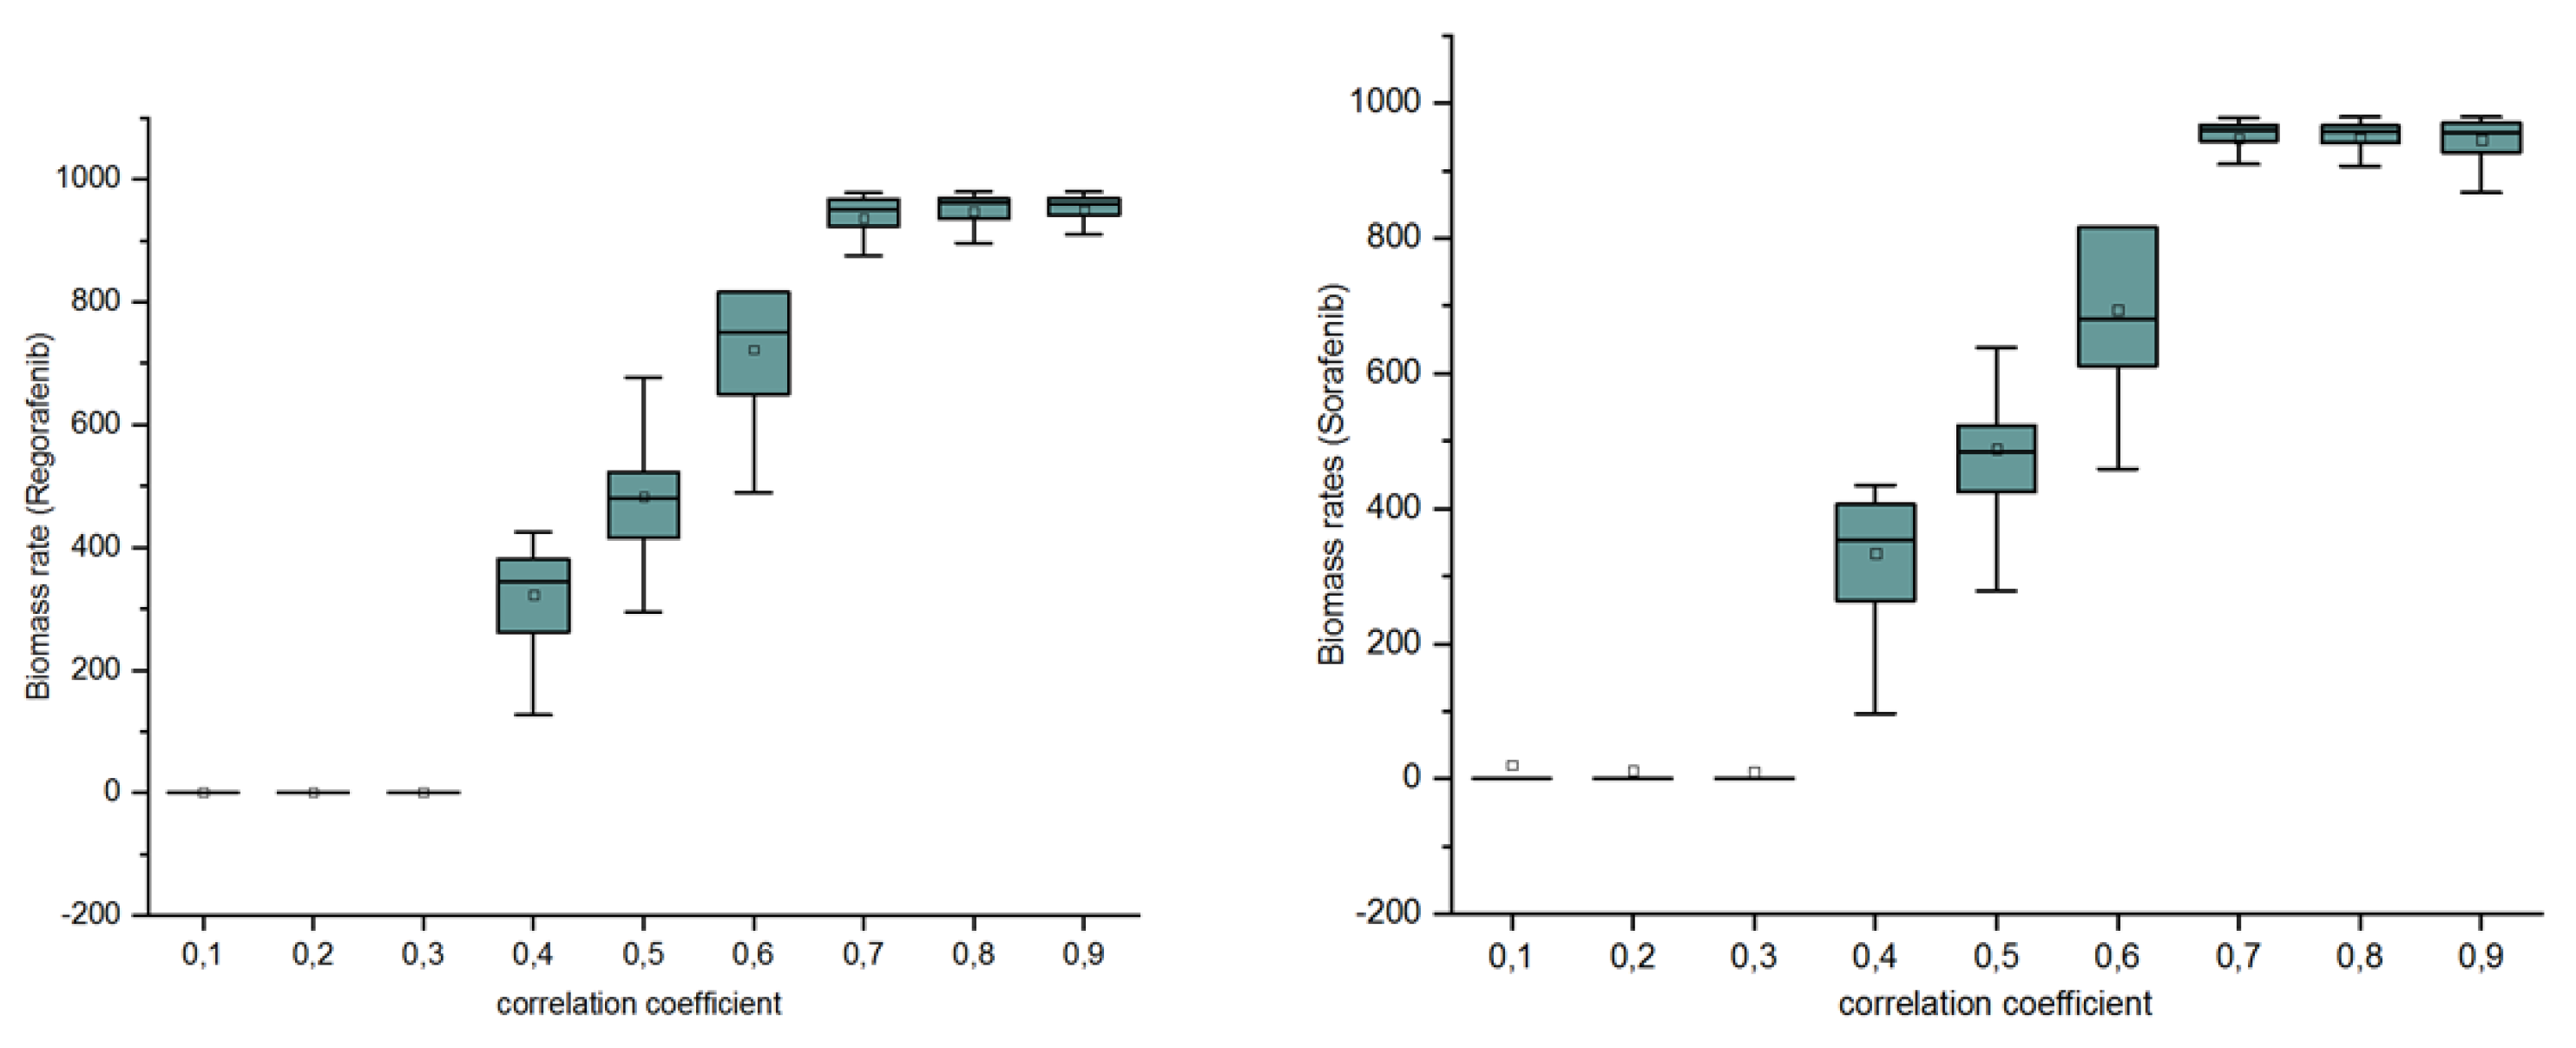
Like many other approaches dealing with genome-scale data, BayRegNet predictions depend on the choice of the parameters configuration. Thus, the sensitivity of the cell growth prediction with respect to the parameter values was analyzed. This analysis has focused on the cutoff threshold of the Pearson correlation test. For this end, this threshold was varied to select a set of correlated genes with drug evidences on which BayRegNet was performed. As shown in Figure 7, for each value of cutoff, BayRegNet was performed to predict the growth rate given different size of evidences set.
5. Conclusions
In the present paper, we have proposed an approach that enables quantitative predictions of tumor cell phenotypic responses by integrating transcription regulatory and metabolic networks into an automated fashion. For this purpose, a structure of the regulatory network and a set of experimental RNA-seq data are used to provide extra constraints that enable binding of the possible fluxes of the metabolic network and hence that allows to compute realistic exchange fluxes (such as the biomass production, for instance) when the system is subjected to different stimuli.
In this study, the BayRegMet tool is used to predict tumor cell growth under gene transcriptional perturbations. Under the effect of various proven drugs, our tool has successfully predicted the biomass production of HCC cancer cells. Theses predictions may pave the way to guiding searches for synthetic biology applications. The BayRegMet method can be applied to any organism in which several RNA-seq experiments have been run. In fact, there is obvious potential improvement that could be made to the BayRegNet workflow such as adding constraints to avoid toxic effects of drugs on healthy cells. Furthermore, it is known that the biomass production is just one of many metabolic tasks that are about to occur in cells. Thus, extending BayRegNet to achieve other cell metabolic objectives may be performed as proposed in Agren et al. [42]. Moreover, one of the basic components of BayRegNet is the functional metabolic network that includes the ability to cover FBA-specific optimization parameters such as objective function. However, this is not always the case for all available metabolic models although some methods such as Integrative Network Inference for Tissues (INIT) [17] have been proposed for this purpose. The main contribution in our study is the way in which RNA-seq data is exploited to quantify the interactions between genes and their regulators. Using a Bayesian network for this end reveals some limitations, given the fact that the number of samples is small relative to the number of parameters to be inferred. This limitation raises interesting perspectives that can be addressed either by reducing the size of the reconstructed TRN or by using logic networks, for instance, that are more qualitative but require less data.
It is important to note that existing databases that provide information about the key genomic changes occurring in human tumor cells present certain limitations in terms of the lack of knowledge related to isoenzymes [49] that may have a crucial function on regulating human cancer cell.
Author Contributions
Conceptualization, H.M., J.B., and A.L.; methodology, H.M., J.B., and A.L.; software, J.B., H.M., and A.L.; validation, H.M., J.B., and A.L.; formal analysis, H.M., J.B., and A.L.; investigation, H.M., J.B., and A.L.; resources, J.B., H.M., and A.L.; data curation, J.B., H.M., and A.L.; writing—original draft preparation, H.M., J.B., and A.L.; writing—review and editing, H.M., J.B., A.L., and M.E.; visualization, H.M., J.B., A.L., and M.E.; supervision, J.B., A.L., and M.E.; project administration, J.B., A.L. and M.E. All authors have read and agreed to the published version of the manuscript.
Funding
This work has been partly funded by the Region Pays de la Loire through the GRIOTE project. It also benefited from the support of the French government via the National Research Agency in the context of the investment expenditure program IDEALG ANR-10-BTBR-02-04-11.
Conflicts of Interest
The authors declare no conflict of interest.
References
- Rigden, D.J.; Fernández-Suárez, X.M.; Galperin, M.Y. The 2016 database issue of Nucleic Acids Research and an updated molecular biology database collection. Nucl. Acids Res. 2016, 44, 1–6. [Google Scholar] [CrossRef] [Green Version]
- Thiele, I.; Palsson, B.Ø. A protocol for generating a high-quality genome-scale metabolic reconstruction. Nat. Protoc. 2010, 5, 93. [Google Scholar] [CrossRef] [PubMed] [Green Version]
- Gama-Castro, S.; Salgado, H.; Santos-Zavaleta, A.; Ledezma-Tejeida, D.; Muniz-Rascado, L.; García-Sotelo, J.S.; Alquicira-Hernández, K.; Martínez-Flores, I.; Pannier, L.; Castro-Mondragón, J.A.; et al. RegulonDB version 9.0: high-level integration of gene regulation, coexpression, motif clustering and beyond. Nucl. Acids Res. 2015, 44, D133–D143. [Google Scholar] [CrossRef] [PubMed] [Green Version]
- Gerstein, M.B.; Kundaje, A.; Hariharan, M.; Landt, S.G.; Yan, K.K.; Cheng, C.; Mu, X.J.; Khurana, E.; Rozowsky, J.; Alexander, R.; et al. Architecture of the human regulatory network derived from ENCODE data. Nature 2012, 489, 91. [Google Scholar] [CrossRef] [PubMed]
- Ihmels, J.; Levy, R.; Barkai, N. Principles of transcriptional control in the metabolic network of Saccharomyces cerevisiae. Nat. Biotechnol. 2003, 22, 86. [Google Scholar] [CrossRef]
- Schlitt, T.; Brazma, A. Current approaches to gene regulatory network modelling. BMC Bioinform. 2007, 8, S9. [Google Scholar] [CrossRef] [Green Version]
- Davidson, E.H.; Rast, J.P.; Oliveri, P.; Ransick, A.; Calestani, C.; Yuh, C.H.; Minokawa, T.; Amore, G.; Hinman, V.; Arenas-Mena, C.; et al. A genomic regulatory network for development. Science 2002, 295, 1669–1678. [Google Scholar] [CrossRef] [Green Version]
- Covert, M.W.; Schilling, C.H.; Palsson, B. Regulation of gene expression in flux balance models of metabolism. J. Theor. Biol. 2001, 213, 73–88. [Google Scholar] [CrossRef] [Green Version]
- Shlomi, T.; Eisenberg, Y.; Sharan, R.; Ruppin, E. A genome-scale computational study of the interplay between transcriptional regulation and metabolism. Mol. Syst. Biol. 2007, 3, 101. [Google Scholar] [CrossRef]
- Covert, M.W.; Knight, E.M.; Reed, J.L.; Herrgard, M.J.; Palsson, B.O. Integrating high-throughput and computational data elucidates bacterial networks. Nature 2004, 429, 92. [Google Scholar] [CrossRef]
- Machado, D.; Herrgård, M.J. Systematic evaluation of methods for integration of transcriptomic data into constraint-based models of metabolism. PLoS Comput. Biol. 2014, 10, e1003580. [Google Scholar] [CrossRef] [PubMed] [Green Version]
- Folger, O.; Jerby, L.; Frezza, C.; Gottlieb, E.; Ruppin, E.; Shlomi, T. Predicting selective drug targets in cancer through metabolic networks. Mol. Syst. Biol. 2011, 7, 1. [Google Scholar] [CrossRef]
- Chandrasekaran, S.; Price, N.D. Probabilistic integrative modeling of genome-scale metabolic and regulatory networks in Escherichia coli and Mycobacterium tuberculosis. Proc. Natl. Acad. Sci. USA 2010, 107, 17845–17850. [Google Scholar] [CrossRef] [PubMed] [Green Version]
- Colijn, C.; Brandes, A.; Zucker, J.; Lun, D.S.; Weiner, B.; Farhat, M.R.; Cheng, T.Y.; Moody, D.B.; Murray, M.; Galagan, J.E. Interpreting expression data with metabolic flux models: predicting Mycobacterium tuberculosis mycolic acid production. PLoS Comput. Biol. 2009, 5, e1000489. [Google Scholar] [CrossRef] [PubMed]
- Covert, M.W.; Xiao, N.; Chen, T.J.; Karr, J.R. Integrating metabolic, transcriptional regulatory and signal transduction models in Escherichia coli. Bioinformatics 2008, 24, 2044–2050. [Google Scholar] [CrossRef] [PubMed] [Green Version]
- Becker, S.A.; Palsson, B.O. Context-specific metabolic networks are consistent with experiments. PLoS Comput. Biol. 2008, 4, e1000082. [Google Scholar] [CrossRef]
- Agren, R.; Bordel, S.; Mardinoglu, A.; Pornputtapong, N.; Nookaew, I.; Nielsen, J. Reconstruction of genome-Scale Active Metabolic Networks for 69 Human Cell Types and 16 Cancer Types Using INIT. PLoS Comput. Biol. 2012, 8, e1002518. [Google Scholar] [CrossRef]
- Marmiesse, L.; Peyraud, R.; Cottret, L. FlexFlux: combining metabolic flux and regulatory network analyses. BMC Syst. Biol. 2015, 9, 93. [Google Scholar] [CrossRef] [Green Version]
- Jensen, P.A.; Papin, J.A. Functional integration of a metabolic network model and expression data without arbitrary thresholding. Bioinformatics 2010, 27, 541–547. [Google Scholar] [CrossRef]
- Orth, J.; Thiele, I.; Palsson, B. What is flux balance analysis? Nat. Biotechnol. 2010, 28, 245. [Google Scholar] [CrossRef]
- Roy, S.; Ernst, J.; Kharchenko, P.; Kheradpour, P.; Negre, N.; Eaton, M.; Olin, J.; Bristow, C.; Ma, L.; Lin, M. Identification of functional elements and regulatory circuits by Drosophila modENCODE. Science 2010, 330, 1787–1797. [Google Scholar] [PubMed] [Green Version]
- Edwards, J.S.; Palsson, B.O. The Escherichia coli MG1655 in silico metabolic genotype: Its definition, characteristics, and capabilities. Proc. Natl. Acad. Sci. USA 2000, 97, 5528–5533. [Google Scholar] [CrossRef] [Green Version]
- Bordbar, A.; Monk, J.M.; King, Z.A.; Palsson, B.O. Constraint-based models predict metabolic and associated cellular functions. Nat. Rev. Genetics 2014, 15, 107. [Google Scholar] [CrossRef] [PubMed]
- Karlebach, G.; Shamir, R. Modelling and analysis of gene regulatory networks. Nat. Rev. Mol. Cell Biol. 2008, 9, 770. [Google Scholar] [CrossRef] [PubMed]
- Yu, J.; Smith, V.A.; Wang, P.P.; Hartemink, A.J.; Jarvis, E.D. Advances to Bayesian network inference for generating causal networks from observational biological data. Bioinformatics 2004, 20, 3594–3603. [Google Scholar] [CrossRef] [PubMed] [Green Version]
- Vijesh, N.; Chakrabarti, S.K.; Sreekumar, J. Modeling of gene regulatory networks: A review. J. Biomed. Sci. Eng. 2013, 6, 223. [Google Scholar] [CrossRef] [Green Version]
- Chickering, D.M. Learning Bayesian Networks is NP-Complete. In Learning from Data—Fifth International Workshop on Artificial Intelligence and Statistics, AISTATS 1995, Key West, FL, USA, January 1995; Fisher, D., Lenz, H., Eds.; Springer: Berlin, Germany, 1995; pp. 121–130. [Google Scholar] [CrossRef]
- Kanehisa, M.; Araki, M.; Goto, S.; Hattori, M.; Hirakawa, M.; Itoh, M.; Katayama, T.; Kawashima, S.; Okuda, S.; Tokimatsu, T.; et al. KEGG for linking genomes to life and the environment. Nucleic Acids Res. 2008, 36, 480–484. [Google Scholar] [CrossRef]
- Han, H.; Shim, H.; Shin, D.; Shim, J.E.; Ko, Y.; Shin, J.; Kim, H.; Cho, A.; Kim, E.; Lee, T.; et al. TRRUST: A reference database of human transcriptional regulatory interactions. Sci. Rep. 2015, 5, 11432. [Google Scholar] [CrossRef]
- Han, H.; Cho, J.W.; Lee, S.; Yun, A.; Kim, H.; Bae, D.; Yang, S.; Kim, C.Y.; Lee, M.; Kim, E.; et al. TRRUST v2: An expanded reference database of human and mouse transcriptional regulatory interactions. Nucleic Acids Res. 2017, 46, D380–D386. [Google Scholar] [CrossRef]
- Regulation and signalization graph assembly through Linked Open Data. Available online: https://hal.archives-ouvertes.fr/hal-01768420/document (accessed on 1 July 2017).
- Gatto, F.; Miess, H.; Schulze, A.; Nielsen, J. Flux balance analysis predicts essential genes in clear cell renal cell carcinoma metabolism. Sci. Rep. 2015, 5, 10738. [Google Scholar] [CrossRef] [PubMed]
- SPARQL Query Language for RDF. Available online: https://drops.dagstuhl.de/opus/volltexte/2015/4986/pdf/13.pdf (accessed on 13 November 2019).
- Cerami, E.G.; Gross, B.E.; Demir, E.; Rodchenkov, I.; Babur, Ö.; Anwar, N.; Schultz, N.; Bader, G.D.; Sander, C. Pathway Commons, a web resource for biological pathway data. Nucleic Acids Res. 2011, 39, 685–690. [Google Scholar] [CrossRef]
- Haibe-Kains, B.; Olsen, C.; Djebbari, A.; Bontempi, G.; Correll, M.; Bouton, C.; Quackenbush, J. Predictionet: Inference for Predictive Networks Designed for (but not limited to) Genomic Data. Nucleic Acids Res. 2011, 40, D866–D875. [Google Scholar] [CrossRef] [PubMed] [Green Version]
- Yuan, C.; Druzdzel, M.J. Importance sampling algorithms for Bayesian networks: Principles and performance. Math. Comput. Modell. 2006, 43, 1189–1207. [Google Scholar] [CrossRef]
- Ankur, A.; Abinash, P. Pgmpy: Probabilistic Graphical Models using Python. In Proceedings of the 14th Python in Science Conference, Austin, TX, USA, 6–12 July 2015; pp. 6–11. [Google Scholar]
- Covert, M.W.; Famili, I.; Palsson, B.O. Identifying constraints that govern cell behavior: A key to converting conceptual to computational models in biology? Biotechnol. Bioeng. 2003, 84, 763–772. [Google Scholar] [CrossRef] [PubMed]
- Cairns, R.A.; Harris, I.S.; Mak, T.W. Regulation of cancer cell metabolism. Nat. Rev. Cancer 2011, 11, 85. [Google Scholar] [CrossRef] [PubMed] [Green Version]
- Hsu, P.P.; Sabatini, D.M. Cancer cell metabolism: Warburg and beyond. Cell 2008, 134, 703–707. [Google Scholar] [CrossRef] [PubMed] [Green Version]
- Nwosu, Z.C.; Megger, D.A.; Hammad, S.; Sitek, B.; Roessler, S.; Ebert, M.P.; Meyer, C.; Dooley, S. Identification of the Consistently Altered Metabolic Targets in Human Hepatocellular Carcinoma. Cell. Mol. Gastroenterol. Hepatol. 2017, 4, 303–323. [Google Scholar] [CrossRef] [Green Version]
- Agren, R.; Mardinoglu, A.; Asplund, A.; Kampf, C.; Uhlen, M.; Nielsen, J. Identification of anticancer drugs for hepatocellular carcinoma through personalized genome-scale metabolic modeling. Mol. Syst. Biol. 2014, 10, 3. [Google Scholar] [CrossRef]
- Pornputtapong, N.; Nookaew, I.; Nielsen, J. Human metabolic atlas: An online resource for human metabolism. Database 2015. [Google Scholar] [CrossRef]
- Brunk, E.; Sahoo, S.; Zielinski, D.C.; Altunkaya, A.; Drager, A.; Mih, N.; Gatto, F.; Nilsson, A.; Preciat Gonzalez, G.A.; Aurich, M.K.; et al. Recon3D enables a three-dimensional view of gene variation in human metabolism. Nat. Biotechnol. 2018, 36, 272. [Google Scholar] [CrossRef]
- Love, M.; Anders, S.; Huber, W. Beginner’s guide to using the DESeq2 package. Genome Biol. 2014, 15, 550. [Google Scholar] [CrossRef] [PubMed] [Green Version]
- Anders, S.; Huber, W. Differential expression analysis for sequence count data. Genome Biol. 2010, 11, R106. [Google Scholar] [CrossRef] [PubMed] [Green Version]
- Wishart, D.S.; Feunang, Y.D.; Guo, A.C.; Lo, E.J.; Marcu, A.; Grant, J.R.; Sajed, T.; Johnson, D.; Li, C.; Sayeeda, Z.; et al. DrugBank 5.0: A major update to the DrugBank database for 2018. Nucleic Acids Res. 2018, 46, D1074–D1082. [Google Scholar] [CrossRef] [PubMed]
- Mukaka, M.M. Statistics corner: A guide to appropriate use of correlation coefficient in medical research. Malawi Med. J. 2012, 24, 69–71. [Google Scholar] [PubMed]
- Stefanini, M. Enzymes, isozymes, and enzyme variants in the diagnosis of cancer. A short review. Cancer 1985, 55, 1931–1936. [Google Scholar] [CrossRef]
Figure 1.
Overview of the process used to integrate the metabolic and regulatory network using BayRegMet.
Figure 1.
Overview of the process used to integrate the metabolic and regulatory network using BayRegMet.

Figure 2.
Overview of the process used to automatic retrieval of regulatory genes using web semantic technologies.
Figure 2.
Overview of the process used to automatic retrieval of regulatory genes using web semantic technologies.

Figure 3.
BayRegMet framework to study drug-induced gene perturbations at a metabolic scale.

Figure 4.
Comparison between predicted Hepatocellular Carcinoma (HCC) tumor cell growth rates obtained under sterile water and those under Sorafenib and Regorafenib drugs with an evidence set that contains known drug targets and genes that correlate with them.
Figure 4.
Comparison between predicted Hepatocellular Carcinoma (HCC) tumor cell growth rates obtained under sterile water and those under Sorafenib and Regorafenib drugs with an evidence set that contains known drug targets and genes that correlate with them.

Figure 5.
Comparison between predicted HCC tumor cell growth rates obtained under sterile water, those under Sorafenib and Regorafenib drugs with an evidence set that contains known drugs targets and genes that correlated with them, and those predicted with only known drug genes targets.
Figure 5.
Comparison between predicted HCC tumor cell growth rates obtained under sterile water, those under Sorafenib and Regorafenib drugs with an evidence set that contains known drugs targets and genes that correlated with them, and those predicted with only known drug genes targets.

Figure 6.
Comparison between predicted HCC tumor cell biomass rates with a random evidence set and those with approved drugs targets and their correlated genes.
Figure 6.
Comparison between predicted HCC tumor cell biomass rates with a random evidence set and those with approved drugs targets and their correlated genes.

Figure 7.
Distribution of biomass rates in terms of the cutoff value of Pearson’s correlation coefficient: For each simulation, we selected genes that have correlation coefficients above a fixed cutoff. For 0.1, 0.2, and 0.3 thresholds, the average of biomass rates predicted by BayRegNet for each drugs is . This is due to the fact that an important number of genes have been selected and that consequently all their corresponding TFs are knocked out, which inhibits cell growth. From the shape of the biomass distribution with respect to the threshold values, we can see that a cutoff value of 0.5 is a convenient threshold in our simulations.


Table 1.
Overview of the main approaches used to integrate the genome-scale metabolic and gene regulatory networks: Classification of methods according to their intended functionality regarding metabolic flux distribution prediction, context-specific models building, or both. These methods can be also divided into two categories regarding how genes activity is modeled in the gene regulatory network (GRN); for the Boolean framework, each gene in the GRN is in one of two states: active or inactive. The requirement of transcriptomic data as input to determine the active and inactive sets of genes in a given condition is another grouping criterion. Some approaches cannot deal with the large-scale model, especially those that are based on manually reconstructed TRNs.
| Approaches | Functionality | Model of GRN | Transcriptomic Data | Large-Scale Models | |||
|---|---|---|---|---|---|---|---|
| Building Models | Flux Prediction | Both | Boolean | Non Boolean | |||
| PROM [13] | X | X | X | ||||
| E-flux [14] | X | X | X | ||||
| rFBA [10] SR-FBA [9] iFBA [15] | X | X | X | ||||
| GIMME [16] | X | X | X | ||||
| INIT [17] | X | X | X | X | |||
| FlexFlux [18] | X | X | X | ||||
| MADE [19] | X | X | X | ||||
© 2020 by the authors. Licensee MDPI, Basel, Switzerland. This article is an open access article distributed under the terms and conditions of the Creative Commons Attribution (CC BY) license (http://creativecommons.org/licenses/by/4.0/).
Share and Cite
MDPI and ACS Style
Mhamdi, H.; Bourdon, J.; Larhlimi, A.; Elloumi, M. Bayesian Integrative Modeling of Genome-Scale Metabolic and Regulatory Networks. Informatics 2020, 7, 1. https://doi.org/10.3390/informatics7010001
AMA Style
Mhamdi H, Bourdon J, Larhlimi A, Elloumi M. Bayesian Integrative Modeling of Genome-Scale Metabolic and Regulatory Networks. Informatics. 2020; 7(1):1. https://doi.org/10.3390/informatics7010001
Chicago/Turabian StyleMhamdi, Hanen, Jérémie Bourdon, Abdelhalim Larhlimi, and Mourad Elloumi. 2020. "Bayesian Integrative Modeling of Genome-Scale Metabolic and Regulatory Networks" Informatics 7, no. 1: 1. https://doi.org/10.3390/informatics7010001
Note that from the first issue of 2016, this journal uses article numbers instead of page numbers. See further details here.