
Tortuosity Index Calculations in Retinal Images: Some Criticalities Arising from Commonly Used Approaches


Department of Cardiovascular, Endocrine-Metabolic Diseases and Aging, Istituto Superiore di Sanità, 00161 Roma, Italy
*
Author to whom correspondence should be addressed.
Information 2021, 12(11), 466; https://doi.org/10.3390/info12110466
Submission received: 22 September 2021
/
Revised: 7 November 2021
/
Accepted: 8 November 2021
/
Published: 10 November 2021
(This article belongs to the Special Issue Biosignal and Medical Image Processing)
Abstract
:A growing body of research in retinal imaging is recently considering vascular tortuosity measures or indexes, with definitions and methods mostly derived from cardiovascular research. However, retinal microvasculature has its own peculiarities that must be considered in order to produce reliable measurements. This study analyzed and compared various derived metrics (e.g., TI, TI_avg, TI*CV) across four existing computational workflows. Specifically, the implementation of the models on two critical OCT images highlighted main pitfalls of the methods, which may fail in reliably differentiating a highly tortuous image from a normal one. A tentative, encouraging approach to mitigate the issue on the same OCT exemplificative images is described in the paper, based on the suggested index TI*CV.
1. Introduction
Since the introduction of Optical Coherence Tomography as a retinal morphofunctional investigational technique, an exceptional amount of diagnostic information is overwhelming clinicians, and this trend is constantly increasing with the evolution of the technology and the features of the associated software [1]. Researchers detected at least a couple of relevant weaknesses within this trend:
As a paradigm of these weaknesses, retinal vascular tortuosity is one of the features that are recently gaining increasing attention.
Vascular tortuosity is a striking physiological feature that has been studied since Leonardo Da Vinci ‘s works [9,10,11]. This 16th century scientist was the first to observe that superficial vessels of an elderly’s arm were more tortuous than the corresponding vessels of a young individual. Since then, vascular tortuosity has been a subject of study in a wide range of body districts; this phenomenon, in fact, affects both small size vessels, such as distal finger capillaries and retinal arteries, and middle and large size arteries, such as the aorta and the coronary, cerebrovascular or iliac vessels.
While mild vessel tortuosity is usually asymptomatic, increased or severe vessel tortuosity can lead to ischemic manifestations in the affected organ. Clinical studies have linked vessel tortuosity to aging, atherosclerosis, hypertension, genetic defects and diabetes mellitus [12,13,14,15,16].
The mechanism of progression, if any, is still poorly understood.
Retinal vascular tortuosity is getting in researchers focus both for its retinal consequences and the suggestive correlations with systemic diseases: several papers deal with retinal tortuosity in people with diabetes [17,18,19] even without diabetic retinopathy [20], carotid artery stenosis [21], cognitive impairment, Alzheimer’s disease [22,23,24], increased cardiovascular risk [25,26], prematurity [27], hypertensive and diabetic retinopathy, macular degeneration, acute stroke, neovascular glaucoma, as well as coronavirus disease [28,29].
Retinal tortuosity can be described as the presence of curliness in vessels; however, there is not a standardized agreement on how to clinically define a tortuous retina: vessel tortuosity is mostly assessed using the clinician’s experience in identifying variations in vessel normal course, mainly highlighting dissimilarities with respect to normal healthy vessels. This subjective assessment of vessel tortuosity can lead to a high inter-expert variability, and has been a promoting factor for several studies aimed at delivering more formal mathematical definitions of tortuosity [30,31,32].
In the Artificial Intelligence and Big Data Era, some questions may arise observing the diverse applications of more or less established computer-based analysis techniques, together with the need to critically review their application, especially in the context of scientific repeatability of results [33]. This is a relevant topic, especially in those cases where technological advancements render complex tools, whose limitations are less evident than their capabilities, available to a broader and broader number of researchers.
Main aim of this paper is to discuss some criticalities that frequently used tortuosity computation workflows may encounter in analyzing retinal tortuosity. In particular, Authors’ efforts focus on finding and commenting potential pitfalls identified in the Lee’s method [34], an AI-based computational workflow easy to implement and exhaustively described in the literature. To better understand those criticalities, tortuosity indexes of two exemplificative, critical OCT images are computed by using Lee’s method and other published methods, either AI-based or traditional. Further, a preliminary exploration of possible mitigation actions is described in the paper, and a potentially better performing tortuosity index is proposed and used on the same tricky images.
2. Materials and Methods
The method from Lee [34] was identified as a potential example of a computational workflow easily available to researchers. A PubMed search was carried on to identify a subset of papers citing Lee’s work and dealing with tortuosity indexes. The full text of those papers was reviewed in order to identify whether and how they actually used Lee’s method.
Tortuosity indexes and other image derived statistics were then computed by using the Lee’s method (Method A), the deep learning method described by Zhao [35] (Method B) and two classical image processing methods (Methods C and D) previously used by our group. In more detail:
Method A: machine learning classification task was performed using Fiji’s Trainable Weka Segmentation plugin [36] following the previously published procedure [34,37]. The classifier’s output consists of a segmentation probability map highlighting the retinal structures detected as vessels. The probability map was then converted into a binarized image.
Method B: the skeletonization results coming from the deep learning method described by Zhao [35] and available in the ROSE-2 subset were used for this analysis.
Methods C and D: image binarization was performed with classical image processing methods (no artificial intelligence support) previously used and published by our group ([38] and [39], respectively). Briefly, Method C uses some preprocessing techniques (Niblack’s algorithm, histogram equalization) followed by image binarization by the method of Ridler and Calvard [40], while Method D uses Otsu’s segmentation [41] method followed by active contours (snakes) region growing technique [42].
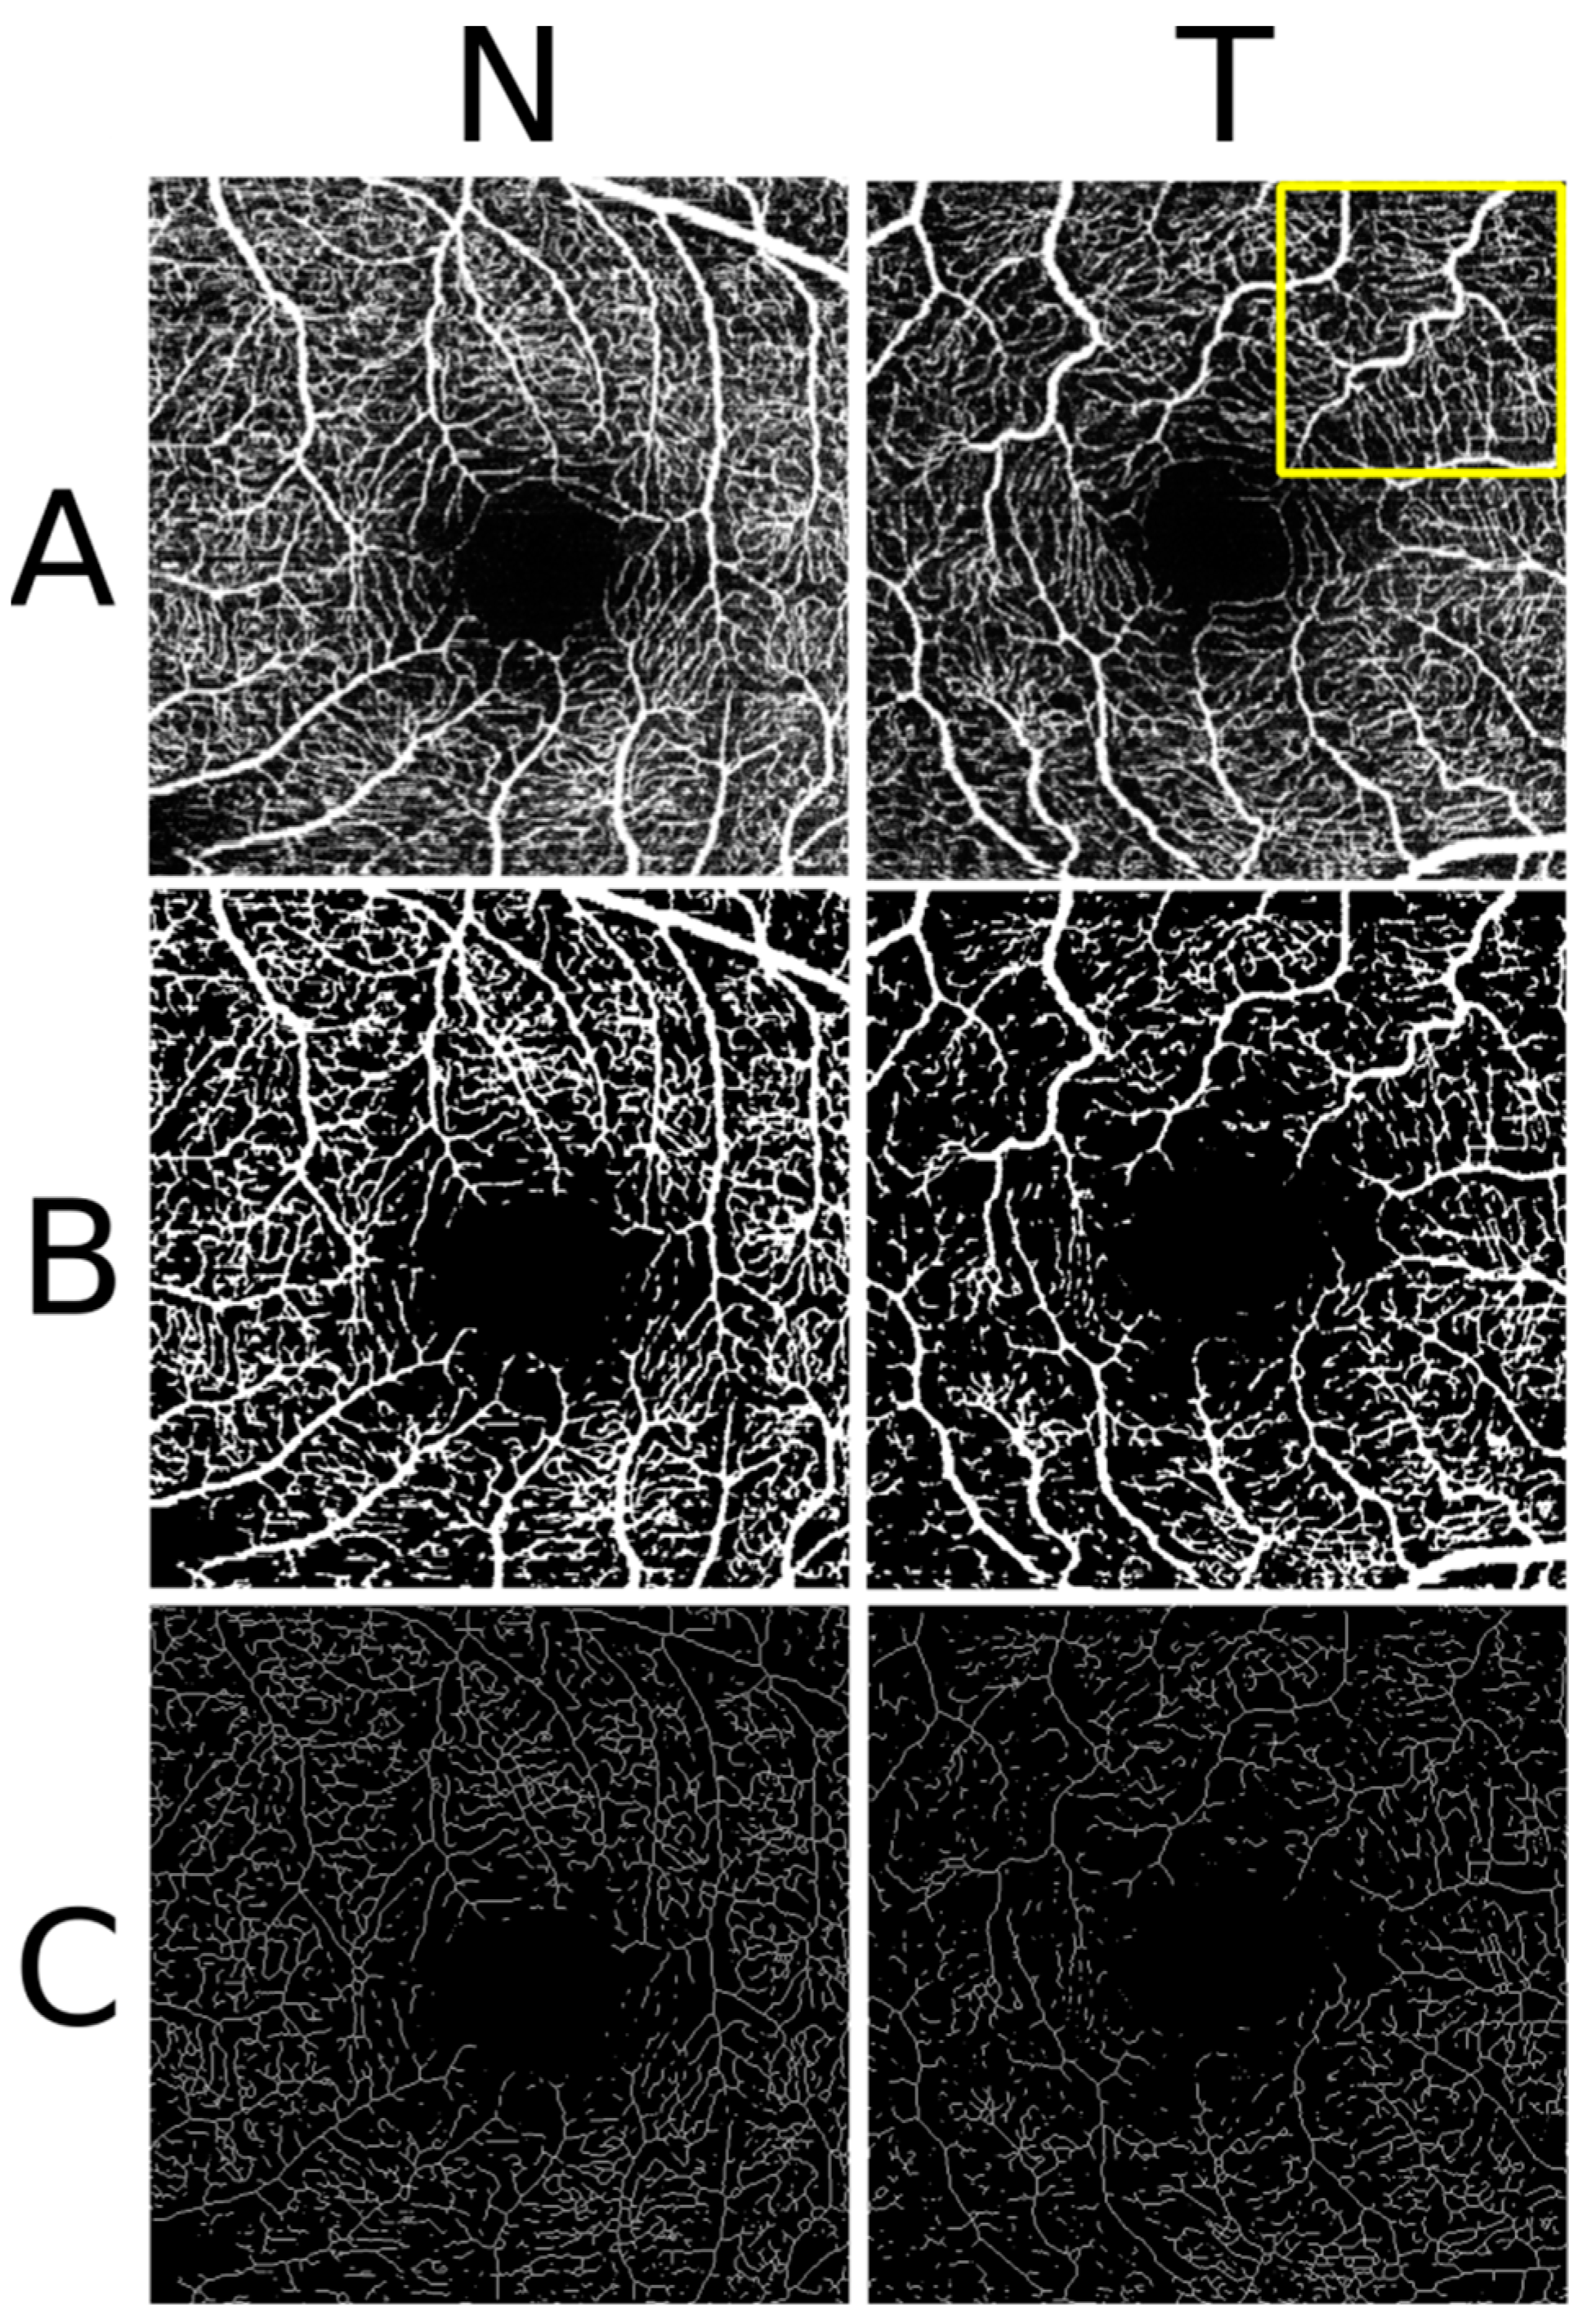
In Methods A, C and D the binarization was followed by a skeletonization (each white object in the binary image was converted to a single pixel line) in Fiji; in all the four methods the skeleton features (branch length (BL), vertices positions, branch Euclidean distance (ED)) were calculated in Fiji using the available AnalyzeSkeleton plugin [43]. The previously published procedure setup [34] was implemented for skeletonization and skeleton feature extraction. Figure 1 reports examples for method A.
Starting from the skeleton features, tortuosity index was computed as previously proposed [34], namely:
Several additional branches measurement-related metrics were calculated as well, and reported in Table 1. Conversion from measurements expressed in pixels to metric lengths and areas were performed considering a pixel transverse size of 9.37 μm [44]. All image processing was performed using a combination of Mathwork’s Matlab [45], Fiji [46] and some Fiji plugins [43]. A more detailed insight of the implemented methods is available in Supplementary Material S1.
OCT en face angiograms were obtained from the Rose Dataset (ROSE-2 subset) [35], containing OCT-A images acquired by Heidelberg OCT2 system with Spectralis software (Heidelberg Engineering, Heidelberg, Germany), within a 3 × 3 mm2 area centered at the fovea. In this database, two retinal angiograms (N and T) were selected which resulted clearly distinguishable as for vessel tortuosity, the latter (T) being characterized by evident vessel tortuosity (Figure 1, panel A, left N, right T).
3. Results
In the PubMed search 33 papers citing the Lee’s 2018 publication [34] were found. Full text review identified 10 papers which actually used Lee’s method, eight of which were from groups different from Lee’s one. Incidentally, in other, side searches, some papers were found [21] which use the same (or similar method) without citing the original reference. This result is consistent with the good acceptance of Lee’s work, and the relatively high number of groups who have been using this method in the last three years; this shows the diffusion of the method and, consequently, the importance of getting a better insight on the used methodologies.
Segmentation and skeletonization results are reported in the exemplificative Figure 1 (Method A). Regarding the computed metrics, Table 1 contains three different tortuosity indexes and several branch-related features.
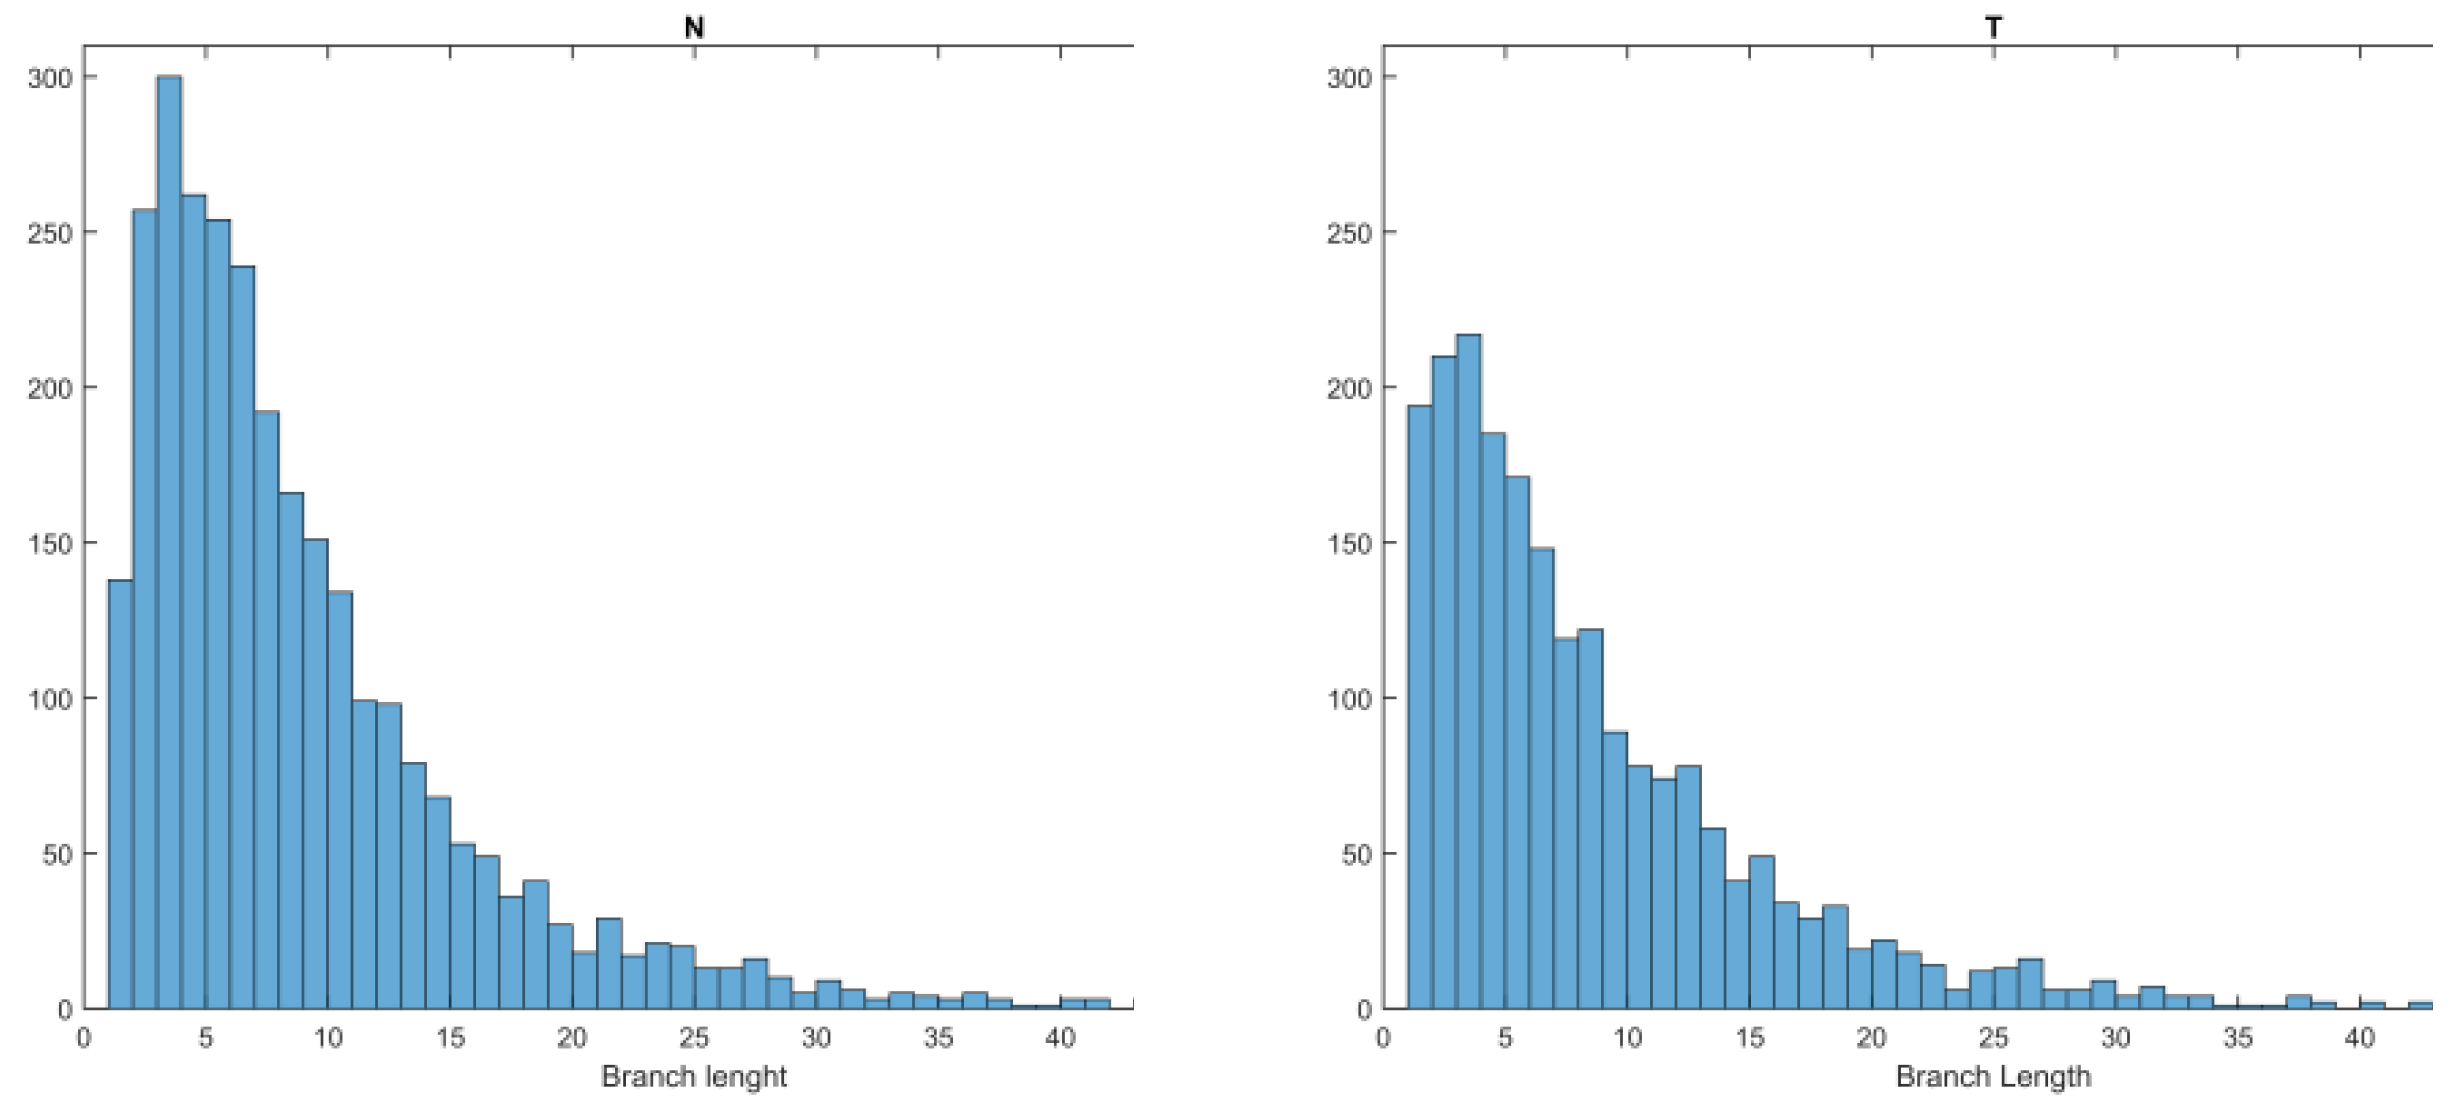
All methods identified a smaller number of branches in the more tortuous retina (T), and AI- based methods (methods A and B) resulted in a generally smaller number of branches with respect to conventional image processing methods. Regarding the distribution of branch lengths, several potential criticalities should be noted. As a general observation, computed branch lengths are not normally distributed (Shapiro–Wilk, p < 0.05 for all methods, see histogram in Figure 2 for method A). Mean branch length for image N varies from 12.97 pixel to 6.58 pixel (121 to 61 μm), while mean branch length for image T varies from 13.28 pixel to 6.56 pixel (124 to 61 μm). A high percentage of computed branches (from 47.23% up to 80.85%) are less than 10 pixels length (93 μm), and at least 80% are less than 21 pixels, corresponding to a metric length close to 200μm. A certain number of computed branches have unitary length (and consequently, ED = 1). While it is not clear which impact this computed length has on TI, conceptually this can be classified as an unwanted effect of the skeletonization procedure.
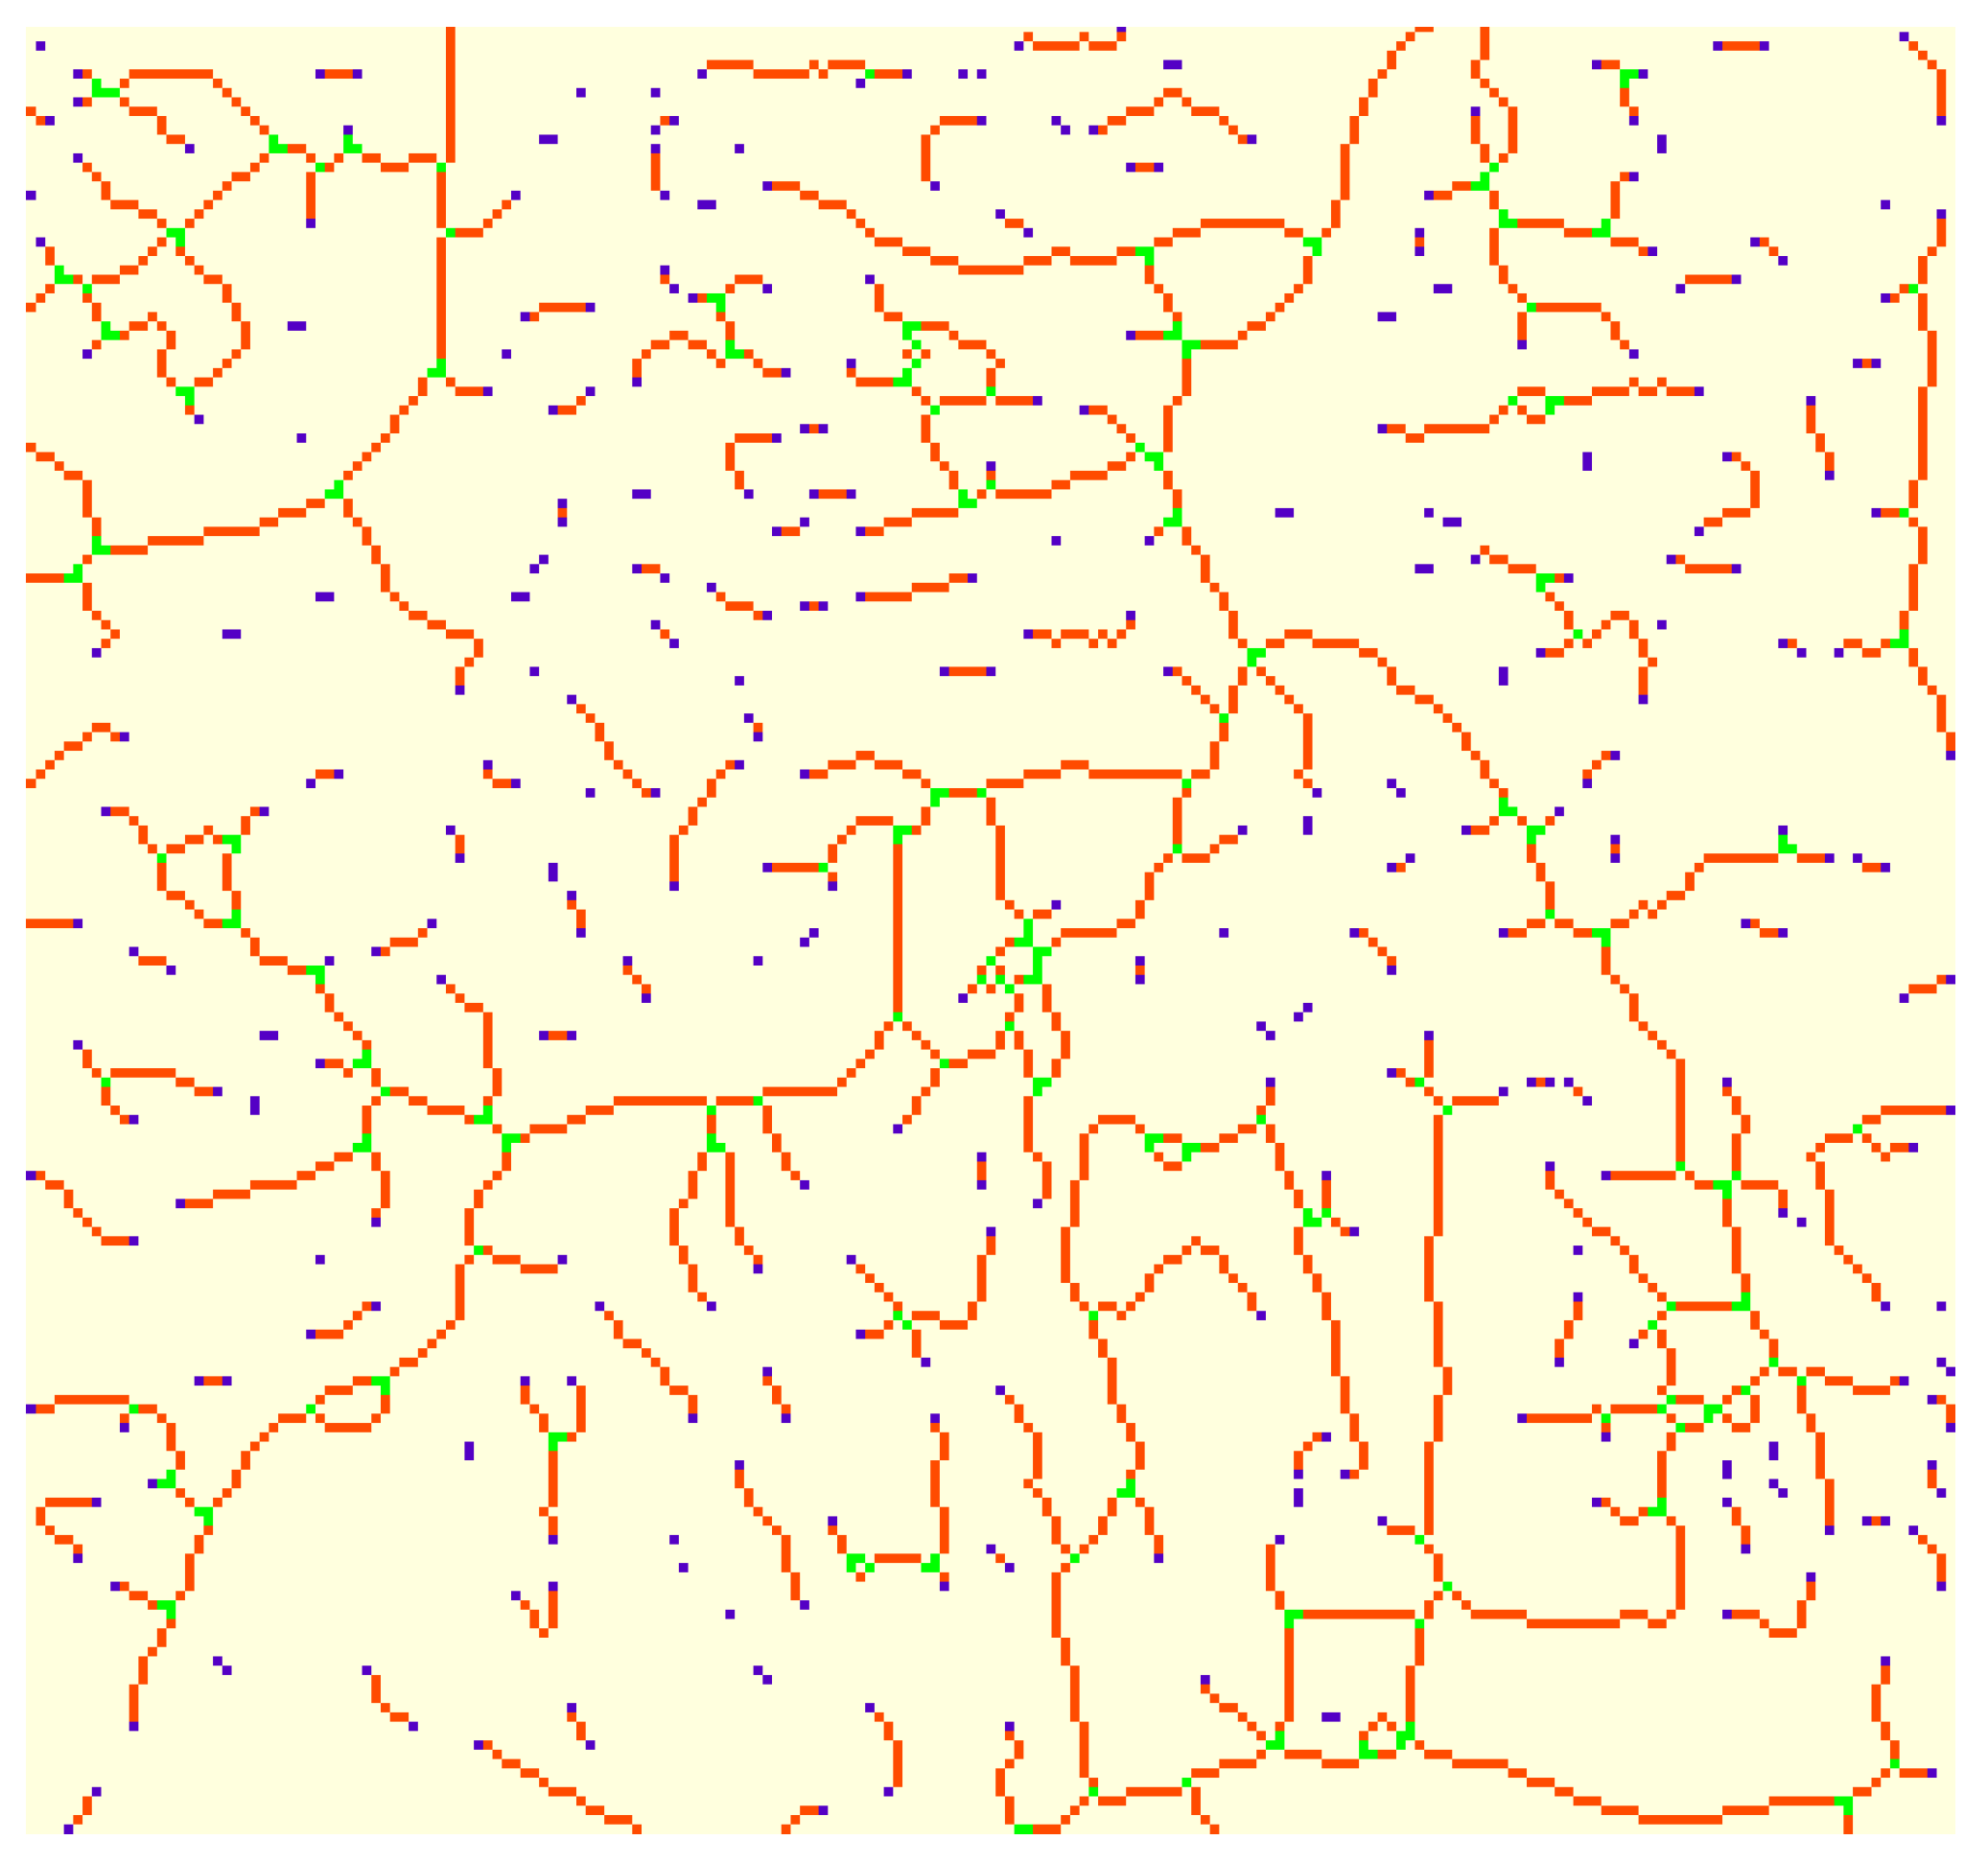
Additionally, a relevant number of computed Euclidean distances are equal to zero. This last observation deserves additional comments. First, ED can be zero if and only if the starting point of the branch and the ending point coincide. This can happen, and actually does happen, when the skeletonization process identifies a loop (examples are visible in Figure 3). This means that the presence of loops in skeletons silently affects TI computation, since they have positive branch lengths (numerator) and zero ED (denominator). For this reason, in the present work zero ED branches were excluded from the computation of TI avg.
In Figure 3, the output of the branch detection computations is shown for upper right corner of T image. The branch detection algorithm classifies each pixel into three different categories depending on its neighbors: pixels having less than two neighbors are classified as end points (blue); pixels having more than two neighbors are classified as junctions (green), while pixels having exactly two neighbors are classified as slabs (branches, in orange).
In the figure, it can also be easily observed that most branches are relatively short (their length is limited by the presence of junctions), and this may affect TI computations (Figure 2).
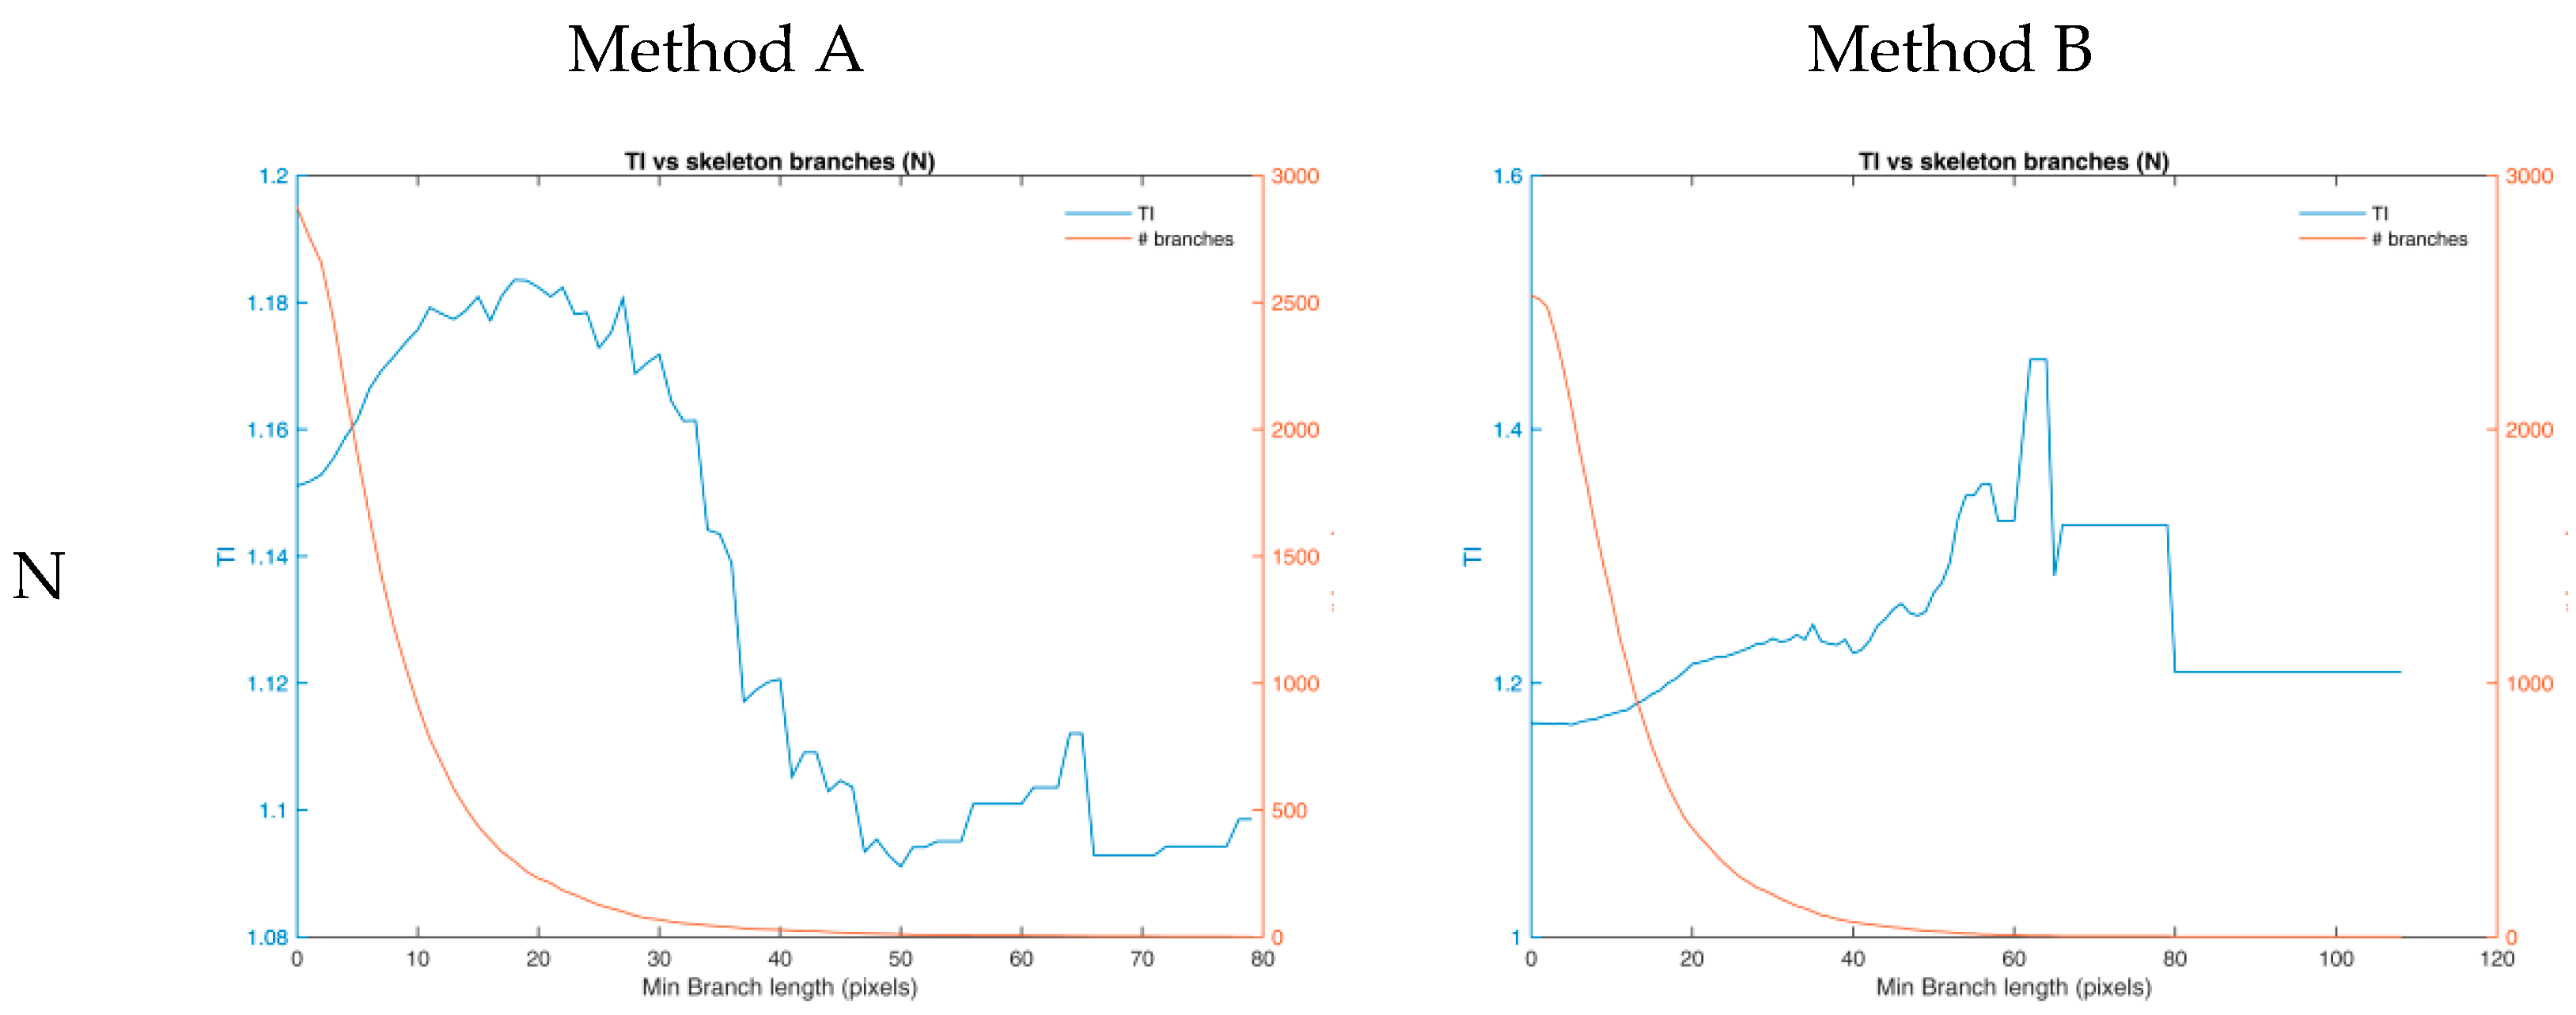
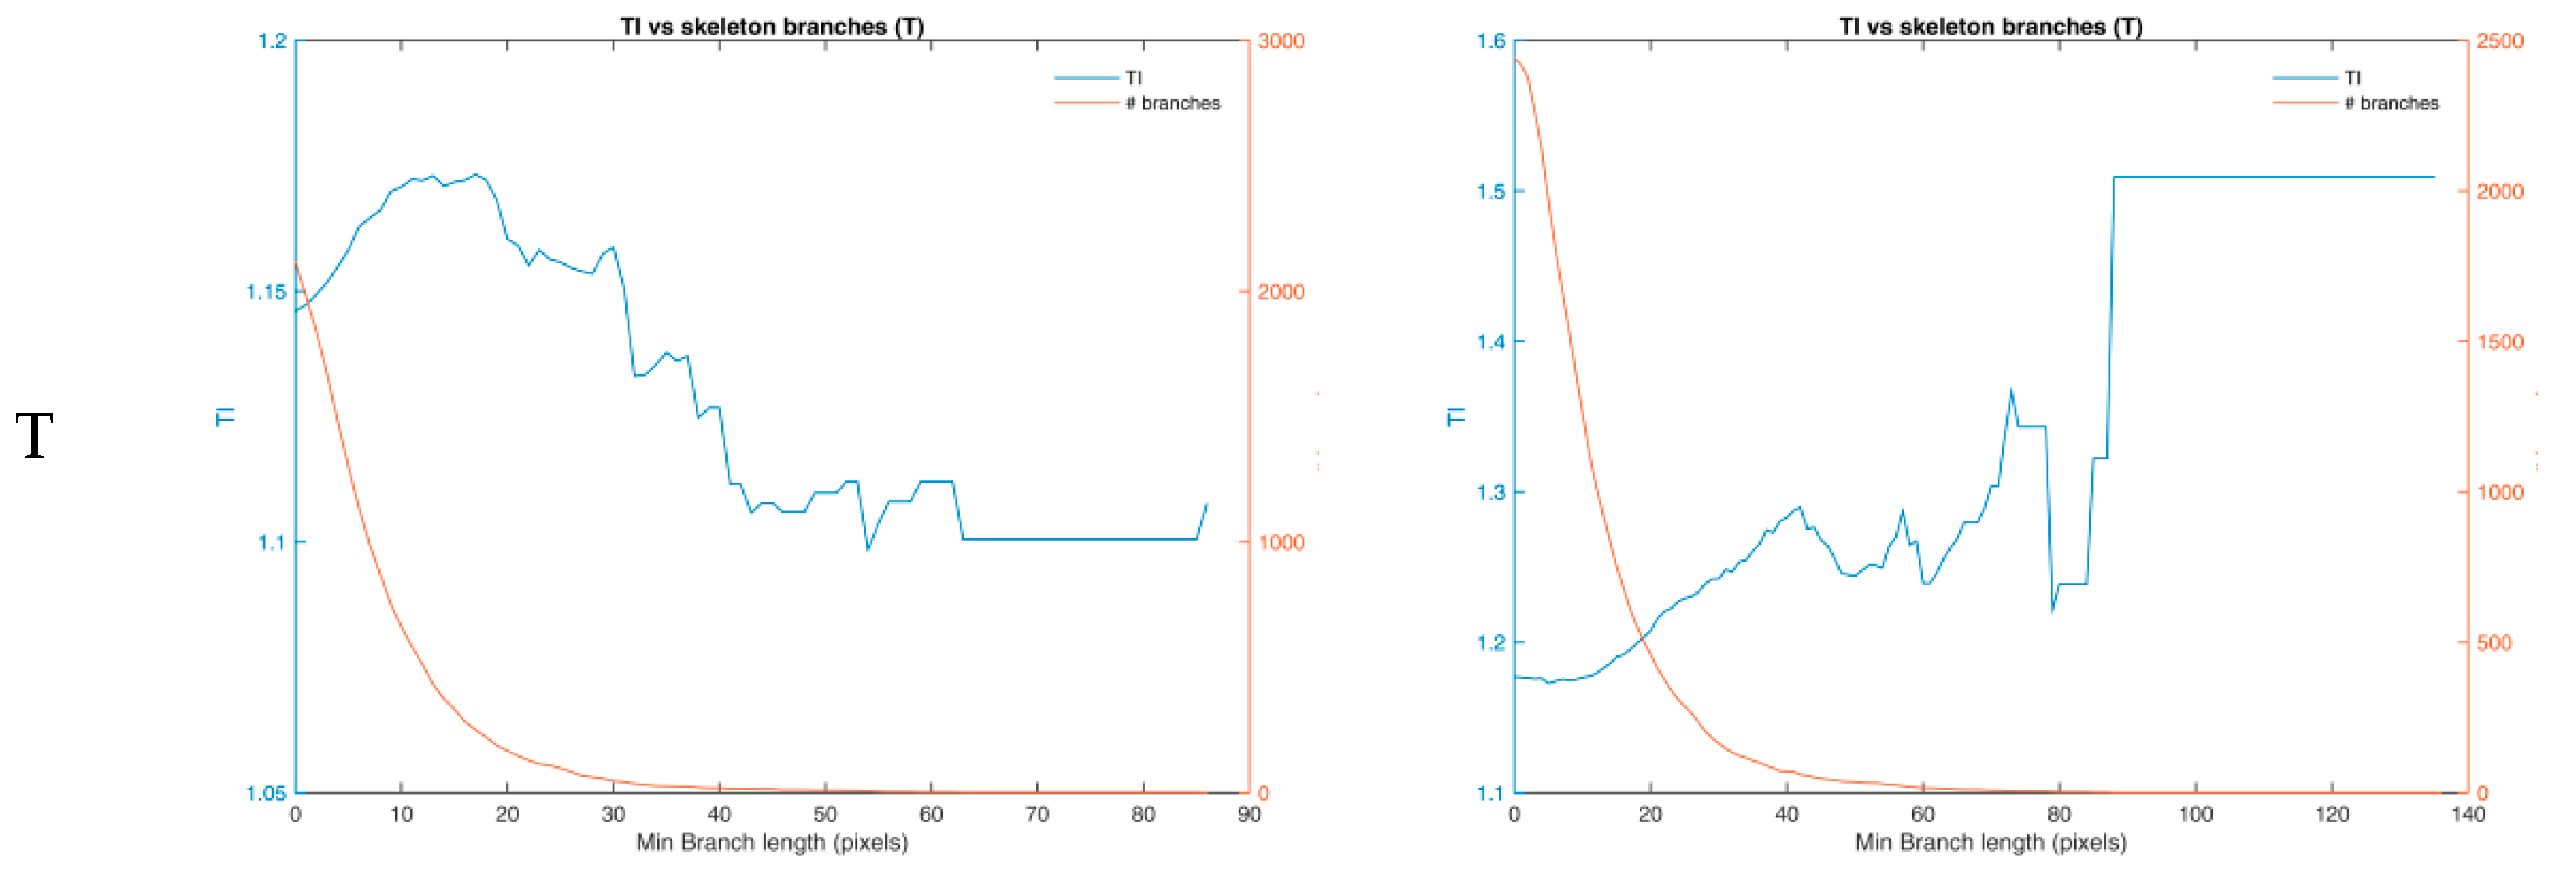
Regarding tortuosity index TI, (sum branch lengths/sum Euclidean distance) it must be noted that in two out of four imaging processing workflows (denoted * in Table 1), the smallest computed index is associated with the most tortuous retina. As a collateral observation, we hypothesized that the contribution of very small branches may adversely affect TI behavior. However, this hypothesis was refuted by calculating TI while iteratively removing increasing length branches. As a matter of fact, TI dependence on branch lengths has a similar behavior in both cases (N and T) and with all considered methods. As an exemplificative case, in Figure 4, TI is reported as a function of minimal branch length (for methods A and B).
In all considered combinations, TI initially increases-i.e., when removing very short branches-, reaches a maximum at branch lengths between 10 and 30 pixels, and gradually decreases until the relatively small number of included branches generates a certain numerical instability. All methods deliver results with similar behavior. The removal of small branches from TI computation does not alter the relationship between TI (N) and TI(T), which remains inverted with respect to what expected -namely, higher TI for more tortuous retinas.
TI_avg was computed as
i.e., the average of the ratios between branch length and Euclidean distance for each branch. This index, introduced to avoid the influence of the length of loop branches and to weigh the contribution of each individual branch to the tortuosity metric, seems to perform even worse than TI (Table 1).
The last index, TI*CV, was computed multiplying TI by the coefficient of variation (CV) of the branch length (sd/mean for all branches in the image). Since branch length CV is a measure of mean branch length precision, this index represented an attempt to compensate mean branch length inaccuracy due to the excessive segmentation (and the possible underestimation of tortuosity) of longer branches.
At least for the analyzed images, TI*CV seems to correlate better than the other proposed indexes with the tortuosity of the examined angiograms, in all selected imaging workflows (Table 1).
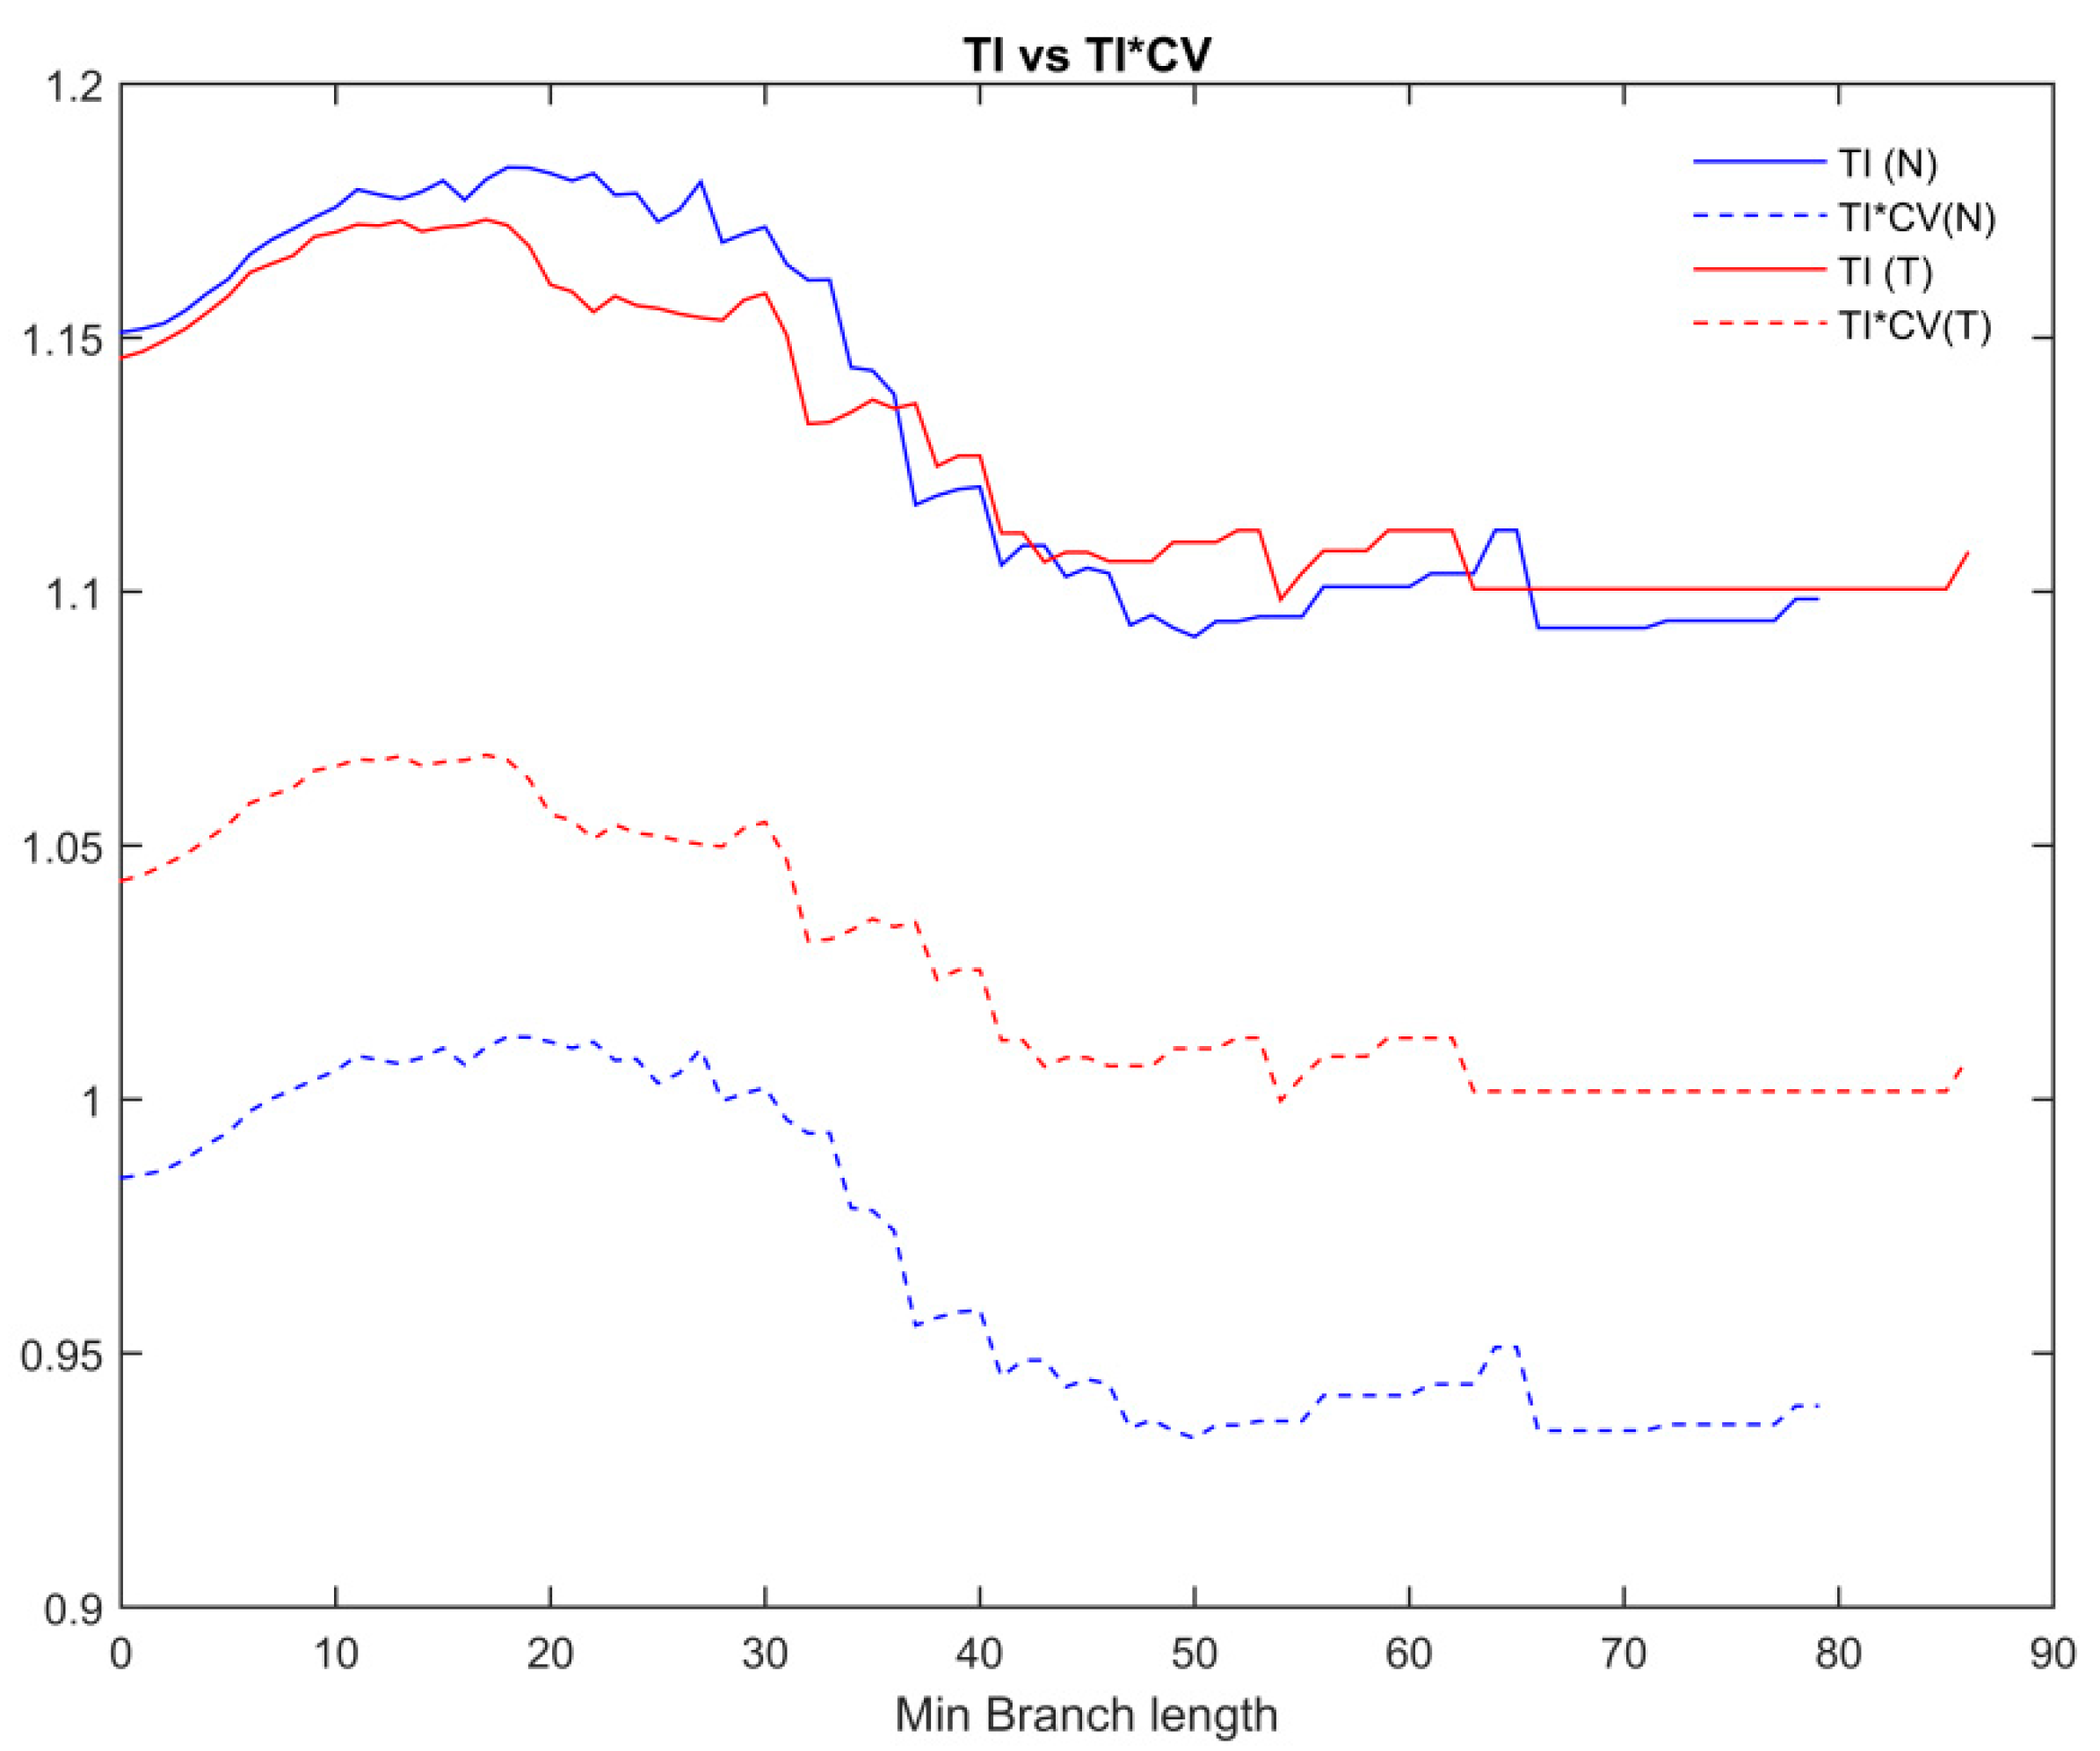
The dependence of TI and TI*CV on branch length was finally investigated, by calculating both indexes while iteratively removing branches of increasing length. Figure 5 shows this dependence for method A (similar results were obtained for the other methods); the plot clearly shows the inversion of the two indexes between N and T angiograms (TI*CV higher for T than for N, as expected).
4. Discussion
Objective quantification of vessels tortuosity in retinal images may be of great clinical relevance both in the presence of retinal pathologies and in the investigation of correlated systemic diseases. To the Authors’ knowledge, however, this work is the first to highlight relevant criticalities emerging from the adaptation of tortuosity computational methods used in cardiovascular research to the quantitative examination of retinal vessels. Usually, in fact, papers dealing with the analysis of retinal vessels in retinal images apply published computational methods to address clinical questions, without systematically investigating technical or methodological criticalities.
One of the most used and novel approaches, the Lee method has been here analyzed and tested with respect to two exemplificative retinal images, purposely selected because it referred to two clearly distinguishable levels of vessels tortuosity. The performance of the method, which resulted in a higher tortuosity index (TI) for the less tortuous retina (1.151 against 1.146 for the more tortuous retina) suggested a deeper, step-by-step investigation: each step (and the corresponding outcomes) of the method workflow was then analyzed, as well as other relevant branch-related features, the comparison with similar approaches, and the search for possible mitigation actions.
The first observed criticality concerns a potential limitation of all the four analyzed computational methods in accurately deriving feature images and numerical measures. This limitation may entail possible underestimation of the index: tortuosity of long vessels, in fact, is likely underestimated by the skeleton analysis process which, in turn, depends on the preceding image segmentation and skeletonization process. The difficulty of the method to identify branches whose length is comparable with the original, longer vessels may in fact entail a sort of “piecewise linearization” of those vessels: as a result, the computation of apparently longer Euclidean distances of the “pieces” of branches contributes to lower the tortuosity index. Focusing on the results summarized in Table 1, Method B (a previously published deep learning model [35]) seems to define a bit longer branches than the other examined methods, with a smaller percentage of very short branches; however, also in this case, it is worth noticing that more than 80% of branches is shorter than 20 pixels (less than 200 μm). This effect, at the same length cut-off, has been reported by other authors [47], and is a common problem well known even in other related fields [48]. Ideally, the impact of shorter (and smaller) capillary vessels on TI should be carefully assessed, since their presence and morphology are highly dependent on the image processing workflow and on the image quality.
Another relevant criticality, as already mentioned in the Results section, is the presence of loops: they have Euclidean distance equal to zero—thus having no weight in the denominator of the tortuosity index—but their branch lengths do contribute and affect the index numerator. From this point of view, and with reference to the two specific images analyzed in this study, Method A (which implements a machine learning classification task) seems the most robust, with a significantly lower number of loops.
Methods B and C (classical image processing methods), for the specific image comparison, show a suitable behavior and deliver a higher tortuosity index for the more tortuous retina.
In the attempt to mitigate the impact of segmentation and skeletonization processes on the clinical relevance of the derived metrics, a different implementation of the TI was investigated: namely, the TI_avg was calculated as the mean value of the distribution of individual TI calculated for each branch. This new index, however, seems to perform even worse than the original TI.
The best performing adaptation of the index came out by introducing a correction factor which accounts for the different branch length variability within each image. Specifically, the coefficient of variation of branch lengths was calculated for each image; this relevant indicator simultaneously accounts not only for the branch lengths distribution but also for their numerosity, and magnifies the TI of those images with higher uncertainty of the mean. The use of this correction factor brought to the TI*CV index which resulted higher for the more tortuous image irrespective of the method (Table 1). These results remain valid also in the case a high-pass threshold is introduced to remove the shortest branches from the computation. Figure 5 shows the TI and the TI*CV indexes as function of the fixed threshold for the branch length inclusion/exclusion in Method A (similar results were found for the other examined methods). With respect to TI index, which is alternatively—i.e., positively or negatively—affected by short branches removal, TI*CV remains relatively stable over a wide branch length interval. While working satisfactorily on the OCT exemplificative images analyzed in this study, this promising index needs of course a wider validation on an adequate dataset of retinal images. The proposed mitigation approach, however, may result useful and applicable to other retinal vessel structural indexes.
5. Conclusions
Vessel’s tortuosity in retinal images has a great clinical relevance. Its objective quantification, currently relying on the adaptation of existing tortuosity computational methods mostly used in cardiovascular research, shows some criticalities. The exploratory investigation conducted in this study, based on two exemplificative retinal images with very different tortuosity, highlighted potential limitations of some computational methods, either AI or not AI-based-in accurately deriving feature images and numerical measures. Those limitations may in turn entail possible underestimation of the currently used metrics associated with the tortuosity index. The study also suggests that attempts may be conducted to optimize those metrics so as to mitigate the impact of segmentation and skeletonization processes; in the exploratory attempt conducted by the authors on the two exemplificative images, the best performing adaptation of the tortuosity index was shown by introducing a correction factor which accounts for the different branch length variability. Irrespective of the specific solution hereby proposed, the mitigation approach may result useful and applicable to other retinal vessel structural indices.
Supplementary Materials
The following are available online at https://www.mdpi.com/article/10.3390/info12110466/s1, Supplementary S1: Image processing and branch information calculations workflow.
Author Contributions
Conceptualization, F.M.; methodology, F.M. and C.G.; software, F.M.; writing—original draft preparation, F.M. and C.G.; writing—review and editing, F.M. and C.G.; All authors have read and agreed to the published version of the manuscript.
Funding
This research received funding from Istituto Superiore di Sanità, Intramural Support for the “Ricerca e innovazione tecnologica nella gestione della funzione visiva” Project.
Data Availability Statement
All OCT images used in this works are available in the publicly available dataset described in [35]. Matlab codes are made available by the authors on reasonable requests.
Acknowledgments
All OCT images used in this works were drawn, with permission, from the dataset described in [35].
Conflicts of Interest
The authors declare no conflict of interest.
References
- Kashani, A.H.; Chen, C.-L.; Gahm, J.K.; Zheng, F.; Richter, G.M.; Rosenfeld, P.J.; Shi, Y.; Wang, R.K. Optical Coherence Tomography Angiography: A Comprehensive Review of Current Methods and Clinical Applications. Prog. Retin. Eye Res. 2017, 60, 66–100. [Google Scholar] [CrossRef] [PubMed]
- Cruz-Herranz, A.; Balk, L.J.; Oberwahrenbrock, T.; Saidha, S.; Martinez-Lapiscina, E.H.; Lagreze, W.A.; Schuman, J.S.; Villoslada, P.; Calabresi, P.; Balcer, L.; et al. The APOSTEL recommendations for reporting quantitative optical coherence tomography studies. Neurology 2016, 86, 2303–2309. [Google Scholar] [CrossRef] [PubMed]
- Mendonça, L.S.M.; Perrott-Reynolds, R.; Schwartz, R.; Madi, H.A.; Cronbach, N.; Gendelman, I.; Muldrew, A.; Bannon, F.; Balaskas, K.; Gemmy Cheung, C.M.; et al. Deliberations of an International Panel of Experts on OCT Angiography Nomenclature of Neovascular Age-Related Macular Degeneration. Ophthalmology 2020, 128, 1109–1112. [Google Scholar] [CrossRef] [PubMed]
- Spaide, R.F.; Jaffe, G.J.; Sarraf, D.; Freund, K.B.; Sadda, S.R.; Staurenghi, G.; Waheed, N.K.; Chakravarthy, U.; Rosenfeld, P.J.; Holz, F.G.; et al. Consensus Nomenclature for Reporting Neovascular Age-Related Macular Degeneration Data: Consensus on Neovascular Age-Related Macular Degeneration Nomenclature Study Group. Ophthalmology 2020, 127, 616–636. [Google Scholar] [CrossRef]
- Staurenghi, G.; Sadda, S.; Chakravarthy, U.; Spaide, R.F. International Nomenclature for Optical Coherence Tomography (IN• OCT) Panel. Proposed lexicon for anatomic landmarks in normal posterior segment spectral-domain optical coherence tomography: The IN• OCT consensus. Ophthalmology 2014, 121, 1572–1578. [Google Scholar] [CrossRef]
- Balaskas, K.; Tiew, S.; Czanner, G.; Tan, A.L.; Ashworth, J.; Biswas, S.; Aslam, T. The Novel Evidenced Assessment of Tortuosity System: Interobserver Reliability and Agreement with Clinical Assessment. Acta Ophthalmol. (Copenh.) 2016, 94, e421-6. [Google Scholar] [CrossRef] [PubMed] [Green Version]
- Müller, P.L.; Liefers, B.; Treis, T.; Rodrigues, F.G.; Olvera-Barrios, A.; Paul, B.; Dhingra, N.; Lotery, A.; Bailey, C.; Taylor, P.; et al. Reliability of Retinal Pathology Quantification in Age-Related Macular Degeneration: Implications for Clinical Trials and Machine Learning Applications. Transl. Vis. Sci. Technol. 2021, 10, 4. [Google Scholar] [CrossRef] [PubMed]
- Tan, C.S.; Chan, J.C.; Cheong, K.X.; Ngo, W.K.; Sadda, S.R. Comparison of Retinal Thicknesses Measured Using Swept-Source and Spectral-Domain Optical Coherence Tomography Devices. Ophthalmic Surg. Lasers Imaging Retina 2015, 46, 172–179. [Google Scholar] [CrossRef]
- Ciurică, S.; Lopez-Sublet, M.; Loeys, B.L.; Radhouani, I.; Natarajan, N.; Vikkula, M.; Maas, A.H.E.M.; Adlam, D.; Persu, A. Arterial Tortuosity. Hypertension 2019, 73, 951–960. [Google Scholar] [CrossRef]
- Kemp, M. Leonardo’s Philosophical Anatomies. Lancet 2019, 393, 1404–1408. [Google Scholar] [CrossRef]
- Wells, F.C.; Crowe, T. Leonardo Da Vinci as a Paradigm for Modern Clinical Research. J. Thorac. Cardiovasc. Surg. 2004, 127, 929–944. [Google Scholar] [CrossRef] [PubMed] [Green Version]
- Del Corso, L.; Moruzzo, D.; Conte, B.; Agelli, M.; Romanelli, A.M.; Pastine, F.; Protti, M.; Pentimone, F.; Baggiani, G. Tortuosity, Kinking, and Coiling of the Carotid Artery: Expression of Atherosclerosis or Aging? Angiology 1998, 49, 361–371. [Google Scholar] [CrossRef]
- Hiroki, M.; Miyashita, K.; Oda, M. Tortuosity of the White Matter Medullary Arterioles Is Related to the Severity of Hypertension. Cerebrovasc. Dis. 2002, 13, 242–250. [Google Scholar] [CrossRef]
- Kahe, F.; Sharfaei, S.; Pitliya, A.; Jafarizade, M.; Seifirad, S.; Habibi, S.; Chi, G. Coronary Artery Tortuosity: A Narrative Review. Coron. Artery Dis. 2020, 31, 187–192. [Google Scholar] [CrossRef]
- Owen, C.G.; Newsom, R.S.B.; Rudnicka, A.R.; Barman, S.A.; Woodward, E.G.; Ellis, T.J. Diabetes and the Tortuosity of Vessels of the Bulbar Conjunctiva. Ophthalmology 2008, 115, e27–e32. [Google Scholar] [CrossRef]
- Pancera, P.; Ribul, M.; Presciuttini, B.; Lechi, A. Prevalence of Carotid Artery Kinking in 590 Consecutive Subjects Evaluated by Echocolordoppler. Is There a Correlation with Arterial Hypertension? J. Intern. Med. 2000, 248, 7–12. [Google Scholar] [CrossRef] [PubMed]
- Chua, J.; Sim, R.; Tan, B.; Wong, D.; Yao, X.; Liu, X.; Ting, D.S.W.; Schmidl, D.; Ang, M.; Garhöfer, G.; et al. Optical Coherence Tomography Angiography in Diabetes and Diabetic Retinopathy. J. Clin. Med. 2020, 9, 1723. [Google Scholar] [CrossRef]
- Sasongko, M.B.; Wong, T.Y.; Donaghue, K.C.; Cheung, N.; Jenkins, A.J.; Benitez-Aguirre, P.; Wang, J.J. Retinal Arteriolar Tortuosity Is Associated with Retinopathy and Early Kidney Dysfunction in Type 1 Diabetes. Am. J. Ophthalmol. 2012, 153, 176–183.e1. [Google Scholar] [CrossRef] [PubMed]
- Sasongko, M.B.; Wong, T.Y.; Nguyen, T.T.; Cheung, C.Y.; Shaw, J.E.; Kawasaki, R.; Lamoureux, E.L.; Wang, J.J. Retinal Vessel Tortuosity and Its Relation to Traditional and Novel Vascular Risk Markers in Persons with Diabetes. Curr. Eye Res. 2016, 41, 551–557. [Google Scholar] [CrossRef] [PubMed]
- Lajmi, H.; Hmaied, W.; Othmen, A.; Chelly, Z.; El Fekih, L. Optical Coherence Tomography Angiography Microvascular Changes in Diabetics without Diabetic Retinopathy. Saudi J. Ophthalmol. 2020, 34, 156. [Google Scholar] [CrossRef]
- Pierro, L.; Arrigo, A.; De Crescenzo, M.; Aragona, E.; Chiesa, R.; Castellano, R.; Catenaccio, B.; Bandello, F. Quantitative Optical Coherence Tomography Angiography Detects Retinal Perfusion Changes in Carotid Artery Stenosis. Front. Neurosci. 2021, 15, 640666. [Google Scholar] [CrossRef]
- O’Neill, R.A.; Maxwell, A.P.; Paterson, E.N.; Kee, F.; Young, I.; Hogg, R.E.; Cruise, S.; Murphy, S.; McGuinness, B.; McKay, G.J. Retinal Microvascular Parameters Are Not Significantly Associated with Mild Cognitive Impairment in the Northern Ireland Cohort for the Longitudinal Study of Ageing. BMC Neurol. 2021, 21, 112. [Google Scholar] [CrossRef] [PubMed]
- Cheung, C.Y.-L.; Ong, Y.T.; Ikram, M.K.; Ong, S.Y.; Li, X.; Hilal, S.; Catindig, J.-A.S.; Venketasubramanian, N.; Yap, P.; Seow, D.; et al. Microvascular Network Alterations in the Retina of Patients with Alzheimer’s Disease. Alzheimers Dement. 2014, 10, 135–142. [Google Scholar] [CrossRef]
- Liew, G.; Mitchell, P.; Wong, T.Y.; Lindley, R.I.; Cheung, N.; Kaushik, S.; Wang, J.J. Retinal Microvascular Signs and Cognitive Impairment. J. Am. Geriatr. Soc. 2009, 57, 1892–1896. [Google Scholar] [CrossRef]
- Allon, R.; Aronov, M.; Belkin, M.; Maor, E.; Shechter, M.; Fabian, I.D. Retinal Microvascular Signs as Screening and Prognostic Factors for Cardiac Disease: A Systematic Review of Current Evidence. Am. J. Med. 2021, 134, 36–47.e7. [Google Scholar] [CrossRef]
- Cheung, C.Y.-L.; Zheng, Y.; Hsu, W.; Lee, M.L.; Lau, Q.P.; Mitchell, P.; Wang, J.J.; Klein, R.; Wong, T.Y. Retinal Vascular Tortuosity, Blood Pressure, and Cardiovascular Risk Factors. Ophthalmology 2011, 118, 812–818. [Google Scholar] [CrossRef]
- Rosenblatt, T.R.; Ji, M.H.; Vail, D.; Ludwig, C.A.; Al-Moujahed, A.; Pasricha, M.V.; Callaway, N.F.; Kumm, J.; Moshfeghi, D.M. Key Factors in a Rigorous Longitudinal Image-Based Assessment of Retinopathy of Prematurity. Sci. Rep. 2021, 11, 5369. [Google Scholar] [CrossRef] [PubMed]
- Abbinante, G.; Plaitano, C.; Gallo, F.G.; Magli, A. A Case of Retinal Vascular Involvement in a 6-Year-Old Patient with COVID-19. Eur. J. Ophthalmol. 2021. [Google Scholar] [CrossRef] [PubMed]
- Sim, R.; Cheung, G.; Ting, D.; Wong, E.; Wong, T.Y.; Yeo, I.; Wong, C.W. Retinal Microvascular Signs in COVID-19. Br. J. Ophthalmol. 2021. [Google Scholar] [CrossRef] [PubMed]
- Abdalla, M.; Hunter, A.; Al-Diri, B. Quantifying Retinal Blood Vessels’ Tortuosity—Review. In Proceedings of the IEEE 2015 Science and Information Conference (SAI), London, UK, 28–30 July 2015; pp. 687–693. [Google Scholar]
- Kalitzeos, A.A.; Lip, G.Y.H.; Heitmar, R. Retinal Vessel Tortuosity Measures and Their Applications. Exp. Eye Res. 2013, 106, 40–46. [Google Scholar] [CrossRef] [PubMed]
- Kipli, K.; Hoque, M.E.; Lim, L.T.; Mahmood, M.H.; Sahari, S.K.; Sapawi, R.; Rajaee, N.; Joseph, A. A Review on the Extraction of Quantitative Retinal Microvascular Image Feature. Comput. Math. Methods Med. 2018, 2018, 4019538. [Google Scholar] [CrossRef] [Green Version]
- Fawzi, A.A. Consensus on Optical Coherence Tomographic Angiography Nomenclature: Do We Need to Develop and Learn a New Language? JAMA Ophthalmol. 2017, 135, 377–378. [Google Scholar] [CrossRef] [PubMed] [Green Version]
- Lee, H.; Lee, M.; Chung, H.; Kim, H.C. Quantification of Retinal Vessel Tortuosity in Diabetic Retinopathy Using Optical Coherence Tomography Angiography. Retina 2018, 38, 976–985. [Google Scholar] [CrossRef]
- Ma, Y.; Hao, H.; Xie, J.; Fu, H.; Zhang, J.; Yang, J.; Wang, Z.; Liu, J.; Zheng, Y.; Zhao, Y. ROSE: A Retinal OCT-Angiography Vessel Segmentation Dataset and New Model. IEEE Trans. Med. Imaging 2021, 40, 928–939. [Google Scholar] [CrossRef]
- Arganda-Carreras, I.; Kaynig, V.; Rueden, C.; Eliceiri, K.W.; Schindelin, J.; Cardona, A.; Sebastian Seung, H. Trainable Weka Segmentation: A Machine Learning Tool for Microscopy Pixel Classification. Bioinformatics 2017, 33, 2424–2426. [Google Scholar] [CrossRef] [PubMed]
- Goselink, R.J.M.; Schreur, V.; van Kernebeek, C.R.; Padberg, G.W.; van der Maarel, S.M.; van Engelen, B.G.M.; Erasmus, C.E.; Theelen, T. Ophthalmological Findings in Facioscapulohumeral Dystrophy. Brain Commun. 2019, 1, fcz023. [Google Scholar] [CrossRef] [PubMed] [Green Version]
- Minnella, A.M.; Barbano, L.; Verrecchia, E.; Martelli, F.; Pagliei, V.; Gambini, G.; Placidi, G.; Falsini, B.; Caporossi, A.; Manna, R. Macular Impairment in Fabry Disease: A Morpho-Functional Assessment by Swept-Source OCT Angiography and Focal Electroretinography. Invest. Ophthalmol. Vis. Sci. 2019, 60, 2667–2675. [Google Scholar] [CrossRef] [Green Version]
- Savastano, M.C.; Gambini, G.; Cozzupoli, G.M.; Crincoli, E.; Savastano, A.; De Vico, U.; Culiersi, C.; Falsini, B.; Martelli, F.; Minnella, A.M.; et al. Retinal Capillary Involvement in Early Post-COVID-19 Patients: A Healthy Controlled Study. Graefes Arch. Clin. Exp. Ophthalmol. 2021, 259, 2157–2169. [Google Scholar] [CrossRef]
- Ridler, T.W.; Calvard, S. Picture Thresholding Using an Iterative Selection Method. IEEE Trans. Syst. Man Cybern. 1978, 8, 630–632. [Google Scholar] [CrossRef]
- Otsu, N. A Threshold Selection Method from Gray-Level Histograms. IEEE Trans. Syst. Man Cybern. 1979, 9, 62–66. [Google Scholar] [CrossRef] [Green Version]
- Chan, T.F.; Vese, L.A. Active Contours without Edges. IEEE Trans. Image Process. Publ. IEEE Signal Process. Soc. 2001, 10, 266–277. [Google Scholar] [CrossRef] [PubMed] [Green Version]
- Arganda-Carreras, I.; Fernández-González, R.; Muñoz-Barrutia, A.; Ortiz-De-Solorzano, C. 3D Reconstruction of Histological Sections: Application to Mammary Gland Tissue. Microsc. Res. Tech. 2010, 73, 1019–1029. [Google Scholar] [CrossRef] [PubMed]
- Lu, Y.; Wang, J.C.; Zeng, R.; Katz, R.; Vavvas, D.G.; Miller, J.W.; Miller, J.B. Quantitative Comparison of Microvascular Metrics on Three Optical Coherence Tomography Angiography Devices in Chorioretinal Disease. Clin. Ophthalmol. 2019, 13, 2063–2069. [Google Scholar] [CrossRef] [PubMed] [Green Version]
- Matlab. Version 7.10.0 (R2010a); The MathWorks Inc.: Natick, MA, USA, 2010. [Google Scholar]
- Sage, D.; Prodanov, D.; Tinevez, J.-Y.; Schindelin, J. MIJ: Making Interoperability Between ImageJ and Matlab Possible. In Proceedings of the ImageJ User & Developer Conference (IUDC’12); Mondorf-les-Bains, Grand Duchy of Luxembourg, 24–26 October 2012. [Google Scholar]
- Zhou, K.; Song, S.; Legocki, A.; Cheng, Y.; Ding, L.; Rezaei, K.A.; Wang, R.K.; Cabrera, M.T. Quantitative Handheld Swept-Source Optical Coherence Tomography Angiography in Awake Preterm and Full-Term Infants. Transl. Vis. Sci. Technol. 2020, 9, 19. [Google Scholar] [CrossRef] [PubMed]
- Poplawsky, A.J.; Fukuda, M.; Kang, B.-M.; Kim, J.H.; Suh, M.; Kim, S.-G. Dominance of Layer-Specific Microvessel Dilation in Contrast-Enhanced High-Resolution FMRI: Comparison between Hemodynamic Spread and Vascular Architecture with CLARITY. Neuroimage 2019, 197, 657–667. [Google Scholar] [CrossRef] [PubMed]
Figure 1.
(Left): ‘N’ OCT scan; (Right): ‘T’ OCT scan; from top to bottom: (Panel A): original image; (Panel B): binarized image (Method A); (Panel C): skeletonized image.
Figure 1.
(Left): ‘N’ OCT scan; (Right): ‘T’ OCT scan; from top to bottom: (Panel A): original image; (Panel B): binarized image (Method A); (Panel C): skeletonized image.

Figure 2.
Branch length distribution, Method A, for normal (N, left) and tortuous (T, right) retinal OCTA.
Figure 2.
Branch length distribution, Method A, for normal (N, left) and tortuous (T, right) retinal OCTA.

Figure 3.
Result from the Fiji’s skeleton analysis process. Vessel branches are drawn in orange, separated by green junctions and terminated by blue end points.
Figure 3.
Result from the Fiji’s skeleton analysis process. Vessel branches are drawn in orange, separated by green junctions and terminated by blue end points.

Figure 4.
At each abscissa, the two curves represent the values of TI calculated excluding branches shorter than Min Branch length (blue), and the number of branches included in the computation (red). TI dependence on branch lengths appears to behave similarly in N—Normal and T—Tortuous cases, for the different Methods (A and B shown). Min branch lengths are expressed in pixels.


Figure 5.
The proposed index TI*CV (dashed line) compared to the conventional TI (solid line). T (tortuous) retinal indexes are plotted in red, N indexes in blue.
Figure 5.
The proposed index TI*CV (dashed line) compared to the conventional TI (solid line). T (tortuous) retinal indexes are plotted in red, N indexes in blue.


Table 1.
Tortuosity indexes and branch-related features of the two exemplificative OCT images, calculated by means of the four investigated methods.
Table 1.
Tortuosity indexes and branch-related features of the two exemplificative OCT images, calculated by means of the four investigated methods.
| Method A | Method B | Method C | Method D | |||||
|---|---|---|---|---|---|---|---|---|
| N | T | N | T | N | T | N | T | |
| TI | 1.151 | 1.146 * | 1.169 | 1.177 | 1.174 | 1.179 | 1.187 | 1.167 * |
| TI_avg | 1.139 | 1.129 * | 1.146 | 1.146 | 1.133 | 1.135 | 1.168 | 1.162 * |
| TI*CV | 0.98 | 1.04 | 0.89 | 0.97 | 1.19 | 1.21 | 0.94 | 1.02 |
| # branches | 2874 | 2117 | 2526 | 2441 | 4235 | 3953 | 3269 | 1641 |
| Mean BL | 9.15 ± 7.83 | 8.81 ± 8.02 | 12.97 ± 9.89 | 13.28 ± 10.96 | 6.58 ± 6.69 | 6.56 ± 6.76 | 7.89 ± 6.24 | 8.49 ± 7.41 |
| Max BL | 79.36 | 86.46 | 108.05 | 135.74 | 81.04 | 76.33 | 80.18 | 59.36 |
| Min BL | 1 | 1 | 1 | 1 | 1 | 1 | 1 | 1 |
| Mean ED | 7.95 ± 6.79 | 7.69 ± 7.01 | 11.1 ± 8.34 | 11.28 ± 9.18 | 5.61 ± 5.7 | 5.56 ± 5.69 | 6.65 ± 5.37 | 7.27 ± 6.49 |
| Max ED | 72.24 | 78.10 | 89.40 | 89.94 | 65.37 | 69.53 | 72.24 | 54.20 |
| Min ED | 0 | 0 | 0 | 0 | 0 | 0 | 0 | 0 |
| # ED = 0 | 14 | 14 | 75 | 111 | 60 | 70 | 61 | 16 |
| BL < 10 | 68.16% | 68.73% | 47.23% | 48.22% | 80.85% | 80.75% | 75.13% | 72.64% |
| BL < 21 | 92.59% | 93.06% | 84.52% | 83.08% | 95.96% | 95.70% | 95.87% | 93.78% |
| BL = 1 | 3.97% | 6.57% | 0.48% | 1.11% | 14.88% | 16.27% | 2.84% | 4.57% |
Legend: N: less tortuous retina; T: more tortuous retina; TI: tortuosity index; TI_avg: mean of individual tortuosity indexes (one index for each branch); CV: coefficient of variation of BL; #: “number of”; BL: branch length; ED: Euclidean distance; * lower than the corresponding value for image N; all length measurements are expressed in pixels.
Publisher’s Note: MDPI stays neutral with regard to jurisdictional claims in published maps and institutional affiliations. |
© 2021 by the authors. Licensee MDPI, Basel, Switzerland. This article is an open access article distributed under the terms and conditions of the Creative Commons Attribution (CC BY) license (https://creativecommons.org/licenses/by/4.0/).
Share and Cite
MDPI and ACS Style
Martelli, F.; Giacomozzi, C. Tortuosity Index Calculations in Retinal Images: Some Criticalities Arising from Commonly Used Approaches. Information 2021, 12, 466. https://doi.org/10.3390/info12110466
AMA Style
Martelli F, Giacomozzi C. Tortuosity Index Calculations in Retinal Images: Some Criticalities Arising from Commonly Used Approaches. Information. 2021; 12(11):466. https://doi.org/10.3390/info12110466
Chicago/Turabian StyleMartelli, Francesco, and Claudia Giacomozzi. 2021. "Tortuosity Index Calculations in Retinal Images: Some Criticalities Arising from Commonly Used Approaches" Information 12, no. 11: 466. https://doi.org/10.3390/info12110466
Note that from the first issue of 2016, this journal uses article numbers instead of page numbers. See further details here.