An Application of a Fuzzy TOPSIS Multi-Criteria Decision Analysis Algorithm for Dry Bulk Carrier Selection


1
Department of Computer Science, Norwegian University of Science and Technology, 2802 Gjøvik, Norway
2
Department of Logistics and Maritime Studies, The Hong Kong Polytechnic University, Hong Kong, China
3
Department of Transportation and Logistics, Feng Chia University, Taichung 40724, Taiwan
4
Department of Industrial Engineering, Gazi University, 06500 Ankara, Turkey
*
Author to whom correspondence should be addressed.
Information 2020, 11(5), 251; https://doi.org/10.3390/info11050251
Submission received: 1 April 2020
/
Revised: 24 April 2020
/
Accepted: 1 May 2020
/
Published: 3 May 2020
Abstract
:Decision-making in ship investment is a complex and difficult process with trade-offs. The purpose of this study is to guide the decisions on the purchase of dry bulk carriers based on a Fuzzy Technique for Order Preference by Similarity to Ideal Solution (Fuzzy TOPSIS) multi-criteria decision analysis algorithm. A set of criteria and a set of alternatives based on various characteristics are developed and evaluated with expert questionnaires. The proposed method provides weights for a given criteria to provide ranked alternatives, identifying the optimal solution. The alternatives among the multiple suppliers are ranked in the context of the shipping investment. This study reveals that shipowners are rather acting with a holistic perspective in ship purchase; however, we prove a detailed analysis is required.
1. Introduction
As of 2019, 842,438 (42.6%) vessels of the world fleet are bulk carriers [1]. According to the Organization for Economic Co-operation and Development (OECD), the amount of dry bulk trade (iron ore, coal, grain, etc.) was increased by 241 million tons (3.1%) in 2018, taking it to 3.6 billion tons, which is accounted for over two thirds of the total [2]. As in the dry bulk trade, the maritime transportation business is conducted in a highly competitive environment. One of the most significant reasons for this situation is the diversity of the vessels. There are several dry bulk carrier options varying in tonnage, engine power to crane existence, etc. in the market. A successful investment in a dry bulk carrier is hardly possible without a reliable method. The aim of this paper is to analyze the dry bulk shipping business in a fuzzy environment wherein the goal is to find the best prominent dry bulk carrier considering a set of technical and financial criteria. Fuzzy extended Technique for Order Preference by Similarity to Ideal Solution (Fuzzy TOPSIS) is preferred to handle the multi-criteria, multi decision makers (DMs) and fuzziness of the problem.
Ship investment often requires risk evaluation, since it involves a high amount of capital and resource allocation problems. In [3], the binary choice and nested logit models are used to investigate the ship investment and ship choice behavior in liner shipping. In [4], regression analysis is preferred to identify the main driving forces of ship investment. A literature review is provided on the investment theories based on firm-level and ship investment [5]. In [6], a qualitative perspective is adopted to analyze the ship investment issues in Turkey. The study includes investment timing, market conditions, period for payback, financial and technical characteristics of ships, risk profiles of the investors, etc. Using the ship leasing investment as a case, an advanced portfolio analysis is proposed for determining the optimal ship mix [7].
It is generally assumed that ships are essentially homogeneous, and the ship price depends on ship parameters. In this context, hedonic pricing models are widely used in ship financing [8]. This assumption is reasonable when a large number of ships are considered. We argue that decisions on a small number of ships should consider a set of parameters, (i.e., technical, operational, financial), where the trade-offs between parameters are possible. Decision makers need to determine each ship parameter but are quite often faced with uncertainty in terms of different categories of ship parameters. The fuzzy manner is capable of fulfilling these evaluation difficulties by accommodating several categories of parameters. This research is among the earliest efforts to provide a robust model for ship selection based on different categories of parameters in fuzzy manner. Thus, our study provides a robust examination of ship choice under the presence of different parameters bearing various preferences. In this way, our research provides support for and a partial extension of the multi-criteria decision analysis (MCDA).
The paper is organized as follows. In Section 2, a literature review is provided. Section 3 describes a fuzzy TOPSIS method for analyzing the dry bulk carrier selection process. Section 4 explains the application and the results step by step. Section 5 presents the implications and discussions. Finally, Section 6 concludes the paper.
2. Literature Review
In the literature, the conventional discounted cash flow approaches to ship investment are most likely to be one-sided considering only the financial perspective. The net present value and the internal return rate are the most common tools for the discounted cash flow approach used in analyzing the projects [9]. However, these tools are limited in analyzing the alternative projects, since they are based on several assumptions, subjective preferences, and future estimations [10].
MCDA methods are highly preferred in the literature. For instance, in [11], the studies on green supplier evaluations are reviewed. Vendor selection phenomena are studied by [12]. Some of the studies deal with the sector oriented problems, and others deal with the methodological or structural improvements. For example, in [13], a novel model for supply chain agility is provided.
Fuzzy TOPSIS analysis methodologies are widely used in various fields in different countries [14]. They provide solutions for complicated decision analysis problems [15]. It has been used in numerous areas and academic disciplines for decades [16]. In [17], Python codings for the application of the TOPSIS method are provided. In the literature, there exist several MCDA comparison studies such as [18]. Some studies compare different versions of a method, and others focus on comparing different methods. The results may differ depending on the type of the problem, the scale used, and the methods they contain. In [19], it is shown that TOPSIS is more suitable for their intended problem. In [20], it stated that TOPSIS method is better than the analytical hierarchy process (AHP) method, which is one of the most used methods in the literature. In [21], the MCDA methods are compared, and it is found that TOPSIS gives better results. In the maritime industry, using three Taiwan container shipping companies as a case, Fuzzy TOPSIS is used to evaluate the financial performance (including financial structure, solvency, turnover, and profitability) in order to reduce the burden of high bunker prices [22]. In [23], TOPSIS and fuzzy axiomatic design for the Turkish container ports are combined to evaluate competitive strategies. In [24], a fuzzy delphi TOPSIS approach is adopted to analyze how to select the optimal bunkering ports for liner shipping companies. Port operations often have many risks in their processes such as loading, handling, and unloading. In order to understand strategic position and geographic advantage of the container ports of Turkey, intuitionistic fuzzy TOPSIS is adopted. It is used to evaluate the risk analysis (including crane, vessel stress, vessel performance, loading/unloading, personnel, and weather) of ports in maritime industry in terms of failure mode and effect analysis [25]. From the perspective of cargo operations, a ship loader is adopted as a case to analyze decision-making problems in maritime business and transport industry based on an interval type-2 fuzzy AHP and TOPSIS method [26]. Big data analytics has become one of the important topic in the maritime industry. In order to understand the challenges of adopting new technology, fuzzy delphi-AHP-TOPSIS methodology is proposed. It is used to determine the obstacles in big data analytics adoption in the maritime initiatives in Singapore [27]. Regarding other research fields, fuzzy TOPSIS is used to evaluate the sustainable acid rain control option (economic, environmental, institutional, social, technical) in the Niger delta of Nigeria [28]. Fuzzy TOPSIS is used to analyze the drivers (environmental, society, economic) of the green manufacturing practice [29].
Ship purchase by using multi criteria decision analysis methods is studied by limited scholars under different approaches. For instance, a model of shipping asset management process is proposed and a generic fuzzy AHP is implemented in [30]. A similar ship investment problem is re-considered in [31] by running another version of AHP called regime-switching AHP. The evaluation parameters for the shipping asset selection are preferred as loss probability, return on equity, energy consumption, draft, speed, and crane existence. This study extends the existing criteria with more comprehensive parameters. The number of alternatives and DMs are also relatively increased. A study comparing AHP and TOPSIS methods in a fuzzy environment. In [32], it is stated that a fuzzy TOPSIS method is better suited for the selection problems in terms of agility and changing and varying criteria and alternatives. Therefore, Fuzzy TOPSIS is preferred for our empirical study of ship selection management. Another research regarding the ship selection uses a multiple-criteria synthesis approach in [33]. In their study, a tanker selection problem is considered in terms of techno-economical and qualitative attributes. This paper points out to the dry bulk carrier selection problem with the viewpoint of subjective judgements of DMs, and that is investigated by using a fuzzy TOPSIS approach.
This study tackles a literature gap by analyzing ship investment decisions using a TOPSIS method in a fuzzy environment. It innovates in this context not only by applying fuzzy TOPSIS method for a ship purchase decision, but also by adopting financial, technical, operational, etc. parameters to evaluate different criteria on this highly complex decision-making problem. More precisely, this paper contributes to the field as follows. First, the study assesses the evaluation of both technical and financial criteria in ship purchase problems, thus adding to the scarce literature on ship purchase. Secondly, this study uses a fuzzy TOPSIS technique to compare the criteria based on trapezoidal fuzzy numbers (TFN), allowing the assessment of vagueness in ship quality perceived by the buyer. Indeed, nonstandard design of dry bulk carriers may assume uncertainty. More precisely, the varying specifications of dry bulk carriers, which may involve ship hull form and general arrangement, lead vagueness in ship quality, and uncertainty related to ship purchase decisions. On the other hand, the ship price, which is not fixed, varies in a dynamic fashion as a function of the market demand or other market variables that cannot be timely measured. Even the ship quality may be subject to vagueness in the perceptions of buyer due to the low number of ship sale-and-purchase. Thirdly, this study also expands the existing literature in terms of the use of fuzzy TOPSIS and different rule-based frameworks to guide ship purchase decision-making because fuzzy parameters can help with achieving higher levels of objectiveness on perceiving the ship quality.
3. Method
TOPSIS is based on an index of similarity or closeness to the ideal solution and longest distance from the negative-ideal solution [34]. TOPSIS is introduced by Chen and Hwang by referring the studies of [35,36,37]. The TOPSIS method compares the alternatives by the weights identified for all criteria, then normalizes the scores and calculates the geometric distance to the ideal and the negative-ideal solution. The alternative solution with the maximum similarity to the ideal solution is chosen.
The purpose of this study is to investigate the best prominent dry bulk carrier considering several parameters. Dry bulk carrier selection is a complex decision-making problem needing attention because of its nature of subjectivity, vagueness, uncertainty, and a high number of criteria. Therefore, a model which converts the linguistic variables into trapezoidal fuzzy expressions is built for evaluating the criteria and ranking the alternatives to find the priority weights. The TOPSIS approach is selected due to four reasons:
- Background and mentality are logical, understandable, and reasonable.
- Calculation process is simple and easy.
- The algorithm provides an opportunity of a simple mathematical form to follow the alternatives for each criterion.
- Comparison algorithm deals with the priority weights [38].
TOPSIS and fuzzy TOPSIS methods are commonly used in various studies in the literature [39,40,41,42]. For instance, [43] implemented a fuzzy TOPSIS method for the problem of robot selection. A decision support system for a quick prototyping is proposed by the fuzzy TOPSIS method [44]. Accordingly, a study is proposed explaining the fuzzy TOPSIS method or group decision-making applications [45]. Furthermore, there exist many studies for ranking [46,47,48].
3.1. Fuzzy Logic and Decision-Making
Human beings always need to make decisions. If the DMs use a classic scientific approach and the classic methods, such decisions will be good-bad, beautiful-ugly, yes-no, white-black or 0–1. However, the real life does not stand on such absolute separations. In other words, there always exist thousands of gray colors between white and black. At that point, scholars focus on how the vagueness are foreseen and embedded into the decision-making process. Fuzzy logic is one of these scientific approaches [49]. Fuzzy logic theory provides flexibility to categorize the factors and criteria without definite limitations. Fuzzy Logic is a robust technique to determine and solve complex, uncertain and vague real life problems. It allows DMs to use middle values such as ‘middle’, ‘high’, and ‘low’ rather than classical variables as ‘yes’, ‘no’, ‘true’, or ‘wrong’. The main differences between classic logic and fuzzy logic are given in Table 1.
In classic logic, an element is either A or not A; in fuzzy logic, it might be A and not A simultaneously. In classic logic, it is certain that an element either is in a set or not. However, in fuzzy logic, an element might be partially inside the set or partially outside the set. Some important definitions are provided below [38,50].
3.2. Fuzzy Sets and Membership Function
Fuzzy sets are expressed as membership functions where a membership function of a fuzzy set is shown as , and defined as a number between 0 and 1. If an element x definitely belongs to the set A, . If an element x definitely does not belong to set A, . The value for high membership degree represents that x has a high degree of membership of A.
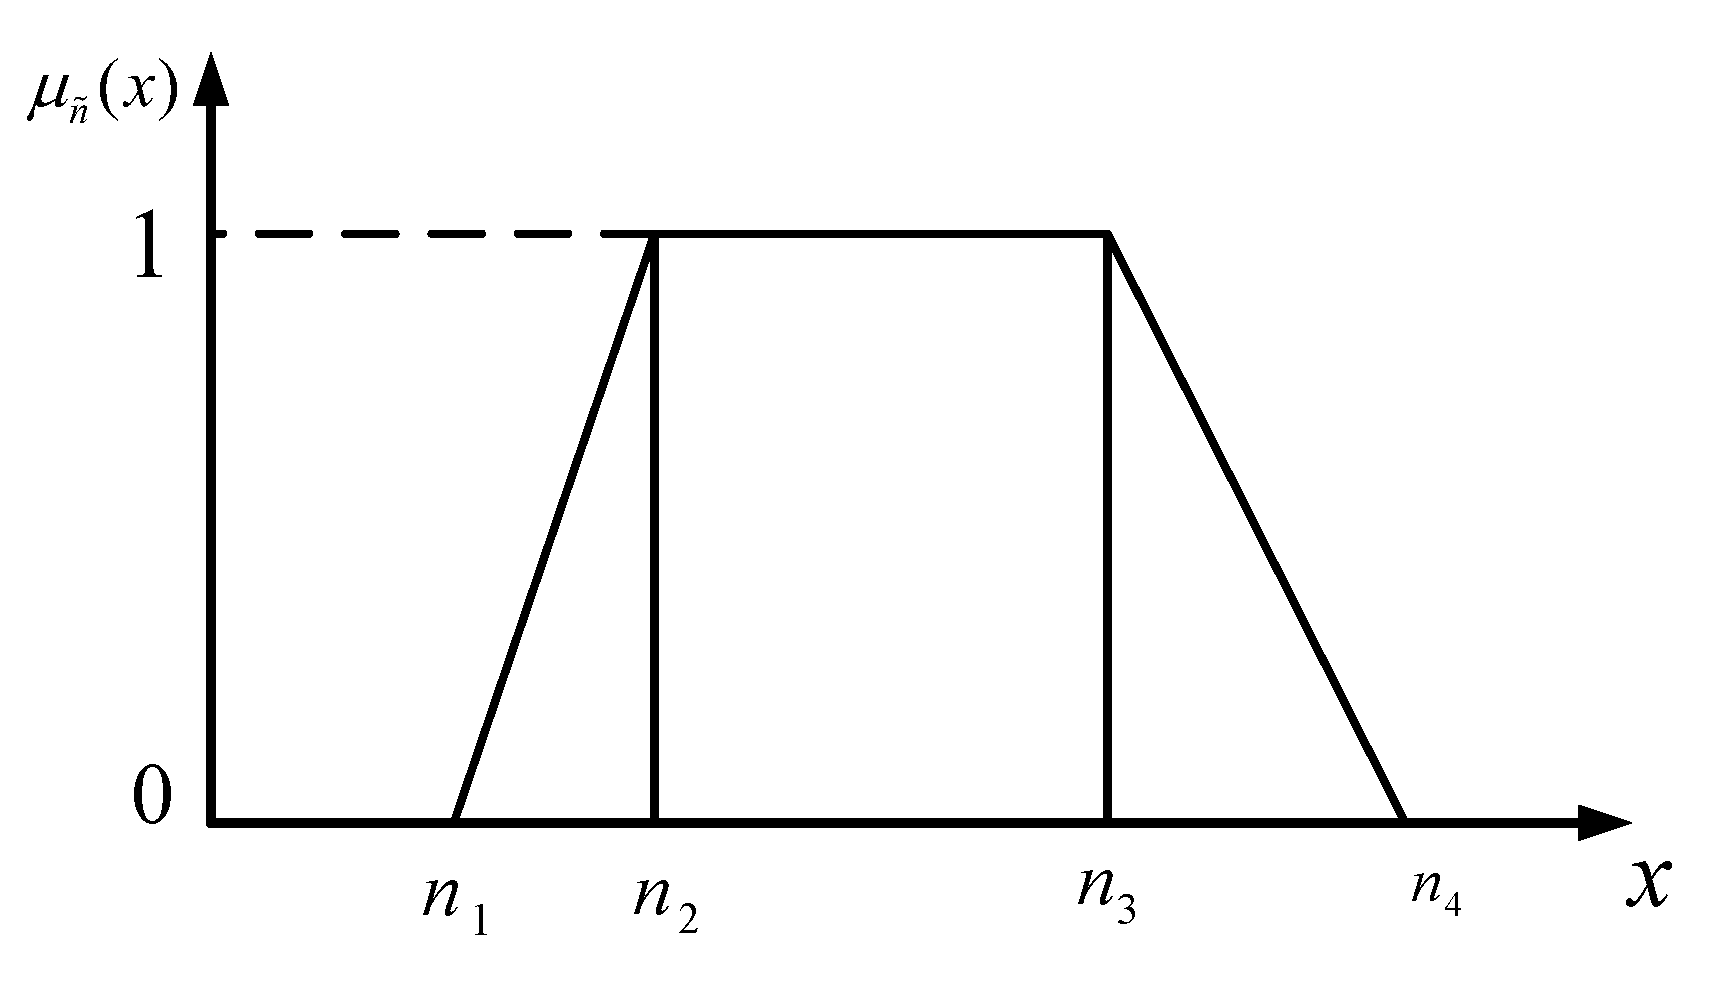
These membership degrees are continuous for fuzzy numbers. Various membership functions can be defined, but, in practice, some particular practical and easy to use membership functions are preferred. One of these membership functions is used for TFNs (Figure 1), where the membership function of a trapezoid fuzzy number is defined as provided in Equation (1) [50]:
3.3. Fuzzy Numbers and Fuzzy Operations
Fuzzy numbers are used in fuzzy sets because of easy operations. A tilde symbolizes the fuzzy number. Linguistic expressions are transformed into quantitative values by assigning membership functions of positive triangular or trapezoid fuzzy numbers.
3.4. Vertex Method
The distance of positive ideal and negative ideal is conducted for ranking the options. Vertex method is applied as follows [50]:
where and are two positive trapezoidal numbers.
The selection process of MCDA problems are conducted by field experts. The following elements are required for MCDA problems [50]: DMs (), alternatives (), set of decision criteria for each alternative (), and a set of criteria values based on the decision criteria for each alternative. Linguistic expressions for priorities of each criterion and linguistic expressions for ratings are given in Table 2 and Table 3.
The judgment of k DMs on m alternatives and priority weights of n criteria are given as and where
Fuzzy criteria values derived from expert judgments of ship selection based on [2] indicators are shown as where
Priority weights of decision criteria are , where
The decision problem in the matrix form is shown below:
where and are two fuzzy numbers, is fuzzy decision matrix, and is a fuzzy weight matrix.
Decision criteria can be separated as cost and benefit. Therefore, a normalized fuzzy decision matrix is obtained as . Here, B and C symbolize the benefit and cost criteria, respectively:
The weighted normalized fuzzy decision matrix is needed, since each decision criterion might have different priority weights. This matrix is constructed as:
Here, Fuzzy Positive Ideal Solution (FPIS, ) and Fuzzy Negative Ideal Solution (FNIS, ) are expressed as:
Let and ,
as a distance between two fuzzy numbers, by the help of vertex method the distances for FPIS and FNIS for each country are calculated as:
After finding the distances, in order to compare the dry bulk carriers, closeness coefficient is calculated as:
where . Dry bulk carriers are ranked from high to low weights. Then, we can test different values of alpha (0 to 1) and compare the rankings with different values of alpha of the final assessment.
In the light of given information, the TOPSIS method is applied by considering each step of [51]:
- A normalized decision matrix is calculated.
- A weighted decision matrix is calculated.
- Positive ideal and negative ideal distances for each alternative are calculated.
- Closeness coefficient values and levels are calculated.
- Preferences are ranked.
4. Results
Seaborne transportation is of significance in terms of global economics since 90% of the world trade is conducted by merchant ships. Steel is a crucial industrial product of the world. All the materials related to steel are transported via dry bulk carriers. The factors for ship supply/demand in shipping economy are determined in the study of [52]. In practice, since the balance of ship supply is obtained by the combination of freight, sale, and purchase, new building, and demolition markets; ship demand is directly affected from world economy, cargo trade via maritime transportation, average carriage distance, political events, and transportation costs. More specifically, this study provides the financial and technical parameters as their particulars are given below.
Gross tonnage is described as a measure of an overall internal volume of a ship, and deadweight (t) represents the carriage capacity of the ship including cargoes, fuel oil, stores, etc. [53]. Length overall symbolizes the maximum length of a ship’s hull, and breadth extreme is the maximum width (beam) measured parallel to the waterline. Draught is the vertical distance from the waterline and to the bottom of the hull (keel) [54,55].
In the sale and purchase market, when the ship launch is compiled, it becomes secondhand. Then, from its beginning (the most precious moment), the ship continuously loses her value 3–5% each year. One of the most significant factors in the market is the age of the ship. The younger ship deserves more chartering and freight rate, since the younger ships can easily pass the inspection, verify the competencies, and comply with the requirements during the port state controls. Moreover, younger ships provide an advantage of paying no extra insurance premiums. The ship prices are under the effect of four factors: freight rates, particulars of the ship, inflation rates, and expectations of the ship owners. However, since the values are related to income, market conditions might change the correlations between the ship value and other parameters such as tonnage, age, etc. Return on investment depicts the efficiency of the investment [56]. Loss probability is the percentage of results which give a deficit account [10].
Energy consumption is an important subjective parameter, and it is recorded as an operational cost. Larger ships are generally more cost efficient than smaller ships. Engine power is the maximum power of the ship, which depends on the size and design of the engine. The speed of the ship represents the operation time of the ship. The last criterion is about the existence of the shipping assets (i.e., crane) and their conditions. Experienced field experts are asked to evaluate the most prior criterion among six independent criteria and alternatives based on ship supply and demand in the shipping economy. Six dry bulk carriers in different tonnage capacities and service capabilities are selected as alternative projects of the dry bulk shipping industry. Tonnage sizes are classified as Handysize: 10,000–39,999 deadweight tonnage (Dwt), Handymax (Supramax): 40,000–59,999 Dwt, Panamax bulker: 60,000–85,000 Dwt, and Capesize bulker is around 85,000–180,000 Dwt [52].
The empirical study is designed based on the statistical datasets given in the United Nations Conference on Trade and Development (UNCTAD) (2019). The weekly reports for the market indices (seaborne trade, ship prices, etc.) of [2] are presented to the experts in order to make a confidential pairwise comparisons.
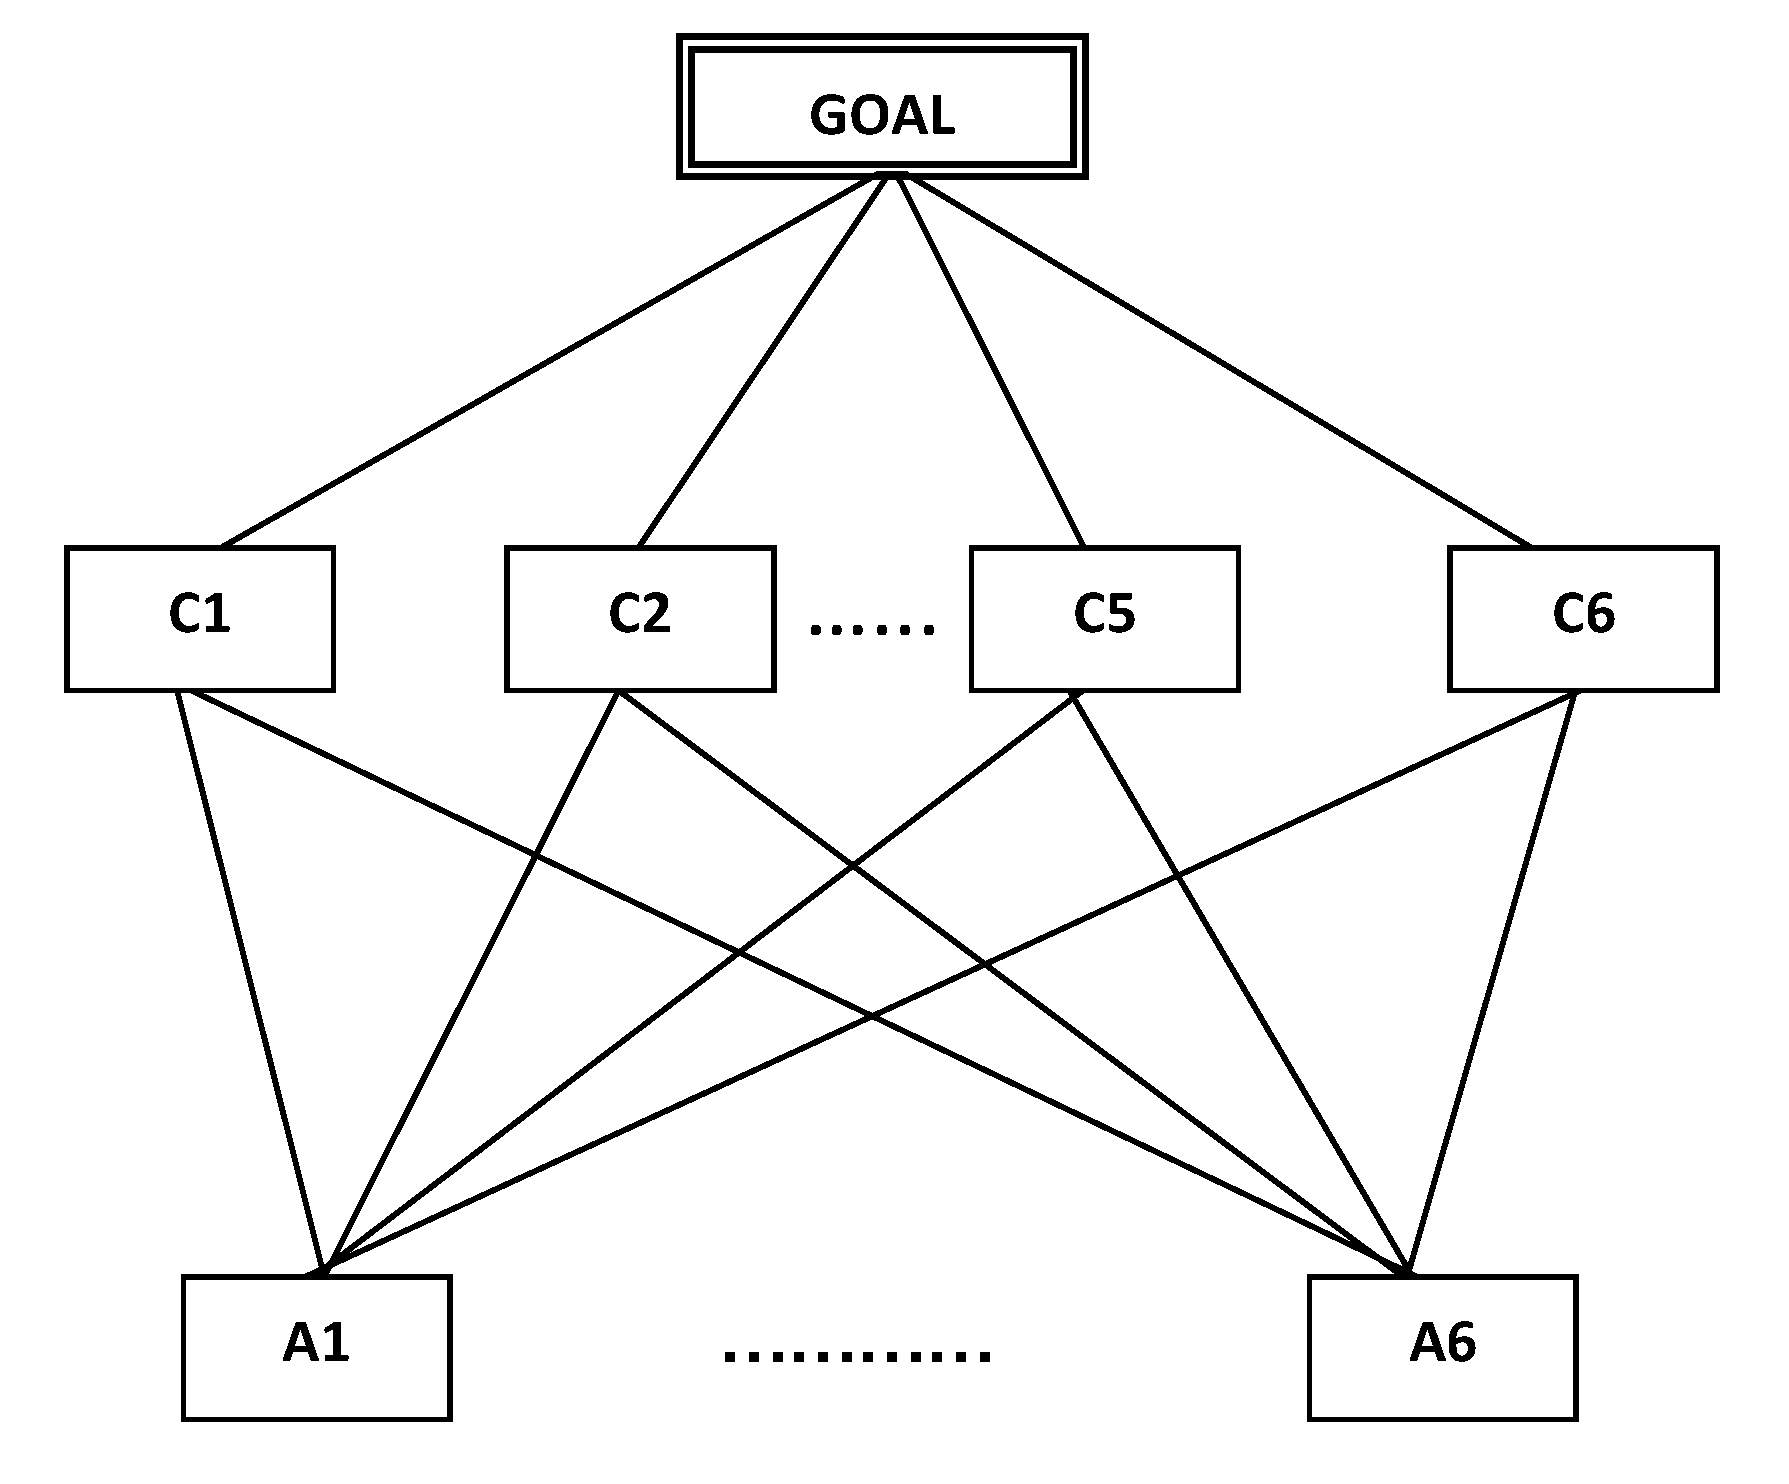
For comparison of dry bulk carriers, we prefer to select six dry bulk carriers from to . These anonymous experts are the academicians in top maritime departments and hold doctorate degrees. Five independent experts consider the following six criteria form to based on given circumstances in Table 4.
The hierarchical structure is shown in Figure 2. According to this structure, the steps of the method are provided as follows:
Step 1. The criteria are evaluated from Very Low (VL) to Very High (VH) by using verbal expressions as given in Table 5.
Step 2. DMs evaluate each alternative based on each criterion as shown in Table 6.
Step 3. The linguistic expressions in the evaluation process are converted into TFN by using Equation (10). A fuzzy decision matrix is obtained as given in Table 7.
Step 4.Table 8 expresses the fuzzy weights matrix which is obtained by using Equation (12).
Step 5. By using Equation (15), the normalized fuzzy decision matrix is acquired as in Table 9.
Step 6.Table 10 is derived from the weighted normalized fuzzy decision matrix, normalized fuzzy decision matrix, and fuzzy weights matrix by using Equations (17) and (18).
Step 7. FPIS and FNIS are found by using the weighted normalized fuzzy decision matrix as shown below:
FPIS : = [(1,1,1,1), (0.3,0.3,0.3,0.3), (0.56,0.56,0.56,0.56), (1,1,1,1), (0.6,0.6,0.6,0.6), (1,1,1,1)]
FNIS : = [(0.05,0.05,0.05,0.05), (0,0,0,0), (0,0,0,0), (0,0,0,0), (0,0,0,0), (0,0,0,0)]
Step 8. The distances from FPIS and FNIS of each alternative are calculated by Equations (21) and (22). The results are obtained as given in Table 11 and Table 12.
Step 9. Closeness coefficients for each dry bulk carriers are calculated by Equation (23). The dry bulk carriers are ranked from low to high values based on these coefficients. According to this ranking, A2 (Dry bulk carrier 2) is the best option, and A5 (Dry bulk carrier 5) is the last one.
5. Implications
One of the practical implications of this study is that one can discern the best performing ship and trace a course of action to learn from its practices. This overall picture (Table 13) suggests that, although ship valuation analysis is often benchmarked with respect to ship price per deadweight tonnage, it fell short when addressing other linguistic expressions on ship quality. As shown in Table 14, Ship A4 gives the highest ship value per deadweight tonnage. However, Ship A4 is ranked as the fifth by our method because the poor conditions of ship hatch cover significantly reduce the efficiency of ship operation. This may explain why higher value of the ship price per deadweight tonnage does not imply higher efficiency level of the dry bulk carriers. The deadweight tonnage presents the ship carrying capacity, but it is one of the indicators on the overall picture of ship quality. Specifically, in this study, the complexity, vagueness, and uncertainty are represented by using fuzzy framework.
To assess the impact of positive and negative ideas on the fuzzy scores, we can compare the ranking shown in Table 11, Table 12 and Table 13. It appears that the final ranking according to CC is similar to the ranking according to FNIS. In terms of FPIS, Ship A2 is ranked as the sixth and Ship A5 as the first (Table 11). In terms of FNIS, Ship A2 is ranked as the first and Ship A5 as the fifth (Table 12). In terms of CC, Ship A2 is ranked as the first and Ship A5 as the sixth (Table 13). As shown in Equation (23), the resultant is ranked more relying on FNIS. This implies, as expected, that a ship is ranked higher when fewer negative ideas are commented on the ship. A lower rank naturally implies, as expected, that more negative ideas are associated. This is because ship buyers are extremely conservative and cautious about the ship quality. One possible explanation for our results relates to the very nature of the dry bulk carriers. Further analysis, however, is necessary to access the impacts of such linguistic variables on ship decision related to the fuzziness.
Practically, this paper synthesized dry bulk experts’ opinions to prioritize key criteria and alternatives based on an empirical study. The proposed framework and methodology can be used for helping shipping carriers (including bulk and liner shipping) solve ship purchases or other similar problems (e.g., ship rental). Using the dry bulk purchase problem as a case, this paper has improved the traditional TOPSIS method solving complex decision-making problems through introducing Fuzz set theory in our proposed research model. Since there is a lack of empirical studies in the purchase of dry bulk ships, this paper fills a gap by providing a systematic analysis process.
6. Conclusions
This study deals with the purchase of dry bulk carriers under multiple options for the shipping industry. Although the criteria and particulars of the alternatives are described in the study, the empirical study is limited with some predefined parameters. However, the ship purchase process in the shipping industry is much more complex, vague, and uncertain. For example, in the traditional approach, it is assumed that the tonnage and ship value are directly proportional in general. On the contrary, age and the ship value are generally inversely proportional. The increase in ship tonnage also increases the financial risks. However, these assumptions may not be always correct in the shipping economy. The freight rate, ship sale and purchase market, new building, and demolition markets play a role in ship value and decision-making. Several management strategies might be needed in handling the fluctuations and fuzziness.
The TOPSIS method is implemented due to the fuzziness of the environment of the ship investment process. DMs’ responses might include several uncertainties. For instance, parameters (i.e., risk) are directly employed in the decision-making environment by conducting expert consultations. Financial and technical parameters are considered as the selection criteria. Finally, dry bulk selection is illustrated by presenting the real-time example.
It is obvious that the cheapest, largest, or youngest dry bulk carrier might not ensure profitability and financial or technical efficiency for the purchase of dry bulk carriers. The optimized results of the fuzzy TOPSIS method prove that the instability of a ship owner’s tendency is handled by its holistic perspective capability.
This study makes the following contributions to the ship finance and decision-making literature. First, our model has explained how ship parameters contribute to ship investment decisions. We extend the decision-making modeling by revealing the difference and compromise among technical, operational, and financial parameters. This study also leads to useful implications for decision-makers in ship investments. Specifically, the findings of this research can help these decision-makers to identify the parameters to focus on such that the potential trade-offs among ship parameters can be leveraged accordingly.
Despite contributions, the findings of this research may be limited by ship type specific contexts. This research establishes a foundation to expand understanding to other ship types. Further studies can examine other ship types and will likely add new insights into ship investments, which are substantial asset investments. Different ship types serve different market sectors, where the ship investments should be dominated by different parameters. Our models are based on six categories of ship parameters. Further research might elaborate on other categories of ship parameters because more general characteristics of a ship should affect the investment options available to decision makers. Elaborated categories of ship parameters as well as non-ship parameters may also provide insightful findings.
Author Contributions
For this research, A.S. and B.S. designed the concept of the research; B.S. implemented experimental design; T.L.Y., P.-H.T. and B.S. conducted data analysis; T.L.Y., P.-H.T. and B.S. wrote the draft paper; M.K. and A.S. reviewed and edited the whole paper; A.S. acquired the funding. All authors have read and agreed to the published version of the manuscript.
Funding
This work was supported in part by European Research Consortium for Informatics—ERCIM.
Acknowledgments
We would like to express our special thanks to the anonymous reviewers and the Editor for careful reading of the paper, and for providing valuable comments and suggestions which have helped to improve both the content and the presentation. We thank Karadeniz Technical University for their support for the participation of the first author to the ERCIM programme. The authors thank the decision makers who participated in the surveys.
Conflicts of Interest
The authors declare no conflict of interest.
References
- UNCTAD. Review of Maritime Transport; United Nations Publication: New York, NY, USA, 2019. [Google Scholar]
- Clarksons Research. Shipping Review and Outlook; Clarksons Publications: London, UK, 2018. [Google Scholar]
- Fan, L.; Luo, M. Analyzing ship investment behaviour in liner shipping. Marit. Policy Manag. 2013, 40, 511–533. [Google Scholar] [CrossRef]
- Kou, Y.; Luo, M. Market driven ship investment decision using the real option approach. Transp. Res. Part A Policy Pract. 2018, 118, 714–729. [Google Scholar] [CrossRef]
- Celik Girgin, S.; Karlis, T.; Nguyen, H.O. A critical review of the literature on firm-level theories on ship investment. Int. J. Financ. Stud. 2018, 6, 11. [Google Scholar] [CrossRef] [Green Version]
- Akgül, E.F.; Çetin, İ.B. A Qualitative Research on Ship Investments in Turkey. J. ETA Marit. Sci. 2019, 7, 228–241. [Google Scholar] [CrossRef]
- Yu, C.K.; Yip, T.L.; Choy, S.K. Optimal portfolio choice for ship leasing investments. Marit. Policy Manag. 2019, 46, 884–900. [Google Scholar] [CrossRef]
- Alizadeh, A.H.; Thanopoulou, H.; Yip, T.L. Investors’ behavior and dynamics of ship prices: A heterogeneous agent model. Transp. Res. Part E Logist. Transp. Rev. 2017, 106, 98–114. [Google Scholar] [CrossRef]
- Rousos, E.P.; Lee, B.S. Multicriteria analysis in shipping investment evaluation. Marit. Policy Manag. 2012, 39, 423–442. [Google Scholar] [CrossRef]
- Duru, O.; Bulut, E. Retrospective data size setting for financial ship valuation: The market price vs. asset valuation paradox and the long term asset valuation. In Proceedings of the Annual Conference of the International Association of Maritime Economists (IAME), Norfolk, VA, USA, 31 October 2014. [Google Scholar]
- Govindan, K.; Rajendran, S.; Sarkis, J.; Murugesan, P. Multi criteria decision making approaches for green supplier evaluation and selection: A literature review. J. Clean. Prod. 2015, 98, 66–83. [Google Scholar] [CrossRef]
- Yang, J.L.; Chiu, H.N.; Tzeng, G.H.; Yeh, R.H. Vendor selection by integrated fuzzy MCDM techniques with independent and interdependent relationships. Inf. Sci. 2008, 178, 4166–4183. [Google Scholar] [CrossRef]
- Wu, K.J.; Tseng, M.L.; Chiu, A.S.; Lim, M.K. Achieving competitive advantage through supply chain agility under uncertainty: A novel multi-criteria decision-making structure. Int. J. Prod. Econ. 2017, 190, 96–107. [Google Scholar] [CrossRef]
- Zhang, S.C.; Wang, H.; Liu, Z.; Zeng, S.; Jin, Y.; Baležentis, T. A Comprehensive Evaluation of the Community Environment Adaptability for Elderly People Based on the Improved TOPSIS. Information 2019, 10, 389. [Google Scholar] [CrossRef] [Green Version]
- Kabassi, K.; Amelio, A.; Komianos, V.; Oikonomou, K. Evaluating Museum Virtual Tours: The Case Study of Italy. Information 2019, 10, 351. [Google Scholar] [CrossRef] [Green Version]
- Palczewski, K.; Sałabun, W. The fuzzy TOPSIS applications in the last decade. Procedia Comput. Sci. 2019, 159, 2294–2303. [Google Scholar] [CrossRef]
- Papathanasiou, J.; Ploskas, N. TOPSIS. In Multiple Criteria Decision Aid; Springer: New York, NY, USA, 2018; pp. 1–30. [Google Scholar]
- Sarı, F.; Ceylan, D.A.; Özcan, M.M.; Özcan, M.M. A comparison of multicriteria decision analysis techniques for determining beekeeping suitability. Apidologie 2020, 3, 1–18. [Google Scholar] [CrossRef]
- Jozaghi, A.; Alizadeh, B.; Hatami, M.; Flood, I.; Khorrami, M.; Khodaei, N.; Ghasemi Tousi, E. A comparative study of the ahp and topsis techniques for dam site selection using gis: A case study of sistan and baluchestan province, iran. Geosciences 2018, 8, 494. [Google Scholar] [CrossRef] [Green Version]
- Ouma, Y.O.; Opudo, J.; Nyambenya, S. Comparison of fuzzy AHP and fuzzy TOPSIS for road pavement maintenance prioritization: Methodological exposition and case study. Adv. Civ. Eng. 2015, 2015, 140189. [Google Scholar] [CrossRef] [Green Version]
- Sarraf, R.; McGuire, M.P. Integration and Comparison of Multi-Criteria Decision Making Methods in Safe Route Planner. Expert Syst. Appl. 2020, 154, 113399. [Google Scholar] [CrossRef]
- Wang, Y.J. The evaluation of financial performance for Taiwan container shipping companies by fuzzy TOPSIS. Appl. Soft Comput. 2014, 22, 28–35. [Google Scholar] [CrossRef]
- Celik, M.; Cebi, S.; Kahraman, C.; Er, I.D. Application of axiomatic design and TOPSIS methodologies under fuzzy environment for proposing competitive strategies on Turkish container ports in maritime transportation network. Expert Syst. Appl. 2009, 36, 4541–4557. [Google Scholar] [CrossRef]
- Wang, Y.; Yeo, G.T.; Ng, A.K. Choosing optimal bunkering ports for liner shipping companies: A hybrid Fuzzy-Delphi–TOPSIS approach. Transp. Policy 2014, 35, 358–365. [Google Scholar] [CrossRef]
- Şenel, M.; Şenel, B.; Havle, C.A. Risk analysis of ports in Maritime Industry in Turkey using FMEA based intuitionistic Fuzzy TOPSIS Approach. In Proceedings of the ITM Web of Conferences, EDP Sciences, Girne, Cyprus, 17 October 2018; Volume 22, pp. 1–10. [Google Scholar]
- Celik, E.; Akyuz, E. An interval type-2 fuzzy AHP and TOPSIS methods for decision-making problems in maritime transportation engineering: The case of ship loader. Ocean Eng. 2018, 155, 371–381. [Google Scholar] [CrossRef]
- Zhang, X.; Lam, J.S.L. A fuzzy Delphi-AHP-TOPSIS framework to identify barriers in big data analytics adoption: Case of maritime organizations. Marit. Policy Manag. 2019, 46, 781–801. [Google Scholar] [CrossRef]
- Onu, P.U.; Quan, X.; Xu, L.; Orji, J.; Onu, E. Evaluation of sustainable acid rain control options utilizing a fuzzy TOPSIS multi-criteria decision analysis model frame work. J. Clean. Prod. 2017, 141, 612–625. [Google Scholar] [CrossRef] [Green Version]
- Susanty, A.; Saptadi, S.; Dewi, W.R.; Tjahjono, B. Analyzing the Drivers of Green Manufacturing Practices Using Fuzzy TOPSIS Case Study Bandarharjo Fish Smoked Industry Centre. Int. J. Appl. Sci. Eng. 2019, 16, 47–56. [Google Scholar]
- Bulut, E.; Duru, O.; Keçeci, T.; Yoshida, S. Use of consistency index, expert prioritization and direct numerical inputs for generic fuzzy-AHP modeling: A process model for shipping asset management. Expert Syst. Appl. 2012, 39, 1911–1923. [Google Scholar] [CrossRef]
- Duru, O.; Bulut, E.; Yoshida, S. Regime switching fuzzy AHP model for choice-varying priorities problem and expert consistency prioritization: A cubic fuzzy-priority matrix design. Expert Syst. Appl. 2012, 39, 4954–4964. [Google Scholar] [CrossRef]
- Junior, F.R.L.; Osiro, L.; Carpinetti, L.C.R. A comparison between Fuzzy AHP and Fuzzy TOPSIS methods to supplier selection. Appl. Soft Comput. 2014, 21, 194–209. [Google Scholar] [CrossRef]
- Xie, X.; Xu, D.L.; Yang, J.B.; Wang, J.; Ren, J.; Yu, S. Ship selection using a multiple-criteria synthesis approach. J. Mar. Sci. Technol. 2008, 13, 50–62. [Google Scholar] [CrossRef]
- Ertuğrul, İ.; Karakaşoğlu, N. Performance evaluation of Turkish cement firms with fuzzy analytic hierarchy process and TOPSIS methods. Expert Syst. Appl. 2009, 36, 702–715. [Google Scholar] [CrossRef]
- Hwang, C.; Yoon, K. Multiple Attribute Decision Making: Methods and Applications, A State of the Art Survey; Springer: New York, NY, USA, 1981. [Google Scholar]
- Chen, S.J.; Hwang, C.L. Fuzzy Multiple Attribute Decision Making Methods; Springer: New York, NY, USA, 1992. [Google Scholar]
- Yoon, K.P.; Hwang, C.L. Multiple Attribute Decision Making: An Introduction; Sage Publications: New York, NY, USA, 1995; Volume 104. [Google Scholar]
- Wang, T.C.; Chang, T.H. Application of TOPSIS in evaluating initial training aircraft under a fuzzy environment. Expert Syst. Appl. 2007, 33, 870–880. [Google Scholar] [CrossRef]
- Kabak, M.; Burmaoğlu, S.; Kazançoğlu, Y. A fuzzy hybrid MCDM approach for professional selection. Expert Syst. Appl. 2012, 39, 3516–3525. [Google Scholar] [CrossRef]
- Kabak, M.; Köse, E.; Kırılmaz, O.; Burmaoğlu, S. A fuzzy multi-criteria decision making approach to assess building energy performance. Energy Build. 2014, 72, 382–389. [Google Scholar] [CrossRef]
- Kum, S.; Sahin, B. Route selection approach for vessels in covered waters. Mar. Sci. Technol. Bull. 2014, 3, 1–4. [Google Scholar]
- Ozceylan, E.; Erbas, M.; Tolon, M.; Kabak, M.; Durgut, T. Evaluation of freight villages: A GIS-based multi-criteria decision analysis. Comput. Ind. 2016, 76, 38–52. [Google Scholar] [CrossRef]
- Chu, T.C.; Lin, Y.C. A fuzzy TOPSIS method for robot selection. Int. J. Adv. Manuf. Technol. 2003, 21, 284–290. [Google Scholar] [CrossRef]
- Byun, H.; Lee, K. A decision support system for the selection of a rapid prototyping process using the modified TOPSIS method. Int. J. Adv. Manuf. Technol. 2005, 26, 1338–1347. [Google Scholar] [CrossRef]
- Chen, C.T. Extensions of the TOPSIS for group decision-making under fuzzy environment. Fuzzy Sets Syst. 2000, 114, 1–9. [Google Scholar] [CrossRef]
- Sahin, B. Route selection probleM in the Arctic region for the global logistics industry. In Global Logistics Management; CRC Press: Boca Raton, FL, USA, 2014; p. 105. [Google Scholar]
- Sahin, B.; Kum, S. Risk Assessment of Arctic Navigation by Using Improved Fuzzy-AHP Approach. Int. J. Marit. Eng. 2015, 157, 241–250. [Google Scholar]
- Sahin, B.; Senol, Y.E.; Bulut, E.; Duru, O. Optimizing Technology Selection in Maritime Logistics. Res. Logist. Prod. 2015, 5, 299–309. [Google Scholar]
- Zadeh, L.A. Fuzzy sets. Inf. Control 1965, 8, 338–353. [Google Scholar] [CrossRef] [Green Version]
- Chen, C.T.; Lin, C.T.; Huang, S.F. A fuzzy approach for supplier evaluation and selection in supply chain management. Int. J. Prod. Econ. 2006, 102, 289–301. [Google Scholar] [CrossRef]
- Opricovic, S.; Tzeng, G.H. Compromise solution by MCDM methods: A comparative analysis of VIKOR and TOPSIS. Eur. J. Oper. Res. 2004, 156, 445–455. [Google Scholar] [CrossRef]
- Deval, O. Denizcilik ekonomisi (kuru yuk); Turkiye Is Bankasi Kultur Yayinlari: Istanbul, Turkey, 2015. [Google Scholar]
- Kenyon, T. International Convention on Tonnage Measurement of Ships. In Admiralty and Maritime Law Guide; International Conventions: Atlantic City, NJ, USA, 1969. [Google Scholar]
- Hayler, W.B. Merchant Marine Officers’ Handbook; Tidewater Pub.: Baltimore, MD, USA, 1989. [Google Scholar]
- Hayler, W.B.; Keever, J.M. American Merchant Seaman’s Manual: For Seamen by Seamen; Cornell Maritime Press: Centerville, MD, USA, 2003. [Google Scholar]
- Farris, P.; Bendle, N.; Pfeifer, P.E.; Reibstein, D.J. Marketing Metrics: The Manager’s Guide to Measuring Marketing Performance; FT Press: Upper Saddle River, NJ, USA, 2015. [Google Scholar]
Figure 1.
Trapezoidal fuzzy number.

Figure 2.
The structure of the decision problem hierarchy.


Table 1.
Main differences of classical and fuzzy logic.
| Classical Logic | Fuzzy Logic |
|---|---|
| A or not A | A and not A |
| Certain | Partial |
| All or none | Particular degrees |
| 0 or 1 | Between 0 and 1 continuity |
| Double units | Fuzzy Units |
Table 2.
Linguistic variables for priorities of each criterion.
| Linguistic Expression | Abbreviation | Trapezoidal Fuzzy Number |
|---|---|---|
| Very High | VH | (0.8 0.9 1.0 1.0) |
| High | H | (0.7 0.8 0.8 0.9) |
| Middle High | MH | (0.5 0.6 0.7 0.8) |
| Middle | M | (0.4 0.5 0.5 0.6) |
| Middle Low | ML | (0.2 0.3 0.4 0.5) |
| Low | L | (0.0 0.2 0.2 0.3) |
| Very Low | VL | (0.0 0.0 0.1 0.2) |
Table 3.
Linguistic variables for ratings.
| Linguistic Expression | Abbreviation | Trapezoidal Fuzzy Number |
|---|---|---|
| Very Good | VG | (8 9 10 10) |
| Good | G | (7 8 8 9) |
| Middle Good | MG | (5 6 7 8) |
| Fair | F | (4 5 5 6) |
| Middle Poor | MP | (2 3 4 5) |
| Poor | P | (0 2 2 3) |
| Very Poor | VP | (0 0 1 2) |
Table 4.
Values of the alternatives based on given criteria.
| A1 | A2 | A3 | A4 | A5 | A6 | ||
|---|---|---|---|---|---|---|---|
| C1 | Ship price ($ per mile) | 24.5 | 20 | 17 | 16 | 21 | 36 |
| Return on investment | 0.9 | 1.15 | 0.86 | 0.34 | 0.12 | 0.47 | |
| Loss probability | 0.39 | 0.46 | 0.54 | 0.26 | 0.32 | 0.44 | |
| C2 | Deadweight (t) | 76,000 | 76,000 | 56,000 | 32,922 | 84,104 | 170,000 |
| Gross tonnage | 41,342 | 41,342 | 31,538 | 20,763 | 46,000 | 86,743 | |
| Length overall (m) | 225 | 225 | 190 | 179.9 | 225 | 288.97 | |
| Breadth extreme (m) | 32.26 | 32.26 | 32 | 28.41 | 32.26 | 44.98 | |
| Design draught (m) | 7.1 | 12 | 11.1 | 10.4 | 11 | 11 | |
| C3 | Energy consumption(t/day) | 53.5 | 67.9 | 63.7 | 60 | 71.3 | 90.4 |
| Speed (Max/Average)(nm) | 16.7/13.1 | 15.5/13.9 | 16.2/13.4 | 12.1/11.3 | 16.5/13.8 | 13.4/12.5 | |
| C4 | Engine power (kW) | 8500 | 11,200 | 11,200 | 11,200 | 7200 | 14,860 |
| C5 | Built year/age (years) | 2011/5 | 2006/10 | 2006/10 | 2006/10 | 2013/3 | 2011/5 |
| C6 | Crane existence | No | No | Yes | Yes | Yes | No |
| Hoisting capacity(t) | NA | NA | 25–50 | 25–50 | 25–50 | NA | |
| Conditions of ship hatch cover | Average | Good | Average | Poor | Excellent | Average | |
| Conditions of balast tanks | Good | Good | Good | Good | Excellent | Excellent |
Table 5.
DMs’ evaluation of criteria by using linguistic variables.
| C1 | C2 | C3 | C4 | C5 | C6 | |
|---|---|---|---|---|---|---|
| DM1 | H | L | L | ML | M | M |
| DM2 | H | L | L | M | ML | M |
| DM3 | H | L | VL | MH | ML | MH |
| DM4 | MH | VL | VL | H | ML | M |
| DM5 | VH | VL | VL | VH | ML | M |
Table 6.
DMs’ evaluations of alternatives by using linguistic variables.
| Criteria | Alt. | DM1 | DM2 | DM3 | DM4 | DM5 |
|---|---|---|---|---|---|---|
| C1 | A1 | G | G | P | M | M |
| A2 | MG | G | MG | G | G | |
| A3 | VG | M | P | M | MG | |
| A4 | M | M | M | P | MG | |
| A5 | MP | MP | VP | P | VG | |
| A6 | VG | MG | VP | MG | VG | |
| C2 | A1 | G | VP | M | MP | MP |
| A2 | M | P | M | G | VG | |
| A3 | VG | P | VP | MG | VG | |
| A4 | M | MP | MP | P | M | |
| A5 | MP | P | MP | G | VG | |
| A6 | G | G | MP | P | VG | |
| C3 | A1 | G | G | MG | M | G |
| A2 | VG | MG | MG | MP | G | |
| A3 | M | MG | G | M | VG | |
| A4 | MP | M | M | G | VG | |
| A5 | VP | MP | VP | VP | VG | |
| A6 | G | VP | G | M | VG | |
| C4 | A1 | G | G | MG | M | G |
| A2 | MG | MG | MG | MP | G | |
| A3 | MP | MG | G | M | VG | |
| A4 | G | M | M | P | VG | |
| A5 | MP | MP | VP | G | VG | |
| A6 | VG | VP | G | M | VG | |
| C5 | A1 | MG | MG | MG | P | MG |
| A2 | VG | MG | MG | VG | VG | |
| A3 | MG | G | P | G | M | |
| A4 | G | M | MP | P | M | |
| A5 | P | P | P | VP | MG | |
| A6 | G | P | VP | P | MG | |
| C6 | A1 | MG | MP | G | VP | MG |
| A2 | VG | MP | G | VP | MG | |
| A3 | VG | M | G | MG | G | |
| A4 | G | MG | MG | P | VG | |
| A5 | VP | P | P | G | VG | |
| A6 | VG | MG | VP | VP | VG |
Table 7.
Fuzzy decision matrix.
| C1 | C2 | C3 | C4 | C5 | C6 | |||||||||||||||||||
|---|---|---|---|---|---|---|---|---|---|---|---|---|---|---|---|---|---|---|---|---|---|---|---|---|
| A1 | 2.0 | 5.6 | 5.6 | 9.0 | 0.0 | 3.8 | 4.4 | 9.0 | 7.0 | 7.0 | 7.2 | 9.0 | 7.0 | 7.0 | 7.2 | 9.0 | 5.0 | 5.2 | 6.0 | 8.0 | 2.0 | 4.6 | 5.4 | 9.0 |
| A2 | 5.0 | 7.2 | 7.6 | 9.0 | 0.0 | 5.8 | 6.0 | 10.0 | 5.0 | 6.4 | 7.2 | 10.0 | 5.0 | 5.8 | 6.6 | 9.0 | 5.0 | 7.8 | 8.8 | 10.0 | 2.0 | 5.2 | 6.0 | 10.0 |
| A3 | 2.0 | 5.4 | 5.8 | 10.0 | 0.0 | 5.2 | 6.0 | 10.0 | 4.0 | 6.6 | 7.0 | 10.0 | 2.0 | 6.2 | 6.8 | 10.0 | 2.0 | 5.8 | 6.0 | 9.0 | 4.0 | 7.2 | 7.6 | 10.0 |
| A4 | 4.0 | 4.6 | 4.8 | 8.0 | 2.0 | 3.6 | 4.0 | 6.0 | 2.0 | 6.0 | 6.4 | 10.0 | 4.0 | 5.8 | 6.0 | 10.0 | 4.0 | 4.6 | 4.8 | 9.0 | 5.0 | 6.2 | 6.8 | 10.0 |
| A5 | 1.0 | 3.4 | 4.2 | 10.0 | 0.0 | 5.0 | 5.6 | 10.0 | 0.0 | 2.4 | 3.4 | 10.0 | 1.0 | 4.6 | 5.4 | 10.0 | 0.0 | 2.4 | 2.8 | 8.0 | 0.0 | 4.2 | 4.6 | 10.0 |
| A6 | 1.0 | 6.0 | 7.0 | 10.0 | 4.0 | 6.0 | 6.4 | 10.0 | 0.0 | 6.0 | 6.4 | 10.0 | 0.0 | 6.2 | 6.8 | 10.0 | 0.0 | 3.6 | 4.0 | 9.0 | 1.0 | 4.8 | 5.8 | 10.0 |
Table 8.
Fuzzy weights matrix.
| C1 | 0.50 | 0.78 | 0.82 | 1.00 |
| C2 | 0.00 | 0.12 | 0.16 | 0.30 |
| C3 | 0.00 | 0.78 | 0.14 | 0.30 |
| C4 | 0.20 | 0.24 | 0.68 | 1.00 |
| C5 | 0.20 | 0.34 | 0.42 | 0.60 |
| C6 | 0.40 | 0.52 | 0.54 | 0.20 |
Table 9.
Normalized fuzzy decision matrix.
| C1 | C2 | C3 | C4 | C5 | C6 | |||||||||||||||||||
|---|---|---|---|---|---|---|---|---|---|---|---|---|---|---|---|---|---|---|---|---|---|---|---|---|
| A1 | 0.20 | 0.56 | 0.56 | 0.90 | 0.00 | 0.38 | 0.44 | 0.90 | 0.70 | 0.56 | 0.72 | 0.90 | 0.70 | 0.90 | 0.72 | 0.90 | 0.50 | 0.52 | 0.60 | 0.80 | 0.20 | 0.46 | 0.54 | 0.90 |
| A2 | 0.50 | 0.72 | 0.76 | 0.90 | 0.00 | 0.58 | 0.60 | 1.00 | 0.50 | 0.72 | 0.72 | 1.00 | 0.50 | 1.00 | 0.66 | 0.90 | 0.50 | 0.78 | 0.88 | 1.00 | 0.20 | 0.52 | 0.60 | 1.00 |
| A3 | 0.20 | 0.54 | 0.58 | 1.00 | 0.00 | 0.52 | 0.60 | 1.00 | 0.40 | 0.54 | 0.70 | 1.00 | 0.20 | 1.00 | 0.68 | 1.00 | 0.20 | 0.58 | 0.60 | 0.90 | 0.40 | 0.72 | 0.76 | 1.00 |
| A4 | 0.40 | 0.46 | 0.48 | 0.80 | 0.20 | 0.36 | 0.40 | 0.60 | 0.20 | 0.46 | 0.64 | 1.00 | 0.40 | 1.00 | 0.60 | 1.00 | 0.40 | 0.46 | 0.48 | 0.90 | 0.50 | 0.62 | 0.68 | 1.00 |
| A5 | 0.10 | 0.34 | 0.42 | 1.00 | 0.00 | 0.50 | 0.56 | 1.00 | 0.00 | 0.34 | 0.34 | 1.00 | 0.10 | 1.00 | 0.54 | 1.00 | 0.00 | 0.24 | 0.28 | 0.80 | 0.00 | 0.42 | 0.46 | 1.00 |
| A6 | 0.10 | 0.60 | 0.70 | 1.00 | 0.40 | 0.60 | 0.64 | 1.00 | 0.00 | 0.60 | 0.64 | 1.00 | 0.00 | 1.00 | 0.68 | 1.00 | 0.00 | 0.36 | 0.40 | 0.90 | 0.10 | 0.48 | 0.58 | 1.00 |
Table 10.
Weighted normalized fuzzy decision matrix.
| C1 | C2 | C3 | C4 | C5 | C6 | |||||||||||||||||||
|---|---|---|---|---|---|---|---|---|---|---|---|---|---|---|---|---|---|---|---|---|---|---|---|---|
| A1 | 0.10 | 0.44 | 0.46 | 0.90 | 0.00 | 0.05 | 0.07 | 0.27 | 0.00 | 0.44 | 0.10 | 0.27 | 0.14 | 0.22 | 0.49 | 0.90 | 0.10 | 0.18 | 0.25 | 0.48 | 0.08 | 0.24 | 0.29 | 0.18 |
| A2 | 0.25 | 0.56 | 0.62 | 0.90 | 0.00 | 0.07 | 0.10 | 0.30 | 0.00 | 0.56 | 0.10 | 0.30 | 0.10 | 0.24 | 0.45 | 0.90 | 0.10 | 0.27 | 0.37 | 0.60 | 0.08 | 0.27 | 0.32 | 0.20 |
| A3 | 0.10 | 0.42 | 0.48 | 1.00 | 0.00 | 0.06 | 0.10 | 0.30 | 0.00 | 0.42 | 0.10 | 0.30 | 0.04 | 0.24 | 0.46 | 1.00 | 0.04 | 0.20 | 0.25 | 0.54 | 0.16 | 0.37 | 0.41 | 0.20 |
| A4 | 0.20 | 0.36 | 0.39 | 0.80 | 0.00 | 0.04 | 0.06 | 0.18 | 0.00 | 0.36 | 0.09 | 0.30 | 0.08 | 0.24 | 0.41 | 1.00 | 0.08 | 0.16 | 0.20 | 0.54 | 0.20 | 0.32 | 0.37 | 0.20 |
| A5 | 0.05 | 0.27 | 0.34 | 1.00 | 0.00 | 0.06 | 0.09 | 0.30 | 0.00 | 0.27 | 0.05 | 0.30 | 0.02 | 0.24 | 0.37 | 1.00 | 0.00 | 0.08 | 0.12 | 0.48 | 0.00 | 0.22 | 0.25 | 0.20 |
| A6 | 0.05 | 0.47 | 0.57 | 1.00 | 0.00 | 0.07 | 0.10 | 0.30 | 0.00 | 0.47 | 0.09 | 0.30 | 0.00 | 0.24 | 0.46 | 1.00 | 0.00 | 0.12 | 0.17 | 0.54 | 0.04 | 0.25 | 0.31 | 0.20 |
Table 11.
Distance of FPIS.
| C1 | C2 | C3 | C4 | C5 | C6 | ||
|---|---|---|---|---|---|---|---|
| A1 | 0.60 | 0.23 | 0.40 | 0.64 | 0.38 | 0.81 | 3.04 |
| A2 | 0.48 | 0.21 | 0.39 | 0.65 | 0.32 | 0.79 | 2.84 |
| A3 | 0.60 | 0.22 | 0.39 | 0.67 | 0.39 | 0.72 | 2.98 |
| A4 | 0.60 | 0.24 | 0.40 | 0.67 | 0.40 | 0.73 | 3.04 |
| A5 | 0.68 | 0.22 | 0.43 | 0.70 | 0.47 | 0.84 | 3.34 |
| A6 | 0.58 | 0.21 | 0.39 | 0.68 | 0.44 | 0.81 | 3.12 |
Table 12.
Distance of FNIS.
| C1 | C2 | C3 | C4 | C5 | C6 | ||
|---|---|---|---|---|---|---|---|
| A1 | 0.51 | 0.14 | 0.26 | 0.53 | 0.29 | 0.21 | 1.94 |
| A2 | 0.58 | 0.16 | 0.32 | 0.52 | 0.38 | 0.24 | 2.20 |
| A3 | 0.55 | 0.16 | 0.26 | 0.56 | 0.31 | 0.31 | 2.16 |
| A4 | 0.45 | 0.10 | 0.24 | 0.55 | 0.30 | 0.28 | 1.92 |
| A5 | 0.51 | 0.16 | 0.20 | 0.55 | 0.25 | 0.19 | 1.86 |
| A6 | 0.58 | 0.16 | 0.28 | 0.56 | 0.29 | 0.22 | 2.10 |
Table 13.
Closeness coefficient and ranking of dry bulk carriers.
| Alternative | CC | Rank |
|---|---|---|
| A1 | 0.390 | 4 |
| A2 | 0.437 | 1 |
| A3 | 0.420 | 2 |
| A4 | 0.387 | 5 |
| A5 | 0.358 | 6 |
| A6 | 0.403 | 3 |
Table 14.
An overview to alternatives.
| Ship | A1 | A2 | A3 | A4 | A5 | A6 |
|---|---|---|---|---|---|---|
| Ship price (million $) | 24.5 | 20 | 17 | 16 | 21 | 36 |
| Deadweight (ton) | 76,000 | 76,000 | 56,000 | 32,922 | 84,104 | 170,000 |
| Ship price per deadweight ($ per ton) | 322.4 | 263.2 | 303.6 | 486 | 249.7 | 211.8 |
| Built year/age (years) | 2011/5 | 2006/10 | 2006/10 | 2006/10 | 2013/3 | 2011/5 |
| Ship price per deadweight @ 5 years old ($ per ton) | 322.4 | 328.9 | 379.5 | 607.5 | 224.7 | 211.8 |
© 2020 by the authors. Licensee MDPI, Basel, Switzerland. This article is an open access article distributed under the terms and conditions of the Creative Commons Attribution (CC BY) license (http://creativecommons.org/licenses/by/4.0/).
Share and Cite
MDPI and ACS Style
Sahin, B.; Yip, T.L.; Tseng, P.-H.; Kabak, M.; Soylu, A. An Application of a Fuzzy TOPSIS Multi-Criteria Decision Analysis Algorithm for Dry Bulk Carrier Selection. Information 2020, 11, 251. https://doi.org/10.3390/info11050251
AMA Style
Sahin B, Yip TL, Tseng P-H, Kabak M, Soylu A. An Application of a Fuzzy TOPSIS Multi-Criteria Decision Analysis Algorithm for Dry Bulk Carrier Selection. Information. 2020; 11(5):251. https://doi.org/10.3390/info11050251
Chicago/Turabian StyleSahin, Bekir, Tsz Leung Yip, Po-Hsing Tseng, Mehmet Kabak, and Ahmet Soylu. 2020. "An Application of a Fuzzy TOPSIS Multi-Criteria Decision Analysis Algorithm for Dry Bulk Carrier Selection" Information 11, no. 5: 251. https://doi.org/10.3390/info11050251
Note that from the first issue of 2016, this journal uses article numbers instead of page numbers. See further details here.