
Novel Relationship between Mitofusin 2-Mediated Mitochondrial Hyperfusion, Metabolic Remodeling, and Glycolysis in Pulmonary Arterial Endothelial Cells
 , ,
, ,  and
and 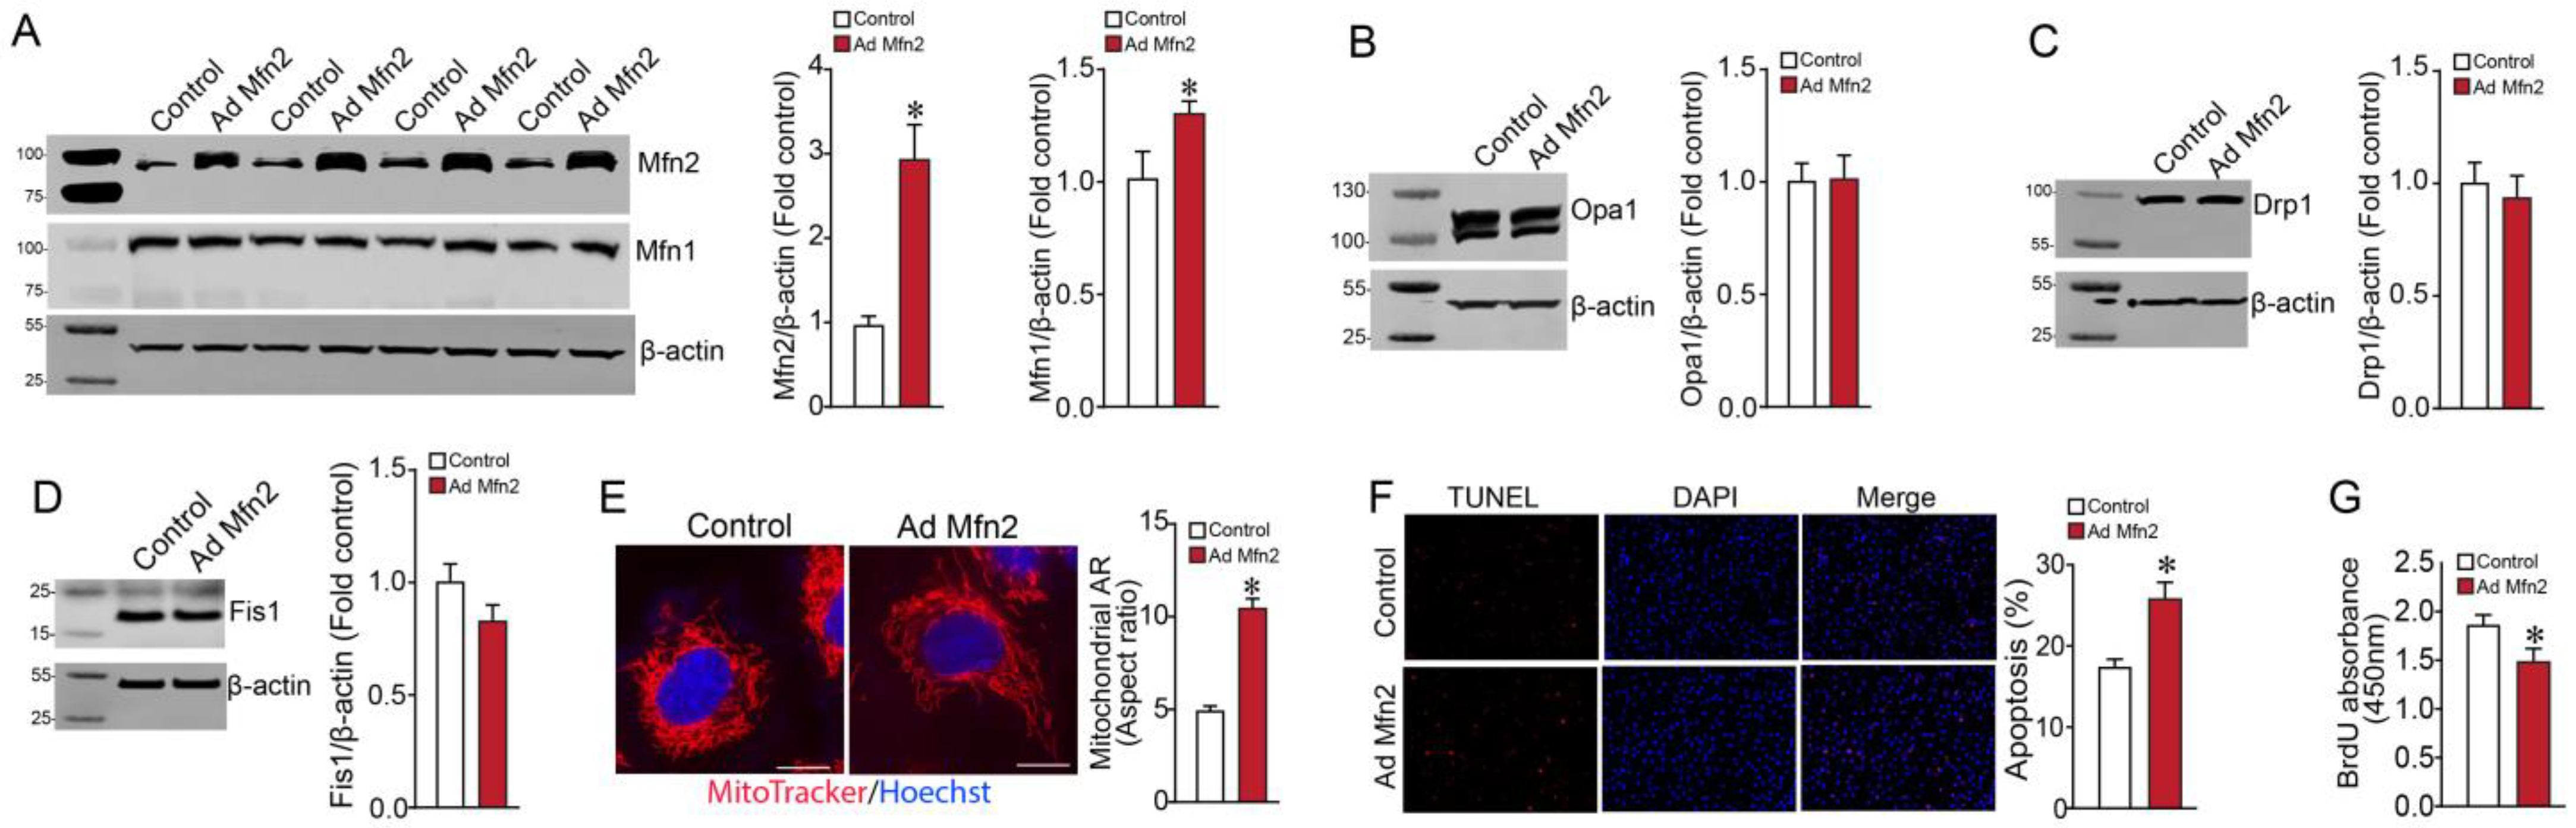
Abstract
:1. Introduction
2. Results
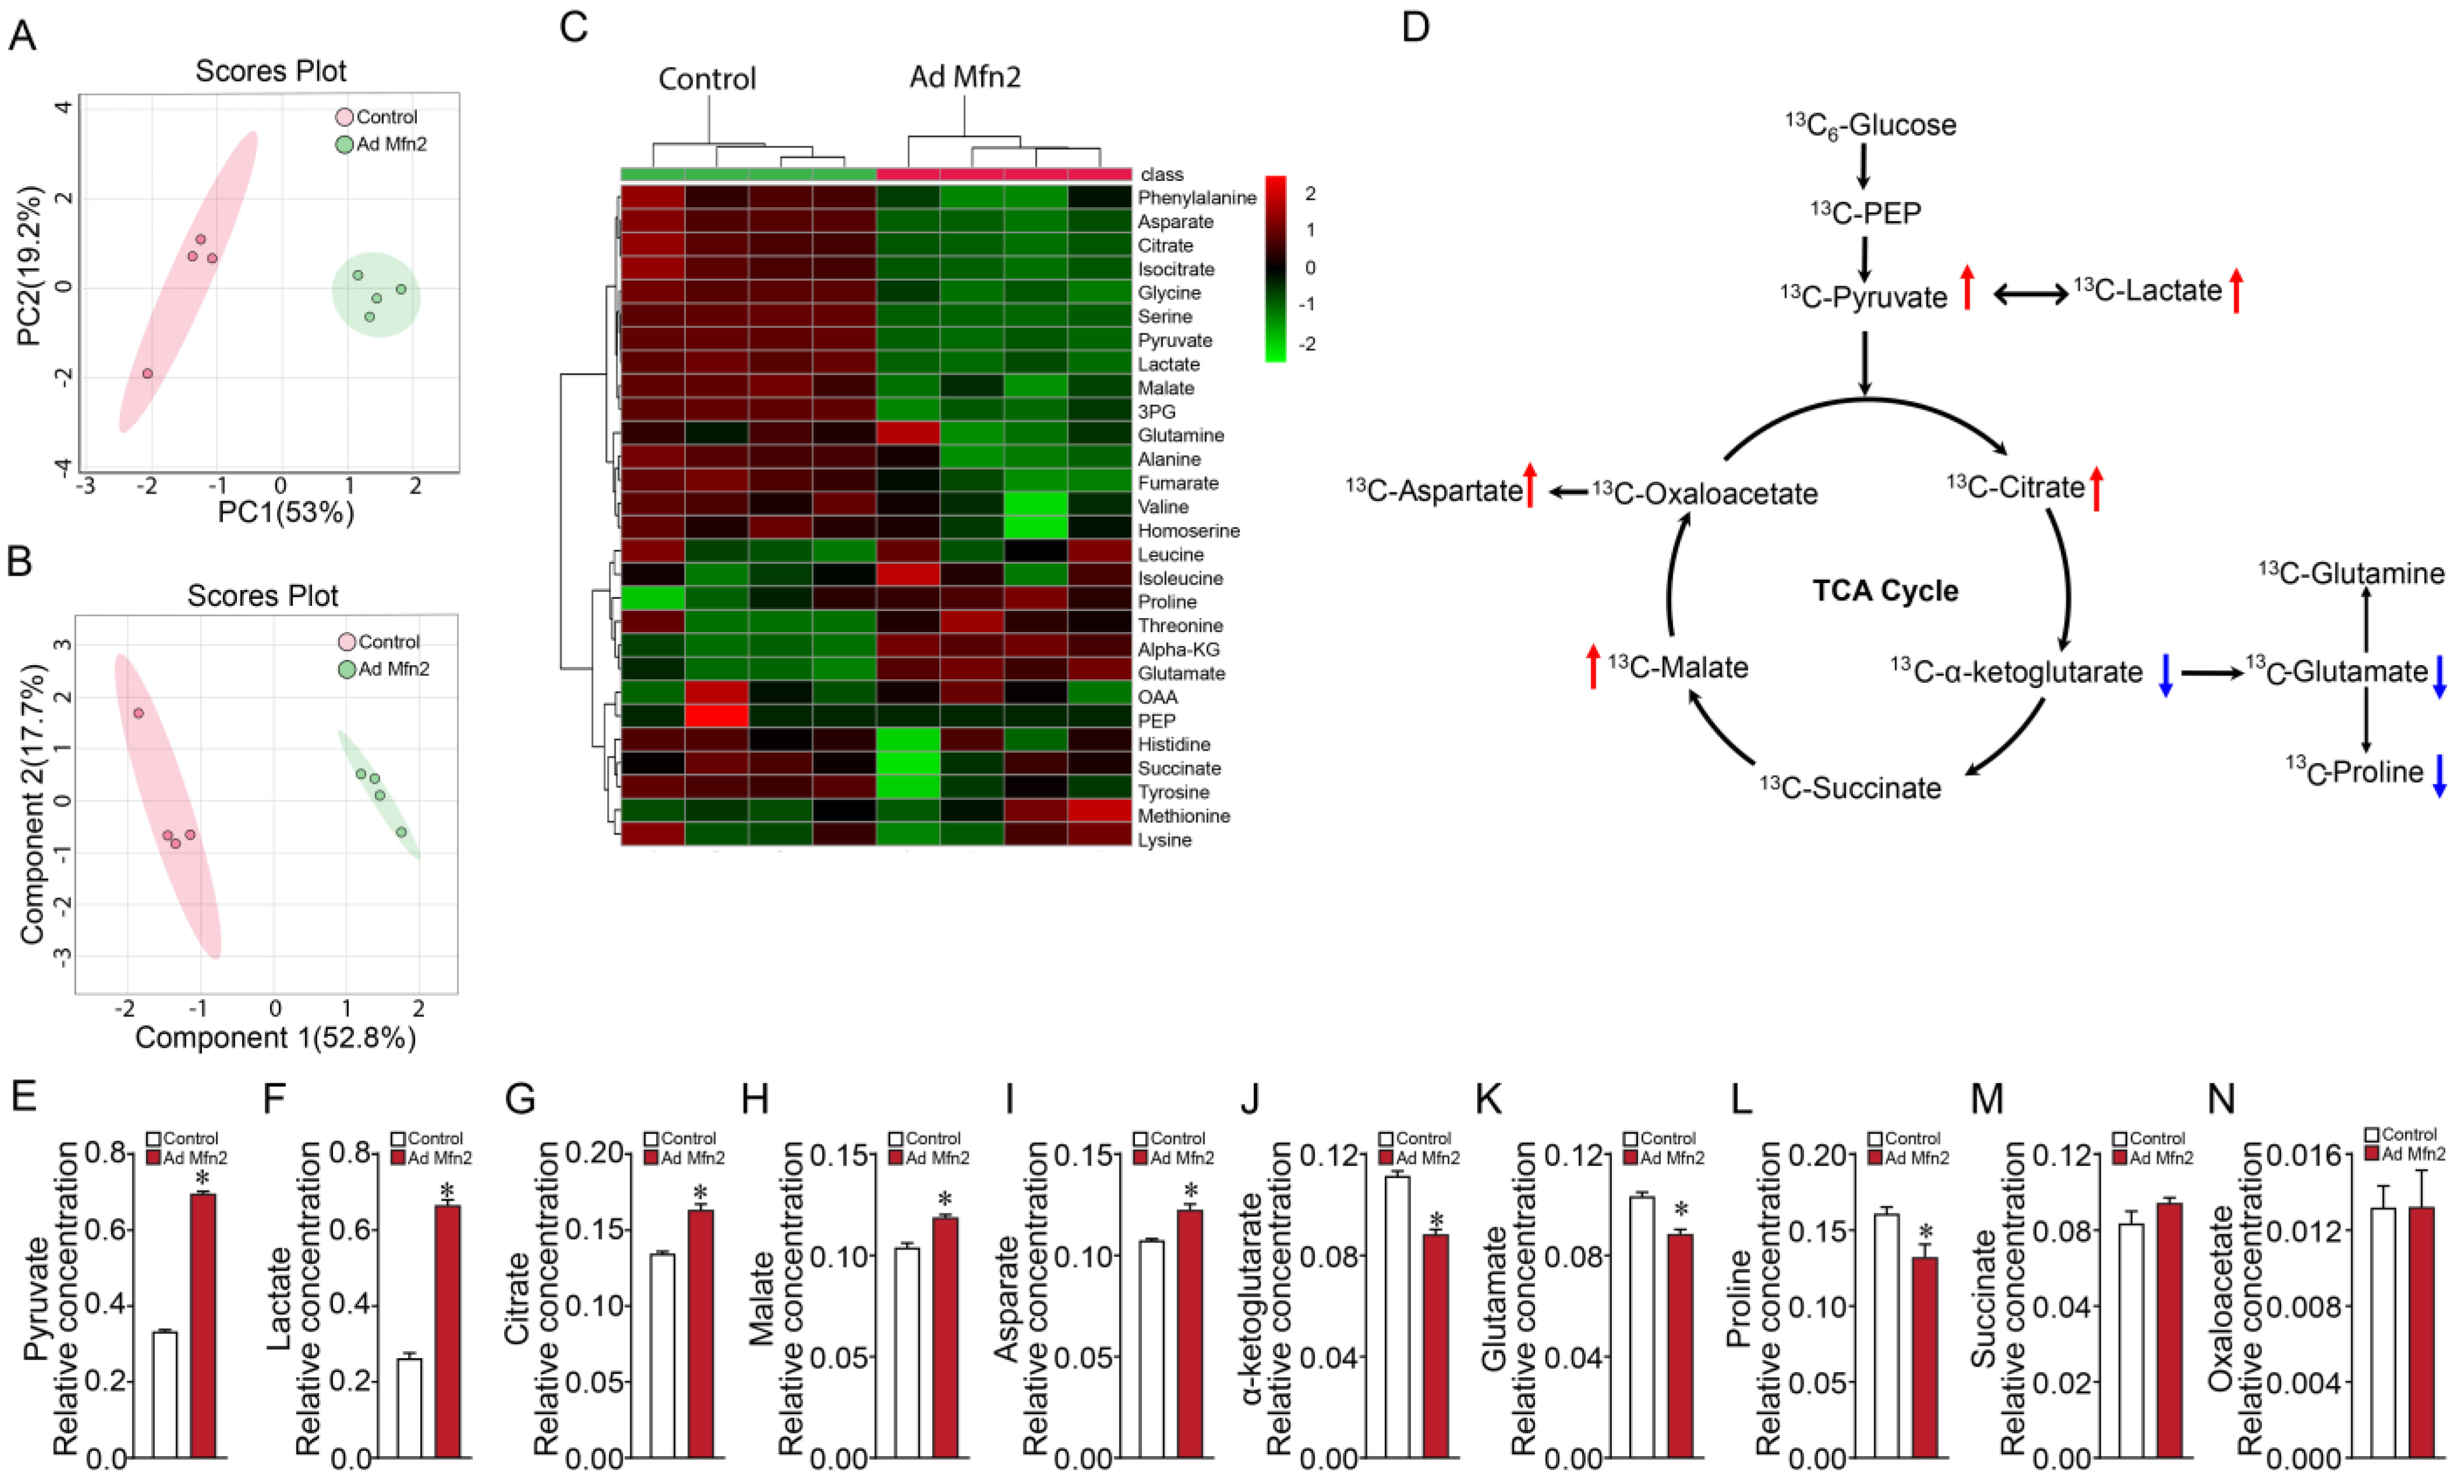
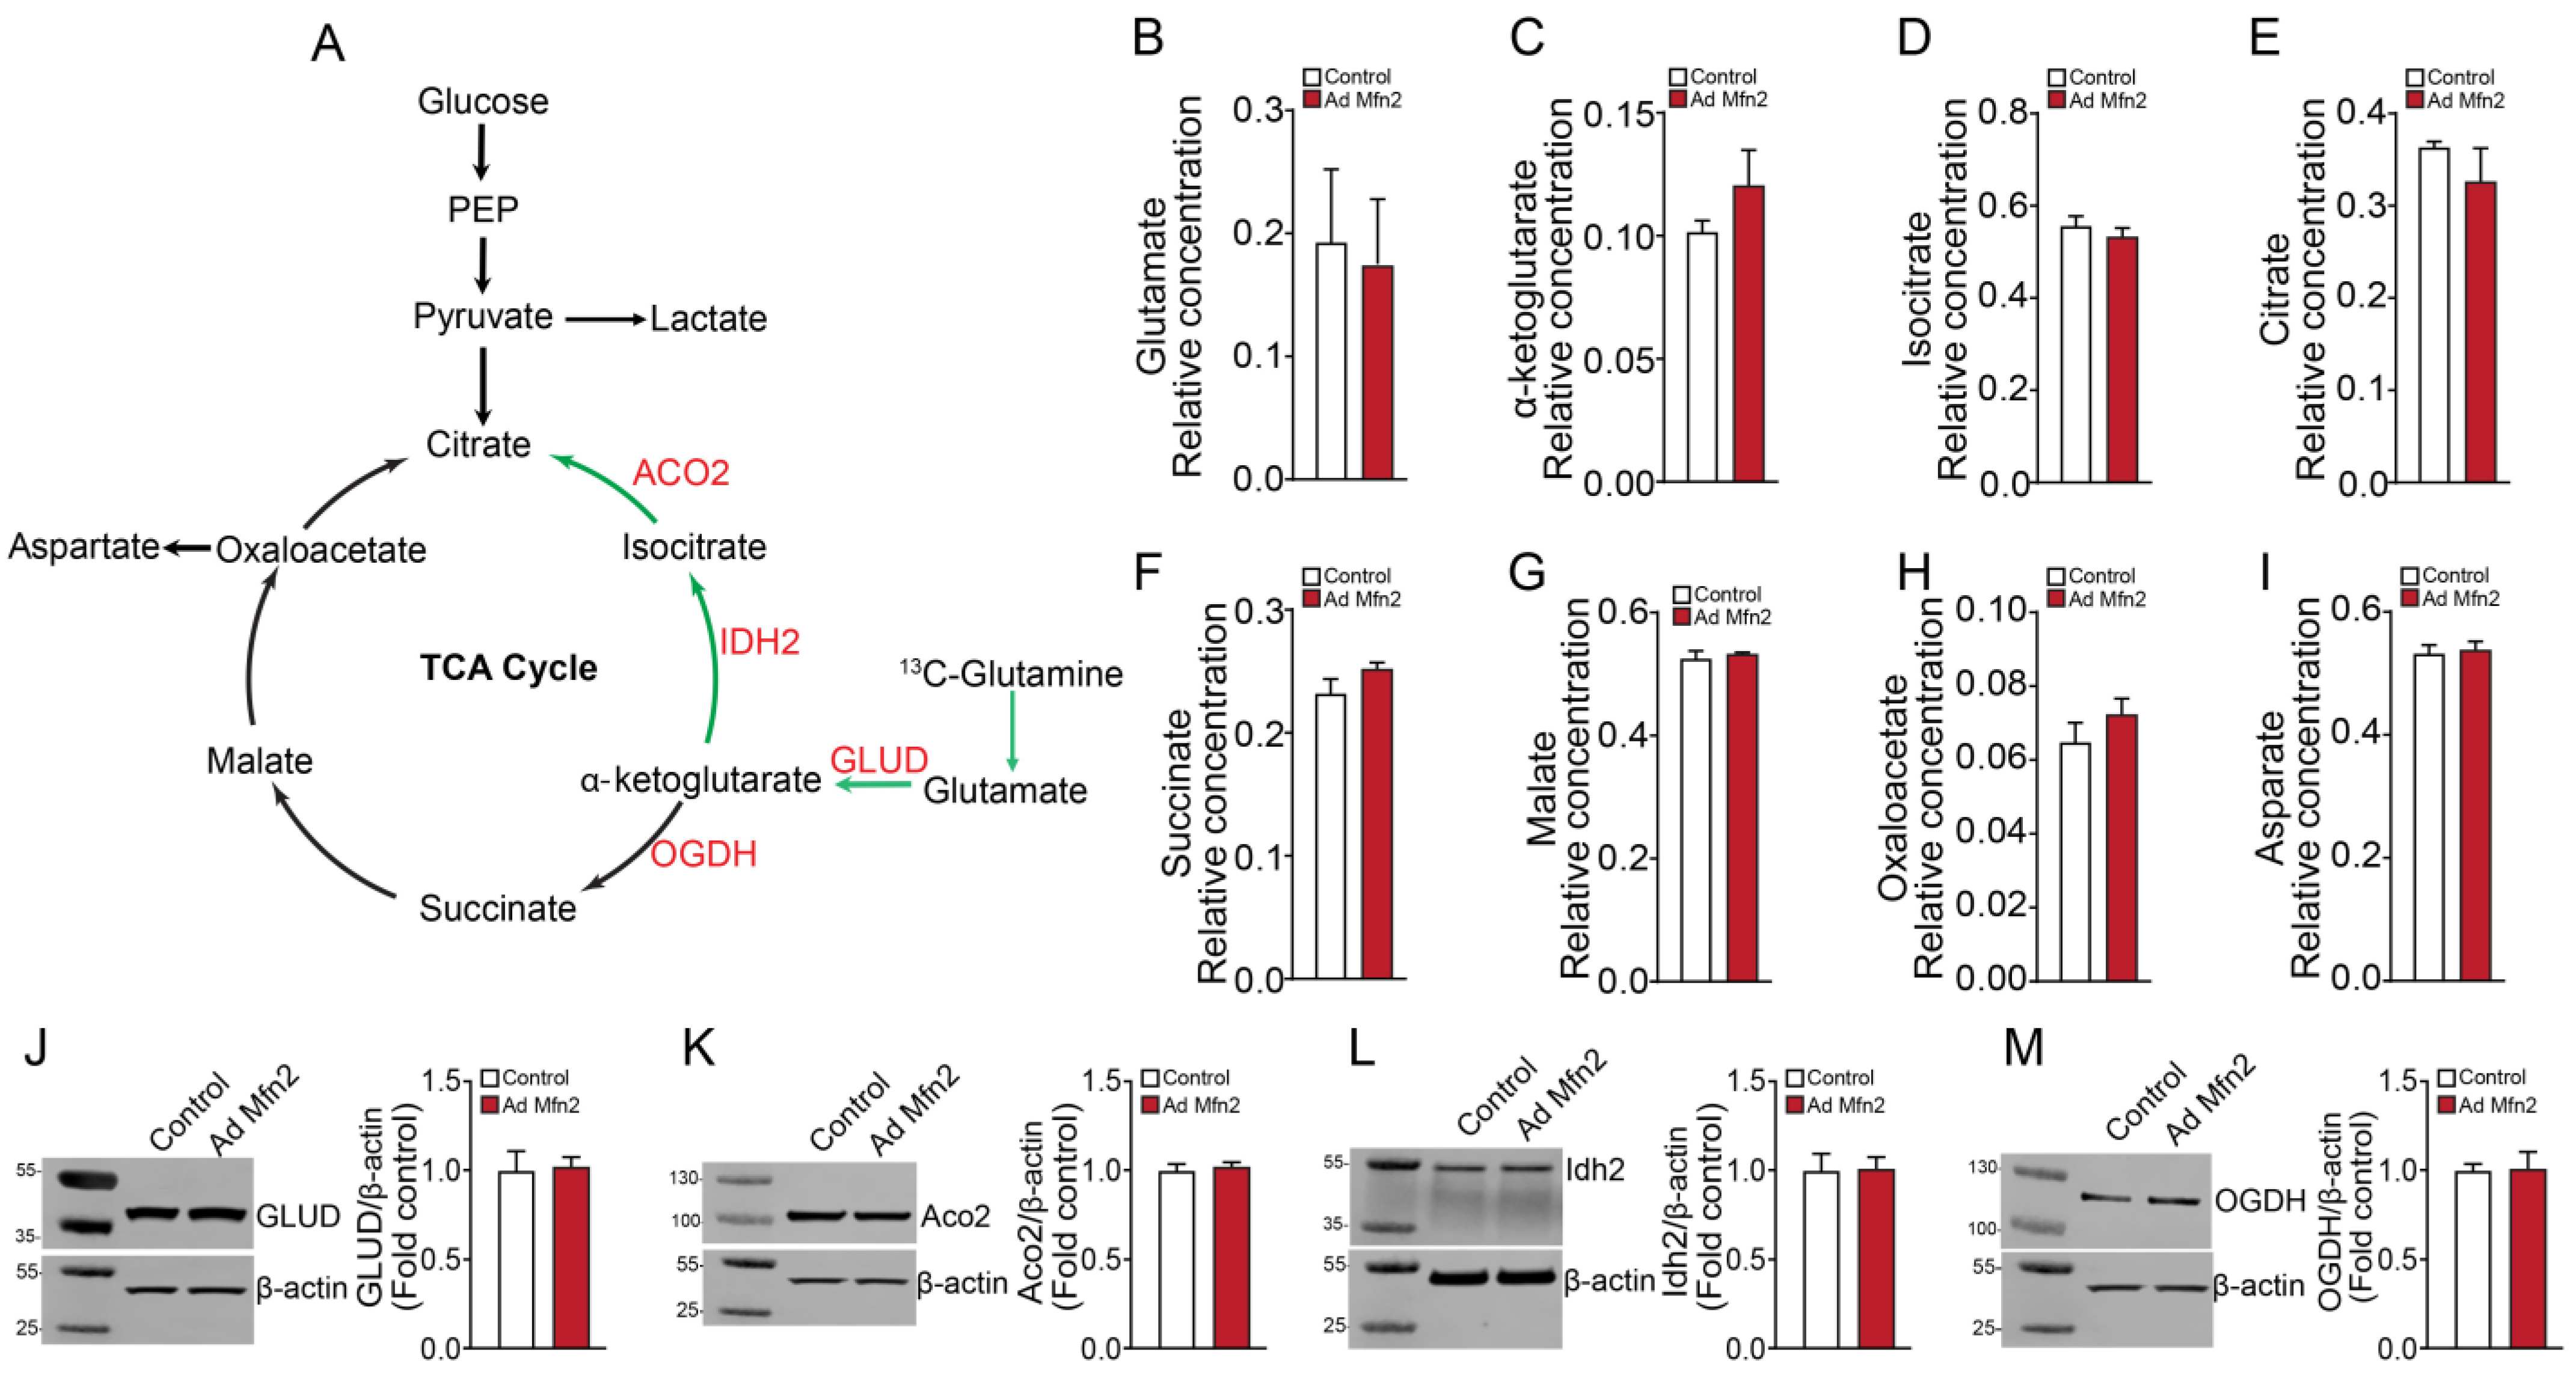
2.1. Overexpression of Mfn2 Induces Metabolic Reprogramming in Pulmonary Arterial Endothelial Cells
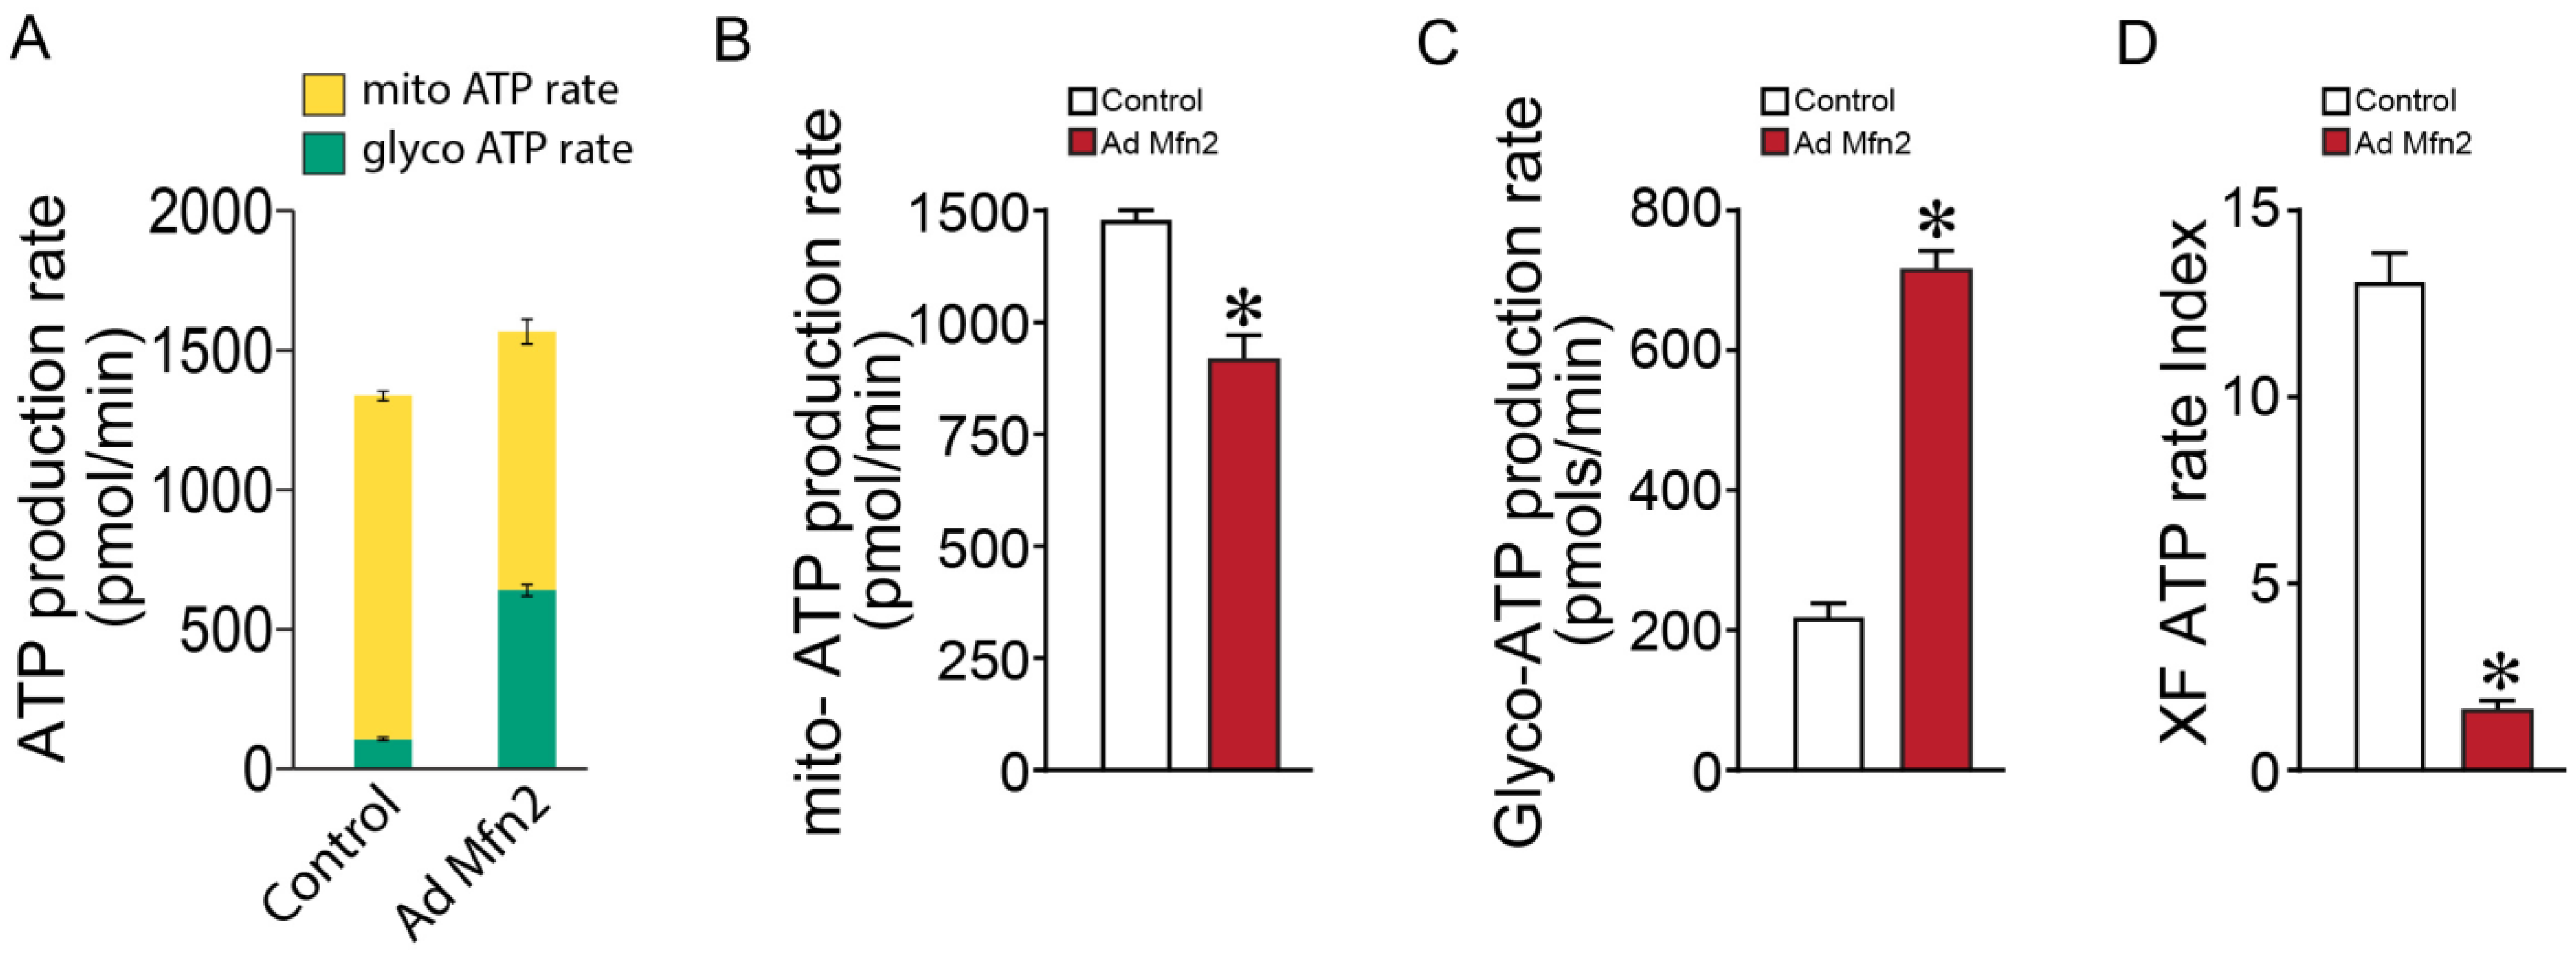
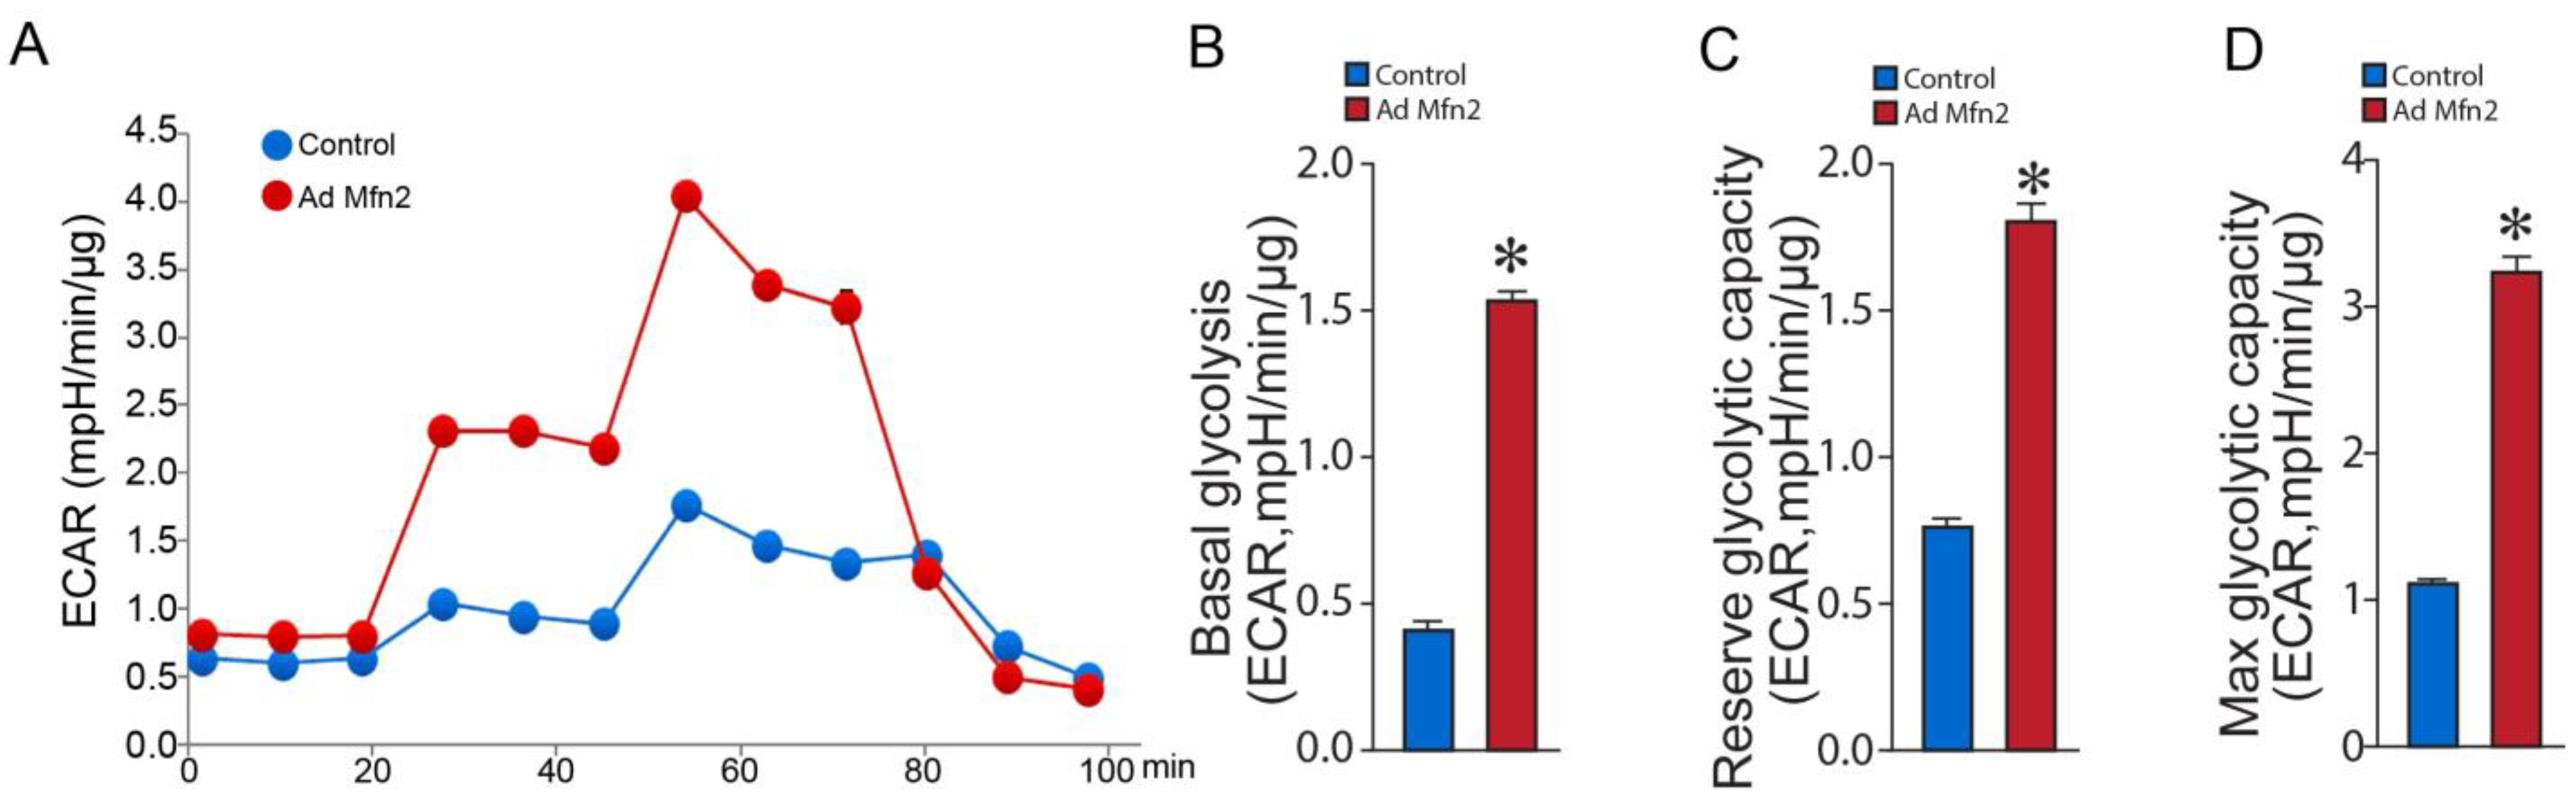
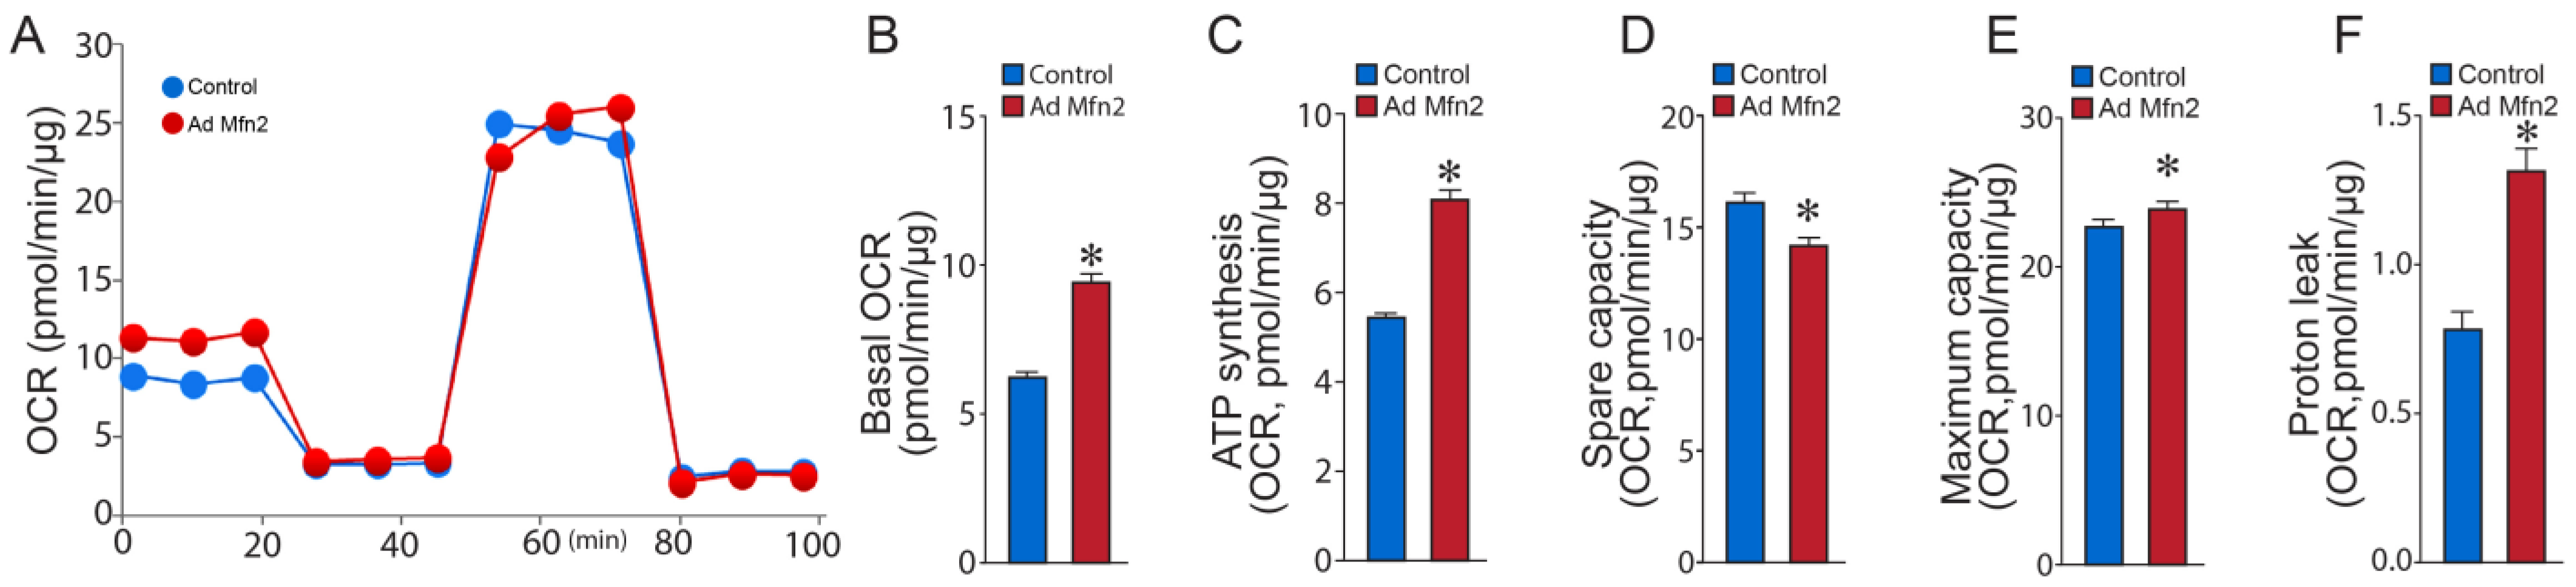
2.2. Mfn2 Overexpression Reprograms Cellular Energy Metabolism to Favor Glycolysis in Pulmonary Arterial Endothelial Cells
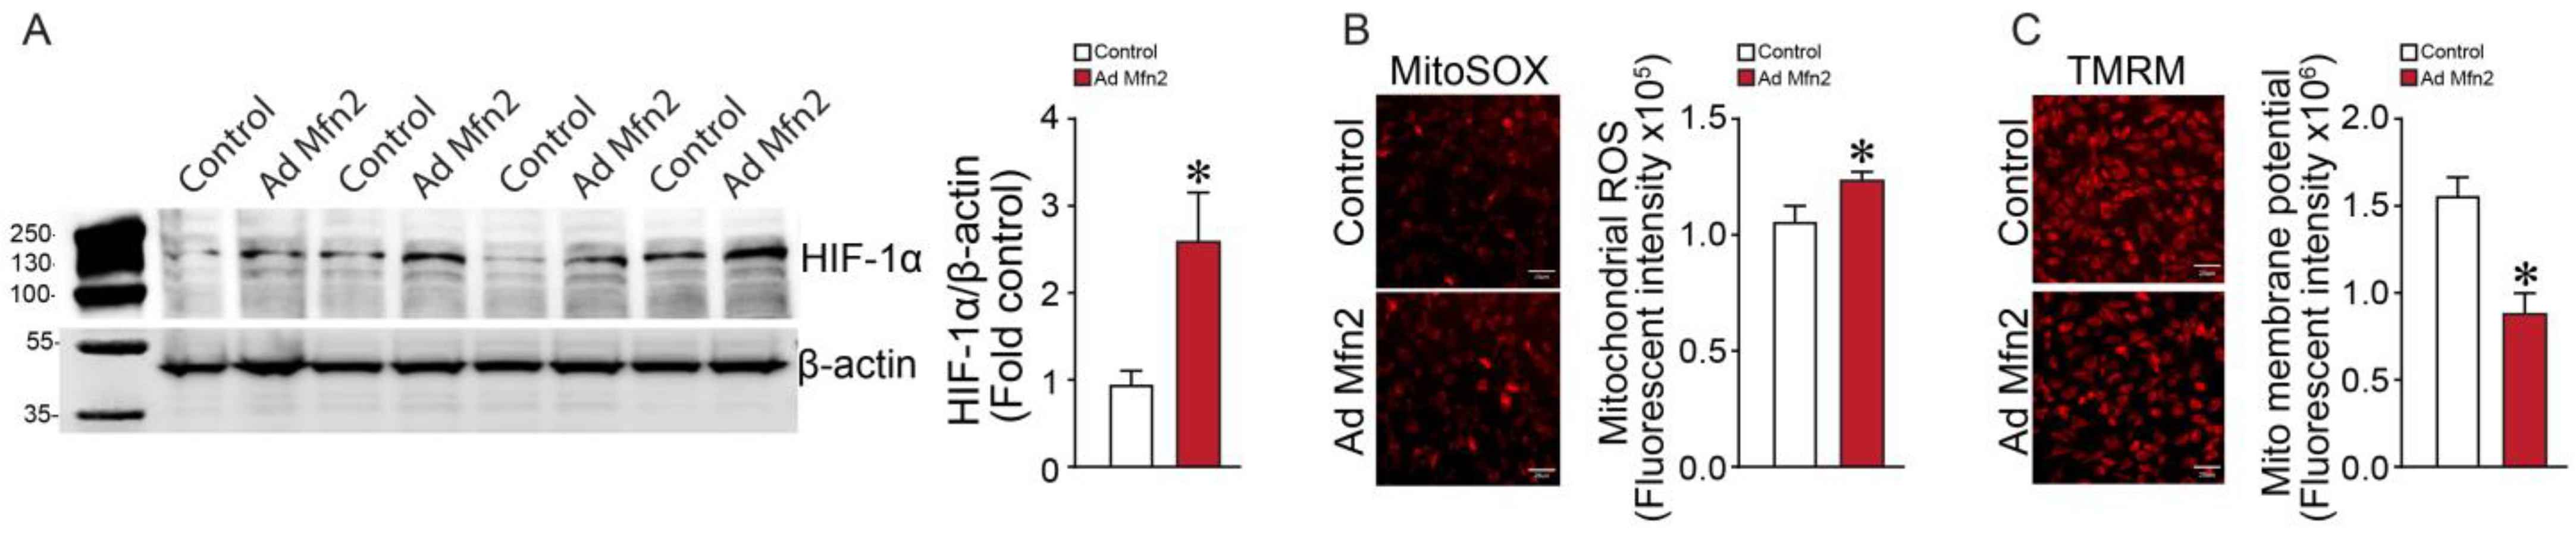
2.3. Mfn2 Overexpression Increases Mitochondrial (mt)-ROS and HIF-1α Levels in Pulmonary Arterial Endothelial Cells
3. Discussion
4. Materials and Methods
4.1. Reagents
4.2. Animal and Ethics Statement
4.3. Cell Culture and Adenoviral Transduction of PAECs
4.4. Western Blot Analysis
4.5. Gas Chromatography–Mass Spectrometry (GC-MS) Metabolic Flux Assay
4.6. Metabolic Flux Analysis
4.7. Measurement of Oxygen Consumption Rate
4.8. Measurement of Extracellular Acidification Rate
4.9. Analysis of Real-Time Cellular ATP Rates
4.10. In Situ Apoptosis Assay
4.11. BrdU Cell Proliferation Assay
4.12. Analysis of Mitochondrial Fusion
4.13. Analysis of Mitochondrial (mt)-ROS and the Mitochondrial Membrane Potential
4.14. Statistical Analysis
5. Conclusions
Author Contributions
Funding
Institutional Review Board Statement
Informed Consent Statement
Data Availability Statement
Acknowledgments
Conflicts of Interest
References
- Xu, W.; Janocha, A.J.; Erzurum, S.C. Metabolism in Pulmonary Hypertension. Annu. Rev. Physiol. 2021, 83, 551–576. [Google Scholar] [CrossRef] [PubMed]
- Pokharel, M.D.; Marciano, D.P.; Fu, P.; Franco, M.C.; Unwalla, H.; Tieu, K.; Fineman, J.R.; Wang, T.; Black, S.M. Metabolic reprogramming, oxidative stress, and pulmonary hypertension. Redox Biol. 2023, 64, 102797. [Google Scholar] [CrossRef] [PubMed]
- Culley, M.K.; Chan, S.Y. Mitochondrial metabolism in pulmonary hypertension: Beyond mountains there are mountains. J. Clin. Investig. 2018, 128, 3704–3715. [Google Scholar] [CrossRef] [PubMed]
- Sun, X.; Lu, Q.; Yegambaram, M.; Kumar, S.; Qu, N.; Srivastava, A.; Wang, T.; Fineman, J.R.; Black, S.M. TGF-β1 attenuates mitochondrial bioenergetics in pulmonary arterial endothelial cells via the disruption of carnitine homeostasis. Redox Biol. 2020, 36, 101593. [Google Scholar] [CrossRef] [PubMed]
- Liang, S.; Yegambaram, M.; Wang, T.; Wang, J.; Black, S.M.; Tang, H. Mitochondrial Metabolism, Redox, and Calcium Homeostasis in Pulmonary Arterial Hypertension. Biomedicines 2022, 10, 341. [Google Scholar] [CrossRef] [PubMed]
- Bereiter-Hahn, J.; Vöth, M. Dynamics of mitochondria in living cells: Shape changes, dislocations, fusion, and fission of mitochondria. Microsc. Res. Tech. 1994, 27, 198–219. [Google Scholar] [CrossRef] [PubMed]
- Merz, S.; Hammermeister, M.; Altmann, K.; Dürr, M.; Westermann, B. Molecular machinery of mitochondrial dynamics in yeast. Biol. Chem. 2007, 388, 917–926. [Google Scholar] [CrossRef]
- Ranieri, M.; Brajkovic, S.; Riboldi, G.; Ronchi, D.; Rizzo, F.; Bresolin, N.; Corti, S.; Comi, G.P. Mitochondrial Fusion Proteins and Human Diseases. Neurol. Res. Int. 2013, 2013, 293893. [Google Scholar] [CrossRef]
- Suárez-Rivero, J.M.; Villanueva-Paz, M.; de la Cruz-Ojeda, P.; de la Mata, M.; Cotán, D.; Oropesa-Ávila, M.; de Lavera, I.; Álvarez-Córdoba, M.; Luzón-Hidalgo, R.; Sánchez-Alcázar, J.A. Mitochondrial Dynamics in Mitochondrial Diseases. Diseases 2016, 5, 1. [Google Scholar] [CrossRef]
- Serasinghe, M.N.; Chipuk, J.E. Mitochondrial Fission in Human Diseases. Handb. Exp. Pharmacol. 2017, 240, 159–188. [Google Scholar] [CrossRef]
- Yang, D.; Ying, J.; Wang, X.; Zhao, T.; Yoon, S.; Fang, Y.; Zheng, Q.; Liu, X.; Yu, W.; Hua, F. Mitochondrial Dynamics: A Key Role in Neurodegeneration and a Potential Target for Neurodegenerative Disease. Front. Neurosci. 2021, 15, 654785. [Google Scholar] [CrossRef] [PubMed]
- Eirin, A.; Lerman, A.; Lerman, L.O. Mitochondrial injury and dysfunction in hypertension-induced cardiac damage. Eur. Heart J. 2014, 35, 3258–3266. [Google Scholar] [CrossRef] [PubMed]
- Siasos, G.; Tsigkou, V.; Kosmopoulos, M.; Theodosiadis, D.; Simantiris, S.; Tagkou, N.M.; Tsimpiktsioglou, A.; Stampouloglou, P.K.; Oikonomou, E.; Mourouzis, K.; et al. Mitochondria and cardiovascular diseases—From pathophysiology to treatment. Ann. Transl. Med. 2018, 6, 18. [Google Scholar] [CrossRef] [PubMed]
- Lahera, V.; de las Heras, N.; López-Farré, A.; Manucha, W.; Ferder, L. Role of Mitochondrial Dysfunction in Hypertension and Obesity. Curr. Hypertens. Rep. 2017, 19, 11. [Google Scholar] [CrossRef] [PubMed]
- Forrester, S.J.; Preston, K.J.; Cooper, H.A.; Boyer, M.J.; Escoto, K.M.; Poltronetti, A.J.; Elliott, K.J.; Kuroda, R.; Miyao, M.; Sesaki, H.; et al. Mitochondrial Fission Mediates Endothelial Inflammation. Hypertension 2020, 76, 267–276. [Google Scholar] [CrossRef] [PubMed]
- Kurakula, K.; Smolders, V.; Tura-Ceide, O.; Jukema, J.W.; Quax, P.H.A.; Goumans, M.J. Endothelial Dysfunction in Pulmonary Hypertension: Cause or Consequence? Biomedicines 2021, 9, 57. [Google Scholar] [CrossRef] [PubMed]
- Sakao, S.; Tatsumi, K.; Voelkel, N.F. Endothelial cells and pulmonary arterial hypertension: Apoptosis, proliferation, interaction and transdifferentiation. Respir. Res. 2009, 10, 95. [Google Scholar] [CrossRef]
- Martin, P.; Shirihai, S.O.; Gentil, G.B.; Yan, B. Mitochondrial morphology transitions and functions: Implications for retrograde signaling? Am. J. Physiol. -Regul. Integr. Comp. Physiol. 2013, 304, R393–R406. [Google Scholar] [CrossRef]
- Chen, H.; Chomyn, A.; Chan, D.C. Disruption of fusion results in mitochondrial heterogeneity and dysfunction. J. Biol. Chem. 2005, 280, 26185–26192. [Google Scholar] [CrossRef]
- Das, R.; Chakrabarti, O. Mitochondrial hyperfusion: A friend or a foe. Biochem. Soc. Trans. 2020, 48, 631–644. [Google Scholar] [CrossRef]
- Lebeau, J.; Saunders, J.M.; Moraes, V.W.R.; Madhavan, A.; Madrazo, N.; Anthony, M.C.; Wiseman, R.L. The PERK Arm of the Unfolded Protein Response Regulates Mitochondrial Morphology during Acute Endoplasmic Reticulum Stress. Cell Rep. 2018, 22, 2827–2836. [Google Scholar] [CrossRef] [PubMed]
- Tondera, D.; Grandemange, S.; Jourdain, A.; Karbowski, M.; Mattenberger, Y.; Herzig, S.; Da Cruz, S.; Clerc, P.; Raschke, I.; Merkwirth, C.; et al. SLP-2 is required for stress-induced mitochondrial hyperfusion. Embo J. 2009, 28, 1589–1600. [Google Scholar] [CrossRef] [PubMed]
- Santel, A.; Fuller, M.T. Control of mitochondrial morphology by a human mitofusin. J. Cell Sci. 2001, 114, 867–874. [Google Scholar] [CrossRef] [PubMed]
- Ishihara, N.; Eura, Y.; Mihara, K. Mitofusin 1 and 2 play distinct roles in mitochondrial fusion reactions via GTPase activity. J. Cell Sci. 2004, 117, 6535–6546. [Google Scholar] [CrossRef] [PubMed]
- Ishihara, N.; Fujita, Y.; Oka, T.; Mihara, K. Regulation of mitochondrial morphology through proteolytic cleavage of OPA1. Embo J. 2006, 25, 2966–2977. [Google Scholar] [CrossRef] [PubMed]
- Cartoni, R.; Léger, B.; Hock, M.B.; Praz, M.; Crettenand, A.; Pich, S.; Ziltener, J.L.; Luthi, F.; Dériaz, O.; Zorzano, A.; et al. Mitofusins 1/2 and ERRalpha expression are increased in human skeletal muscle after physical exercise. J. Physiol. 2005, 567, 349–358. [Google Scholar] [CrossRef] [PubMed]
- Chen, H.; Detmer, S.A.; Ewald, A.J.; Griffin, E.E.; Fraser, S.E.; Chan, D.C. Mitofusins Mfn1 and Mfn2 coordinately regulate mitochondrial fusion and are essential for embryonic development. J. Cell Biol. 2003, 160, 189–200. [Google Scholar] [CrossRef]
- Misko, A.; Jiang, S.; Wegorzewska, I.; Milbrandt, J.; Baloh, R.H. Mitofusin 2 is necessary for transport of axonal mitochondria and interacts with the Miro/Milton complex. J. Neurosci. 2010, 30, 4232–4240. [Google Scholar] [CrossRef]
- Dromparis, P.; Sutendra, G.; Michelakis, E.D. The role of mitochondria in pulmonary vascular remodeling. J. Mol. Med. 2010, 88, 1003–1010. [Google Scholar] [CrossRef]
- Li, Y.; Yin, R.; Liu, J.; Wang, P.; Wu, S.; Luo, J.; Zhelyabovska, O.; Yang, Q. Peroxisome proliferator-activated receptor delta regulates mitofusin 2 expression in the heart. J. Mol. Cell Cardiol. 2009, 46, 876–882. [Google Scholar] [CrossRef]
- Mattson, M.P.; Kroemer, G. Mitochondria in cell death: Novel targets for neuroprotection and cardioprotection. Trends Mol. Med. 2003, 9, 196–205. [Google Scholar] [CrossRef] [PubMed]
- Zhang, D.; Ma, C.; Li, S.; Ran, Y.; Chen, J.; Lu, P.; Shi, S.; Zhu, D. Effect of Mitofusin 2 on smooth muscle cells proliferation in hypoxic pulmonary hypertension. Microvasc. Res. 2012, 84, 286–296. [Google Scholar] [CrossRef] [PubMed]
- Chen, L.; Liu, B.; Qin, Y.; Li, A.; Gao, M.; Liu, H.; Gong, G. Mitochondrial Fusion Protein Mfn2 and Its Role in Heart Failure. Front. Mol. Biosci. 2021, 8, 681237. [Google Scholar] [CrossRef] [PubMed]
- Nolfi-Donegan, D.; Braganza, A.; Shiva, S. Mitochondrial electron transport chain: Oxidative phosphorylation, oxidant production, and methods of measurement. Redox Biol. 2020, 37, 101674. [Google Scholar] [CrossRef] [PubMed]
- McCommis, K.S.; Finck, B.N. Mitochondrial pyruvate transport: A historical perspective and future research directions. Biochem. J. 2015, 466, 443–454. [Google Scholar] [CrossRef]
- Xie, N.; Zhang, L.; Gao, W.; Huang, C.; Huber, P.E.; Zhou, X.; Li, C.; Shen, G.; Zou, B. NAD+ metabolism: Pathophysiologic mechanisms and therapeutic potential. Signal Transduct. Target. Ther. 2020, 5, 227. [Google Scholar] [CrossRef]
- Xu, W.; Erzurum, S.C. Endothelial cell energy metabolism, proliferation, and apoptosis in pulmonary hypertension. Compr. Physiol. 2011, 1, 357–372. [Google Scholar] [CrossRef]
- Xu, W.; Koeck, T.; Lara, A.R.; Neumann, D.; DiFilippo, F.P.; Koo, M.; Janocha, A.J.; Masri, F.A.; Arroliga, A.C.; Jennings, C.; et al. Alterations of cellular bioenergetics in pulmonary artery endothelial cells. Proc. Natl. Acad. Sci. USA 2007, 104, 1342–1347. [Google Scholar] [CrossRef]
- Hernandez-Saavedra, D.; Sanders, L.; Freeman, S.; Reisz, J.A.; Lee, M.H.; Mickael, C.; Kumar, R.; Kassa, B.; Gu, S.; D’ Alessandro, A.; et al. Stable isotope metabolomics of pulmonary artery smooth muscle and endothelial cells in pulmonary hypertension and with TGF-beta treatment. Sci. Rep. 2020, 10, 413. [Google Scholar] [CrossRef]
- Zhao, Y.; Peng, J.; Lu, C.; Hsin, M.; Mura, M.; Wu, L.; Chu, L.; Zamel, R.; Machuca, T.; Waddell, T.; et al. Metabolomic heterogeneity of pulmonary arterial hypertension. PLoS ONE 2014, 9, e88727. [Google Scholar] [CrossRef]
- Xu, W.; Comhair, S.A.A.; Chen, R.; Hu, B.; Hou, Y.; Zhou, Y.; Mavrakis, L.A.; Janocha, A.J.; Li, L.; Zhang, D.; et al. Integrative proteomics and phosphoproteomics in pulmonary arterial hypertension. Sci. Rep. 2019, 9, 18623. [Google Scholar] [CrossRef] [PubMed]
- Chen, C.; Luo, F.; Wu, P.; Huang, Y.; Das, A.; Chen, S.; Chen, J.; Hu, X.; Li, F.; Fang, Z.; et al. Metabolomics reveals metabolite changes of patients with pulmonary arterial hypertension in China. J. Cell Mol. Med. 2020, 24, 2484–2496. [Google Scholar] [CrossRef] [PubMed]
- Archer, S.L.; Gomberg-Maitland, M.; Maitland, M.L.; Rich, S.; Garcia, J.G.N.; Weir, E.K. Mitochondrial metabolism, redox signaling, and fusion: A mitochondria-ROS-HIF-1α-Kv1.5 O2-sensing pathway at the intersection of pulmonary hypertension and cancer. Am. J. Physiol.-Heart Circ. Physiol. 2008, 294, H570–H578. [Google Scholar] [CrossRef] [PubMed]
- Huetsch, J.C.; Suresh, K.; Bernier, M.; Shimoda, L.A. Update on novel targets and potential treatment avenues in pulmonary hypertension. Am. J. Physiol.-Lung Cell. Mol. Physiol. 2016, 311, L811–L831. [Google Scholar] [CrossRef] [PubMed]
- Paulin, R.; Meloche, J.; Bonnet, S. STAT3 signaling in pulmonary arterial hypertension. Jakstat 2012, 1, 223–233. [Google Scholar] [CrossRef] [PubMed]
- Pugliese, S.C.; Poth, J.M.; Fini, M.A.; Olschewski, A.; Kasmi, K.C.E.; Stenmark, K.R. The role of inflammation in hypoxic pulmonary hypertension: From cellular mechanisms to clinical phenotypes. Am. J. Physiol.-Lung Cell. Mol. Physiol. 2015, 308, L229–L252. [Google Scholar] [CrossRef] [PubMed]
- Schumacker, P.T.; Gillespie, M.N.; Nakahira, K.; Choi, A.M.K.; Crouser, E.D.; Piantadosi, C.A.; Bhattacharya, J. Mitochondria in lung biology and pathology: More than just a powerhouse. Am. J. Physiol.-Lung Cell. Mol. Physiol. 2014, 306, L962–L974. [Google Scholar] [CrossRef]
- Ryanto, G.R.T.; Suraya, R.; Nagano, T. Mitochondrial Dysfunction in Pulmonary Hypertension. Antioxidants 2023, 12, 372. [Google Scholar] [CrossRef]
- Lu, Q.; Sun, X.; Yegambaram, M.; Ornatowski, W.; Wu, X.; Wang, H.; Garcia-Flores, A.; Da Silva, V.; Zemskov, E.A.; Tang, H.; et al. Nitration-mediated activation of the small GTPase RhoA stimulates cellular glycolysis through enhanced mitochondrial fission. J. Biol. Chem. 2023, 299, 103067. [Google Scholar] [CrossRef]
- Ryan, J.J.; Marsboom, G.; Fang, Y.H.; Toth, P.T.; Morrow, E.; Luo, N.; Piao, L.; Hong, Z.; Ericson, K.; Zhang, H.J.; et al. PGC1α-mediated mitofusin-2 deficiency in female rats and humans with pulmonary arterial hypertension. Am. J. Respir. Crit. Care Med. 2013, 187, 865–878. [Google Scholar] [CrossRef]
- Lu, Z.; Li, S.; Zhao, S.; Fa, X. Upregulated miR-17 Regulates Hypoxia-Mediated Human Pulmonary Artery Smooth Muscle Cell Proliferation and Apoptosis by Targeting Mitofusin 2. Med. Sci. Monit. 2016, 22, 3301–3308. [Google Scholar] [CrossRef] [PubMed]
- Xia, J.; Wishart, D.S. Metabolomic Data Processing, Analysis, and Interpretation Using MetaboAnalyst. Curr. Protoc. Bioinform. 2011, 34, 14.10.1–14.10.48. [Google Scholar] [CrossRef] [PubMed]
- Sun, X.; Kumar, S.; Sharma, S.; Aggarwal, S.; Lu, Q.; Gross, C.; Rafikova, O.; Lee, S.G.; Dasarathy, S.; Hou, Y.; et al. Endothelin-1 induces a glycolytic switch in pulmonary arterial endothelial cells via the mitochondrial translocation of endothelial nitric oxide synthase. Am. J. Respir. Cell Mol. Biol. 2014, 50, 1084–1095. [Google Scholar] [CrossRef] [PubMed]
- Budhiraja, R.; Tuder, R.M.; Hassoun, P.M. Endothelial Dysfunction in Pulmonary Hypertension. Circulation 2004, 109, 159–165. [Google Scholar] [CrossRef] [PubMed]
- Ranchoux, B.; Harvey, L.D.; Ayon, R.J.; Babicheva, A.; Bonnet, S.; Chan, S.Y.; Yuan, J.X.J.; Perez, V.d.J. Endothelial dysfunction in pulmonary arterial hypertension: An evolving landscape (2017 Grover Conference Series). Pulm. Circ. 2018, 8, 2045893217752912. [Google Scholar] [CrossRef] [PubMed]
- Ryan, J.; Dasgupta, A.; Huston, J.; Chen, K.-H.; Archer, S.L. Mitochondrial dynamics in pulmonary arterial hypertension. J. Mol. Med. 2015, 93, 229–242. [Google Scholar] [CrossRef] [PubMed]
- Marsboom, G.; Toth, P.T.; Ryan, J.J.; Hong, Z.; Wu, X.; Fang, Y.-H.; Thenappan, T.; Piao, L.; Zhang, H.J.; Pogoriler, J.; et al. Dynamin-Related Protein 1 Mediated Mitochondrial Mitotic Fission Permits Hyperproliferation of Vascular Smooth Muscle Cells and Offers a Novel Therapeutic Target in Pulmonary Hypertension. Circ. Res. 2012, 110, 1484–1497. [Google Scholar] [CrossRef]
- Luo, F.; Fu, M.; Wang, T.; Qi, Y.; Zhong, X.; Li, D.; Liu, B. Down-regulation of the mitochondrial fusion protein Opa1/Mfn2 promotes cardiomyocyte hypertrophy in Su5416/hypoxia-induced pulmonary hypertension rats. Arch. Biochem. Biophys. 2023, 747, 109743. [Google Scholar] [CrossRef]
- Xiong, W.; Ma, Z.; An, D.; Liu, Z.; Cai, W.; Bai, Y.; Zhan, Q.; Lai, W.; Zeng, Q.; Ren, H.; et al. Mitofusin 2 Participates in Mitophagy and Mitochondrial Fusion Against Angiotensin II-Induced Cardiomyocyte Injury. Front. Physiol. 2019, 10, 411. [Google Scholar] [CrossRef]
- Sebastián, D.; Sorianello, E.; Segalés, J.; Irazoki, A.; Ruiz-Bonilla, V.; Sala, D.; Planet, E.; Berenguer-Llergo, A.; Muñoz, J.P.; Sánchez-Feutrie, M.; et al. Mfn2 deficiency links age-related sarcopenia and impaired autophagy to activation of an adaptive mitophagy pathway. EMBO J. 2016, 35, 1677–1693. [Google Scholar] [CrossRef]
- Lugus, J.J.; Ngoh, G.A.; Bachschmid, M.M.; Walsh, K. Mitofusins are required for angiogenic function and modulate different signaling pathways in cultured endothelial cells. J. Mol. Cell Cardiol. 2011, 51, 885–893. [Google Scholar] [CrossRef] [PubMed]
- Archer, S.L. Pyruvate Kinase and Warburg Metabolism in Pulmonary Arterial Hypertension: Uncoupled Glycolysis and the Cancer-Like Phenotype of Pulmonary Arterial Hypertension. Circulation 2017, 136, 2486–2490. [Google Scholar] [CrossRef] [PubMed]
- Rai, P.R.; Cool, C.D.; King, J.A.; Stevens, T.; Burns, N.; Winn, R.A.; Kasper, M.; Voelkel, N.F. The cancer paradigm of severe pulmonary arterial hypertension. Am. J. Respir. Crit. Care Med. 2008, 178, 558–564. [Google Scholar] [CrossRef] [PubMed]
- Sharma, S.; Sud, N.; Wiseman, D.A.; Carter, A.L.; Kumar, S.; Hou, Y.; Rau, T.; Wilham, J.; Harmon, C.; Oishi, P.; et al. Altered carnitine homeostasis is associated with decreased mitochondrial function and altered nitric oxide signaling in lambs with pulmonary hypertension. Am. J. Physiol. Lung Cell. Mol. Physiol. 2008, 294, L46–L56. [Google Scholar] [CrossRef] [PubMed]
- Sharma, S.; Aramburo, A.; Rafikov, R.; Sun, X.; Kumar, S.; Oishi, P.E.; Datar, S.A.; Raff, G.; Xoinis, K.; Kalkan, G.; et al. L-carnitine preserves endothelial function in a lamb model of increased pulmonary blood flow. Pediatr. Res. 2013, 74, 39–47. [Google Scholar] [CrossRef] [PubMed]
- Martínez-Reyes, I.; Chandel, N.S. Mitochondrial TCA cycle metabolites control physiology and disease. Nat. Commun. 2020, 11, 102. [Google Scholar] [CrossRef] [PubMed]
- Zhang, R.; Yang, A.; Zhang, L.; He, L.; Gu, X.; Yu, C.; Lu, Z.; Wang, C.; Zhou, F.; Li, F.; et al. MFN2 deficiency promotes cardiac response to hypobaric hypoxia by reprogramming cardiomyocyte metabolism. Acta Physiol. 2023, 239, e14018. [Google Scholar] [CrossRef]
- Paulin, R.; Michelakis, E.D. The metabolic theory of pulmonary arterial hypertension. Circ. Res. 2014, 115, 148–164. [Google Scholar] [CrossRef]
- Luo, N.; Yue, F.; Jia, Z.; Chen, J.; Deng, Q.; Zhao, Y.; Kuang, S. Reduced electron transport chain complex I protein abundance and function in Mfn2-deficient myogenic progenitors lead to oxidative stress and mitochondria swelling. FASEB J. 2021, 35, e21426. [Google Scholar] [CrossRef]
- Keith, B.; Johnson, R.S.; Simon, M.C. HIF1alpha and HIF2alpha: Sibling rivalry in hypoxic tumour growth and progression. Nat. Rev. Cancer 2011, 12, 9–22. [Google Scholar] [CrossRef]
- Semenza, G.L. HIF-1 mediates metabolic responses to intratumoral hypoxia and oncogenic mutations. J. Clin. Investig. 2013, 123, 3664–3671. [Google Scholar] [CrossRef] [PubMed]
- Fijalkowska, I.; Xu, W.; Comhair, S.A.; Janocha, A.J.; Mavrakis, L.A.; Krishnamachary, B.; Zhen, L.; Mao, T.; Richter, A.; Erzurum, S.C.; et al. Hypoxia inducible-factor1alpha regulates the metabolic shift of pulmonary hypertensive endothelial cells. Am. J. Pathol. 2010, 176, 1130–1138. [Google Scholar] [CrossRef] [PubMed]
- Huang, X.; Zhao, L.; Peng, R. Hypoxia-Inducible Factor 1 and Mitochondria: An Intimate Connection. Biomolecules 2023, 13, 50. [Google Scholar] [CrossRef] [PubMed]
- Chandel, N.S.; McClintock, D.S.; Feliciano, C.E.; Wood, T.M.; Melendez, J.A.; Rodriguez, A.M.; Schumacker, P.T. Reactive Oxygen Species Generated at Mitochondrial Complex III Stabilize Hypoxia-inducible Factor-1α during Hypoxia: A MECHANISM OF O2 SENSING *. J. Biol. Chem. 2000, 275, 25130–25138. [Google Scholar] [CrossRef]
- Cracowski, J.L.; Cracowski, C.; Bessard, G.; Pepin, J.L.; Bessard, J.; Schwebel, C.; Stanke-Labesque, F.; Pison, C. Increased lipid peroxidation in patients with pulmonary hypertension. Am. J. Respir. Crit. Care Med. 2001, 164, 1038–1042. [Google Scholar] [CrossRef] [PubMed]
- Irodova, N.L.; Lankin, V.Z.; Konovalova, G.K.; Kochetov, A.G.; Chazova, I.E. Oxidative stress in patients with primary pulmonary hypertension. Bull. Exp. Biol. Med. 2002, 133, 580–582. [Google Scholar] [CrossRef] [PubMed]
- Bowers, R.; Cool, C.; Murphy, R.C.; Tuder, R.M.; Hopken, M.W.; Flores, S.C.; Voelkel, N.F. Oxidative stress in severe pulmonary hypertension. Am. J. Respir. Crit. Care Med. 2004, 169, 764–769. [Google Scholar] [CrossRef]
- Nukala, S.B.; Tura-Ceide, O.; Aldini, G.; Smolders, V.F.E.D.; Blanco, I.; Peinado, V.I.; Castellà, M.; Barberà, J.A.; Altomare, A.; Baron, G.; et al. Protein network analyses of pulmonary endothelial cells in chronic thromboembolic pulmonary hypertension. Sci. Rep. 2021, 11, 5583. [Google Scholar] [CrossRef]
- Guo, D.; Gu, J.; Jiang, H.; Ahmed, A.; Zhang, Z.; Gu, Y. Inhibition of pyruvate kinase M2 by reactive oxygen species contributes to the development of pulmonary arterial hypertension. J. Mol. Cell Cardiol. 2016, 91, 179–187. [Google Scholar] [CrossRef]
- Yu, T.; Wang, L.; Zhang, L.; Deuster, P.A. Mitochondrial Fission as a Therapeutic Target for Metabolic Diseases: Insights into Antioxidant Strategies. Antioxidants 2023, 12, 1163. [Google Scholar] [CrossRef]
- Tur, J.; Pereira-Lopes, S.; Vico, T.; Marín, E.A.; Muñoz, J.P.; Hernández-Alvarez, M.; Cardona, P.J.; Zorzano, A.; Lloberas, J.; Celada, A. Mitofusin 2 in Macrophages Links Mitochondrial ROS Production, Cytokine Release, Phagocytosis, Autophagy, and Bactericidal Activity. Cell Rep. 2020, 32, 108079. [Google Scholar] [CrossRef] [PubMed]
- Franco, A.; Dang, X.; Walton, E.K.; Ho, J.N.; Zablocka, B.; Ly, C.; Miller, T.M.; Baloh, R.H.; Shy, M.E.; Yoo, A.S.; et al. Burst mitofusin activation reverses neuromuscular dysfunction in murine CMT2A. Elife 2020, 9, e61119. [Google Scholar] [CrossRef] [PubMed]
- Wedgwood, S.; Mitchell, C.J.; Fineman, J.R.; Black, S.M. Developmental differences in the shear stress-induced expression of endothelial NO synthase: Changing role of AP-1. Am. J. Physiol. Lung Cell. Mol. Physiol. 2003, 284, L650–L662. [Google Scholar] [CrossRef] [PubMed]
- Kelly, L.K.; Wedgwood, S.; Steinhorn, R.H.; Black, S.M. Nitric oxide decreases endothelin-1 secretion through the activation of soluble guanylate cyclase. Am. J. Physiol. Lung Cell. Mol. Physiol. 2004, 286, L984–L991. [Google Scholar] [CrossRef] [PubMed]
- He, H.; Shi, X.; Lawrence, A.; Hrovat, J.; Turner, C.; Cui, J.Y.; Gu, H. 2,2′,4,4′-tetrabromodiphenyl ether (BDE-47) induces wide metabolic changes including attenuated mitochondrial function and enhanced glycolysis in PC12 cells. Ecotoxicol. Environ. Saf. 2020, 201, 110849. [Google Scholar] [CrossRef] [PubMed]
- Shi, X.; Xi, B.; Jasbi, P.; Turner, C.; Jin, Y.; Gu, H. Comprehensive Isotopic Targeted Mass Spectrometry: Reliable Metabolic Flux Analysis with Broad Coverage. Anal. Chem. 2020, 92, 11728–11738. [Google Scholar] [CrossRef] [PubMed]
- Jasbi, P.; Mitchell, N.M.; Shi, X.; Grys, T.E.; Wei, Y.; Liu, L.; Lake, D.F.; Gu, H. Coccidioidomycosis Detection Using Targeted Plasma and Urine Metabolic Profiling. J. Proteome Res. 2019, 18, 2791–2802. [Google Scholar] [CrossRef]
- Pang, Z.; Zhou, G.; Ewald, J.; Chang, L.; Hacariz, O.; Basu, N.; Xia, J. Using MetaboAnalyst 5.0 for LC–HRMS spectra processing, multi-omics integration and covariate adjustment of global metabolomics data. Nat. Protoc. 2022, 17, 1735–1761. [Google Scholar] [CrossRef]
- Rocha, A.G.; Franco, A.; Krezel, A.M.; Rumsey, J.M.; Alberti, J.M.; Knight, W.C.; Biris, N.; Zacharioudakis, E.; Janetka, J.W.; Baloh, R.H.; et al. MFN2 agonists reverse mitochondrial defects in preclinical models of Charcot-Marie-Tooth disease type 2A. Science 2018, 360, 336–341. [Google Scholar] [CrossRef]
- Millard, P.; Letisse, F.; Sokol, S.; Portais, J.-C. IsoCor: Correcting MS data in isotope labeling experiments. Bioinformatics 2012, 28, 1294–1296. [Google Scholar] [CrossRef]


Disclaimer/Publisher’s Note: The statements, opinions and data contained in all publications are solely those of the individual author(s) and contributor(s) and not of MDPI and/or the editor(s). MDPI and/or the editor(s) disclaim responsibility for any injury to people or property resulting from any ideas, methods, instructions or products referred to in the content. |
© 2023 by the authors. Licensee MDPI, Basel, Switzerland. This article is an open access article distributed under the terms and conditions of the Creative Commons Attribution (CC BY) license (https://creativecommons.org/licenses/by/4.0/).
Share and Cite
Yegambaram, M.; Sun, X.; Flores, A.G.; Lu, Q.; Soto, J.; Richards, J.; Aggarwal, S.; Wang, T.; Gu, H.; Fineman, J.R.; et al. Novel Relationship between Mitofusin 2-Mediated Mitochondrial Hyperfusion, Metabolic Remodeling, and Glycolysis in Pulmonary Arterial Endothelial Cells. Int. J. Mol. Sci. 2023, 24, 17533. https://doi.org/10.3390/ijms242417533
Yegambaram M, Sun X, Flores AG, Lu Q, Soto J, Richards J, Aggarwal S, Wang T, Gu H, Fineman JR, et al. Novel Relationship between Mitofusin 2-Mediated Mitochondrial Hyperfusion, Metabolic Remodeling, and Glycolysis in Pulmonary Arterial Endothelial Cells. International Journal of Molecular Sciences. 2023; 24(24):17533. https://doi.org/10.3390/ijms242417533
Chicago/Turabian StyleYegambaram, Manivannan, Xutong Sun, Alejandro Garcia Flores, Qing Lu, Jamie Soto, Jaime Richards, Saurabh Aggarwal, Ting Wang, Haiwei Gu, Jeffrey R. Fineman, and et al. 2023. "Novel Relationship between Mitofusin 2-Mediated Mitochondrial Hyperfusion, Metabolic Remodeling, and Glycolysis in Pulmonary Arterial Endothelial Cells" International Journal of Molecular Sciences 24, no. 24: 17533. https://doi.org/10.3390/ijms242417533