Article

Improved 2,3-Butanediol Production Rate of Metabolically Engineered Saccharomyces cerevisiae by Deletion of RIM15 and Activation of Pyruvate Consumption Pathway

1
Department of Bioinformatics Engineering, Graduate School of Information Science and Technology, Osaka University, 1-5 Yamadaoka, Suita 565-0871, Osaka, Japan
2
Division of Metabolomics/Mass Spectrometry Center, Medical Research Center for High Depth Omics, Medical Institute of Bioregulation, Kyushu University, 3-1-1 Maidashi, Higashi-ku, Fukuoka 812-8582, Fukuoka, Japan
3
Graduate School of Science, Technology and Innovation, Kobe University, 1-1 Rokkodai, Nada, Kobe 657-8501, Hyogo, Japan
*
Author to whom correspondence should be addressed.
Int. J. Mol. Sci. 2023, 24(22), 16378; https://doi.org/10.3390/ijms242216378
Submission received: 29 September 2023 / Revised: 31 October 2023 / Accepted: 11 November 2023 / Published: 15 November 2023
(This article belongs to the Special Issue Gaze into the Abyss of Energy Metabolism)

Abstract

:
Saccharomyces cerevisiae is a promising host for the bioproduction of higher alcohols, such as 2,3-butanediol (2,3-BDO). Metabolically engineered S. cerevisiae strains that produce 2,3-BDO via glycolysis have been constructed. However, the specific 2,3-BDO production rates of engineered strains must be improved. To identify approaches to improving the 2,3-BDO production rate, we investigated the factors contributing to higher ethanol production rates in certain industrial strains of S. cerevisiae compared to laboratory strains. Sequence analysis of 11 industrial strains revealed the accumulation of many nonsynonymous substitutions in RIM15, a negative regulator of high fermentation capability. Comparative metabolome analysis suggested a positive correlation between the rate of ethanol production and the activity of the pyruvate-consuming pathway. Based on these findings, RIM15 was deleted, and the pyruvate-consuming pathway was activated in YHI030, a metabolically engineered S. cerevisiae strain that produces 2,3-BDO. The titer, specific production rate, and yield of 2,3-BDO in the test tube-scale culture using the YMS106 strain reached 66.4 ± 4.4 mM, 1.17 ± 0.017 mmol (g dry cell weight h)−1, and 0.70 ± 0.03 mol (mol glucose consumed)−1. These values were 2.14-, 2.92-, and 1.81-fold higher than those of the vector control, respectively. These results suggest that bioalcohol production via glycolysis can be enhanced in a metabolically engineered S. cerevisiae strain by deleting RIM15 and activating the pyruvate-consuming pathway.

1. Introduction

Saccharomyces cerevisiae is a promising host for the bioproduction of higher alcohols, such as 2,3-butanediol (2,3-BDO) [1,2,3]. 2,3-BDO bioproduction by S. cerevisiae has garnered notable interest owing to its versatility as a raw material for pharmaceuticals, cosmetic intermediates, and various high-value chemicals [4,5]. Moreover, 1,3-butadiene can be synthesized from 2,3-BDO through dehydration and serves as a precursor for both synthetic rubber and liquid fuels [2,6]. In S. cerevisiae, the Embden–Meyerhof pathway catabolizes glucose to pyruvate. The Ehrlich pathway converts pyruvate to ethanol via pyruvate decarboxylase (PDC) and alcohol dehydrogenase (ADH). Metabolically engineered S. cerevisiae strains that produce 2,3-BDO were constructed by introducing an artificial three-step pathway from pyruvate to 2,3-BDO [6,7,8,9,10,11,12,13,14]. In addition, 2,3-BDO production is elevated by disrupting competing pathways and solving the cofactor imbalance [6,7,8,9,10,11,12,13,14,15,16,17]. Fed-batch cultivation of the most advanced strains achieved 2,3-BDO production with very high titers [8,9]. However, the 2,3-BDO production rates of these engineered strains were less than one-tenth of the specific ethanol production rates of non-engineered S. cerevisiae [7,9,13].
To identify approaches for improving the 2,3-BDO production rate, we focused on the fact that some industrial strains of S. cerevisiae exhibit higher ethanol production rates than laboratory strains [15,18]. The molecular mechanisms underlying the high ethanol production rate of non-engineered industrial S. cerevisiae strains could be applied to improve the 2,3-BDO production rate of engineered strains. The high fermentation capability of industrial strains could be attributed to the activation or inactivation of some metabolic reactions in the central carbon metabolism. To identify the responsible reactions, metabolome analysis of central metabolism provides comprehensive concentration data for intracellular metabolites [19]. The metabolite concentration data are also available to calculate the Gibbs free energy change (ΔG′) levels of each reaction or pathway [20,21,22]. Target reactions for metabolic engineering can be estimated from a correlation analysis between intracellular metabolite state data and the ethanol production rate.
Furthermore, the high fermentation capability of the sake (Kyokai) strain is attributable to a loss-of-function mutation in RIM15, which encodes a protein kinase involved in cell proliferation in response to nutrients [16,17,23]. The name RIM15 was derived from “Regulator of IME2 (Inducer of MEiosis)” [24]. Additionally, ethanol fermentation by a laboratory strain was improved by deleting RIM15 [16,17]. Disruption of RIM15 may contribute to increased tolerance to heavy metals and improve the glycerol assimilation ability of S. cerevisiae [25,26]. However, the effect of the RIM15 deletion on 2,3-BDO production remains to be comprehensively investigated.
In this study, we performed a comparative analysis of 11 industrial strains of S. cerevisiae, including laboratory, sake, wine, bread, and beer strains, with different fermentation rates. Sequence analysis of RIM15 and metabolic analysis indicated that the deletion of RIM15 and activation of the pyruvate- and NADH-consuming pathways are promising strategies for improving 2,3-BDO production. These strategies were tested in a wild-type laboratory strain and implemented in a metabolically engineered strain for 2,3-BDO production. We found that RIM15 deletion and activation of the pyruvate- and NADH-consuming pathways improved the 2,3-BDO production rate.

2. Results

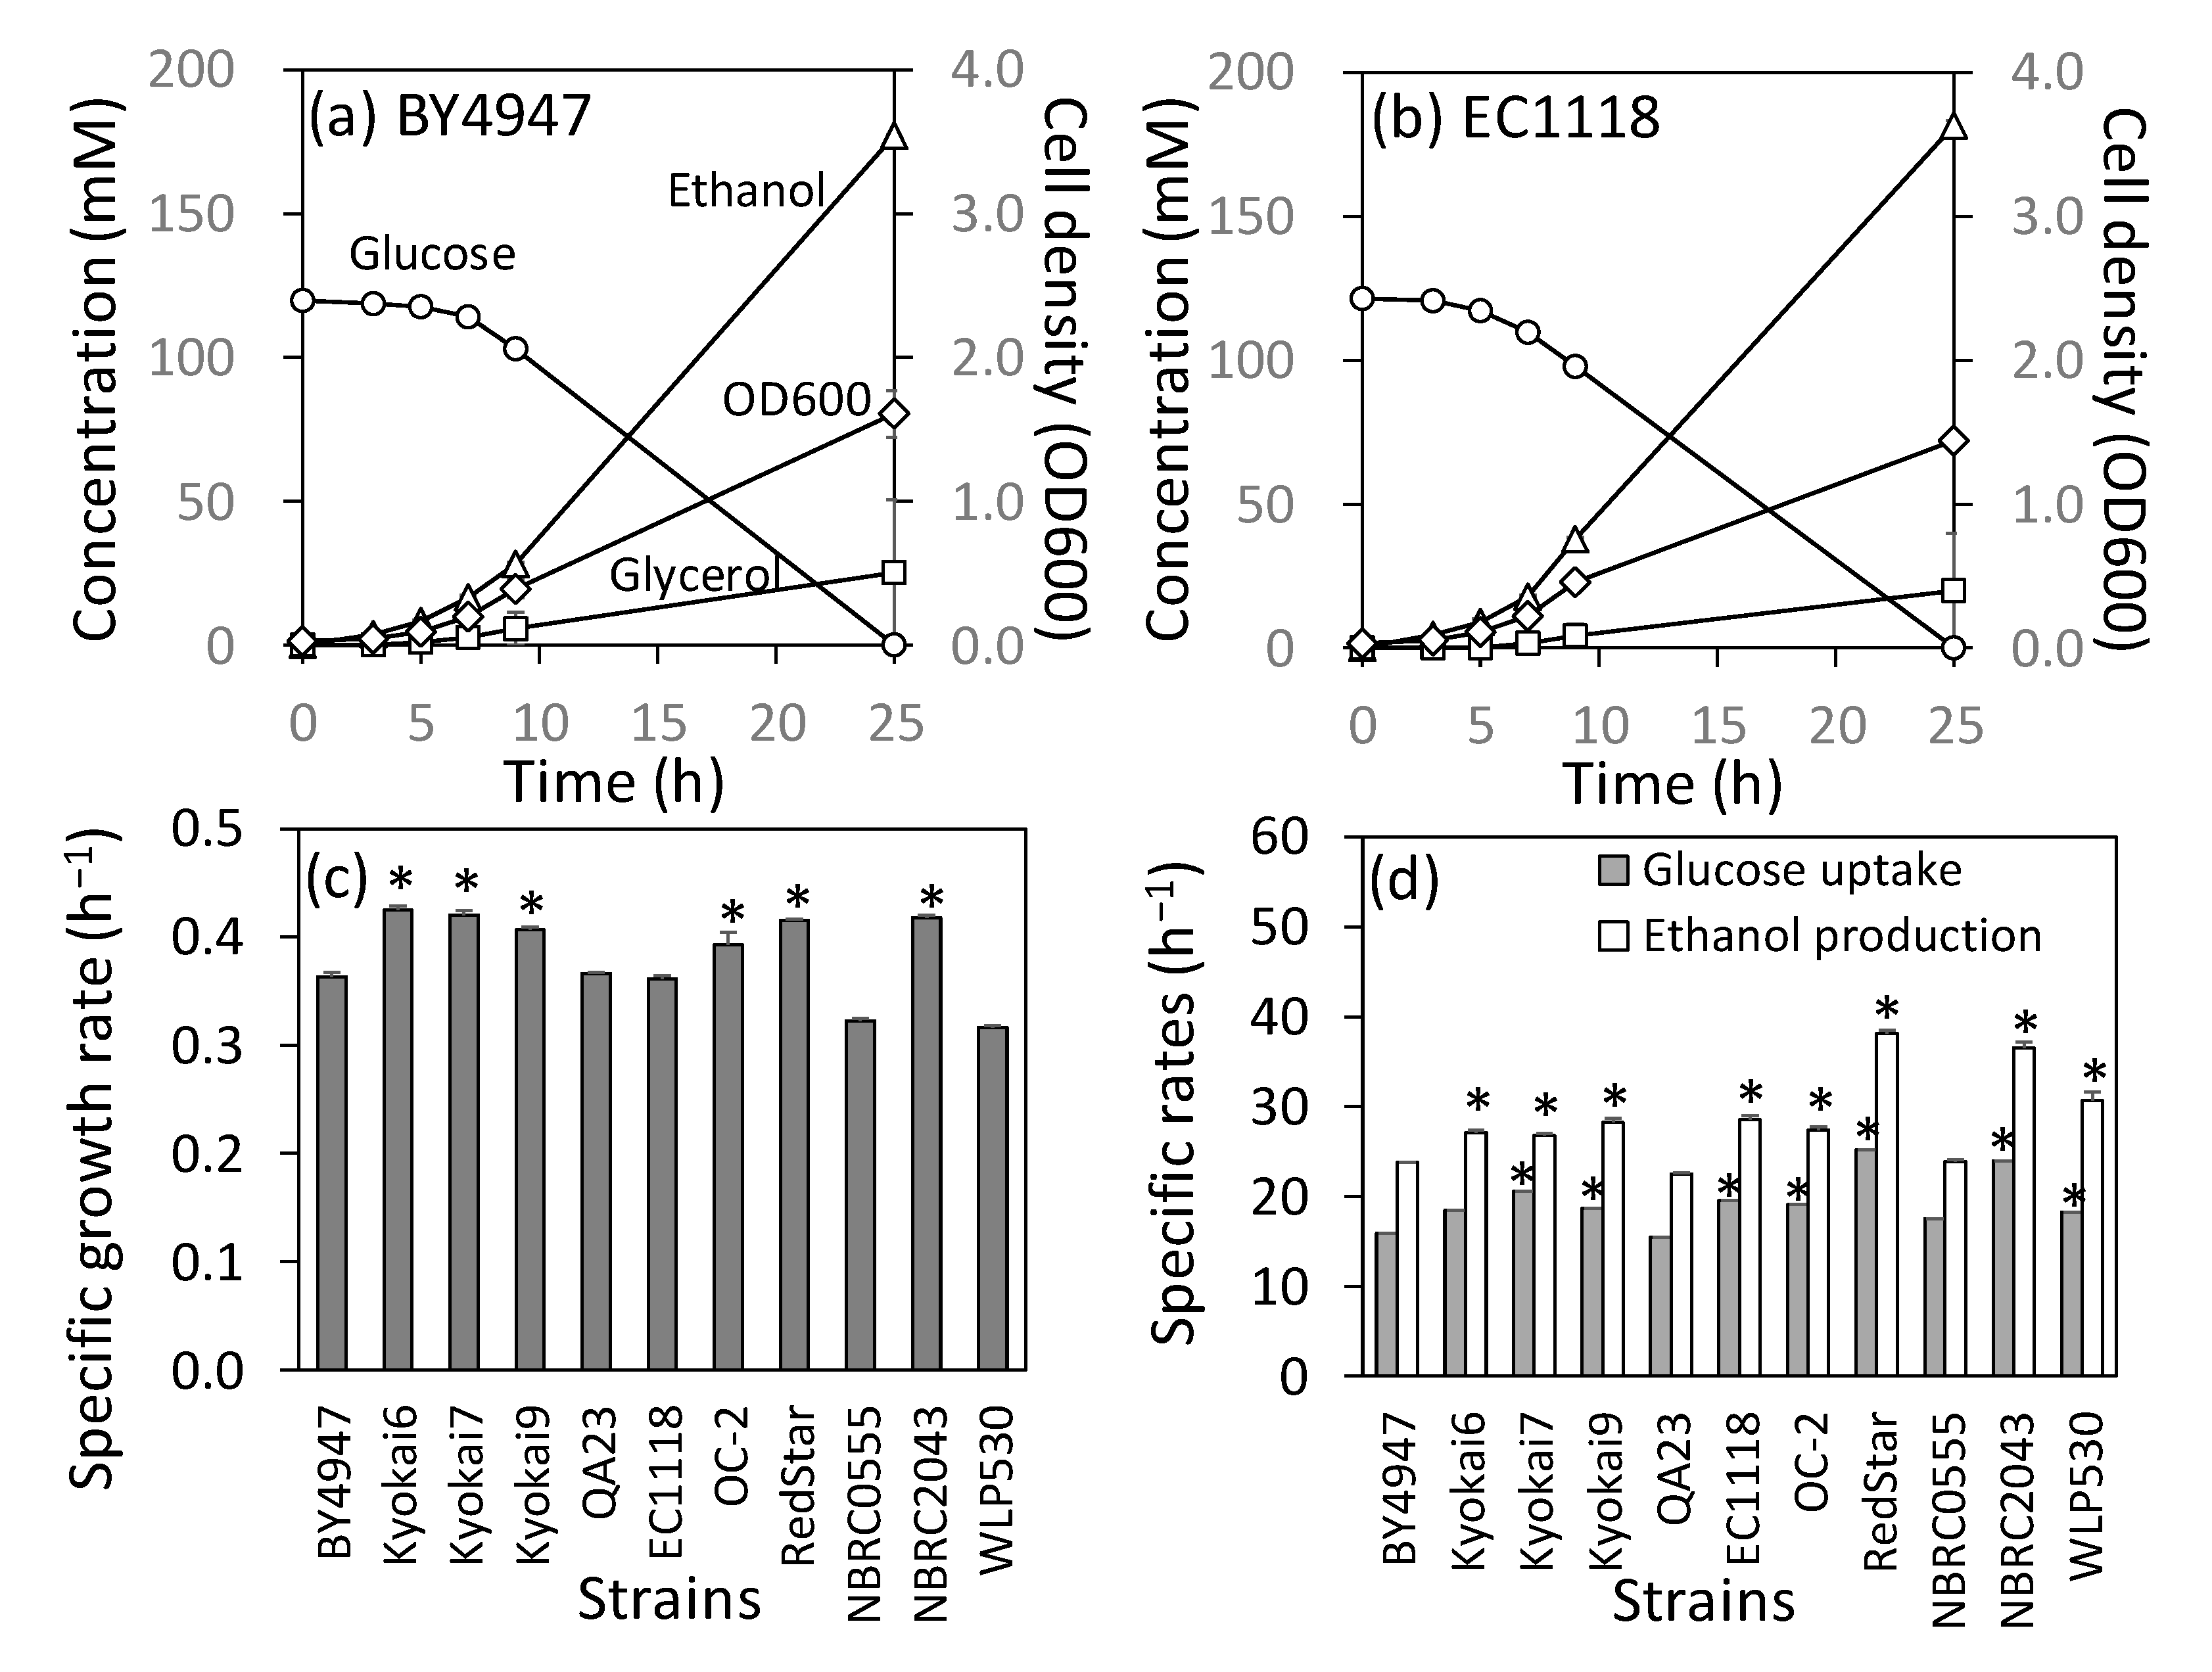
2.1. Culture Profiles and RIM15 Mutations in 11 Industrial Diploid Strains

Culture profiles of 11 industrial diploid yeast strains were obtained from flask-scale batch cultivation in a synthetic medium under aerobic conditions (Figure 1). One laboratory (BY4947, a diploid of S288C), three sake (Kyokai6, Kyokai7, and Kyokai9), three wine (QA23, EC1118, and OC-2), three bread (RedStar, NBRC0555, and NBRC2043), and one beer (WLP530) strains were used. For BY4947, exponential growth occurred 3–9 h after culture initiation (Figure 1a). The specific rates of cell growth and ethanol production were 0.363 ± 0.005 h−1 and 23.8 ± 0.1 mmol (g dry cell weight [DCW] h)−1, respectively. Figure 1b shows the culture profile of the EC1118 strain used for wine production. Glucose consumption and ethanol production of EC1118 at 3–9 h were higher than those in BY4947. The specific ethanol production rate of EC1118 was 28.5 ± 0.4 mmol (g DCW h)−1, 19% higher than that of BY4947.
A comparison of the 11 strains showed that the three sake strains (Kyokai6, Kyokai7, and Kyokai9) tended to have higher specific growth, glucose consumption, and ethanol production rates than those of BY4947 (Figure 1c,d). Other strains showed elevated specific rates of glucose consumption and ethanol production, except for QA23 and NBRC0555 (Figure 1d). However, increased specific growth rates were observed only in OC-2, RedStar, and NBRC2043 (Figure 1c). Particularly, the specific ethanol production rates of baker’s yeast, RedStar and NBRC2043, reached 38.2 ± 0.3 and 36.5 ± 0.6 mmol (g DCW h)−1, which were 160% and 153% of the rate observed for BY4947, respectively (Figure 1d). These results are generally consistent with those reported in previous studies [18].
A frameshift mutation at nucleotide position 5068 in RIM15 (named A1686fs) results in the production of defective Rim15p, leading to the high fermentation performance of Kyokai6, 7, and 9 strains [23,27]. The fermentability of a laboratory strain also improved when RIM15 was deleted [16,17]. To investigate mutations in other industrial strains, sequence analyses of RIM15 were conducted for the 11 strains. The results confirmed that RIM15 in the Kyokai6, 7, and 9 strains contained the A1686fs mutation and four nonsynonymous substitutions (Tables S1 and S2). Furthermore, the other wine, bread, and beer strains accumulated seven to nine nonsynonymous substitutions, although they did not possess the A1686fs mutation. Among them, Rim15p in the seven non-sake strains contained the E607D, T609S, and T723S substitutions (Table S2). Although further confirmatory studies are needed, the accumulation of nonsynonymous substitutions may impair Rim15p function.

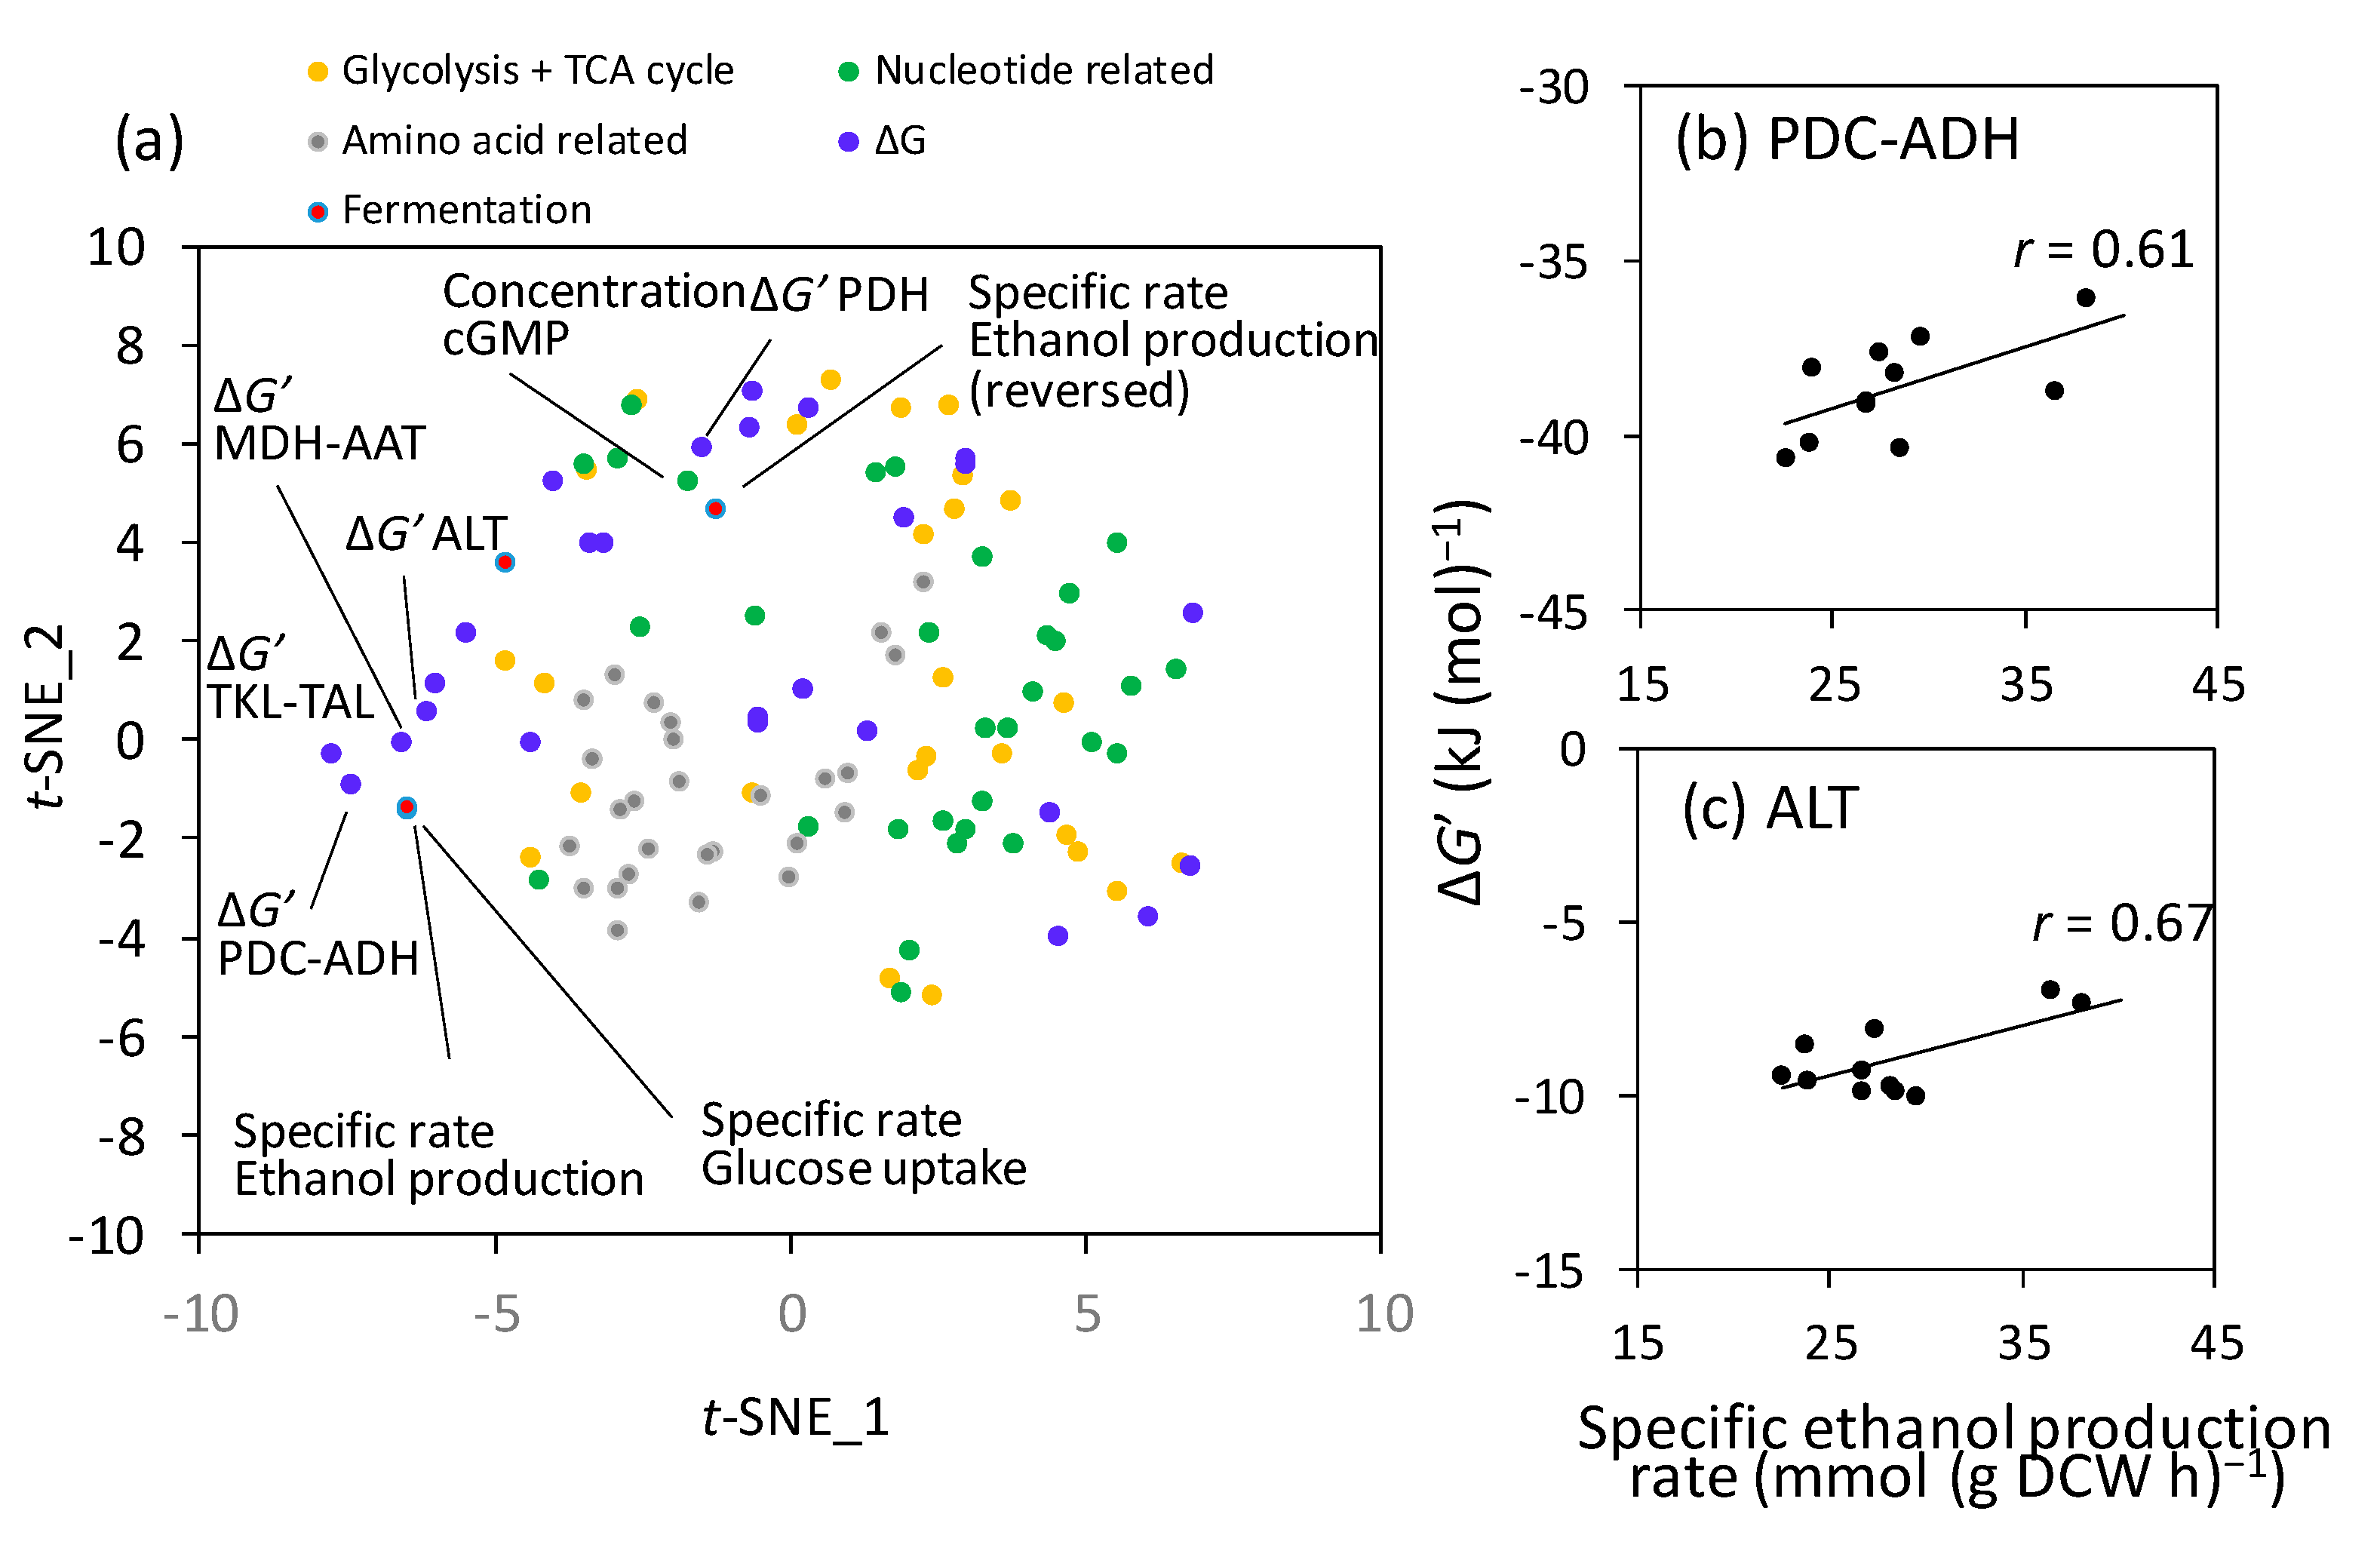
2.2. Correlation between the Intracellular Metabolite State and Ethanol Production Rate

Metabolomic analysis of intracellular metabolites was performed to examine the metabolic state shift caused by ethanol production activation. All strains were cultured under the aforementioned conditions. Metabolites were extracted from late log phase cells (optical density at 600 nm (OD600) = 1.0). Metabolite concentrations were determined using liquid chromatography-tandem mass spectrometry-based metabolome analysis using a stable isotope dilution method. The intracellular concentrations of 84 metabolites, including ATP, NADH, sugar phosphates, amino acids, and nucleic acids, were measured in the 11 strains (Data S1). Using the metabolite concentration data, changes in Gibbs free energy change (ΔG′) were calculated for 26 metabolic reactions or pathways (Data S2). The calculation was based on several assumptions, such as equal metabolite concentrations in the mitochondria and cytosol, identical intracellular and extracellular concentrations of glucose and ethanol, and fixed concentrations of phosphate and CO2 (see Materials and Methods for details).
Subsequently, a data matrix of the 84 metabolite concentrations, 26 ΔG′ values, and four specific rates was analyzed using the t-distributed stochastic neighbor embedding (t-SNE) method (Figure 2a). In addition to the specific rates of cell growth, glucose consumption, and ethanol production, the reversed specific ethanol production rate was used to detect negative correlations. The results of t-SNE showed that the specific rates of ethanol production and glucose consumption were located at very similar positions (Figure 2a), reflecting a close correlation between these rates (Figure 1d). Additionally, the ΔG′ of four pathways, namely the ΔG′(PDC-ADH), ΔG′(alanine transaminase (ALT)), ΔG′(transketolase (TKL)-transaldolase (TAL)), and ΔG′(malate dehydrogenase (MDH)-aspartate aminotransferase (AAT)), were close to the specific rate of ethanol production (Figure 2a, the definition of reaction names is shown in Table S3). Moreover, ΔG(pyruvate dehydrogenase (PDH)) and cGMP were located near the reversed specific ethanol production rate. Hierarchical clustering analysis using a smaller data matrix, including 26 ΔG′ values and four specific rates, confirmed that the specific ethanol production rate, ΔG′(PDC-ADH), ΔG′(ALT), ΔG′(TKL-TAL), and ΔG′(MDH-AAT) were in the same cluster (Figure S1).
These results suggest that pyruvate consumption reactions may have been activated in strains with improved specific ethanol production rates because the PDC-ADH and ALT pathways consume pyruvate as a substrate. The specific ethanol production rate showed positive correlations with ΔG′(PDC-ADH) (r = 0.61; Figure 2b) and ΔG′(ALT) (r = 0.67; Figure 2c). The PDC-ADH pathway is an ethanol biosynthetic pathway from pyruvate, and its activation likely elevates ethanol production. The ALT pathway synthesizes alanine from pyruvate and supplies amino acids for cell growth.

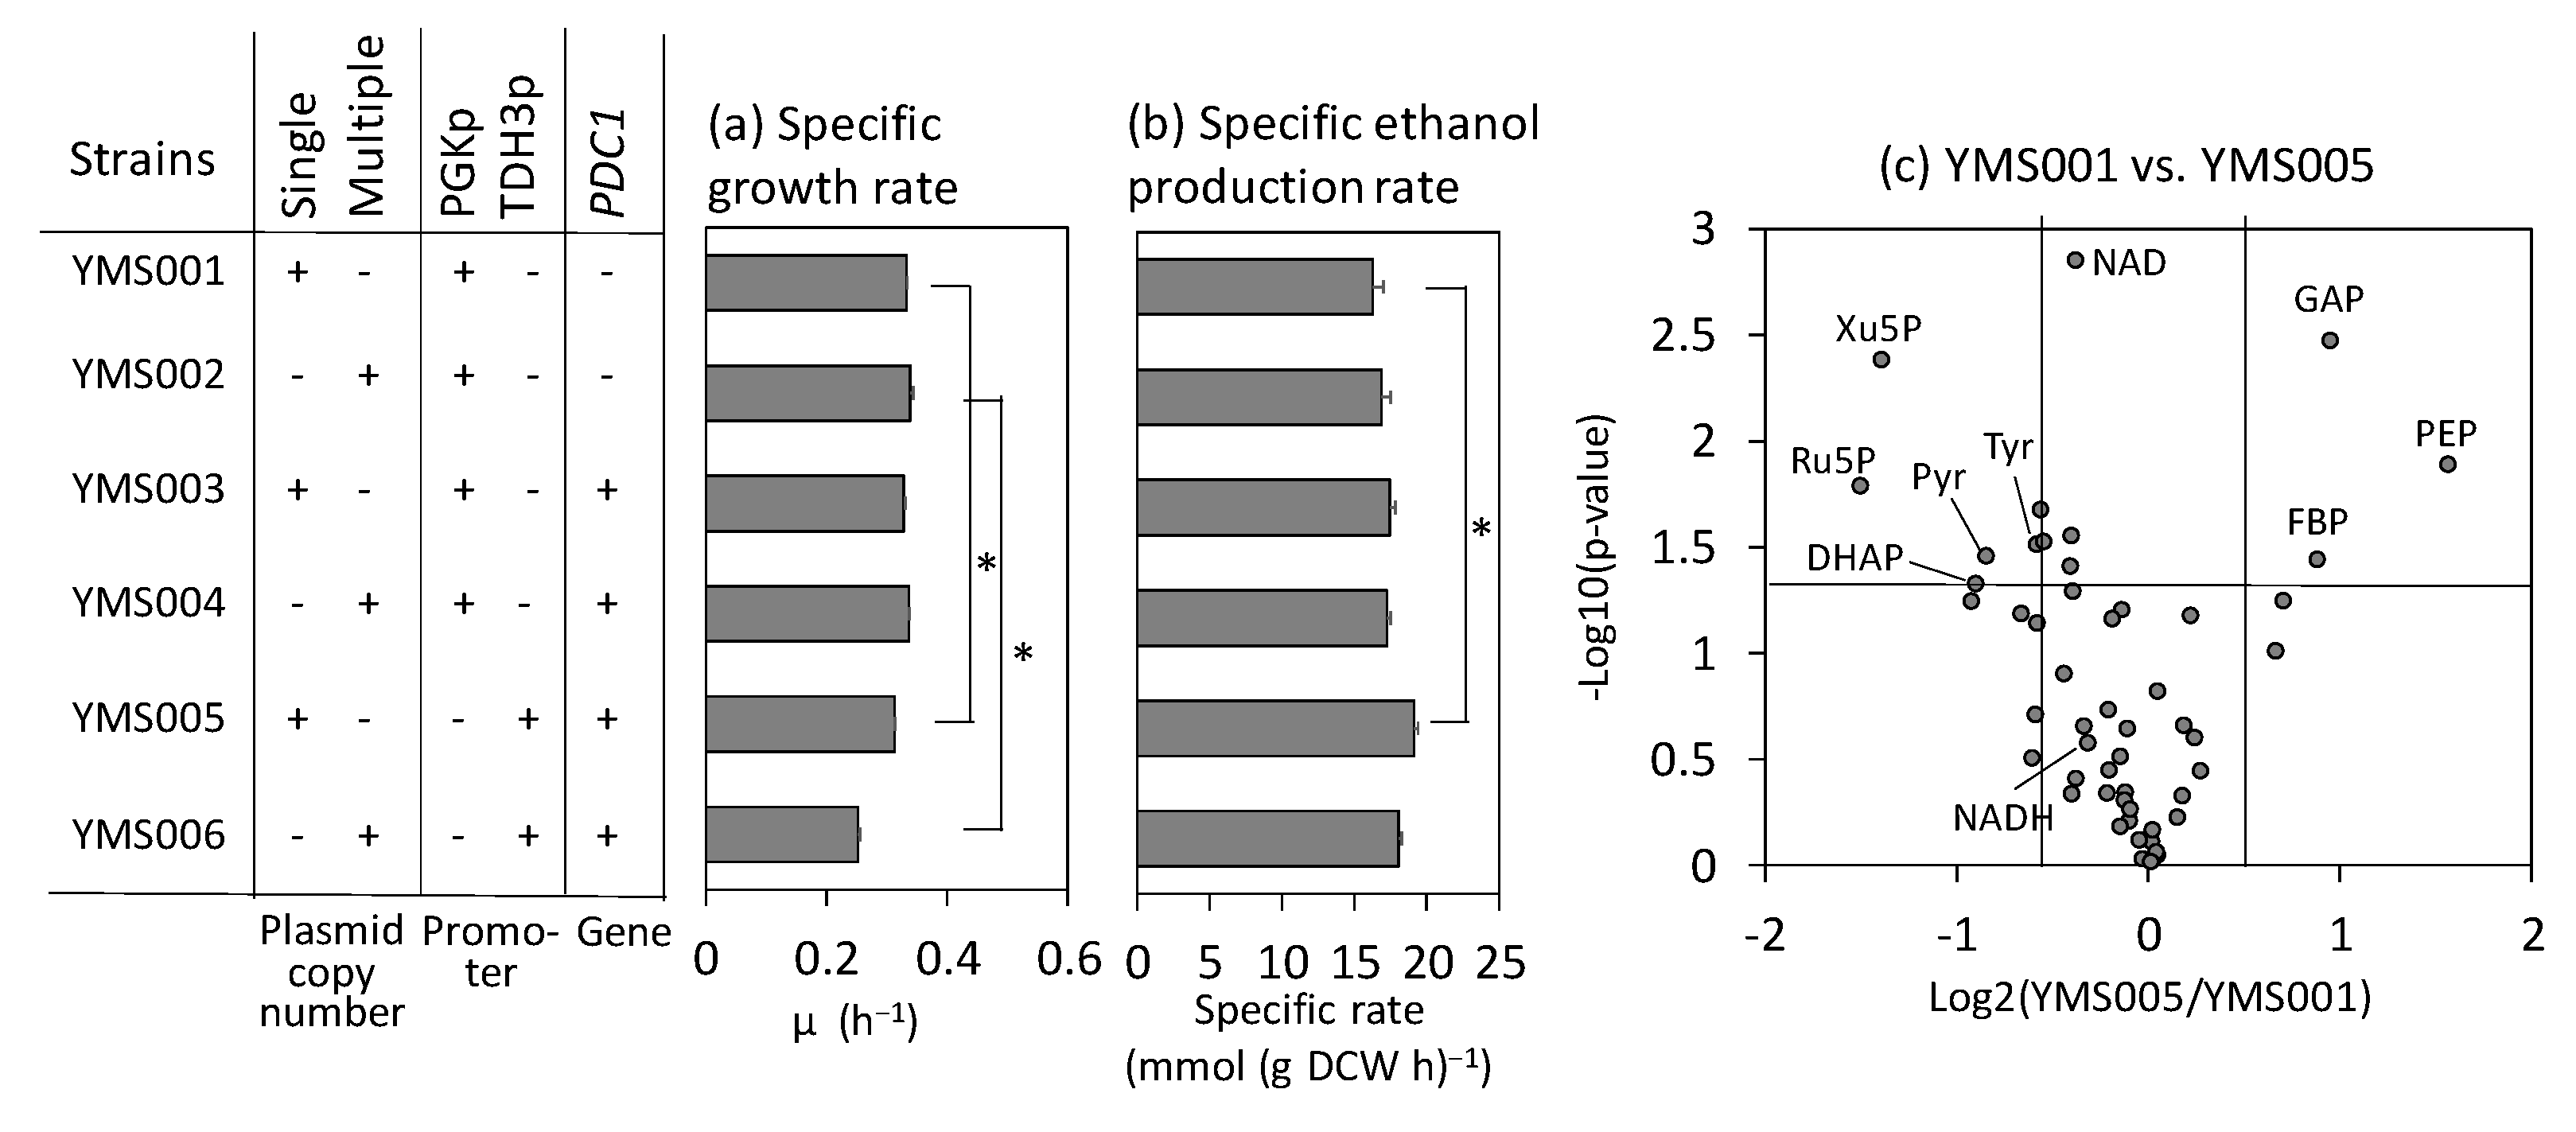
2.3. Elevation of Ethanol Production in the Laboratory Strain by Activating the Pyruvate-Consuming Reaction

The results of the metabolic analyses described previously suggest that the activation of the pyruvate-consuming reaction increases the ethanol production rate. To confirm this finding, PDC1 from S. cerevisiae was overexpressed in the haploid laboratory yeast strain (YPH499). PDC1 encodes a major isoform of PDC, the initial enzyme involved in ethanol biosynthesis from pyruvate [28]. Strains YMS003 and YMS004 were constructed by introducing single- and multi-copy plasmids expressing PDC1 under the control of the PDC1p promoter, respectively. Flask-scale batch cultivation showed that the specific rates of ethanol production and cell growth of the YMS003 and YMS004 strains were similar to those of the vector control strains (YMS001 and YMS002), likely because of insufficient overexpression of PDC1 (Figure 3a,b).
To further overexpress PDC1, the YMS005 and YMS006 strains were constructed by replacing the PDC1p promoter and PDC1t terminator with the stronger TDH3p and TDH3t, respectively. PDC1 overexpression resulted in an increased burden in the YMS006 strain, which contains the multi-copy type plasmid, as the specific growth rate decreased by 25% (Figure 3a) despite a 7% increase in the specific ethanol production rate (Figure 3b). Severe growth defects caused by PDC1p overexpression were alleviated in the YMS005 strain with the single-copy-type plasmid (Figure 3a). In this strain, the specific ethanol production rate increased by 17% compared with that of the empty vector strain (Figure 3b).
To investigate the effects of PDC1 overexpression on intracellular metabolism, metabolites were extracted from YMS001 and YMS005 cells after 9 h and subjected to metabolomic analyses (Data S3). The volcano plot revealed that the pyruvate content decreased significantly following the overexpression of PDC1, whereas NAD and NADH levels did not change significantly (Figure 3c). Moreover, the levels of key metabolites involved in glycolysis, including glyceraldehyde 3-phosphate, phosphoenolpyruvate, and fructose-1,6-bisphosphate, were elevated upon PDC1 overexpression. Elevated fructose-1,6-bisphosphate levels are a signature of high glycolytic flux and temporal activation of glucose uptake [29,30,31]. These results demonstrate that the specific ethanol production rate can be elevated by the activation of the pyruvate-consuming reaction, as predicted by metabolome analysis.

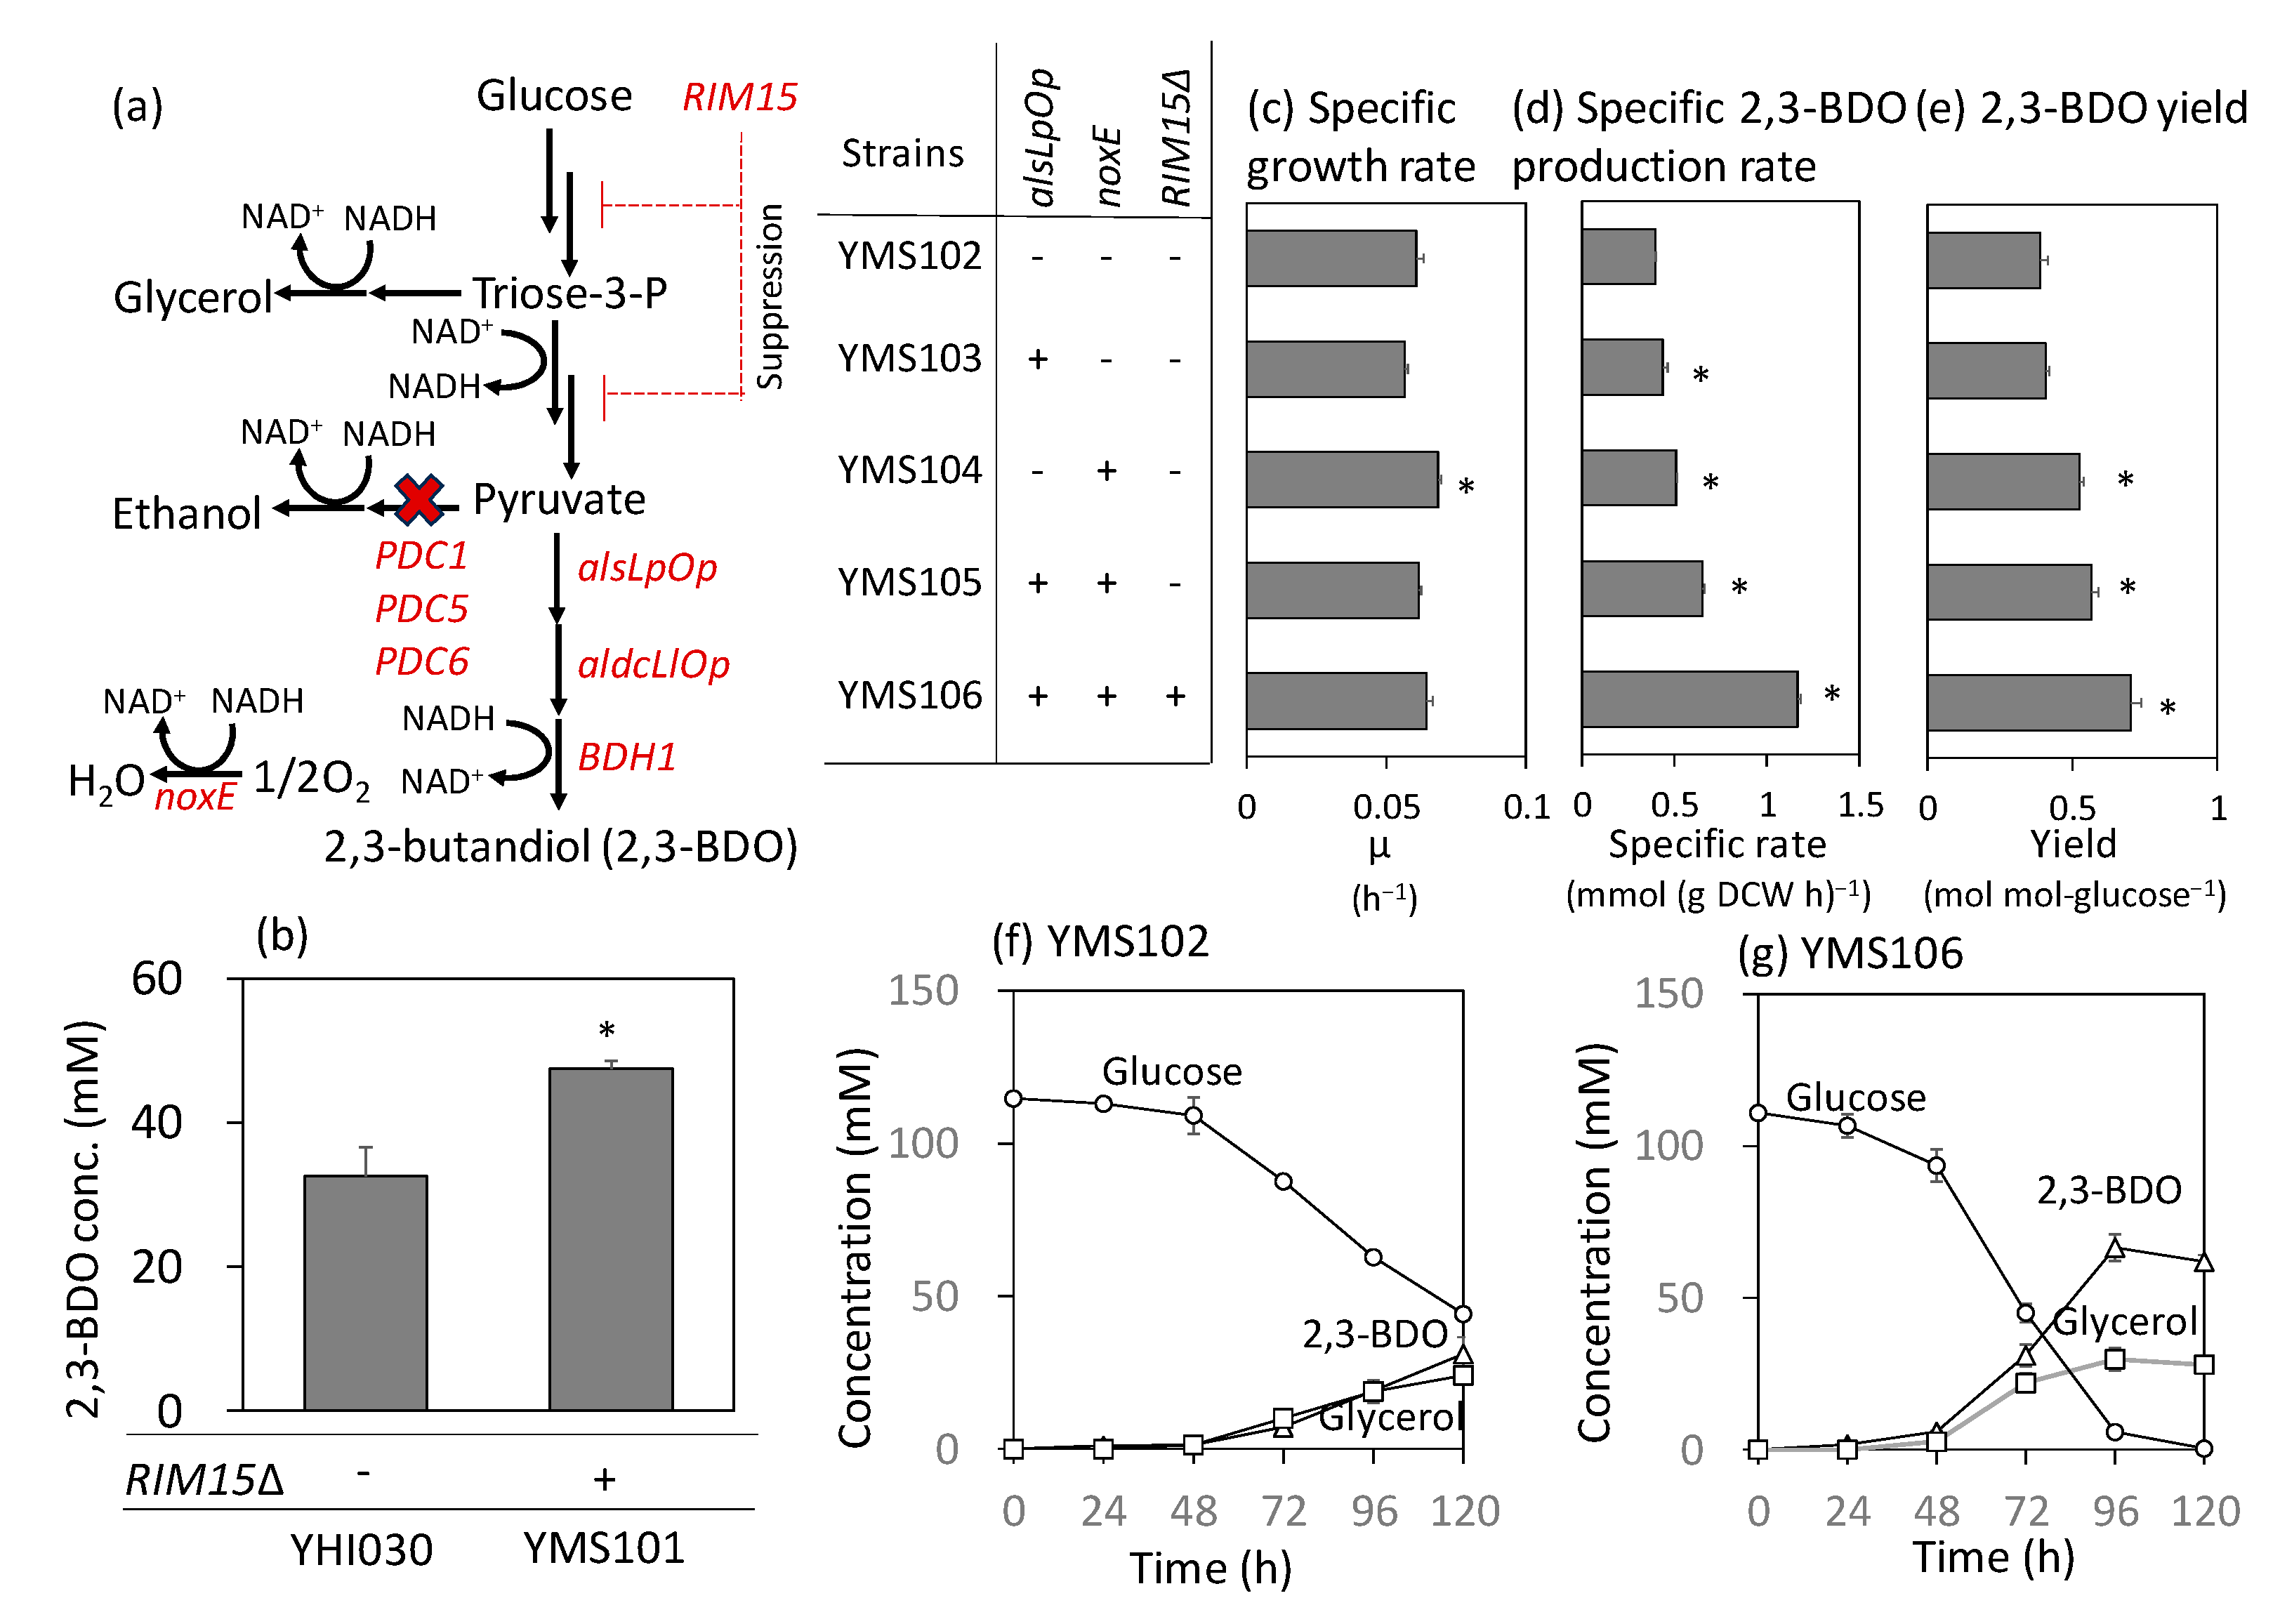
2.4. Implementation of RIM15 Deletion and Enhanced Pyruvate Consumption in a Metabolically Engineered S. cerevisiae Strain Producing 2,3-Butanediol

Findings from industrial strains were implemented using a metabolically engineered S. cerevisiae strain that produces 2,3-BDO. In our previous study, the YHI030 strain producing 2,3-BDO was constructed from the YPH499 strain by introducing the MTH1-ΔT mutation, along with the deletion of PDC1, PDC5, and PDC6. Additionally, laboratory evolution was employed to improve the growth rate, and three genes (alsLpOp, aldcLlOp, and BDH1) necessary for the biosynthesis of 2,3-BDO from pyruvate were introduced (Figure 4a) [13]. The YHI030 strain did not produce ethanol as all pyruvate decarboxylase genes had been deleted in a previous study (Figure 4a) [13]. Moreover, the YHI030 strain produced 2,3-BDO with a yield of 0.41 g g−1 glucose in fed-batch cultivation using synthetic dextrose (SD) medium [13]. This level is similar to those of other strains reported previously in fed-batch cultivation using a rich medium (0.41–0.48 g g−1 glucose) [7,9].
First, the open reading frame (ORF) of RIM15 was deleted from YHI030 to construct the YMS101 strain. Strain YHI030 produced 33.5 ± 4.0 mM (3.0 ± 0.3 g L−1) of 2,3-BDO after 72 h, following cultivation at the flask scale with an initial OD600 of 0.5 (Figure 4b). The YMS101 strain produced 1.4-fold more 2,3-BDO, confirming that the loss-of-function of RIM15 also improved 2,3-BDO production (Figure 4b).
Second, the pyruvate-consuming pathway was activated by the additional activation of acetolactate synthase, which is responsible for the first step of the 2,3-BDO synthesis pathway (Figure 4a). The YMS103 strain was constructed from YHI030 by overexpressing alsLpOp, a codon-optimized ORF of alsLp derived from Lactobacillus plantarum [13]. The strain was cultured at the test tube scale with an initial OD600 of 0.1 to investigate 2,3-BDO production (Figure 4c–e). The specific production rate and yield of YMS103 increased by 5% and 10%, respectively, compared with those of the empty vector strain, YMS102. However, the specific growth rate decreased by 7% (Figure 4c), likely due to the NADH imbalance associated with 2,3-BDO production. Because the introduction of NADH oxidase relaxes this imbalance [6,10], a codon-optimized ORF of noxE from Lactococcus lactis was expressed in YHI030 (Figure 4a). The specific growth rate of the constructed strain YMS104 was 107% of that of the vector control, whereas the specific production rate and yield of 2,3-BDO were 128% and 135%, respectively (Figure 4c–e). Furthermore, a YMS105 strain combined with alsLpOp overexpression and noxE expression was constructed. The specific production rate and yield of 2,3-BDO were 164% and 145%, respectively, as compared with those of the vector control (Figure 4d,e).
Finally, the RIM15 deletion was introduced into the YMS105 strain. Figure 4f,g show the culture profiles of the empty vector (YMS102) and constructed (YMS106) strains at the test tube scale. Some glucose remained in the YMS102 strain even after 120 h (Figure 4f), whereas the YMS106 strain completely consumed glucose after 96 h (Figure 4g). The maximal 2,3-BDO titer increased from 31.1 ± 1.8 to 66.4 ± 4.4 mM, which improved the yield of 2,3-BDO from 0.39 ± 0.03 to 0.70 ± 0.03 mol (mol glucose)−1. Particularly, the specific rate of 2,3-BDO production reached 1.17 ± 0.017 mmol (g DCW h)−1, which was approximately 3-fold higher than that of YMS102 (0.40 ± 0.004 mmol (g DCW h)−1) (Figure 4d). The productivity also increased from 0.25 ± 0.02 to 0.69 ± 0.05 mmol (l h)−1. These results indicate that 2,3-BDO production can be enhanced by combining the deletion of RIM15 with the activation of the pyruvate consumption pathway.

3. Discussion

In the present study, we performed comparative genetic and metabolomic analyses of 11 industrial and laboratory strains of S. cerevisiae. The engineering targets identified from the analyses were used to improve the 2,3-BDO production of metabolically engineered S. cerevisiae constructed in our previous study (YHI030) [13]. Sequence analysis of RIM15 confirmed that the A1686fs frameshift was present only in the sake strain and that other industrial strains accumulated nonsynonymous substitutions at seven to nine sites, which may impair the function of the Rim15p protein (Table S2). Although the role of these mutations requires further analysis, additional deletion of the RIM15 strain improved the production rate and yield of 2,3-BDO in YHI030 (Figure 4b), suggesting that RIM15 deletion is a promising tool for metabolic engineering.
Furthermore, metabolome analyses indicated that the activation of the pyruvate-consuming pathway could be an additional target (Figure 2). Variation in the specific ethanol production rates among the 11 strains was positively correlated with the ΔG′ levels of the PDC-ADH pathway producing ethanol from pyruvate (Figure 2c). This result suggests that further activation of the pyruvate-consuming pathway would increase the ethanol production rate in the ethanol-producing laboratory strain and increase the 2,3-BDO production rate in the metabolically engineered strain generating 2,3-BDO (YHI030). To test this hypothesis, we initially verified that the ethanol production rate could be increased by additional overexpression of PDC1 in the ethanol-producing laboratory strain (Figure 3). Similar increases in specific ethanol production rates have been reported for a PDC1-overexpressing strain derived from CEN.PK113-7D [32]. However, the phenotype was subtle and condition-dependent, as the copy number and promoter activity for PDC1 expression affected the production rate (Figure 3). Specific ethanol production rates improve only over a limited range of dilution rates [32]. One reason for condition dependency is post-translational regulation. Pyruvate decarboxylase activity in S. cerevisiae is regulated by the phosphorylation of the Ser/Thr protein phosphatase Sit4p [33]. Because of the post-translational regulation, the expression levels of Pdc1p did not correlate with the ethanol production rate. For example, the expression levels of Pdc1p protein in Kyokai7 and RedStar were lower than those in BY4947 during aerobic batch cultivation in SD medium [18].
Based on the confirmation of this hypothesis, we activated the 2,3-BDO biosynthesis pathway from pyruvate in the YHI030 strain by overexpressing alsLpOp and noxE (Figure 4). Notably, the suppression of ethanol biosynthesis was impossible due to the inability of the YHI030 strain to produce ethanol resulting from the deletion of all pyruvate decarboxylase genes [13]. However, the additional overexpression of enzymes was anticipated to activate the 1,3-BDO pathway in pyruvate. This is because post-translational regulation in S. cerevisiae is unlikely to control enzymes derived from other organisms. Using the YHI030 as a parental strain, this study demonstrated that activation of the pyruvate-consuming pathway improved 2,3-BDO production by overexpressing alsLpOp from L. plantarum and noxE from L. lactis. The specific production rate and yield of 2,3-BDO in the YMS105 strain combined with alsLpOp overexpression and noxE expression were 164% and 145%, respectively, as compared with those in the vector control (Figure 4d,e).
This study also demonstrated that the combined RIM15 deletion and activation of the pyruvate-consuming pathway effectively improved 2,3-BDO production. The titer, specific production rate, and yield of 2,3-BDO of the YMS106 strain reached 66.4 ± 4.4 mM, 1.17 ± 0.017 mmol (g DCW h)−1, and 0.70 ± 0.03 mol (mol glucose consumed)−1, respectively, marking a 2.14-, 2.92-, and 1.81-fold increase compared with those in the vector control (YMS102) (Figure 4d–g). In RIM15-deleted strains, the pathway from glucose to pyruvate (the Embden–Meyerhof pathway) was activated by the native regulation mechanism of S. cerevisiae (Figure 4a). However, this regulatory mechanism was not effective in the artificial biosynthetic pathway from pyruvate to 2,3-BDO. Therefore, the combined implementation of RIM15 deletion and activation of the 2,3-BDO biosynthesis pathway activated the entire 2,3-BDO production pathway from glucose.
The previously reported yields of 2,3-BDO by metabolically engineered S. cerevisiae strains were 0.11 g g-glucose−1 in batch culture [5], 0.42 g g-glucose−1 in fed-batch culture [34], and 0.54 g g-glucose−1 in continuous culture [34]. The theoretical maximum yield of 2,3-BDO from glucose is 0.5 g g-glucose−1. The 2,3-BDO yield demonstrated in this study was 0.70 ± 0.03 mol mol-glucose−1, equivalent to 0.35 g g-glucose−1. The yield can be improved by optimizing the aeration conditions and applying a fed-batch culture using a rich medium [13]. However, there is still potential for improvement in the specific 2,3-BDO production rate of the engineered strain when compared to the specific ethanol production rate of the non-engineered strains. For instance, the specific ethanol production rate of BY4749 (the laboratory strain) shown in Figure 1 was 23.8 ± 0.1 mmol (g DCW h)−1, equivalent to the specific 2,3-BDO production rate of 11.9 ± 0.1 mmol (g DCW h)−1. This is because two molecules of ethanol and one molecule of 2,3-BDO can be synthesized from one glucose molecule. The best specific 2,3-BDO production rate demonstrated in this study (YMS106 in Figure 4d) was 1.17 ± 0.017 mmol (g DCW h)−1, which was still only 10% of the ethanol production capacity.
To further improve the metabolically engineered S. cerevisiae strains producing 2,3-BDO, activation of glycolysis by RIM15 deletion is expected to be useful. For example, 2,3-BDO production yield improves when glycerol coproduction is suppressed [7] and ATP wasting is elevated [35]. The δ integration method was employed to activate the artificial pathway from pyruvate to 2,3-BDO [9]. Combining these methods with the activation of the Embden–Meyerhof pathway by RIM15 deletion should further improve the production of 2,3-BDO. The RIM15 deletion is also expected to be effective in the bioproduction of other target compounds from pyruvate [36,37]. Furthermore, homologous genes of RIM15 are widely distributed in many fungi. The expression of the UGP1 gene encoding UDPG pyrophosphorylase, which is required for polysaccharide production in a yeast-like fungus (Aureobasidium melanogenum), is regulated by a similar mechanism downstream of the RIM15 signaling pathway in S. cerevisiae [38,39].
This study demonstrates that modification of the native regulatory mechanism in S. cerevisiae by RIM15 deletion effectively improves 2,3-BDO production. Further research is required to enhance our understanding of the regulatory mechanisms governing the Embden–Meyerhof pathway as most metabolically engineered S. cerevisiae strains use this pathway to catabolize glucose. The metabolic analysis of a strain that overexpresses RIM15 will help elucidate the comprehensive functions of Rim15p in regulating the Embden–Meyerhof pathway. A more comprehensive comparative analysis of the metabolism of S. cerevisiae, given its various fermentation capabilities, would unveil the intricate regulatory mechanisms. Such an investigation can offer valuable insights and provide a useful approach for the metabolic engineering of S. cerevisiae.

4. Materials and Methods

4.1. Strains and Culture Condition

Saccharomyces cerevisiae strains and plasmids used in this study are listed in Table 1. A yeast extract-peptone-dextrose (YPD) medium (1% Bacto yeast extract, 2% Bacto peptone, and 2% glucose) and an SD medium (2% glucose and 0.67% yeast nitrogen base without amino acids) were used. To culture the metabolically engineered strains, amino acids and nucleic acids were added, as necessary. SDGal medium supplemented with 2% galactose rather than glucose was used for genome editing.
For the preculture of diploid industrial strains and engineered strains producing ethanol, a single colony on the YPD plate was inoculated into a test tube containing 5 mL of YPD medium and cultured overnight at 30 °C with shaking at 150 rpm. For preculture, the cells were transferred to 50 mL of SD medium in a 200 mL baffled flask and cultured for 16 h at 30 °C with shaking at 120 rpm. This preculture solution was inoculated into 50 mL of SD medium in a 200 mL baffled flask with an initial OD600 of 0.05 and cultured under the same conditions as the preculture. To culture the 2,3-BDO-producing strains derived from YHI030, a single colony was inoculated into a test tube containing 5 mL of SD medium and cultured for three days under shaking conditions (30 °C, 150 rpm). For the preculture and main culture, the cells were transferred into 5 mL of SD medium in a test tube and cultured under the same conditions. The initial OD600 of the primary culture was 0.1 or 0.5. The OD600 was measured using a spectrophotometer (UV-1700, Shimadzu, Kyoto, Japan).

4.2. Measurement of Extracellular Metabolites

The concentrations of ethanol, glucose, and glycerol in the filtrated medium (0.45 µm pore size Cosmonice filter W, Nacalai Tesque, Kyoto, Japan) were measured as previously described using high-performance liquid chromatography (Prominence, Shimadzu, Kyoto, Japan) [13]. To measure the 2,3-BDO concentration, 50 µL of the filtered medium was diluted with an equal amount of 0.1% 3-methyl-1-butanol solution and measured using a gas chromatograph (GC-2025, Shimadzu) as described previously.

4.3. Metabolome Analysis

Metabolome analysis was conducted as described previously, with slight modifications [20]. Briefly, S. cerevisiae cells were collected from culture broth (approximately OD600 × mL = 8.0) using the filter method (polytetrafluorethylene membrane filter: 0.45 µm pore size, 47 mm filter diameter; Omnipore, Merck Millipore, Kenilworth, NJ, USA); the filtered cells were immersed in 1.6 mL of methanol containing an internal standard (20 µM d-camphor sulfonate) and stored at −80 °C. The DCW in the recovered culture medium was calculated as OD600 × conversion factor (g L−1 OD600−1) × volume of the collected medium (L). The conversion factors for each strain were determined by measuring cell weight after collection, using the filter method, and drying at 60 °C for seven days (Table S4). Intracellular metabolites were extracted using methanol/chloroform/water in 640 µL of Milli-Q water and 1.6 mL of chloroform. The mixture was centrifuged (3700× g, 4 °C, 20 min), and 250 µL of the supernatant was dispensed into six Eppendorf tubes, dried under vacuum conditions at ambient temperature using a Speed Vac (Thermo Fisher Scientific, Waltham, MA, USA), and stored at −80 °C.
For the isotope dilution method, yeast strain S288C was cultured in SD medium containing 100% [U-13C] glucose as the sole carbon source and extracted as described previously [20]. The concentrations of metabolites in the 13C labeled sample were measured using the internal standard method after mixing with the unlabeled metabolite (final concentration: 10 µM).
To analyze the industrial strain, unlabeled sample solutions prepared from the industrial strain were mixed with equal amounts of 13C-labeled samples from the S288C strains. The mixture was subjected to metabolomic analysis using LC-triple-stage quadrupole MC (LC-MS/MS, LCMS-8060NX, Shimadzu). Metabolome data were obtained using two targeted methods, according to previously reported pentafluorophenylpropyl-LC-MS/MS and ion pair LC-MS/MS methods [20,42]. The multiple reaction monitoring results are shown in Tables S5 and S6. To analyze the industrial strains, metabolite concentrations in the sample solutions were calculated using the following equation:
Metabolite concentration (µM) = (peak area ratio) × (metabolite concentration in the 13C-labeled sample derived from S288C).
Herein, the peak area ratio represents the ratio of the peak areas of the unlabeled metabolite signal derived from the industrial strains and the 13C-labeled metabolite signal derived from S288C. To analyze the PDC1-overexpressing strains, the peak areas of each metabolite signal were normalized by dividing them by the peak area of an internal standard compound.

4.4. Calculation of ΔG′ and Multivariate Analysis

The intracellular concentrations of metabolites were calculated based on the following assumptions: The number of cells per OD600 × mL was 3.0 × 10⁸ [43]. The yeast cells are spheres with a diameter of 6 µm. The concentrations of phosphate and carbon dioxide were constant at 0.05 mM and 0.046 µM, respectively. The intracellular and extracellular concentrations of glucose and ethanol and the mitochondrial and cytoplasmic metabolite concentrations were identical. The ΔG′ of each reaction was calculated using the following formula: ΔG′ = ΔG0 + RT lnQ. The ΔG0, R, T, and Q represent the standard Gibbs free energy, gas constant (8.314 J (K mol)−1), absolute temperature (303 K), and reaction quotient, respectively. Equilibrium constants (Keq) or standard Gibbs free energies (ΔG0) for each reaction were obtained from an eQuilibrator and are shown in Table S3 [44].
t-SNE and hierarchical clustering were performed using the Scikit-learn package version 1.3.2 in Python 3.8 after Z-score normalization. Hierarchical clustering was performed using the “correlation” and “average” for the distance matrix and cluster calculation, respectively.

4.5. Construction of Metabolically Engineered Strains

Plasmid vectors and primers used in this study are listed in Table 1 and Table S7, respectively. Lysogeny broth (10 g L−1 Bacto tryptone, 5 g L−1 Bacto yeast extract, and 10 g L−1 NaCl) was used to culture Escherichia coli, and 50 mg L−1 ampicillin was added as needed. The growth conditions, DNA techniques, and lithium-acetate method for transformations have been described previously [45,46]. DNA fragments were assembled using the Gibson Assembly Master Mix (New England Biolabs, Ipswich, MA, USA). To construct pGK414-PDC1p-PDC1-PDC1t and pGK424-PDC1p-PDC1-PDC1t, the DNA fragment of the ±1 kb region of the ORF of PDC1 was amplified from S. cerevisiae genomic DNA using the primers PDC1_pGK414_f and PDC1_pGK414_r. Outside regions of the expression cassette of pGK414 and pGK424 [40] were amplified via inverse PCR with primers pGK414_inv_f and pGK414_inv_r (Table S7). The DNA fragment of PDC1 and the plasmid vector backbone were assembled using the Gibson assembly method. To construct pGK414-TDH3p-PDC1-TDH3t and pGK424-TDH3p-PDC1-TDH3t, three DNA fragments of the PDC1 ORF, TDH3p, and TDH3t were amplified from S. cerevisiae genomic DNA using pATP422-alsLpOp-aldcLIOp as a template. These fragments and the pGK414 or pGK424 backbones were ligated using Gibson assembly. pGK414-noxE and pGK424-noxE were constructed in the same manner using the DNA fragment of a codon-optimized sequence of NADH oxidase (noxE) from L. lactis [14] synthesized by Thermo Fisher Scientific. Yeast transformation was performed using the Frozen-EZ Yeast Transformation II Kit (Zymo Research, Irvine, CA, USA).

4.6. RIM15 Deletion

Genome editing was performed as previously described [41]. pGAL1-RIM15Δ was constructed from the backbone vector (pGAL1-Cas9-tADH1-pGAL1-2BsaI-sgRNAFE(empty)-HDV-tCYC1-CU: purchased from the National Bio-Resource Project (NBRP)) and inserted using the New England Biolabs Golden Gate Assembly Kit (BsaI-HF v2). The insert fragment was designed using the CRISPR Direct webpage (https://crispr.dbcls.jp/) (accessed on 6 August 2022). The prepared plasmid and donor sequences were introduced into YHI030 cells by transformation using a SDGal plate for selection. The donor sequence was prepared using PCR, and the RIM15 deletion was confirmed using colony PCR.

Supplementary Materials

The following supporting information can be downloaded at: https://www.mdpi.com/article/10.3390/ijms242216378/s1.

Author Contributions

Conceptualization, J.I. and F.M.; methodology of metabolome analysis, Y.I. and T.B.; validation and investigation, M.S., T.S. and N.O.; writing—original draft preparation, M.S.; writing—review and editing, J.I. and F.M. All authors have read and agreed to the published version of the manuscript.

Funding

This work was partly supported by Grants in Aid for Scientific Research (B) 22H01879 and JST, CREST Grant Number JPMJCR21N2, Japan.

Institutional Review Board Statement

Not applicable.

Informed Consent Statement

Not applicable.

Data Availability Statement

The data presented in this study are available upon request from the corresponding author.

Acknowledgments

We thank Daisuke Watanabe at the Nara Institute of Science and Technology; Hiroaki Takaku at the Niigata University of Pharmacy and Medical and Applied Life Sciences; and Yuki Ito, Akihiro Kunisawa, Takanari Hattori, and Atsuhiko Tohyama from Shimadzu Corporation for their helpful comments and technical assistance. Plasmid vectors (pGK425 and pAT425) were provided by the National Bio-Resource Project (NBRP), Japan.

Conflicts of Interest

The authors declare no conflict of interest.

References

  1. Nielsen, J.; Larsson, C.; van Maris, A.; Pronk, J. Metabolic engineering of yeast for production of fuels and chemicals. Curr. Opin. Biotechnol. 2013, 24, 398–404. [Google Scholar] [CrossRef] [PubMed]
  2. Mitsui, R.; Yamada, R.; Matsumoto, T.; Ogino, H. Bioengineering for the industrial production of 2,3-butanediol by the yeast, Saccharomyces cerevisiae. World J. Microbiol. Biotechnol. 2022, 38, 38. [Google Scholar] [CrossRef] [PubMed]
  3. Kim, S.J.; Kim, J.W.; Lee, Y.G.; Park, Y.C.; Seo, J.H. Metabolic engineering of Saccharomyces cerevisiae for 2,3-butanediol production. Appl. Microbiol. Biotechnol. 2017, 101, 2241–2250. [Google Scholar] [CrossRef]
  4. Xu, Y.; Chu, H.; Gao, C.; Tao, F.; Zhou, Z.; Li, K.; Li, L.; Ma, C.; Xu, P. Systematic metabolic engineering of Escherichia coli for high-yield production of fuel bio-chemical 2,3-butanediol. Metab. Eng. 2014, 23, 22–33. [Google Scholar] [CrossRef] [PubMed]
  5. Ng, C.Y.; Jung, M.Y.; Lee, J.; Oh, M.K. Production of 2,3-butanediol in Saccharomyces cerevisiae by in silico aided metabolic engineering. Microb. Cell Fact. 2012, 11, 68. [Google Scholar] [CrossRef] [PubMed]
  6. Kim, S.J.; Sim, H.J.; Kim, J.W.; Lee, Y.G.; Park, Y.C.; Seo, J.H. Enhanced production of 2,3-butanediol from xylose by combinatorial engineering of xylose metabolic pathway and cofactor regeneration in pyruvate decarboxylase-deficient Saccharomyces cerevisiae. Bioresour. Technol. 2017, 245, 1551–1557. [Google Scholar] [CrossRef] [PubMed]
  7. Huo, G.; Foulquie-Moreno, M.R.; Thevelein, J.M. Development of an industrial yeast strain for efficient production of 2,3-butanediol. Microb. Cell Fact. 2022, 21, 199. [Google Scholar] [CrossRef] [PubMed]
  8. Huang, S.; Geng, A. High-copy genome integration of 2,3-butanediol biosynthesis pathway in Saccharomyces cerevisiae via in vivo DNA assembly and replicative CRISPR-Cas9 mediated delta integration. J. Biotechnol. 2020, 310, 13–20. [Google Scholar] [CrossRef]
  9. Yamada, R.; Wakita, K.; Mitsui, R.; Nishikawa, R.; Ogino, H. Efficient production of 2,3-butanediol by recombinant Saccharomyces cerevisiae through modulation of gene expression by cocktail delta-integration. Bioresour. Technol. 2017, 245, 1558–1566. [Google Scholar] [CrossRef]
  10. Kim, J.W.; Seo, S.O.; Zhang, G.C.; Jin, Y.S.; Seo, J.H. Expression of Lactococcus lactis NADH oxidase increases 2,3-butanediol production in Pdc-deficient Saccharomyces cerevisiae. Bioresour. Technol. 2015, 191, 512–519. [Google Scholar] [CrossRef]
  11. Kim, J.W.; Kim, J.; Seo, S.O.; Kim, K.H.; Jin, Y.S.; Seo, J.H. Enhanced production of 2,3-butanediol by engineered Saccharomyces cerevisiae through fine-tuning of pyruvate decarboxylase and NADH oxidase activities. Biotechnol. Biofuels 2016, 9, 265. [Google Scholar] [CrossRef] [PubMed]
  12. Kim, S.; Hahn, J.S. Efficient production of 2,3-butanediol in Saccharomyces cerevisiae by eliminating ethanol and glycerol production and redox rebalancing. Metab. Eng. 2015, 31, 94–101. [Google Scholar] [CrossRef] [PubMed]
  13. Ishii, J.; Morita, K.; Ida, K.; Kato, H.; Kinoshita, S.; Hataya, S.; Shimizu, H.; Kondo, A.; Matsuda, F. A pyruvate carbon flux tugging strategy for increasing 2,3-butanediol production and reducing ethanol subgeneration in the yeast Saccharomyces cerevisiae. Biotechnol. Biofuels 2018, 11, 180. [Google Scholar] [CrossRef] [PubMed]
  14. Lee, Y.G.; Seo, J.H. Production of 2,3-butanediol from glucose and cassava hydrolysates by metabolically engineered industrial polyploid Saccharomyces cerevisiae. Biotechnol. Biofuels 2019, 12, 204. [Google Scholar] [CrossRef] [PubMed]
  15. Ohnuki, S.; Okada, H.; Friedrich, A.; Kanno, Y.; Goshima, T.; Hasuda, H.; Inahashi, M.; Okazaki, N.; Tamura, H.; Nakamura, R.; et al. Phenotypic diagnosis of lineage and differentiation during sake yeast breeding. G3 2017, 7, 2807–2820. [Google Scholar] [CrossRef] [PubMed]
  16. Watanabe, D.; Kaneko, A.; Sugimoto, Y.; Ohnuki, S.; Takagi, H.; Ohya, Y. Promoter engineering of the Saccharomyces cerevisiae RIM15 gene for improvement of alcoholic fermentation rates under stress conditions. J. Biosci. Bioeng. 2017, 123, 183–189. [Google Scholar] [CrossRef] [PubMed]
  17. Watanabe, D.; Takagi, H. Pleiotropic functions of the yeast Greatwall-family protein kinase Rim15p: A novel target for the control of alcoholic fermentation. Biosci. Biotechnol. Biochem. 2017, 81, 1061–1068. [Google Scholar] [CrossRef] [PubMed]
  18. Uebayashi, K.; Shimizu, H.; Matsuda, F. Comparative analysis of fermentation and enzyme expression profiles among industrial Saccharomyces cerevisiae strains. Appl. Microbiol. Biotechnol. 2018, 102, 7071–7081. [Google Scholar] [CrossRef]
  19. Matsuda, F.; Toya, Y.; Shimizu, H. Learning from quantitative data to understand central carbon metabolism. Biotechnol. Adv. 2017, 35, 971–980. [Google Scholar] [CrossRef]
  20. Nagai, H.; Masuda, A.; Toya, Y.; Matsuda, F.; Shimizu, H. Metabolic engineering of mevalonate-producing Escherichia coli strains based on thermodynamic analysis. Metab. Eng. 2018, 47, 1–9. [Google Scholar] [CrossRef]
  21. Noor, E.; Bar-Even, A.; Flamholz, A.; Reznik, E.; Liebermeister, W.; Milo, R. Pathway thermodynamics highlights kinetic obstacles in central metabolism. PLoS Comput. Biol. 2014, 10, e1003483. [Google Scholar] [CrossRef]
  22. Park, J.O.; Rubin, S.A.; Xu, Y.F.; Amador-Noguez, D.; Fan, J.; Shlomi, T.; Rabinowitz, J.D. Metabolite concentrations, fluxes and free energies imply efficient enzyme usage. Nat. Chem. Biol. 2016, 12, 482–489. [Google Scholar] [CrossRef] [PubMed]
  23. Watanabe, D.; Araki, Y.; Zhou, Y.; Maeya, N.; Akao, T.; Shimoi, H. A loss-of-function mutation in the PAS kinase Rim15p is related to defective quiescence entry and high fermentation rates of Saccharomyces cerevisiae sake yeast strains. Appl. Environ. Microbiol. 2012, 78, 4008–4016. [Google Scholar] [CrossRef] [PubMed]
  24. Su, S.S.; Mitchell, A.P. Identification of functionally related genes that stimulate early meiotic gene expression in yeast. Genetics 1993, 133, 67–77. [Google Scholar] [CrossRef] [PubMed]
  25. Kim, H.S. Disruption of RIM15 confers an increased tolerance to heavy metals in Saccharomyces cerevisiae. Biotechnol. Lett. 2020, 42, 1193–1202. [Google Scholar] [CrossRef] [PubMed]
  26. Kawai, K.; Kanesaki, Y.; Yoshikawa, H.; Hirasawa, T. Identification of metabolic engineering targets for improving glycerol assimilation ability of Saccharomyces cerevisiae based on adaptive laboratory evolution and transcriptome analysis. J. Biosci. Bioeng. 2019, 128, 162–169. [Google Scholar] [CrossRef] [PubMed]
  27. Watanabe, D.; Kajihara, T.; Sugimoto, Y.; Takagi, K.; Mizuno, M.; Zhou, Y.; Chen, J.; Takeda, K.; Tatebe, H.; Shiozaki, K.; et al. Nutrient signaling via the TORC1-Greatwall-PP2A(B55delta) pathway is responsible for the high initial rates of alcoholic fermentation in sake yeast strains of Saccharomyces cerevisiae. Appl. Environ. Microbiol. 2019, 85, e02083-18. [Google Scholar] [CrossRef] [PubMed]
  28. Pronk, J.T.; Yde Steensma, H.; Van Dijken, J.P. Pyruvate metabolism in Saccharomyces cerevisiae. Yeast 1996, 12, 1607–1633. [Google Scholar] [CrossRef]
  29. Wu, L.; van Dam, J.; Schipper, D.; Kresnowati, M.T.; Proell, A.M.; Ras, C.; van Winden, W.A.; van Gulik, W.M.; Heijnen, J.J. Short-term metabolome dynamics and carbon, electron, and ATP balances in chemostat-grown Saccharomyces cerevisiae CEN.PK 113-7D following a glucose pulse. Appl. Environ. Microbiol. 2006, 72, 3566–3577. [Google Scholar] [CrossRef]
  30. van Heerden, J.H.; Wortel, M.T.; Bruggeman, F.J.; Heijnen, J.J.; Bollen, Y.J.; Planque, R.; Hulshof, J.; O’Toole, T.G.; Wahl, S.A.; Teusink, B. Lost in transition: Start-up of glycolysis yields subpopulations of nongrowing cells. Science 2014, 343, 1245114. [Google Scholar] [CrossRef]
  31. van Heerden, J.H.; Bruggeman, F.J.; Teusink, B. Multi-tasking of biosynthetic and energetic functions of glycolysis explained by supply and demand logic. Bioessays 2014, 37, 34–45. [Google Scholar] [CrossRef] [PubMed]
  32. van Hoek, P.; Flikweert, M.T.; van der Aart, Q.J.; Steensma, H.Y.; van Dijken, J.P.; Pronk, J.T. Effects of pyruvate decarboxylase overproduction on flux distribution at the pyruvate branch point in Saccharomyces cerevisiae. Appl. Environ. Microbiol. 1998, 64, 2133–2140. [Google Scholar] [CrossRef]
  33. de Assis, L.J.; Zingali, R.B.; Masuda, C.A.; Rodrigues, S.P.; Montero-Lomeli, M. Pyruvate decarboxylase activity is regulated by the Ser/Thr protein phosphatase Sit4p in the yeast Saccharomyces cerevisiae. FEMS Yeast Res. 2013, 13, 518–528. [Google Scholar] [CrossRef] [PubMed]
  34. Yamada, R.; Nishikawa, R.; Wakita, K.; Ogino, H. Rapid and stable production of 2,3-butanediol by an engineered Saccharomyces cerevisiae strain in a continuous airlift bioreactor. J. Ind. Microbiol. Biotechnol. 2018, 45, 305–311. [Google Scholar] [CrossRef] [PubMed]
  35. Yatabe, F.; Seike, T.; Okahashi, N.; Ishii, J.; Matsuda, F. Improvement of ethanol and 2,3-butanediol production in Saccharomyces cerevisiae by ATP wasting. Microb. Cell Fact. 2023, 22, 204. [Google Scholar] [CrossRef] [PubMed]
  36. Borodina, I.; Nielsen, J. Advances in metabolic engineering of yeast Saccharomyces cerevisiae for production of chemicals. Biotechnol. J. 2014, 9, 609–620. [Google Scholar] [CrossRef] [PubMed]
  37. Krivoruchko, A.; Siewers, V.; Nielsen, J. Opportunities for yeast metabolic engineering: Lessons from synthetic biology. Biotechnol. J. 2011, 6, 262–276. [Google Scholar] [CrossRef]
  38. Watanabe, D.; Zhou, Y.; Hirata, A.; Sugimoto, Y.; Takagi, K.; Akao, T.; Ohya, Y.; Takagi, H.; Shimoi, H. Inhibitory role of Greatwall-like protein kinase Rim15p in alcoholic fermentation via upregulating the UDP-glucose synthesis pathway in Saccharomyces cerevisiae. Appl. Environ. Microbiol. 2016, 82, 340–351. [Google Scholar] [CrossRef]
  39. Yang, G.; Liu, G.L.; Wang, S.J.; Chi, Z.M.; Chi, Z. Pullulan biosynthesis in yeast-like fungal cells is regulated by the transcriptional activator Msn2 and cAMP-PKA signaling pathway. Int. J. Biol. Macromol. 2020, 157, 591–603. [Google Scholar] [CrossRef]
  40. Ishii, J.; Izawa, K.; Matsumura, S.; Wakamura, K.; Tanino, T.; Tanaka, T.; Ogino, C.; Fukuda, H.; Kondo, A. A simple and immediate method for simultaneously evaluating expression level and plasmid maintenance in yeast. J. Biochem. 2009, 145, 701–708. [Google Scholar] [CrossRef]
  41. Okada, S.; Doi, G.; Nakagawa, S.; Kusumoto, E.; Ito, T. Simple-to-use CRISPR-SpCas9/SaCas9/AsCas12a vector series for genome editing in Saccharomyces cerevisiae. G3 2021, 11, jkab304. [Google Scholar] [CrossRef] [PubMed]
  42. Nakatani, K.; Izumi, Y.; Hata, K.; Bamba, T. An analyticals system for single-cell metabolomics of typical mammalian cells based on highly sensitive nano-liquid chromatography tandem mass spectrometry. Mass Spectrom 2020, 9, A0080. [Google Scholar] [CrossRef] [PubMed]
  43. Day, A.; Schneider, C.; Schneider, B.L. Yeast cell synchronization. Methods Mol. Biol. 2004, 241, 55–76. [Google Scholar] [CrossRef]
  44. Flamholz, A.; Noor, E.; Bar-Even, A.; Milo, R. eQuilibrator--the biochemical thermodynamics calculator. Nucleic Acids Res. 2012, 40, D770–D775. [Google Scholar] [CrossRef] [PubMed]
  45. Ito, H.; Fukuda, Y.; Murata, K.; Kimura, A. Transformation of intact yeast cells treated with alkali cations. J. Bacteriol. 1983, 153, 163–168. [Google Scholar] [CrossRef]
  46. Katahira, S.; Mizuike, A.; Fukuda, H.; Kondo, A. Ethanol fermentation from lignocellulosic hydrolysate by a recombinant xylose- and cellooligosaccharide-assimilating yeast strain. Appl. Microbiol. Biotechnol. 2006, 72, 1136–1143. [Google Scholar] [CrossRef]
Figure 1. Culture profiles of 11 industrial diploid yeast strains. Culture profiles were obtained from one laboratory (BY4947, a diploid of S288C), three sake (Kyokai6, Kyokai7, and Kyokai9), three wine (QA23, EC1118, and OC-2), three bread (RedStar, NBRC0555, and NBRC2043), and one beer (WLP530) strains. (a) Culture profile of BY4947. (b) Culture profile of EC1118. (c) Specific growth rates of the 11 strains. (d) Specific rates of glucose uptake and ethanol production. The specific rates were determined based on data from 3 to 9 h. All cultures were performed in triplicate. Error bars indicate the standard deviation. Asterisks indicate the results of the two-sided t-test (p < 0.05, n = 3).
Ijms 24 16378 g001
Figure 2. Comparison of metabolite states among 11 industrial yeast strains. (a) Results of t-distributed stochastic neighbor embedding (t-SNE). A data matrix were analyzed, including 84 metabolite concentrations, 26 ΔG′ values, and four specific rates. (b,c) Scatter plots between the specific ethanol production rate (x-axis) and levels of (b) ΔG′(PDC-ADH) and (c) ΔG′(ALT). The correlation coefficients (r) are shown in the panels. AAT, aspartate aminotransferase; ADH: alcohol dehydrogenase; ALT: alanine transaminase; MDH, malate dehydrogenase; PDC: pyruvate decarboxylase; PDH: pyruvate dehydrogenase; TCA: tricarboxylic acid; t-SNE: t-distributed stochastic neighbor embedding. The definition of reaction names is shown in Table S3.
Ijms 24 16378 g002
Figure 3. Effect of PDC1 overexpression on ethanol production in laboratory strains. (a) Specific growth rate. (b) Specific ethanol production rate determined from 3–9 h data. The data are presented as the mean ± standard deviation of three independent transformants (n = 3 each). Asterisks indicate the results of the two-sided t-test (p < 0.05, n = 3). (c) Comparison of the metabolic profiles of YMS005 and vector control in a volcano plot. Metabolome data were obtained from cells at the mid-log phase (9 h, n = 3). DHAP: dihydroxyacetone phosphate; FBP: fructose-1,6-bisphosphate; GAP: glyceraldehyde 3-phosphate; PEP: phosphoenolpyruvate; Pyr: pyruvate; Ru5P: ribulose-5-phosphate; Tyr: tyrosine.
Ijms 24 16378 g003
Figure 4. Implementation of RIM15 deletion and activation of the pyruvate-consuming pathway in a metabolically engineered S. cerevisiae strain producing 2,3-butanediol (2,3-BDO). All strains were constructed from the YHI030 strain developed by [13]. (a) The metabolic pathway engineered in this study. (b) Effect of the RIM15 deletion on 2,3-BDO production. The 2,3-BDO concentrations in the flask-scale culture were determined at 72 h. (ce) Specific growth rate (c), specific 2,3-BDO production rate (d), and 2,3-BDO yield (e) of metabolically engineered strains in the test tube-scale culture. Specific rates were determined from 24–72 h data. (f,g) Culture profiles of engineered strains in the test tube-scale culture. Culture profiles of YMS106 (f) and YMS106 (g) are shown. The data are presented as the mean ± standard deviation of three independent transformants (n = 3 each). Asterisks indicate the results of the two-sided t-test (p < 0.05, n = 3).
Ijms 24 16378 g004
Table 1. Strains and plasmids used in this study.
StrainsDescriptionRef.
BY4947Diploid of S288C (X2180-1A × X2180-1B)National Bio-Resource Project (NBRP), Japan
Kyokai6 Sake strain[18]
Kyokai7Sake strain (NBRC2347)[18]
Kyokai9Sake strain (NBRC2377)[18]
QA23™Wine strainGift from SCETI K.K. Tokyo, Japan
Lalvin EC1118™Wine strainGift from SCETI K.K. Tokyo, Japan
OC-2Wine strain (NBRC104078)Purchased from NITE
RedStarBread strain (NBRC2375)Purchased from NITE
NBRC0555Bread strainPurchased from NITE
NBRC2043Bread strainPurchased from NITE
WLP530Beer strainGift from Suntory Co.
S288CIdentical to BY27002, MATα mal SUC2NBRP Yeast, Japan
YPH499MATa ura3-52 lys2-801 ade2-101 trp1-Δ63 his3-Δ200 leu2-Δ1Stratagene/Agilent Technologies
YSM021 (PDCΔ)YPH499 pdc1Δ pdc5Δ pdc6Δ MTH1-ΔT(L165F)[13]
YSM046 (PDCΔ + evolved)Laboratory-evolved yeast strain derived from the PDCΔ (YSM021) strain[13]
YHI030YSM046 [pATP422-alsLpOp-aldcLlOp/pAT425-BDH1][13]
YMS001YPH499 [pGK414]This study
YMS002YPH499 [pGK424]This study
YMS003YPH499 [pGK414-PDC1]This study
YMS004YPH499 [pGK424-PDC1]This study
YMS005YPH499 [pGK414-TDH3p_PDC1]This study
YMS006YPH499 [pGK424-TDH3p_PDC1]This study
YMS101YHI030 rim15ΔThis study
YMS102YHI030 [pGK423/pGK424]This study
YMS103YHI030 [pGK423-ALS/pGK424]This study
YMS104YHI030 [pGK423-ALS/pGK424]This study
YMS105YHI030 [pGK423-ALS/pGK424-noxE]This study
YMS106YHI030_rim15Δ [pGK423-ALS/pGK424-noxE]This study
PlasmidsDescriptionRef.
pGK423Yeast multi-copy type single-gene expression vector containing PGK1 promoter, PGK1 terminator, 2μ origin, and HIS3 marker[40]
pGK423-ALSpGK423, expression of the ALS gene by the PGK1 promoterThis study
pGK414Yeast low-copy type single-gene expression vector containing PGK1 promoter, PGK1 terminator, CEN/ARS ori, and TRP1 marker[40]
pGK424Yeast multi-copy type single-gene expression vector containing PGK1 promoter, PGK1 terminator, CEN/ARS ori, and TRP1 marker[40]
pGK414-PDCpGK414, expression of the PDC1 gene by the PDC1 promoterThis study
pGK424-PDCpGK424, expression of the PDC1 gene by the PDC1 promoterThis study
pGK414-TDH3p-PDC1pGK414, expression of the PDC1 gene by the TDH3 promoterThis study
pGK424-TDHp3-PDC1pGK424, expression of the PDC1 gene by the TDH3 promoterThis study
pGK424-noxEpGK424, expression of the noxE gene by the TDH3 promoterThis study
pGAL1-Cas9-tADH1-pGAL1-2BsaI-sgRNAFE(empty)-HDV-tCYC1-CUYCp vector, and URA3 marker[41]
pGAL1-RIM15ΔpGAL1-Cas9-tADH1-pGAL1-2BsaI-sgRNAFE(RIM15D)-HDV-tCYC1-CUThis study
Disclaimer/Publisher’s Note: The statements, opinions and data contained in all publications are solely those of the individual author(s) and contributor(s) and not of MDPI and/or the editor(s). MDPI and/or the editor(s) disclaim responsibility for any injury to people or property resulting from any ideas, methods, instructions or products referred to in the content.

