
Blood Proteome Profiling Reveals Biomarkers and Pathway Alterations in Fragile X PM at Risk for Developing FXTAS

 , , , and
Abstract
:1. Introduction
2. Results
2.1. Demographics
2.2. Differential Protein Expression between Healthy Control and Premutation Groups
2.3. Identification of Proteomic Biomarkers of FXTAS
2.4. Protein, Lipids, and Amino-Acid Pathways Altered in Individuals Who Developed FXTAS over Time
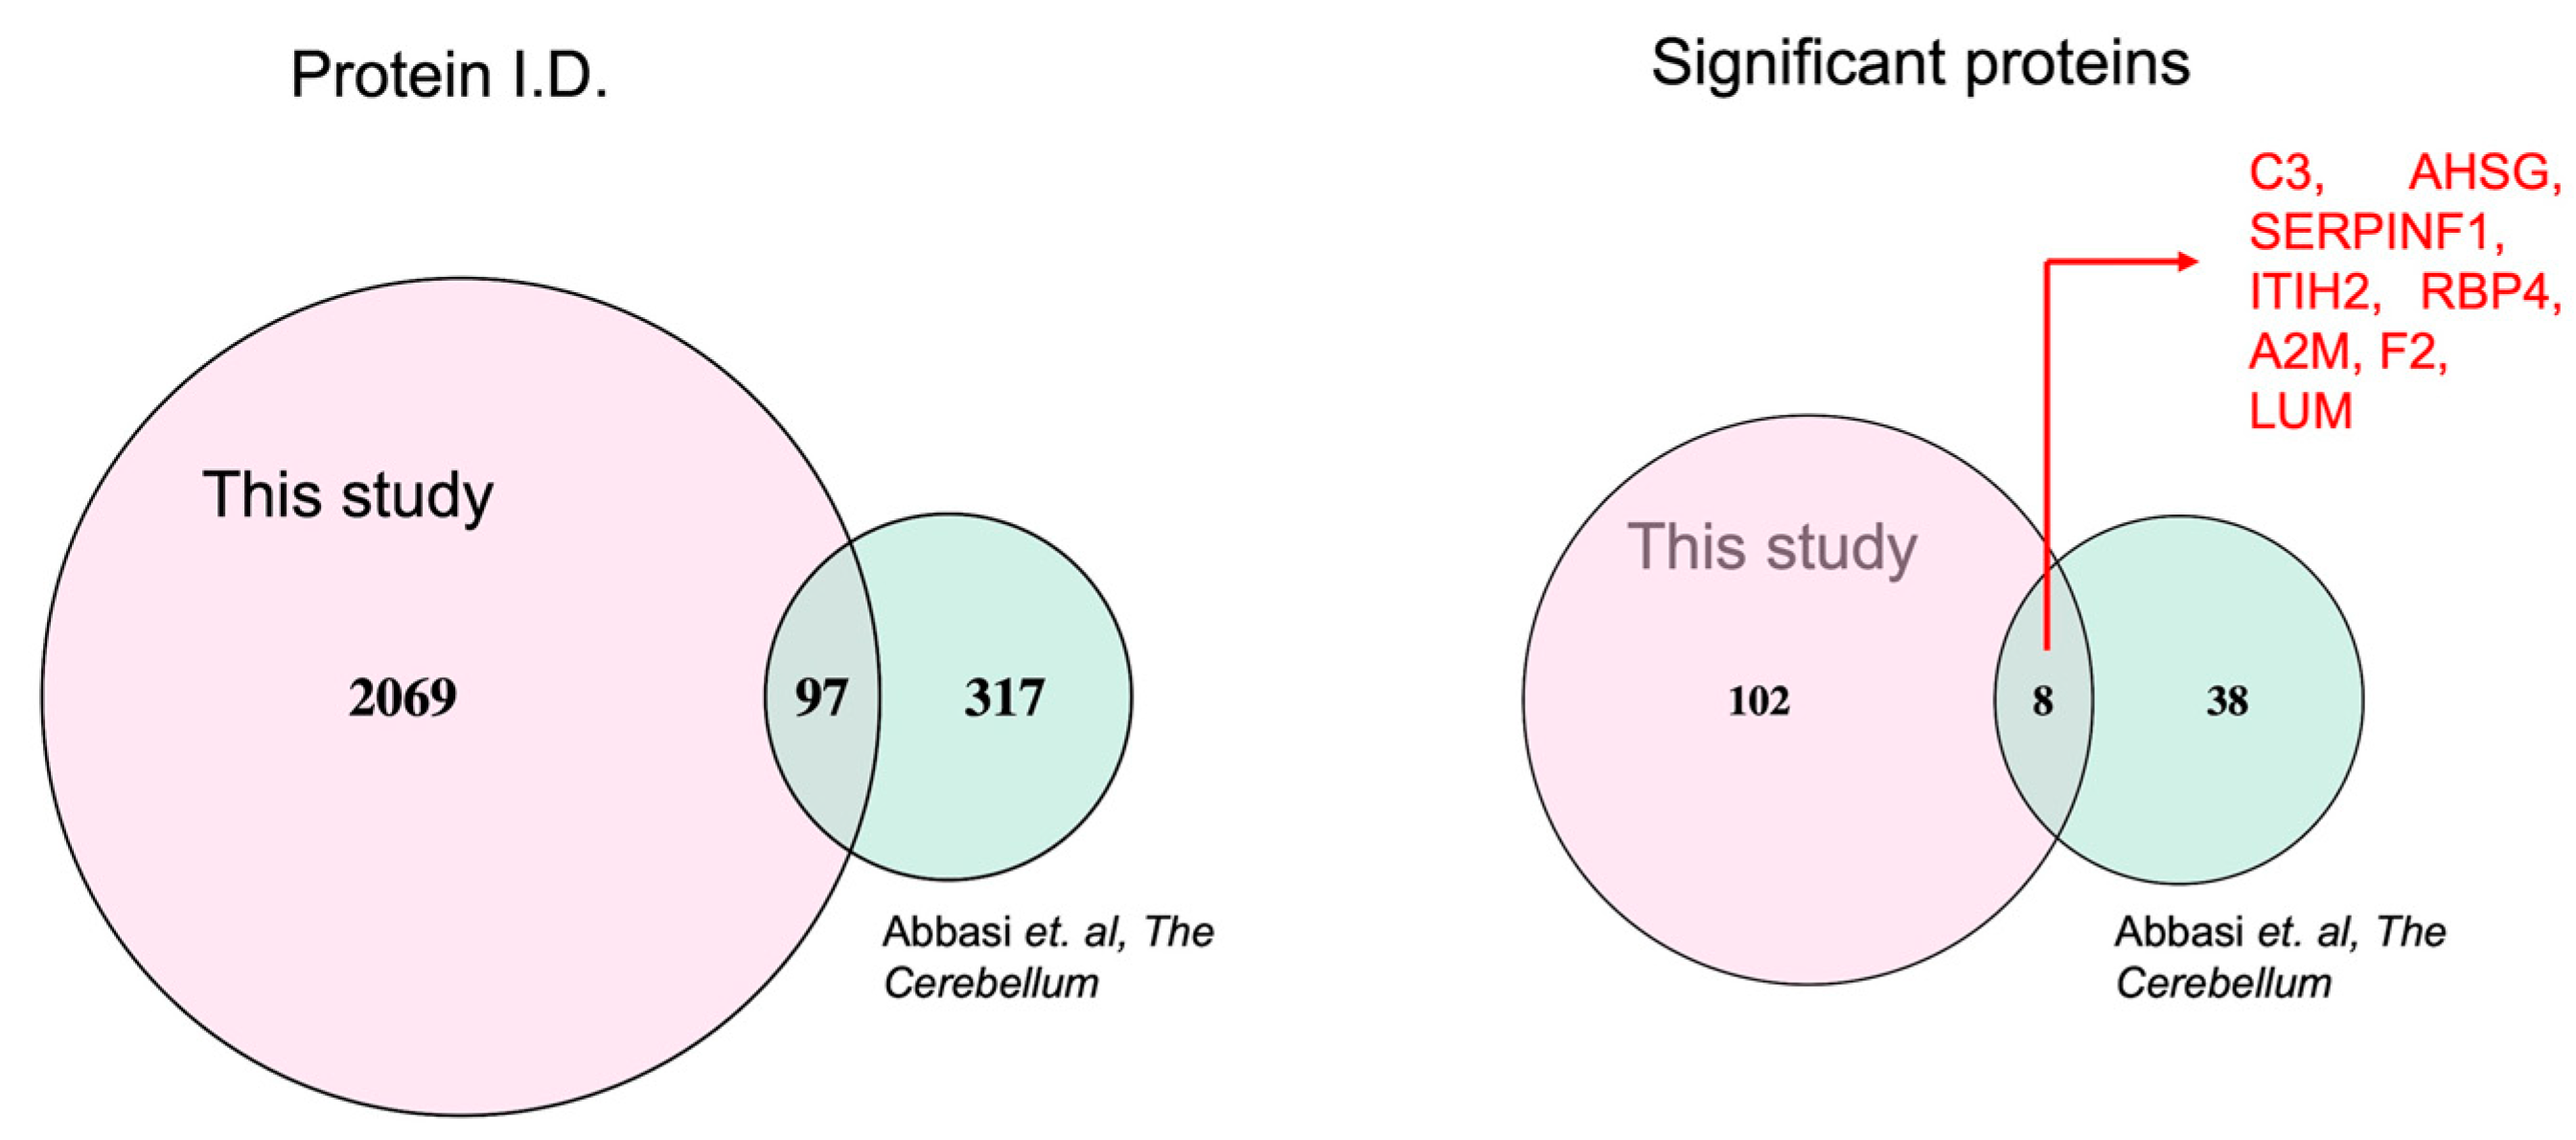
2.5. Differentially Expressed Common Proteins Identified from CSF and Blood Proteomic Profiling
3. Discussion
4. Materials and Methods
4.1. Study Participants
4.2. CGG Repeat Length
4.3. Sample Handling and Preparation
4.4. Liquid Chromatography Mass Spectrometry (LC-MS/MS)
4.5. Data Analysis
5. Conclusions
Author Contributions
Funding
Institutional Review Board Statement
Informed Consent Statement
Data Availability Statement
Acknowledgments
Conflicts of Interest
References
- Cabal-Herrera, A.M.; Tassanakijpanich, N.; Salcedo-Arellano, M.J.; Hagerman, R.J. Fragile X-Associated Tremor/Ataxia Syndrome (FXTAS): Pathophysiology and Clinical Implications. Int. J. Mol. Sci. 2020, 21, 4391. [Google Scholar] [CrossRef] [PubMed]
- Rodriguez-Revenga, L.; Madrigal, I.; Pagonabarraga, J.; Xunclà, M.; Badenas, C.; Kulisevsky, J.; Gomez, B.; Milà, M. Penetrance of FMR1 Premutation Associated Pathologies in Fragile X Syndrome Families. Eur. J. Hum. Genet. 2009, 17, 1359–1362. [Google Scholar] [CrossRef] [PubMed]
- Jacquemont, S.; Hagerman, R.J.; Leehey, M.A.; Hall, D.A.; Levine, R.A.; Brunberg, J.A.; Zhang, L.; Jardini, T.; Gane, L.W.; Harris, S.W.; et al. Penetrance of the Fragile X–Associated Tremor/Ataxia Syndrome in a Premutation Carrier Population. JAMA 2004, 291, 460–469. [Google Scholar] [CrossRef] [PubMed]
- Salcedo-Arellano, M.J.; Dufour, B.; McLennan, Y.; Martinez-Cerdeno, V.; Hagerman, R. Fragile X Syndrome and Associated Disorders: Clinical Aspects and Pathology. Neurobiol. Dis. 2020, 136, 104740. [Google Scholar] [CrossRef]
- Hagerman, R.J.; Berry-Kravis, E.; Hazlett, H.C.; Bailey, D.B.; Moine, H.; Kooy, R.F.; Tassone, F.; Gantois, I.; Sonenberg, N.; Mandel, J.L.; et al. Fragile X Syndrome. Nat. Rev. Dis. Primers 2017, 3, 17065. [Google Scholar] [CrossRef]
- Tassone, F.; Hagerman, R.J.; Taylor, A.K.; Gane, L.W.; Godfrey, T.E.; Hagerman, P.J. Elevated Levels of FMR1 mRNA in Carrier Males: A New Mechanism of Involvement in the Fragile-X Syndrome. Am. J. Hum. Genet. 2000, 66, 6. [Google Scholar] [CrossRef]
- Hagerman, R.J.; Hagerman, P. Fragile X-Associated Tremor/ataxia Syndrome—Features, Mechanisms and Management. Nat. Rev. Neurol. 2016, 12, 403–412. [Google Scholar] [CrossRef]
- Zafarullah, M.; Tang, H.-T.; Durbin-Johnson, B.; Fourie, E.; Hessl, D.; Rivera, S.M.; Tassone, F. FMR1 Locus Isoforms: Potential Biomarker Candidates in Fragile X-Associated Tremor/ataxia Syndrome (FXTAS). Sci. Rep. 2020, 10, 11099. [Google Scholar] [CrossRef]
- Al-Amrani, S.; Al-Jabri, Z.; Al-Zaabi, A.; Alshekaili, J.; Al-Khabori, M. Proteomics: Concepts and Applications in Human Medicine. World J. Biol. Chem. 2021, 12, 57–69. [Google Scholar] [CrossRef]
- Cui, M.; Cheng, C.; Zhang, L. High-Throughput Proteomics: A Methodological Mini-Review. Lab. Investig. 2022, 102, 1170–1181. [Google Scholar] [CrossRef]
- Ma, L.; Herren, A.W.; Espinal, G.; Randol, J.; McLaughlin, B.; Martinez-Cerdeño, V.; Pessah, I.N.; Hagerman, R.J.; Hagerman, P.J. Composition of the Intranuclear Inclusions of Fragile X-Associated Tremor/Ataxia Syndrome. Acta Neuropathol. Commun. 2019, 7, 143. [Google Scholar] [CrossRef] [PubMed]
- Holm, K.N.; Herren, A.W.; Taylor, S.L.; Randol, J.L.; Kim, K.; Espinal, G.; Martiínez-Cerdeño, V.; Pessah, I.N.; Hagerman, R.J.; Hagerman, P.J. Human Cerebral Cortex Proteome of Fragile X-Associated Tremor/Ataxia Syndrome. Front. Mol. Biosci. 2020, 7, 600840, Corrigendum in Front. Mol. Biosci. 2021, 8, 695407. [Google Scholar]
- Abbasi, D.A.; Nguyen, T.T.A.; Hall, D.A.; Robertson-Dick, E.; Berry-Kravis, E.; Cologna, S.M. Correction to: Characterization of the Cerebrospinal Fluid Proteome in Patients with Fragile X-Associated Tremor/Ataxia Syndrome. Cerebellum 2022, 21, 99–100. [Google Scholar] [CrossRef] [PubMed]
- Estes, R.E.; Lin, B.; Khera, A.; Davis, M.Y. Lipid Metabolism Influence on Neurodegenerative Disease Progression: Is the Vehicle as Important as the Cargo? Front. Mol. Neurosci. 2021, 14, 788695. [Google Scholar] [CrossRef]
- Zafarullah, M.; Palczewski, G.; Rivera, S.M.; Hessl, D.R.; Tassone, F. Metabolic Profiling Reveals Dysregulated Lipid Metabolism and Potential Biomarkers Associated with the Development and Progression of Fragile X-Associated Tremor/Ataxia Syndrome (FXTAS). FASEB J. 2020, 34, 16676–16692. [Google Scholar] [CrossRef]
- Zafarullah, M.; Durbin-Johnson, B.; Fourie, E.S.; Hessl, D.R.; Rivera, S.M.; Tassone, F. Metabolomic Biomarkers Are Associated with Area of the Pons in Fragile X Premutation Carriers at Risk for Developing FXTAS. Front. Psychiatry 2021, 12, 691717. [Google Scholar] [CrossRef] [PubMed]
- Checa, A.; Bedia, C.; Jaumot, J. Lipidomic Data Analysis: Tutorial, Practical Guidelines and Applications. Anal. Chim. Acta 2015, 885, 1–16. [Google Scholar] [CrossRef]
- Novgorodov, S.A.; Riley, C.L.; Yu, J.; Keffler, J.A.; Clarke, C.J.; Van Laer, A.O.; Baicu, C.F.; Zile, M.R.; Gudz, T.I. Lactosylceramide Contributes to Mitochondrial Dysfunction in Diabetes. J. Lipid Res. 2016, 57, 546. [Google Scholar] [CrossRef]
- Xiyang, Y.-B.; Liu, R.; Wang, X.-Y.; Li, S.; Zhao, Y.; Lu, B.-T.; Xiao, Z.-C.; Zhang, L.-F.; Wang, T.-H.; Zhang, J. COX5A Plays a Vital Role in Memory Impairment Associated with Brain Aging via the BDNF/ERK1/2 Signaling Pathway. Front. Aging Neurosci. 2020, 12, 540040. [Google Scholar] [CrossRef]
- Alliance of Genome Resources. Available online: https://www.alliancegenome.org/ (accessed on 14 July 2023).
- Baty, K.; Farrugia, M.E.; Hopton, S.; Falkous, G.; Schaefer, A.M.; Stewart, W.; Willison, H.J.; Reilly, M.M.; Blakely, E.L.; Taylor, R.W.; et al. A Novel MT-CO2 Variant Causing Cerebellar Ataxia and Neuropathy: The Role of Muscle Biopsy in Diagnosis and Defining Pathogenicity. Neuromuscul. Disord. 2021, 31, 1186–1193. [Google Scholar] [CrossRef]
- Sim, K.G.; Carpenter, K.; Hammond, J.; Christodoulou, J.; Wilcken, B. Acylcarnitine Profiles in Fibroblasts from Patients with Respiratory Chain Defects Can Resemble Those from Patients with Mitochondrial Fatty Acid Beta-Oxidation Disorders. Metabolism 2002, 51, 366–371. [Google Scholar] [CrossRef] [PubMed]
- Franco, D.L.; Rezával, C.; Cáceres, A.; Schinder, A.F.; Ceriani, M.F. ENA/VASP Downregulation Triggers Cell Death by Impairing Axonal Maintenance in Hippocampal Neurons. Mol. Cell. Neurosci. 2010, 44, 154–164. [Google Scholar] [CrossRef] [PubMed]
- Tao, Y.; Han, Y.; Yu, L.; Wang, Q.; Leng, S.X.; Zhang, H. The Predicted Key Molecules, Functions, and Pathways That Bridge Mild Cognitive Impairment (MCI) and Alzheimer’s Disease (AD). Front. Neurol. 2020, 11, 233. [Google Scholar] [CrossRef] [PubMed]
- Xu, Z.; Bai, S.; Wu, H.; Fang, M. Elevated Retinal Retinol-Binding Protein 4 Levels in Diabetic Mice Can Induce Retinal Neurodegeneration through Microglia. Microsc. Res. Tech. 2023, 86, 223–231. [Google Scholar] [CrossRef]
- Westacott, L.J.; Wilkinson, L.S. Complement Dependent Synaptic Reorganisation during Critical Periods of Brain Development and Risk for Psychiatric Disorder. Front. Neurosci. 2022, 16, 840266. [Google Scholar] [CrossRef]
- Wu, T.; Dejanovic, B.; Gandham, V.D.; Gogineni, A.; Edmonds, R.; Schauer, S.; Srinivasan, K.; Huntley, M.A.; Wang, Y.; Wang, T.-M.; et al. Complement C3 Is Activated in Human AD Brain and Is Required for Neurodegeneration in Mouse Models of Amyloidosis and Tauopathy. Cell Rep. 2019, 28, 2111–2123.e6. [Google Scholar] [CrossRef]
- Lee, J.M.; Kim, S.R. Prothrombin Kringle-2, a Mediator of Microglial Activation: New Insight in Alzheimer’s Disease Pathogenesis. Neural Regen. Res. 2022, 17, 2675–2676. [Google Scholar]
- Rotunno, M.S.; Lane, M.; Zhang, W.; Wolf, P.; Oliva, P.; Viel, C.; Wills, A.-M.; Alcalay, R.N.; Scherzer, C.R.; Shihabuddin, L.S.; et al. Cerebrospinal Fluid Proteomics Implicates the Granin Family in Parkinson’s Disease. Sci. Rep. 2020, 10, 2479. [Google Scholar] [CrossRef]
- Chen, X.; Li, X.; Hu, X.; Jiang, F.; Shen, Y.; Xu, R.; Wu, L.; Wei, P.; Shen, X. LUM Expression and Its Prognostic Significance in Gastric Cancer. Front. Oncol. 2020, 10, 605. [Google Scholar] [CrossRef]
- Huang, M.; Qi, W.; Fang, S.; Jiang, P.; Yang, C.; Mo, Y.; Dong, C.; Li, Y.; Zhong, J.; Cai, W.; et al. Pigment Epithelium-Derived Factor Plays a Role in Alzheimer’s Disease by Negatively Regulating Aβ42. Neurotherapeutics 2018, 15, 728–741. [Google Scholar] [CrossRef]
- Wurster, C.D.; Koch, J.C.; Cordts, I.; Dreyhaupt, J.; Otto, M.; Uzelac, Z.; Witzel, S.; Winter, B.; Kocak, T.; Schocke, M.; et al. Routine Cerebrospinal Fluid (CSF) Parameters in Patients with Spinal Muscular Atrophy (SMA) Treated with Nusinersen. Front. Neurol. 2019, 10, 1179. [Google Scholar] [CrossRef] [PubMed]
- Musaeus, C.S.; Gleerup, H.S.; Høgh, P.; Waldemar, G.; Hasselbalch, S.G.; Simonsen, A.H. Cerebrospinal Fluid/Plasma Albumin Ratio as a Biomarker for Blood-Brain Barrier Impairment Across Neurodegenerative Dementias. J. Alzheimers. Dis. 2020, 75, 429–436. [Google Scholar] [CrossRef]
- Shelton, A.L.; Wang, J.Y.; Fourie, E.; Tassone, F.; Chen, A.; Frizzi, L.; Hagerman, R.J.; Ferrer, E.; Hessl, D.; Rivera, S.M. Middle Cerebellar Peduncle Width-A Novel MRI Biomarker for FXTAS? Front. Neurosci. 2018, 12, 379. [Google Scholar] [CrossRef] [PubMed]
- Bacalman, S.; Farzin, F.; Bourgeois, J.A.; Cogswell, J.; Goodlin-Jones, B.L.; Gane, L.W.; Grigsby, J.; Leehey, M.A.; Tassone, F.; Hagerman, R.J. Psychiatric Phenotype of the Fragile X-Associated Tremor/ataxia Syndrome (FXTAS) in Males: Newly Described Fronto-Subcortical Dementia. J. Clin. Psychiatry 2006, 67, 87–94. [Google Scholar] [CrossRef] [PubMed]
- Zafarullah, M.; Tassone, F. Fragile X-Associated Tremor/Ataxia Syndrome (FXTAS). Methods Mol. Biol. 2019, 1942, 173–189. [Google Scholar]
- Tassone, F.; Pan, R.; Amiri, K.; Taylor, A.K.; Hagerman, P.J. A Rapid Polymerase Chain Reaction-Based Screening Method for Identification of All Expanded Alleles of the Fragile X (FMR1) Gene in Newborn and High-Risk Populations. J. Mol. Diagn. 2008, 10, 43–49. [Google Scholar] [CrossRef]
- Filipovic-Sadic, S.; Sah, S.; Chen, L.; Krosting, J.; Sekinger, E.; Zhang, W.; Hagerman, P.J.; Stenzel, T.T.; Hadd, A.G.; Latham, G.J.; et al. A Novel FMR1 PCR Method for the Routine Detection of Low Abundance Expanded Alleles and Full Mutations in Fragile X Syndrome. Clin. Chem. 2010, 56, 399–408. [Google Scholar] [CrossRef]
- Rohart, F.; Gautier, B.; Singh, A.; Cao, K.-A.L. mixOmics: An R Package for ‘omics Feature Selection and Multiple Data Integration. PLoS Comput. Biol. 2017, 13, e1005752. [Google Scholar] [CrossRef]


| Non-Converter (n = 19) | Converter (n = 17) | Healthy Control (n = 12) | p-Value | |
|---|---|---|---|---|
| Age | ||||
| N | 19 | 17 | 12 | |
| Mean (SD) | 57.2 (8.2) | 53.2 (6.9) | 50.2 (5.2) | 0.0319 |
| Median (Range) | 59 (44–68) | 53 (42–65) | 49 (45–63) | |
| CGG repeat | ||||
| N | 19 | 17 | 12 | |
| Mean (SD) | 82.9 (22) | 90.2 (21.4) | 29.8 (2.4) | <0.001 |
| Median (Range) | 78 (56–135) | 85 (60–141) | 30 (23–32) |
| Sr # | PG Protein Accessions | PG Genes | PG Protein Descriptions | Converter V2_v_HealthyControl | Converter_v_NonConverter_V1 | Converter_v_NonConverter_V2 | Pre_v_Control_Baseline | V2_v_V1_Converter | V2_v_V1_NonConverter |
|---|---|---|---|---|---|---|---|---|---|
| 1 | P55957 | BID | BH3-interacting domain death agonist | 0.330961 | 0.000163 | 0.0184426 | 0.903113 | 0.000126 | 0.2063338 |
| 2 | P00403 | MT-CO2 | Cytochrome c oxidase subunit 2 | 0.001902 | 0.0000083 | 0.2557524 | 0.386688 | 8.5 × 10⁻⁶ | 0.5831517 |
| 3 | O75531 | BANF1 | Barrier-to-autointegration factor | 0.0001968 | 0.0000173 | 0.1435231 | 0.176737 | 0.003215 | 0.9627627 |
| 4 | P20674 | COX5A | Cytochrome c oxidase subunit 5A, mitochondrial | 0.0001968 | 0.0000002 | 0.7346092 | 0.13 | 5 × 10⁻⁷ | 0.9955487 |
| 5 | Q8NFW8 | CMAS | N-acylneuraminate cytidylyltransferase | 0.707128 | 0.000004 | 0.0590233 | 0.958116 | 0.000762 | 0.8246921 |
| 6 | Q15370 | ELOB | Elongin-B | 0.9778348 | 0.0005851 | 0.0004076 | 0.886594 | 0.234448 | 0.499658 |
| 7 | Q9Y3B2 | EXOSC1 | Exosome complex component CSL4 | 0.9398573 | 0.0000276 | 0.0450991 | 0.91006 | 0.009782 | 0.8639569 |
| 8 | P62310 | LSM3 | U6 snRNA-associated Sm-like protein LSm3 | 0.0135975 | 0.0000349 | 0.4197721 | 0.342944 | 9.16 × 10⁻⁵ | 0.8092159 |
| 9 | Q92769 | HDAC2 | Histone deacetylase 2 | 0.5817782 | 0.0015861 | 0.002199 | 0.421168 | 0.055764 | 0.3596959 |
| 10 | P42025 | ACTR1B | Beta-centractin | 0.7463896 | 0.0034287 | 0.0000198 | 0.920365 | 0.498285 | 0.2063338 |
| 11 | P17676 | CEBPB | CCAAT/enhancer-binding protein beta | 0.3772653 | 0.0006946 | 0.0443946 | 0.649723 | 0.035408 | 0.7433883 |
| 12 | Q6P1A2 | LPCAT3 | Lysophospholipid acyltransferase 5 | 0.2781298 | 0.0015861 | 0.077895 | 0.783158 | 0.008247 | 0.499658 |
| 13 | O00422 | SAP18 | Histone deacetylase complex subunit SAP18 | 0.2733554 | 0.0082336 | 0.1201545 | 0.941093 | 0.003919 | 0.3596959 |
| 14 | P14406 | COX7A2 | Cytochrome c oxidase subunit 7A2, mitochondrial | 0.0793535 | 0.0017415 | 0.1493414 | 0.477268 | 0.008643 | 0.6176757 |
| 15 | P01909 | HLA-DQA1 | HLA class II histocompatibility antigen, DQ alpha 1 chain | 0.8705704 | 0.0016708 | 0.0405223 | 0.389286 | 0.014566 | 0.4822303 |
| 16 | O95716 | RAB3D | Ras-related protein Rab-3D | 0.4995509 | 0.0015529 | 0.0639465 | 0.833119 | 0.031063 | 0.6751625 |
| 17 | O95182 | NDUFA7 | NADH dehydrogenase [ubiquinone] 1 alpha subcomplex subunit 7 | 0.8813178 | 0.0191425 | 0.0030663 | 0.625891 | 0.114989 | 0.2063338 |
| 18 | P83881; Q969Q0 | RPL36A; RPL36AL | 60S ribosomal protein L36a; 60S ribosomal protein L36a-like | 0.3613339 | 0.0037113 | 0.132179 | 0.890401 | 0.033957 | 0.6898521 |
| 19 | Q8N699 | MYCT1 | Myc target protein 1 | 0.5533207 | 0.0043394 | 0.0155536 | 0.942197 | 0.017778 | 0.2948038 |
| 20 | P51148 | RAB5C | Ras-related protein Rab-5C | 0.4621168 | 0.003153 | 0.0386719 | 0.630496 | 0.088983 | 0.6539073 |
| 21 | P12829 | MYL4 | Myosin light chain 4 | 0.8810339 | 0.0180141 | 0.0002622 | 0.937117 | 0.633167 | 0.2948038 |
| 22 | Q8NHV1 | GIMAP7 | GTPase IMAP family member 7 | 0.5083015 | 0.0011011 | 0.0041675 | 0.585434 | 0.14075 | 0.5669873 |
| 23 | Q9UDW1 | UQCR10 | Cytochrome b-c1 complex subunit 9 | 0.6214831 | 0.0185665 | 0.1445605 | 0.771541 | 0.010801 | 0.4096213 |
| 24 | P62854 | RPS26 | 40S ribosomal protein S26 | 0.7675159 | 0.0011011 | 0.1690844 | 0.846943 | 0.008895 | 0.7317184 |
| 25 | P07919 | UQCRH | Cytochrome b-c1 complex subunit 6, mitochondrial | 0.0276532 | 0.0006946 | 0.7931993 | 0.688736 | 0.000646 | 0.9420505 |
| 26 | Q96CN7 | ISOC1 | Isochorismatase domain-containing protein 1 | 0.9540223 | 0.0006946 | 0.2221959 | 0.642702 | 0.004467 | 0.7459911 |
| 27 | P30048 | PRDX3 | Thioredoxin-dependent peroxide reductase, mitochondrial | 0.8126683 | 0.0024886 | 0.0008139 | 0.903113 | 0.583097 | 0.633638 |
| 28 | O14980 | XPO1 | Exportin-1 | 0.496806 | 0.0033645 | 0.0157841 | 0.292174 | 0.088983 | 0.5036518 |
| 29 | P10155 | RO60 | 60 kDa SS-A/Ro ribonucleoprotein | 0.8958494 | 0.003992 | 0.0982565 | 0.879425 | 0.041899 | 0.6641875 |
| 30 | P14854 | COX6B1 | Cytochrome c oxidase subunit 6B1 | 0.2523229 | 0.0019848 | 0.2434441 | 0.692178 | 0.015693 | 0.8107049 |
| 31 | P27338 | MAOB | Amine oxidase [flavin-containing] B | 0.7579699 | 0.0114213 | 0.0791405 | 0.958401 | 0.077641 | 0.5831517 |
| 32 | Q9NWH9 | SLTM | SAFB-like transcription modulator | 0.65767 | 0.0011011 | 0.3615714 | 0.822037 | 0.00603 | 0.8663002 |
| 33 | Q7LBR1 | CHMP1B | Charged multivesicular body protein 1b | 0.9983177 | 0.0080553 | 0.077895 | 0.757183 | 0.048739 | 0.5340208 |
| 34 | O14949 | UQCRQ | Cytochrome b-c1 complex subunit 8 | 0.2781298 | 0.0025569 | 0.3618405 | 0.864467 | 0.004467 | 0.7117886 |
| 35 | O76021 | RSL1D1 | Ribosomal L1 domain-containing protein 1 | 0.9556111 | 0.0029101 | 0.0961799 | 0.934403 | 0.082046 | 0.8256684 |
| 36 | Q9BY77 | POLDIP3 | Polymerase delta-interacting protein 3 | 0.9939751 | 0.0015861 | 0.0193043 | 0.971953 | 0.18299 | 0.7712084 |
| 37 | P84098 | RPL19 | 60S ribosomal protein L19 | 0.447567 | 0.0026024 | 0.208154 | 0.64276 | 0.050668 | 0.9332484 |
| 38 | Q8NEW0 | SLC30A7 | Zinc transporter 7 | 0.9047438 | 0.0011011 | 0.2681998 | 0.785538 | 0.014566 | 0.9132308 |
| 39 | O60831 | PRAF2 | PRA1 family protein 2 | 0.7675159 | 0.0187209 | 0.0445152 | 0.921153 | 0.191474 | 0.5792395 |
| 40 | P25490 | YY1 | Transcriptional repressor protein YY1 | 0.3425898 | 0.0006946 | 0.1971043 | 0.340162 | 0.108937 | 0.7852614 |
| 41 | P54578 | USP14 | Ubiquitin carboxyl-terminal hydrolase 14 | 0.7001369 | 0.0117166 | 0.155195 | 0.914396 | 0.011072 | 0.4529446 |
| 42 | O95299 | NDUFA10 | NADH dehydrogenase [ubiquinone] 1 alpha subcomplex subunit 10, mitochondrial | 0.7675159 | 0.02368 | 0.0177951 | 0.251517 | 0.027293 | 0.2063338 |
| 43 | P50552 | VASP | Vasodilator-stimulated phosphoprotein | 0.0001968 | 0.0006946 | 0.1645395 | 0.281154 | 1.93 × 10⁻⁵ | 0.7253255 |
| 44 | P62993 | GRB2 | Growth factor receptor-bound protein 2 | 0.0002878 | 0.0206862 | 0.9579479 | 0.11054 | 0.003685 | 0.8107049 |
| 45 | Q9NRX4 | PHPT1 | 14 kDa phosphohistidine phosphatase | 0.6110357 | 0.0047335 | 0.2458114 | 0.881767 | 0.075083 | 0.9420505 |
| 46 | P51809 | VAMP7 | Vesicle-associated membrane protein 7 | 0.9487359 | 0.1044092 | 0.0007722 | 0.980205 | 0.314721 | 0.0612594 |
| 47 | Q9Y3A3 | MOB4 | MOB-like protein phocein | 0.5092093 | 0.0915321 | 0.0523055 | 0.780941 | 0.251271 | 0.4529446 |
| 48 | Q9P1F3 | ABRACL | Costars family protein ABRACL | 0.8953855 | 0.0308248 | 0.1269368 | 0.773045 | 0.048739 | 0.481216 |
| 49 | P30049 | ATP5F1D | ATP synthase subunit delta, mitochondrial | 0.0827237 | 0.0242103 | 0.1852471 | 0.229557 | 0.178417 | 0.7992426 |
| 50 | P42285 | MTREX | Exosome RNA helicase MTR4 | 0.4153117 | 0.0080553 | 0.0122675 | 0.421857 | 0.194376 | 0.499658 |
| 51 | Q9UK76 | JPT1 | Jupiter microtubule associated homolog 1 | 0.5063727 | 0.0189857 | 0.1924087 | 0.831264 | 0.04887 | 0.6224493 |
| 52 | Q8IV08 | PLD3 | Phospholipase D3 | 0.8688999 | 0.0030172 | 0.0430464 | 0.783158 | 0.092923 | 0.6898521 |
| 53 | P62306 | SNRPF | Small nuclear ribonucleoprotein F | 0.0320778 | 0.0117166 | 0.7274526 | 0.752206 | 0.010346 | 0.8387102 |
| 54 | Q99536 | VAT1 | Synaptic vesicle membrane protein VAT-1 homolog | 0.3425898 | 0.0029101 | 0.3914526 | 0.60927 | 0.019668 | 0.9275825 |
| 55 | Q15102 | PAFAH1B3 | Platelet-activating factor acetylhydrolase IB subunit gamma | 0.7602693 | 0.0043843 | 0.3073004 | 0.833119 | 0.011757 | 0.7161634 |
| 56 | Q9Y3B7 | MRPL11 | 39S ribosomal protein L11, mitochondrial | 0.4919452 | 0.0167599 | 0.0333048 | 0.30862 | 0.096942 | 0.4594807 |
| 57 | Q9Y5Z4 | HEBP2 | Heme-binding protein 2 | 0.8966822 | 0.0242103 | 0.0410507 | 0.950572 | 0.106176 | 0.4529446 |
| 58 | O95139 | NDUFB6 | NADH dehydrogenase [ubiquinone] 1 beta subcomplex subunit 6 | 0.7001369 | 0.0109981 | 0.2656104 | 0.881767 | 0.030425 | 0.7063057 |
| 59 | Q6IAA8 | LAMTOR1 | Ragulator complex protein LAMTOR1 | 0.8892256 | 0.0676655 | 0.0333048 | 0.553347 | 0.137919 | 0.3596959 |
| 60 | O00483 | NDUFA4 | Cytochrome c oxidase subunit NDUFA4 | 0.7787789 | 0.0043843 | 0.0004076 | 0.771541 | 0.968941 | 0.6960786 |
| 61 | P49065 | ALB | Serum albumin | 0.0001968 | 0.3958862 | 0.0017581 | 0.101752 | 0.050668 | 0.9332484 |
| 62 | P04217 | A1BG | Alpha-1B-glycoprotein | 0.0000005 | 0.0882604 | 0.0008139 | 0.076083 | 0.310441 | 0.8111847 |
| 63 | P02452 | COL1A1 | Collagen alpha-1(I) chain | 0.0001968 | 0.9098129 | 0.0112894 | 0.012023 | 0.020765 | 0.8570423 |
| 64 | P10412 | HIST1H1E | Histone H1.4 | 0.0002878 | 0.1925862 | 0.0030893 | 0.058588 | 0.006362 | 0.4096213 |
| 65 | P02760 | AMBP | Protein AMBP | 0.0002878 | 0.2220095 | 0.0091412 | 0.058588 | 0.422431 | 0.8428062 |
| 66 | P05543 | SERPINA7 | Thyroxine-binding globulin | 0.0056139 | 0.3415665 | 0.0014646 | 0.23407 | 0.12332 | 0.7834307 |
| 67 | P60660 | MYL6 | Myosin light polypeptide 6 | 0.0002878 | 0.3674064 | 0.0199639 | 0.024347 | 0.041899 | 0.499658 |
| 68 | P08697 | SERPINF2 | Alpha-2-antiplasmin | 0.0007936 | 0.0297095 | 0.0004076 | 0.237164 | 0.414601 | 0.8286978 |
| 69 | Q15907 | RAB11B | Ras-related protein Rab-11B | 0.0024077 | 0.7777295 | 0.0092849 | 0.38221 | 0.011072 | 0.8428062 |
| 70 | Q9Y6W5 | WASF2 | Wiskott-Aldrich syndrome protein family member 2 | 0.0002878 | 0.4113262 | 0.0073602 | 0.468022 | 0.004467 | 0.7106443 |
| 71 | P12109 | COL6A1 | Collagen alpha-1(VI) chain | 0.001902 | 0.8530394 | 0.0200518 | 0.292934 | 0.029598 | 0.9623254 |
| 72 | Q9BRA2 | TXNDC17 | Thioredoxin domain-containing protein 17 | 0.0045339 | 0.8419097 | 0.020576 | 0.278214 | 0.115543 | 0.8520701 |
| 73 | Q8N386 | LRRC25 | Leucine-rich repeat-containing protein 25 | 0.0349695 | 0.0514834 | 0.000297 | 0.433359 | 0.574902 | 0.5565245 |
| 74 | P51884 | LUM | Lumican | 0.0119658 | 0.502447 | 0.0184426 | 0.30862 | 0.27929 | 0.8465036 |
| 75 | O95168 | NDUFB4 | NADH dehydrogenase [ubiquinone] 1 beta subcomplex subunit 4 | 0.005601 | 0.0199489 | 0.0003307 | 0.32246 | 0.929963 | 0.5115525 |
| 76 | P63027 | VAMP2 | Vesicle-associated membrane protein 2 | 0.0003153 | 0.956101 | 0.3489073 | 0.068855 | 0.291336 | 0.9204359 |
| 77 | Q8IZ07 | ANKRD13A | Ankyrin repeat domain-containing protein 13A | 0.0912438 | 0.1693605 | 0.0021475 | 0.147105 | 0.80839 | 0.4980031 |
| 78 | Q8WYJ6 | SEPTIN1 | Septin-1 | 0.0272654 | 0.6266639 | 0.0882902 | 0.358434 | 0.152744 | 0.876325 |
| 79 | P51570 | GALK1 | Galactokinase | 0.0171924 | 0.5636075 | 0.0008139 | 0.183522 | 0.658335 | 0.2746342 |
| Sr # | Protein Accessions | Genes | logFC | Ave Expr | p-Value | adj.P Val | Protein Descriptions |
|---|---|---|---|---|---|---|---|
| 1 | P20674 | COX5A | 1.11 | 13.73 | 8.45 × 10⁻¹¹ | 1.83 × 10⁻⁷ | Cytochrome c oxidase subunit 5A, mitochondrial |
| 2 | Q8NFW8 | CMAS | 1.82 | 13.4 | 3.73 × 10⁻⁹ | 4.04 × 10⁻⁶ | N-acylneuraminate cytidylyltransferase |
| 3 | P00403 | MT-CO2 | 1.22 | 14.45 | 1.15 × 10⁻⁸ | 8.27 × 10⁻⁶ | Cytochrome c oxidase subunit 2 |
| 4 | O75531 | BANF1 | 3.23 | 13.92 | 3.19 × 10⁻⁸ | 1.73 × 10⁻⁵ | Barrier-to-autointegration factor |
| 5 | Q9Y3B2 | EXOSC1 | 0.85 | 12.98 | 6.37 × 10⁻⁸ | 2.76 × 10⁻⁵ | Exosome complex component CSL4 |
| 6 | P62310 | LSM3 | 1.09 | 13.49 | 9.67 × 10⁻⁸ | 3.49 × 10⁻⁵ | U6 snRNA-associated Sm-like protein LSm3 |
| 7 | P55957 | BID | 1.59 | 13.87 | 5.27 × 10⁻⁷ | 0.00016297 | BH3-interacting domain death agonist |
| 8 | Q15370 | ELOB | 1 | 13.11 | 2.16 × 10⁻⁶ | 0.00058509 | Elongin-B |
| 9 | P25490 | YY1 | 0.69 | 13.27 | 3.26 × 10⁻⁶ | 0.0006946 | Transcriptional repressor protein YY1 |
| 10 | Q96N66 | MBOAT7 | 1.49 | 13.45 | 3.48 × 10⁻⁶ | 0.0006946 | Lysophospholipid acyltransferase 7 |
| 11 | P17676 | CEBPB | 2.16 | 13.57 | 3.67 × 10⁻⁶ | 0.0006946 | CCAAT/enhancer-binding protein beta |
| 12 | P50552 | VASP | −0.45 | 15.4 | 3.90 × 10⁻⁶ | 0.0006946 | Vasodilator-stimulated phosphoprotein |
| 13 | Q96CN7 | ISOC1 | 1.29 | 13.18 | 4.39 × 10⁻⁶ | 0.0006946 | Isochorismatase domain-containing protein 1 |
| 14 | P07919 | UQCRH | 0.97 | 13.2 | 4.49 × 10⁻⁶ | 0.0006946 | Cytochrome b-c1 complex subunit 6, mitochondrial |
| 15 | P62854 | RPS26 | 2.28 | 14.52 | 8.22 × 10⁻⁶ | 0.00110109 | 40S ribosomal protein S26 |
| 16 | Q8NHV1 | GIMAP7 | 0.9 | 13 | 8.71 × 10⁻⁶ | 0.00110109 | GTPase IMAP family member 7 |
| 17 | Q8NEW0 | SLC30A7 | 2.29 | 13.65 | 8.81 × 10⁻⁶ | 0.00110109 | Zinc transporter 7 |
| 18 | Q9NWH9 | SLTM | 3.08 | 13.68 | 9.48 × 10⁻⁶ | 0.00110109 | SAFB-like transcription modulator |
| 19 | O15347 | HMGB3 | 0.84 | 15.94 | 9.66 × 10⁻⁶ | 0.00110109 | High mobility group protein B3 |
| 20 | O95716 | RAB3D | 2.06 | 14.75 | 1.43 × 10⁻⁵ | 0.00155291 | Ras-related protein Rab-3D |
| 21 | Q92769 | HDAC2 | 0.52 | 12.95 | 1.58 × 10⁻⁵ | 0.00158606 | Histone deacetylase 2 |
| 22 | P31949 | S100A11 | 0.77 | 14.52 | 1.66 × 10⁻⁵ | 0.00158606 | Protein S100-A11 |
| 23 | Q9BY77 | POLDIP3 | 0.87 | 12.95 | 1.75 × 10⁻⁵ | 0.00158606 | Polymerase delta-interacting protein 3 |
| 24 | Q6P1A2 | LPCAT3 | 1.52 | 13.45 | 1.76 × 10⁻⁵ | 0.00158606 | Lysophospholipid acyltransferase 5 |
| 25 | P01909 | HLA-DQA1 | 0.46 | 12.9 | 1.93 × 10⁻⁵ | 0.00167082 | HLA class II histocompatibility antigen, DQ alpha 1 chain |
| 26 | P14406 | COX7A2 | 1.56 | 13.67 | 2.09 × 10⁻⁵ | 0.00174149 | Cytochrome c oxidase subunit 7A2, mitochondrial |
| 27 | P14854 | COX6B1 | 1.13 | 13.72 | 2.47 × 10⁻⁵ | 0.00198483 | Cytochrome c oxidase subunit 6B1 |
| 28 | Q9UBW5 | BIN2 | −0.33 | 14.52 | 2.93 × 10⁻⁵ | 0.00226447 | Bridging integrator 2 |
| 29 | P02656 | APOC3 | 1.58 | 14.74 | 3.27 × 10⁻⁵ | 0.00244275 | Apolipoprotein C-III |
| 30 | P30048 | PRDX3 | 0.75 | 14.71 | 3.45 × 10⁻⁵ | 0.00248864 | Thioredoxin-dependent peroxide reductase, mitochondrial |
| 31 | P62857 | RPS28 | 0.99 | 15.39 | 3.69 × 10⁻⁵ | 0.00255693 | 40S ribosomal protein S28 |
| 32 | O14949 | UQCRQ | 1.18 | 13.37 | 3.78 × 10⁻⁵ | 0.00255693 | Cytochrome b-c1 complex subunit 8 |
| 33 | P84098 | RPL19 | 1.21 | 14.21 | 3.96 × 10⁻⁵ | 0.00260242 | 60S ribosomal protein L19 |
| 34 | O43760 | SYNGR2 | 0.8 | 13.78 | 4.20 × 10⁻⁵ | 0.00267673 | Synaptogyrin-2 |
| 35 | Q02750 | MAP2K1 | 2.54 | 15.39 | 4.77 × 10⁻⁵ | 0.00291015 | Dual specificity mitogen-activated protein kinase kinase 1 |
| 36 | Q99536 | VAT1 | 0.53 | 13.63 | 4.91 × 10⁻⁵ | 0.00291015 | Synaptic vesicle membrane protein VAT-1 homolog |
| 37 | O76021 | RSL1D1 | 1.07 | 13.43 | 5.09 × 10⁻⁵ | 0.00291015 | Ribosomal L1 domain-containing protein 1 |
| 38 | P62995 | TRA2B | 1.26 | 13.66 | 5.11 × 10⁻⁵ | 0.00291015 | Transformer-2 protein homolog beta |
| 39 | Q8IV08 | PLD3 | 0.63 | 12.92 | 5.48 × 10⁻⁵ | 0.00301717 | Phospholipase D3 |
| 40 | P98179 | RBM3 | 0.68 | 13.43 | 5.57 × 10⁻⁵ | 0.00301717 | RNA-binding protein 3 |
| 41 | P51148 | RAB5C | 0.86 | 13.94 | 5.97 × 10⁻⁵ | 0.00315297 | Ras-related protein Rab-5C |
| 42 | O14980 | XPO1 | −0.26 | 12.95 | 6.52 × 10⁻⁵ | 0.00336451 | Exportin-1 |
| 43 | Q02108 | GUCY1A1 | 0.49 | 12.9 | 6.71 × 10⁻⁵ | 0.00338228 | Guanylate cyclase soluble subunit alpha-1 |
| 44 | O75439 | PMPCB | 1.38 | 13.85 | 7.10 × 10⁻⁵ | 0.00342866 | Mitochondrial-processing peptidase subunit beta |
| 45 | Q7Z4Q2 | HEATR3 | 0.44 | 12.81 | 7.36 × 10⁻⁵ | 0.00342866 | HEAT repeat-containing protein 3 |
| 46 | Q13884 | SNTB1 | −0.31 | 13.21 | 7.37 × 10⁻⁵ | 0.00342866 | Beta-1-syntrophin |
| 47 | Q9Y266 | NUDC | 1.4 | 13.07 | 7.57 × 10⁻⁵ | 0.00342866 | Nuclear migration protein nudC |
| 48 | P42025 | ACTR1B | 0.52 | 12.99 | 7.60 × 10⁻⁵ | 0.00342866 | Beta-centractin |
| 49 | Q04323 | UBXN1 | 2.36 | 13.61 | 8.12 × 10⁻⁵ | 0.00359083 | UBX domain-containing protein 1 |
| 50 | P83881; Q969Q0 | RPL36A; RPL36AL | 1.24 | 13.66 | 8.57 × 10⁻⁵ | 0.00371127 | 60S ribosomal protein L36a; 60S ribosomal protein L36a-like |
| 51 | Q86WV1 | SKAP1 | 1.57 | 13.51 | 9.38 × 10⁻⁵ | 0.00398485 | Src kinase-associated phosphoprotein 1 |
| 52 | P10155 | RO60 | 0.51 | 13.52 | 9.58 × 10⁻⁵ | 0.00399203 | 60 kDa SS-A/Ro ribonucleoprotein |
| 53 | P62877 | RBX1 | 3.27 | 14.68 | 0.00010525 | 0.00428208 | E3 ubiquitin-protein ligase RBX1 |
| 54 | P53041 | PPP5C | 0.93 | 13.06 | 0.00010676 | 0.00428208 | Serine/threonine-protein phosphatase 5 |
| 55 | Q8N699 | MYCT1 | 1.31 | 13.32 | 0.00011019 | 0.00433936 | Myc target protein 1 |
| 56 | Q15102 | PAFAH1B3 | 1.69 | 13.31 | 0.00011444 | 0.00438431 | Platelet-activating factor acetylhydrolase IB subunit gamma |
| 57 | O00483 | NDUFA4 | 1.95 | 14.82 | 0.00011538 | 0.00438431 | Cytochrome c oxidase subunit NDUFA4 |
| 58 | Q86YP4 | GATAD2A | 2.45 | 14.08 | 0.000118 | 0.00440654 | Transcriptional repressor p66-alpha |
| 59 | Q9NRX4 | PHPT1 | 0.63 | 12.9 | 0.0001294 | 0.00473352 | 14 kDa phosphohistidine phosphatase |
| 60 | O75116 | ROCK2 | −0.27 | 13.28 | 0.00013112 | 0.00473352 | Rho-associated protein kinase 2 |
| 61 | P55265 | ADAR | −0.36 | 13.04 | 0.00013491 | 0.00479042 | Double-stranded RNA-specific adenosine deaminase |
| 62 | P16333 | NCK1 | 1.05 | 13.17 | 0.00013831 | 0.00480724 | Cytoplasmic protein NCK1 |
| 63 | P31645 | SLC6A4 | 1.57 | 13.26 | 0.00013982 | 0.00480724 | Sodium-dependent serotonin transporter |
| 64 | Q9UK45 | LSM7 | 4.39 | 15.02 | 0.00014412 | 0.00486792 | U6 snRNA-associated Sm-like protein LSm7 |
| 65 | P0DP23; P0DP24; P0DP25 | CALM1; CALM2; CALM3 | 0.49 | 13.84 | 0.00014608 | 0.00486792 | Calmodulin-1; Calmodulin-2; Calmodulin-3 |
| 66 | P78406 | RAE1 | −0.36 | 13.07 | 0.00014953 | 0.00490735 | mRNA export factor |
| 67 | O95433 | AHSA1 | 0.99 | 13.17 | 0.0001634 | 0.00528231 | Activator of 90 kDa heat shock protein ATPase homolog 1 |
| 68 | Q9BQ61 | TRIR | 0.78 | 12.89 | 0.00016598 | 0.00528682 | Telomerase RNA component interacting RNase |
| 69 | P04350 | TUBB4A | 0.56 | 12.94 | 0.00017133 | 0.0053782 | Tubulin beta-4A chain |
| 70 | P02751 | FN1 | −0.3 | 13.7 | 0.0002119 | 0.00655692 | Fibronectin |
| 71 | Q13363 | CTBP1 | 0.42 | 13.34 | 0.00025616 | 0.00781477 | C-terminal-binding protein 1 |
| 72 | Q7LBR1 | CHMP1B | 2.32 | 13.74 | 0.00027002 | 0.00805526 | Charged multivesicular body protein 1b |
| 73 | P42285 | MTREX | 0.52 | 12.85 | 0.00027148 | 0.00805526 | Exosome RNA helicase MTR4 |
| 74 | O00422 | SAP18 | 2.5 | 14.61 | 0.00028182 | 0.00823363 | Histone deacetylase complex subunit SAP18 |
| 75 | O00193 | SMAP | 0.43 | 12.87 | 0.0002851 | 0.00823363 | Small acidic protein |
| 76 | Q9Y5X3 | SNX5 | −0.56 | 12.78 | 0.00036723 | 0.01046605 | Sorting nexin-5 |
| 77 | P20339 | RAB5A | 0.71 | 14.8 | 0.00037375 | 0.01051357 | Ras-related protein Rab-5A |
| 78 | P62273 | RPS29 | 0.52 | 13.31 | 0.00038065 | 0.01057044 | 40S ribosomal protein S29 |
| 79 | P46379 | BAG6 | 0.91 | 13.18 | 0.00040004 | 0.01096815 | Large proline-rich protein BAG6 |
| 80 | O95139 | NDUFB6 | 0.99 | 13.25 | 0.00040621 | 0.01099807 | NADH dehydrogenase [ubiquinone] 1 beta subcomplex subunit 6 |
| 81 | P63165 | SUMO1 | 2 | 13.75 | 0.00042395 | 0.01133665 | Small ubiquitin-related modifier 1 |
| 82 | P27338 | MAOB | −0.3 | 13.33 | 0.00043239 | 0.01142134 | Amine oxidase [flavin-containing] B |
| 83 | Q9H4G4 | GLIPR2 | 0.54 | 15.52 | 0.00045783 | 0.0117166 | Golgi-associated plant pathogenesis-related protein 1 |
| 84 | Q96EY8 | MMAB | 0.47 | 12.96 | 0.00045894 | 0.0117166 | Corrinoid adenosyltransferase |
| 85 | O00487 | PSMD14 | 1.12 | 13.34 | 0.00046704 | 0.0117166 | 26S proteasome non-ATPase regulatory subunit 14 |
| 86 | P04424 | ASL | 0.45 | 13.02 | 0.00046985 | 0.0117166 | Argininosuccinate lyase |
| 87 | Q96K37 | SLC35E1 | −0.44 | 12.86 | 0.00047521 | 0.0117166 | Solute carrier family 35 member E1 |
| 88 | A5YKK6 | CNOT1 | 0.46 | 12.8 | 0.00047814 | 0.0117166 | CCR4-NOT transcription complex subunit 1 |
| 89 | P62306 | SNRPF | 1.14 | 14.31 | 0.00048471 | 0.0117166 | Small nuclear ribonucleoprotein F |
| 90 | P54578 | USP14 | 0.51 | 13.49 | 0.00048684 | 0.0117166 | Ubiquitin carboxyl-terminal hydrolase 14 |
| 91 | Q9UIA9 | XPO7 | 2.14 | 14.44 | 0.00050346 | 0.01188018 | Exportin-7 |
| 92 | P49959 | MRE11 | −0.3 | 12.9 | 0.00050461 | 0.01188018 | Double-strand break repair protein MRE11 |
| 93 | P18206 | VCL | −0.32 | 14.87 | 0.0005265 | 0.01226224 | Vinculin |
| 94 | O43290 | SART1 | 1.32 | 13.35 | 0.00054598 | 0.01258082 | U4/U6.U5 tri-snRNP-associated protein 1 |
| 95 | O95819 | MAP4K4 | 0.57 | 14.63 | 0.00059275 | 0.01351476 | Mitogen-activated protein kinase kinase kinase kinase 4 |
| 96 | Q5T1M5 | FKBP15 | 0.48 | 13.35 | 0.00060115 | 0.01356334 | FK506-binding protein 15 |
| 97 | P02765 | AHSG | −0.74 | 18.91 | 0.00061844 | 0.0137706 | Alpha-2-HS-glycoprotein |
| 98 | O00170 | AIP | −0.35 | 13.19 | 0.00062305 | 0.0137706 | AH receptor-interacting protein |
| 99 | Q12907 | LMAN2 | 0.58 | 14.57 | 0.0006296 | 0.01377496 | Vesicular integral-membrane protein VIP36 |
| 100 | Q8NFV4 | ABHD11 | 0.39 | 12.85 | 0.00065616 | 0.01421252 | Protein ABHD11 |
| 101 | P63000 | RAC1 | −0.26 | 15.49 | 0.00066636 | 0.01429044 | Ras-related C3 botulinum toxin substrate 1 |
| 102 | Q8NCG7 | DAGLB | 0.52 | 12.87 | 0.000727 | 0.01543803 | Sn1-specific diacylglycerol lipase beta |
| 103 | Q9BQE9 | BCL7B | 2.06 | 13.52 | 0.00078504 | 0.0165087 | B-cell CLL/lymphoma 7 protein family member B |
| 104 | P61964 | WDR5 | 1.58 | 13.48 | 0.00080743 | 0.01675991 | WD repeat-containing protein 5 |
| 105 | Q9Y3B7 | MRPL11 | 0.83 | 13.36 | 0.00081246 | 0.01675991 | 39S ribosomal protein L11, mitochondrial |
| 106 | Q8IX12 | CCAR1 | 0.87 | 13.45 | 0.00084694 | 0.01730627 | Cell division cycle and apoptosis regulator protein 1 |
| 107 | Q01658 | DR1 | 1.6 | 13.34 | 0.0008722 | 0.01764242 | Protein Dr1 |
| 108 | Q8IVB4 | SLC9A9 | 0.72 | 13.01 | 0.00087968 | 0.01764242 | Sodium/hydrogen exchanger 9 |
| 109 | P12829 | MYL4 | 1.01 | 13.41 | 0.00090653 | 0.01801412 | Myosin light chain 4 |
| 110 | Q99961 | SH3GL1 | −0.34 | 13.41 | 0.00092381 | 0.01819059 | Endophilin-A2 |
| 111 | Q9UDW1 | UQCR10 | 0.46 | 12.95 | 0.00095147 | 0.01856648 | Cytochrome b-c1 complex subunit 9 |
| 112 | O60831 | PRAF2 | 0.79 | 13.17 | 0.00096803 | 0.01872093 | PRA1 family protein 2 |
| 113 | Q9UK76 | JPT1 | 0.36 | 13.01 | 0.00099048 | 0.01898573 | Jupiter microtubule associated homolog 1 |
| 114 | P41226 | UBA7 | −0.28 | 13.15 | 0.00101087 | 0.01910907 | Ubiquitin-like modifier-activating enzyme 7 |
| 115 | O15173 | PGRMC2 | 0.3 | 13.43 | 0.00101456 | 0.01910907 | Membrane-associated progesterone receptor component 2 |
| 116 | O95182 | NDUFA7 | 1.09 | 13.78 | 0.00102517 | 0.01914249 | NADH dehydrogenase [ubiquinone] 1 alpha subcomplex subunit 7 |
| 117 | P62633 | CNBP | 0.87 | 13.43 | 0.00104734 | 0.01928702 | Cellular nucleic acid-binding protein |
| 118 | Q9UIG0 | BAZ1B | 1.4 | 13.31 | 0.00105072 | 0.01928702 | Tyrosine-protein kinase BAZ1B |
| 119 | O95168 | NDUFB4 | 1.4 | 14.47 | 0.00109599 | 0.01994894 | NADH dehydrogenase [ubiquinone] 1 beta subcomplex subunit 4 |
| 120 | Q93008 | USP9X | −0.37 | 13.01 | 0.001115 | 0.02012574 | Probable ubiquitin carboxyl-terminal hydrolase FAF-X |
| 121 | Q8WXF1 | PSPC1 | 0.43 | 13.62 | 0.0011414 | 0.02040483 | Paraspeckle component 1 |
| 122 | Q96JB5 | CDK5RAP3 | 1.49 | 13.69 | 0.0011493 | 0.02040483 | CDK5 regulatory subunit-associated protein 3 |
| 123 | Q6DD87 | ZNF787 | 0.45 | 12.84 | 0.00116082 | 0.02044178 | Zinc finger protein 787 |
| 124 | Q7Z6Z7 | HUWE1 | −0.24 | 12.95 | 0.00117746 | 0.02056758 | E3 ubiquitin-protein ligase HUWE1 |
| 125 | P62993 | GRB2 | 0.35 | 14.04 | 0.0011938 | 0.02068617 | Growth factor receptor-bound protein 2 |
| 126 | P68402 | PAFAH1B2 | 0.44 | 12.91 | 0.00122782 | 0.0210104 | Platelet-activating factor acetylhydrolase IB subunit beta |
| 127 | Q7RTV0 | PHF5A | 1.95 | 14.44 | 0.00123191 | 0.0210104 | PHD finger-like domain-containing protein 5A |
| 128 | O75368 | SH3BGRL | 0.58 | 14.02 | 0.00125309 | 0.02120469 | SH3 domain-binding glutamic acid-rich-like protein |
| 129 | Q9Y4L1 | HYOU1 | −0.25 | 13.33 | 0.00127233 | 0.02136329 | Hypoxia up-regulated protein 1 |
| 130 | Q9P035 | HACD3 | −0.29 | 13.02 | 0.00128789 | 0.02145828 | Very-long-chain (3R)-3-hydroxyacyl-CoA dehydratase 3 |
| 131 | Q9Y333 | LSM2 | −0.33 | 12.85 | 0.0013131 | 0.0215621 | U6 snRNA-associated Sm-like protein LSm2 |
| 132 | Q8TBC4 | UBA3 | 1.97 | 13.45 | 0.00132373 | 0.0215621 | NEDD8-activating enzyme E1 catalytic subunit |
| 133 | Q9C0C9 | UBE2O | −0.27 | 13.08 | 0.00132399 | 0.0215621 | (E3-independent) E2 ubiquitin-conjugating enzyme |
| 134 | Q92542 | NCSTN | 1.03 | 13.26 | 0.00147097 | 0.02366738 | Nicastrin |
| 135 | Q15056 | EIF4H | 0.62 | 13.81 | 0.00147511 | 0.02366738 | Eukaryotic translation initiation factor 4H |
| 136 | O95299 | NDUFA10 | −0.22 | 12.9 | 0.00148683 | 0.02368002 | NADH dehydrogenase [ubiquinone] 1 alpha subcomplex subunit 10, mitochondrial |
| 137 | P30049 | ATP5F1D | 1.96 | 15.01 | 0.0015432 | 0.02421028 | ATP synthase subunit delta, mitochondrial |
| 138 | Q9H3P7 | ACBD3 | 0.94 | 13.22 | 0.00154752 | 0.02421028 | Golgi resident protein GCP60 |
| 139 | Q96EP5 | DAZAP1 | 0.78 | 14.45 | 0.00155565 | 0.02421028 | DAZ-associated protein 1 |
| 140 | O00299 | CLIC1 | −0.26 | 16.01 | 0.00157157 | 0.02421028 | Chloride intracellular channel protein 1 |
| 141 | Q9Y5Z4 | HEBP2 | 0.23 | 13.05 | 0.00157602 | 0.02421028 | Heme-binding protein 2 |
| 142 | P49585 | PCYT1A | 0.62 | 13.12 | 0.00158822 | 0.02422601 | Choline-phosphate cytidylyltransferase A |
| 143 | P19784 | CSNK2A2 | 1.44 | 13.1 | 0.0016445 | 0.024909 | Casein kinase II subunit alpha’ |
| 144 | A0AVT1 | UBA6 | −0.26 | 12.99 | 0.00168755 | 0.02533419 | Ubiquitin-like modifier-activating enzyme 6 |
| 145 | P23141 | CES1 | 0.38 | 13.73 | 0.00169596 | 0.02533419 | Liver carboxylesterase 1 |
| 146 | P21333 | FLNA | −0.28 | 15.69 | 0.0017293 | 0.02565525 | Filamin-A |
| 147 | P04075 | ALDOA | −0.25 | 15.31 | 0.00186956 | 0.02749417 | Fructose-bisphosphate aldolase A |
| 148 | Q8IZP0 | ABI1 | 0.28 | 12.97 | 0.00187864 | 0.02749417 | Abl interactor 1 |
| 149 | Q9C0E8 | LNPK | 0.67 | 13.08 | 0.00194398 | 0.02818302 | Endoplasmic reticulum junction formation protein lunapark |
| 150 | P00747 | PLG | −0.35 | 13.73 | 0.00195293 | 0.02818302 | Plasminogen |
| 151 | P06239 | LCK | 0.42 | 13.25 | 0.00196621 | 0.02818302 | Tyrosine-protein kinase Lck |
| 152 | O14735 | CDIPT | 1.11 | 13.53 | 0.00197883 | 0.02818302 | CDP-diacylglycerol-inositol 3-phosphatidyltransferase |
| 153 | O00154 | ACOT7 | −0.35 | 12.91 | 0.00199077 | 0.02818302 | Cytosolic acyl coenzyme A thioester hydrolase |
| 154 | Q13435 | SF3B2 | −0.27 | 13.78 | 0.00200778 | 0.02823925 | Splicing factor 3B subunit 2 |
| 155 | Q14642 | INPP5A | 0.79 | 13.03 | 0.00202716 | 0.02828249 | Inositol polyphosphate-5-phosphatase A |
| 156 | P62328 | TMSB4X | −0.51 | 14.4 | 0.00203697 | 0.02828249 | Thymosin beta-4 |
| 157 | Q9Y3Y2 | CHTOP | 0.66 | 13.88 | 0.00206287 | 0.02830664 | Chromatin target of PRMT1 protein |
| 158 | Q8NBQ5 | HSD17B11 | 0.58 | 13.12 | 0.00206484 | 0.02830664 | Estradiol 17-beta-dehydrogenase 11 |
| 159 | Q15833 | STXBP2 | −0.21 | 13.63 | 0.00209062 | 0.0284634 | Syntaxin-binding protein 2 |
| 160 | Q32P28 | P3H1 | 0.46 | 12.87 | 0.00210256 | 0.0284634 | Prolyl 3-hydroxylase 1 |
| 161 | Q9Y5S9 | RBM8A | 0.46 | 14.02 | 0.00214639 | 0.02887632 | RNA-binding protein 8A |
| 162 | Q8N392 | ARHGAP18 | −0.36 | 13.81 | 0.00217155 | 0.02903448 | Rho GTPase-activating protein 18 |
| 163 | P04234 | CD3D | 1.07 | 13.67 | 0.00221957 | 0.02942847 | T-cell surface glycoprotein CD3 delta chain |
| 164 | P61803 | DAD1 | 0.97 | 14.32 | 0.00223253 | 0.02942847 | Dolichyl-diphosphooligosaccharide-protein glycosyltransferase subunit DAD1 |
| 165 | Q01518 | CAP1 | −0.21 | 15.06 | 0.00224178 | 0.02942847 | Adenylyl cyclase-associated protein 1 |
| 166 | P08697 | SERPINF2 | 1.26 | 15.88 | 0.0022769 | 0.02970948 | Alpha-2-antiplasmin |
| 167 | Q8WXF7 | ATL1 | 0.35 | 12.87 | 0.00233705 | 0.03031163 | Atlastin-1 |
| 168 | Q6P1M0 | SLC27A4 | 0.61 | 12.78 | 0.00235843 | 0.03040693 | Long-chain fatty acid transport protein 4 |
| 169 | Q9P1F3 | ABRACL | −0.2 | 12.79 | 0.00240918 | 0.03082475 | Costars family protein ABRACL |
| 170 | P01911 | HLA-DRB1 | 0.64 | 14.51 | 0.0024211 | 0.03082475 | HLA class II histocompatibility antigen, DRB1-15 beta chain |
| 171 | Q16643 | DBN1 | −0.3 | 13.49 | 0.00243353 | 0.03082475 | Drebrin |
| 172 | P11908 | PRPS2 | 1.43 | 13.64 | 0.00245004 | 0.03085338 | Ribose-phosphate pyrophosphokinase 2 |
| 173 | Q99439 | CNN2 | −0.29 | 14.25 | 0.00250122 | 0.03131584 | Calponin-2 |
| 174 | Q86UT6 | NLRX1 | −0.35 | 12.84 | 0.00251982 | 0.03134018 | NLR family member X1 |
| 175 | Q9NRL3 | STRN4 | 1.43 | 14.38 | 0.0025321 | 0.03134018 | Striatin-4 |
| 176 | Q9NZ45 | CISD1 | −0.42 | 12.92 | 0.00257935 | 0.03174358 | CDGSH iron-sulfur domain-containing protein 1 |
| 177 | P84103 | SRSF3 | 0.54 | 13.92 | 0.00270148 | 0.03305881 | Serine/arginine-rich splicing factor 3 |
| 178 | Q8TF42 | UBASH3B | −0.31 | 13.22 | 0.00284578 | 0.03451842 | Ubiquitin-associated and SH3 domain-containing protein B |
| 179 | P98194 | ATP2C1 | −0.35 | 13.11 | 0.00285263 | 0.03451842 | Calcium-transporting ATPase type 2C member 1 |
| 180 | O95870 | ABHD16A | −0.22 | 13.1 | 0.00291559 | 0.03496139 | Phosphatidylserine lipase ABHD16A |
| 181 | Q06187 | BTK | −0.32 | 13.21 | 0.00292152 | 0.03496139 | Tyrosine-protein kinase BTK |
| 182 | Q86V81 | ALYREF | 0.33 | 13.65 | 0.00301063 | 0.03582983 | THO complex subunit 4 |
| 183 | Q96HC4 | PDLIM5 | −0.24 | 13.11 | 0.00311511 | 0.03674076 | PDZ and LIM domain protein 5 |
| 184 | P50502 | ST13 | −0.39 | 14.49 | 0.00313602 | 0.03674076 | Hsc70-interacting protein |
| 185 | O75874 | IDH1 | −0.18 | 13.26 | 0.00313806 | 0.03674076 | Isocitrate dehydrogenase [NADP] cytoplasmic |
| 186 | Q9UIQ6 | LNPEP | −0.26 | 13.04 | 0.00316421 | 0.03684776 | Leucyl-cystinyl aminopeptidase |
| 187 | P05204 | HMGN2 | 0.53 | 13.65 | 0.0031931 | 0.03698535 | Non-histone chromosomal protein HMG-17 |
| 188 | Q9UBE0 | SAE1 | 1.77 | 13.38 | 0.00325404 | 0.03749071 | SUMO-activating enzyme subunit 1 |
| 189 | Q27J81 | INF2 | −0.25 | 13.29 | 0.00329449 | 0.03764605 | Inverted formin-2 |
| 190 | P17568 | NDUFB7 | 0.9 | 13.5 | 0.00330229 | 0.03764605 | NADH dehydrogenase [ubiquinone] 1 beta subcomplex subunit 7 |
| 191 | P42226 | STAT6 | 0.47 | 12.82 | 0.0033913 | 0.03818853 | Signal transducer and activator of transcription 6 |
| 192 | Q96A72 | MAGOHB | 0.51 | 13.65 | 0.00339134 | 0.03818853 | Protein mago nashi homolog 2 |
| 193 | Q969T9 | WBP2 | −0.44 | 15.05 | 0.00340276 | 0.03818853 | WW domain-binding protein 2 |
| 194 | P25098 | GRK2 | −0.24 | 13.1 | 0.00345488 | 0.03857356 | Beta-adrenergic receptor kinase 1 |
| 195 | Q9UHA4 | LAMTOR3 | 0.38 | 12.83 | 0.00352314 | 0.03898614 | Ragulator complex protein LAMTOR3 |
| 196 | O75558 | STX11 | −0.26 | 13.12 | 0.00352783 | 0.03898614 | Syntaxin-11 |
| 197 | Q9NS28 | RGS18 | 0.66 | 13.35 | 0.00357069 | 0.03925947 | Regulator of G-protein signaling 18 |
| 198 | P07737 | PFN1 | −0.38 | 16.53 | 0.0036122 | 0.03951523 | Profilin-1 |
| 199 | P13807 | GYS1 | 0.9 | 13.13 | 0.00363219 | 0.03953429 | Glycogen [starch] synthase, muscle |
| 200 | P28838 | LAP3 | −0.28 | 13.87 | 0.00382286 | 0.04140152 | Cytosol aminopeptidase |
| 201 | Q8NBS9 | TXNDC5 | −0.27 | 13.77 | 0.00390772 | 0.0421101 | Thioredoxin domain-containing protein 5 |
| 202 | P04114 | APOB | −0.37 | 13.83 | 0.00396257 | 0.04248971 | Apolipoprotein B-100 |
| 203 | Q92597 | NDRG1 | 0.69 | 13.96 | 0.00401989 | 0.04289198 | Protein NDRG1 |
| 204 | Q10472 | GALNT1 | 1.1 | 13.6 | 0.00406443 | 0.04315433 | Polypeptide N-acetylgalactosaminyltransferase 1 |
| 205 | P16930 | FAH | −0.36 | 13.13 | 0.00408432 | 0.04315433 | Fumarylacetoacetase |
| 206 | Q9Y2T2 | AP3M1 | −0.35 | 13.23 | 0.00410891 | 0.04320338 | AP-3 complex subunit mu-1 |
| 207 | Q01813 | PFKP | −0.2 | 13.41 | 0.00416037 | 0.04353312 | ATP-dependent 6-phosphofructokinase, platelet type |
| 208 | Q00577 | PURA | 0.69 | 13.2 | 0.00419225 | 0.04363857 | Transcriptional activator protein Pur-alpha |
| 209 | O15143 | ARPC1B | −0.22 | 14.67 | 0.00421074 | 0.04363857 | Actin-related protein 2/3 complex subunit 1B |
| 210 | Q7KZF4 | SND1 | −0.16 | 13.84 | 0.00434483 | 0.04458141 | Staphylococcal nuclease domain-containing protein 1 |
| 211 | Q7L576 | CYFIP1 | −0.23 | 13.53 | 0.00436386 | 0.04458141 | Cytoplasmic FMR1-interacting protein 1 |
| 212 | Q3ZCW2 | LGALSL | −0.29 | 13.07 | 0.00436939 | 0.04458141 | Galectin-related protein |
| 213 | Q8N8A2 | ANKRD44 | 0.71 | 13.04 | 0.00438404 | 0.04458141 | Serine/threonine-protein phosphatase 6 regulatory ankyrin repeat subunit B |
| 214 | Q5RKV6 | EXOSC6 | 0.88 | 13.39 | 0.00464216 | 0.04698563 | Exosome complex component MTR3 |
| 215 | P61952 | GNG11 | 1.69 | 14.01 | 0.00471723 | 0.04752336 | Guanine nucleotide-binding protein G(I)/G(S)/G(O) subunit gamma-11 |
| 216 | P16157 | ANK1 | −0.43 | 13.09 | 0.0048462 | 0.04859658 | Ankyrin-1 |
| 217 | Q9NZ01 | TECR | 0.94 | 13.35 | 0.00488912 | 0.04880109 | Very-long-chain enoyl-CoA reductase |
| 218 | Q14644 | RASA3 | −0.18 | 13.25 | 0.00493951 | 0.04886889 | Ras GTPase-activating protein 3 |
| 219 | Q13813 | SPTAN1 | −0.2 | 13.12 | 0.00495471 | 0.04886889 | Spectrin alpha chain, non-erythrocytic 1 |
| 220 | Q9Y262 | EIF3L | 0.25 | 13.39 | 0.0049636 | 0.04886889 | Eukaryotic translation initiation factor 3 subunit L |
| 221 | P62701 | RPS4X | 0.19 | 13.69 | 0.00499505 | 0.04895604 | 40S ribosomal protein S4, X isoform |
| 222 | Q8N4P3 | HDDC3 | 0.35 | 12.82 | 0.005064 | 0.04901974 | Guanosine-3′,5′-bis(diphosphate) 3′-pyrophosphohydrolase MESH1 |
| 223 | O75165 | DNAJC13 | −0.25 | 12.88 | 0.00506932 | 0.04901974 | DnaJ homolog subfamily C member 13 |
| 224 | Q9P2X0 | DPM3 | 0.8 | 13.05 | 0.00506945 | 0.04901974 | Dolichol-phosphate mannosyltransferase subunit 3 |
| 225 | Q13057 | COASY | −0.25 | 12.88 | 0.00516473 | 0.04971913 | Bifunctional coenzyme A synthase |
| 226 | Q9Y3L3 | SH3BP1 | −0.32 | 13.55 | 0.00523176 | 0.04993232 | SH3 domain-binding protein 1 |
| 227 | O75083 | WDR1 | −0.17 | 14.37 | 0.00523298 | 0.04993232 | WD repeat-containing protein 1 |
| Sr # | Protein Accessions | Genes | logFC | AveExpr | p-Value | adj.P.Val | Protein Descriptions |
|---|---|---|---|---|---|---|---|
| 1 | P42025 | ACTR1B | 0.79 | 12.99 | 9.15 × 10⁻⁹ | 1.98 × 10⁻⁵ | Beta-centractin |
| 2 | P02656 | APOC3 | 2.03 | 14.74 | 1.86 × 10⁻⁷ | 0.000202 | Apolipoprotein C-III |
| 3 | P12829 | MYL4 | 1.63 | 13.41 | 3.63 × 10⁻⁷ | 0.000262 | Myosin light chain 4 |
| 4 | Q08380 | LGALS3BP | 1.16 | 13.2 | 5.15 × 10⁻⁷ | 0.000279 | Galectin-3-binding protein |
| 5 | Q8N386 | LRRC25 | 1.19 | 13.33 | 6.85 × 10⁻⁷ | 0.000297 | Leucine-rich repeat-containing protein 25 |
| 6 | O95168 | NDUFB4 | 2.2 | 14.47 | 9.16 × 10⁻⁷ | 0.000331 | NADH dehydrogenase [ubiquinone] 1 beta subcomplex subunit 4 |
| 7 | P08697 | SERPINF2 | 2.05 | 15.88 | 1.69 × 10⁻⁶ | 0.000408 | Alpha-2-antiplasmin |
| 8 | Q02108 | GUCY1A1 | 0.59 | 12.9 | 1.82 × 10⁻⁶ | 0.000408 | Guanylate cyclase soluble subunit alpha-1 |
| 9 | Q15370 | ELOB | 0.99 | 13.11 | 1.85 × 10⁻⁶ | 0.000408 | Elongin-B |
| 10 | O00483 | NDUFA4 | 2.45 | 14.82 | 1.88 × 10⁻⁶ | 0.000408 | Cytochrome c oxidase subunit NDUFA4 |
| 11 | Q92597 | NDRG1 | 1.15 | 13.96 | 3.48 × 10⁻⁶ | 0.000685 | Protein NDRG1 |
| 12 | P51809 | VAMP7 | 0.56 | 12.94 | 4.36 × 10⁻⁶ | 0.000772 | Vesicle-associated membrane protein 7 |
| 13 | P04424 | ASL | 0.6 | 13.02 | 4.63 × 10⁻⁶ | 0.000772 | Argininosuccinate lyase |
| 14 | P04217 | A1BG | 2.36 | 16.03 | 5.69 × 10⁻⁶ | 0.000814 | Alpha-1B-glycoprotein |
| 15 | P30048 | PRDX3 | 0.82 | 14.71 | 5.84 × 10⁻⁶ | 0.000814 | Thioredoxin-dependent peroxide reductase, mitochondrial |
| 16 | P04350 | TUBB4A | 0.68 | 12.94 | 6.23 × 10⁻⁶ | 0.000814 | Tubulin beta-4A chain |
| 17 | P51570 | GALK1 | 0.97 | 13.2 | 6.39 × 10⁻⁶ | 0.000814 | Galactokinase |
| 18 | A6NHR9 | SMCHD1 | −0.32 | 13.09 | 7.35 × 10⁻⁶ | 0.000885 | Structural maintenance of chromosomes flexible hinge domain-containing protein 1 |
| 19 | A8MWD9; P62308 | SNRPGP15; SNRPG | 0.96 | 14.17 | 9.53 × 10⁻⁶ | 0.001087 | Putative small nuclear ribonucleoprotein G-like protein 15; Small nuclear ribonucleoprotein G |
| 20 | P18669 | PGAM1 | 0.79 | 14.77 | 1.05 × 10⁻⁵ | 0.001132 | Phosphoglycerate mutase 1 |
| 21 | P05543 | SERPINA7 | 1.35 | 13.38 | 1.42 × 10⁻⁵ | 0.001465 | Thyroxine-binding globulin |
| 22 | P49065 | ALB | 2.01 | 15.74 | 1.79 × 10⁻⁵ | 0.001758 | Serum albumin |
| 23 | Q02750 | MAP2K1 | 2.64 | 15.39 | 1.89 × 10⁻⁵ | 0.001758 | Dual specificity mitogen-activated protein kinase kinase 1 |
| 24 | Q00577 | PURA | 1.05 | 13.2 | 1.95 × 10⁻⁵ | 0.001758 | Transcriptional activator protein Pur-alpha |
| 25 | Q9H8H3 | METTL7A | 1.36 | 14.82 | 2.27 × 10⁻⁵ | 0.001967 | Methyltransferase-like protein 7A |
| 26 | Q8IZ07 | ANKRD13A | 0.92 | 12.9 | 2.58 × 10⁻⁵ | 0.002148 | Ankyrin repeat domain-containing protein 13A |
| 27 | Q92769 | HDAC2 | 0.5 | 12.95 | 2.74 × 10⁻⁵ | 0.002199 | Histone deacetylase 2 |
| 28 | Q92530 | PSMF1 | 0.57 | 12.9 | 3.55 × 10⁻⁵ | 0.002683 | Proteasome inhibitor PI31 subunit |
| 29 | Q86X76 | NIT1 | 1.32 | 13.35 | 3.59 × 10⁻⁵ | 0.002683 | Deaminated glutathione amidase |
| 30 | P55795 | HNRNPH2 | 0.72 | 14.1 | 3.79 × 10⁻⁵ | 0.002735 | Heterogeneous nuclear ribonucleoprotein H2 |
| 31 | C4AMC7; Q6VEQ5 | WASH3P; WASH2P | 0.88 | 13.21 | 3.94 × 10⁻⁵ | 0.002751 | Putative WAS protein family homolog 3; WAS protein family homolog 2 |
| 32 | O95182 | NDUFA7 | 1.37 | 13.78 | 4.53 × 10⁻⁵ | 0.003066 | NADH dehydrogenase [ubiquinone] 1 alpha subcomplex subunit 7 |
| 33 | P10412 | HIST1H1E | −0.54 | 17.51 | 4.71 × 10⁻⁵ | 0.003089 | Histone H1.4 |
| 34 | P05387 | RPLP2 | 0.81 | 14.33 | 4.88 × 10⁻⁵ | 0.003108 | 60S acidic ribosomal protein P2 |
| 35 | Q06587 | RING1 | 0.76 | 12.94 | 6.84 × 10⁻⁵ | 0.004089 | E3 ubiquitin-protein ligase RING1 |
| 36 | Q8NFV4 | ABHD11 | 0.46 | 12.85 | 6.90 × 10⁻⁵ | 0.004089 | Protein ABHD11 |
| 37 | P16401 | HIST1H1B | −0.69 | 16.82 | 6.98 × 10⁻⁵ | 0.004089 | Histone H1.5 |
| 38 | P17568 | NDUFB7 | 1.23 | 13.5 | 7.45 × 10⁻⁵ | 0.004168 | NADH dehydrogenase [ubiquinone] 1 beta subcomplex subunit 7 |
| 39 | Q8NHV1 | GIMAP7 | 0.78 | 13 | 7.50 × 10⁻⁵ | 0.004168 | GTPase IMAP family member 7 |
| 40 | P15153 | RAC2 | 0.86 | 14.68 | 8.65 × 10⁻⁵ | 0.004687 | Ras-related C3 botulinum toxin substrate 2 |
| 41 | P31483 | TIA1 | 0.63 | 12.94 | 0.000107 | 0.005643 | Nucleolysin TIA-1 isoform p40 |
| 42 | P27986 | PIK3R1 | 0.33 | 12.91 | 0.000114 | 0.005884 | Phosphatidylinositol 3-kinase regulatory subunit alpha |
| 43 | Q13363 | CTBP1 | 0.43 | 13.34 | 0.000138 | 0.006932 | C-terminal-binding protein 1 |
| 44 | Q6DD87 | ZNF787 | 0.52 | 12.84 | 0.000149 | 0.007156 | Zinc finger protein 787 |
| 45 | O95379 | TNFAIP8 | 0.6 | 13.02 | 0.000156 | 0.007156 | Tumor necrosis factor alpha-induced protein 8 |
| 46 | P56279 | TCL1A | 1.27 | 13.06 | 0.000158 | 0.007156 | T-cell leukemia/lymphoma protein 1A |
| 47 | Q9H9G7; Q9HCK5; Q9UL18 | AGO3; AGO4; AGO1 | 1.58 | 13.52 | 0.000159 | 0.007156 | Protein argonaute-3; Protein argonaute-4; Protein argonaute-1 |
| 48 | O00505 | KPNA3 | 1.02 | 13.4 | 0.000159 | 0.007156 | Importin subunit alpha-4 |
| 49 | P30043 | BLVRB | 0.67 | 13.49 | 0.000168 | 0.00736 | Flavin reductase (NADPH) |
| 50 | Q9P2R7 | SUCLA2 | −0.47 | 14.11 | 0.00017 | 0.00736 | Succinate-CoA ligase [ADP-forming] subunit beta, mitochondrial |
| 51 | Q9NUQ9 | FAM49B | 0.36 | 13.56 | 0.000175 | 0.00736 | Protein FAM49B |
| 52 | Q7Z4Q2 | HEATR3 | 0.41 | 12.81 | 0.000179 | 0.00736 | HEAT repeat-containing protein 3 |
| 53 | Q9Y6W5 | WASF2 | 0.66 | 14.35 | 0.00018 | 0.00736 | Wiskott-Aldrich syndrome protein family member 2 |
| 54 | Q93050 | ATP6V0A1 | 0.55 | 12.82 | 0.000184 | 0.007376 | V-type proton ATPase 116 kDa subunit a isoform 1 |
| 55 | P43304 | GPD2 | −0.29 | 13.5 | 0.000187 | 0.007376 | Glycerol-3-phosphate dehydrogenase, mitochondrial |
| 56 | Q16630 | CPSF6 | 0.4 | 13.58 | 0.000201 | 0.007785 | Cleavage and polyadenylation specificity factor subunit 6 |
| 57 | Q96NY7; Q9NZA1 | CLIC6; CLIC5 | 1.92 | 13.95 | 0.000213 | 0.008057 | Chloride intracellular channel protein 6; Chloride intracellular channel protein 5 |
| 58 | P46379 | BAG6 | 0.94 | 13.18 | 0.000218 | 0.008057 | Large proline-rich protein BAG6 |
| 59 | B2RUZ4 | SMIM1 | −0.54 | 13.36 | 0.000219 | 0.008057 | Small integral membrane protein 1 |
| 60 | Q06323 | PSME1 | 0.5 | 14.2 | 0.000248 | 0.008953 | Proteasome activator complex subunit 1 |
| 61 | P02760 | AMBP | 1.11 | 16.26 | 0.000257 | 0.009141 | Protein AMBP |
| 62 | Q15907 | RAB11B | −0.39 | 14.99 | 0.000266 | 0.009285 | Ras-related protein Rab-11B |
| 63 | Q00059 | TFAM | −0.35 | 13.4 | 0.000298 | 0.010133 | Transcription factor A, mitochondrial |
| 64 | Q15287 | RNPS1 | 1.83 | 14.51 | 0.000299 | 0.010133 | RNA-binding protein with serine-rich domain 1 |
| 65 | Q13813 | SPTAN1 | −0.26 | 13.12 | 0.000325 | 0.01077 | Spectrin alpha chain, non-erythrocytic 1 |
| 66 | P14678; P63162 | SNRPB; SNRPN | 0.79 | 14.22 | 0.000328 | 0.01077 | Small nuclear ribonucleoprotein-associated proteins B and B’; Small nuclear ribonucleoprotein-associated protein N |
| 67 | P02452 | COL1A1 | 1.29 | 14.38 | 0.000354 | 0.011289 | Collagen alpha-1(I) chain |
| 68 | P05452 | CLEC3B | 1.23 | 14.08 | 0.000354 | 0.011289 | Tetranectin |
| 69 | Q8NG11 | TSPAN14 | −0.44 | 13.54 | 0.000376 | 0.011791 | Tetraspanin-14 |
| 70 | P26641 | EEF1G | −0.38 | 14.6 | 0.000399 | 0.012224 | Elongation factor 1-gamma |
| 71 | O75746 | SLC25A12 | −0.3 | 13.14 | 0.000401 | 0.012224 | Calcium-binding mitochondrial carrier protein Aralar1 |
| 72 | Q9Y333 | LSM2 | −0.37 | 12.85 | 0.000409 | 0.012267 | U6 snRNA-associated Sm-like protein LSm2 |
| 73 | P42285 | MTREX | 0.5 | 12.85 | 0.000413 | 0.012267 | Exosome RNA helicase MTR4 |
| 74 | P62318 | SNRPD3 | 1.02 | 15.6 | 0.00047 | 0.013767 | Small nuclear ribonucleoprotein Sm D3 |
| 75 | Q9BUJ2 | HNRNPUL1 | 0.42 | 13.81 | 0.000492 | 0.014049 | Heterogeneous nuclear ribonucleoprotein U-like protein 1 |
| 76 | Q8WXF7 | ATL1 | 0.4 | 12.87 | 0.000499 | 0.014049 | Atlastin-1 |
| 77 | P20933 | AGA | 1.16 | 14.15 | 0.000499 | 0.014049 | N(4)-(beta-N-acetylglucosaminyl)-L-asparaginase |
| 78 | P28838 | LAP3 | −0.34 | 13.87 | 0.000512 | 0.014231 | Cytosol aminopeptidase |
| 79 | P32942 | ICAM3 | −0.57 | 14.85 | 0.00052 | 0.014251 | Intercellular adhesion molecule 3 |
| 80 | Q96BM9 | ARL8A | −0.42 | 14.46 | 0.00053 | 0.014361 | ADP-ribosylation factor-like protein 8A |
| 81 | Q9H098 | FAM107B | 1.88 | 13.65 | 0.00058 | 0.015505 | Protein FAM107B |
| 82 | Q8N699 | MYCT1 | 1.13 | 13.32 | 0.000589 | 0.015554 | Myc target protein 1 |
| 83 | O75116 | ROCK2 | −0.24 | 13.28 | 0.0006 | 0.01557 | Rho-associated protein kinase 2 |
| 84 | Q9UIA9 | XPO7 | 2.07 | 14.44 | 0.000607 | 0.01557 | Exportin-7 |
| 85 | P34910 | EVI2B | 0.94 | 13.6 | 0.000611 | 0.01557 | Protein EVI2B |
| 86 | O14980 | XPO1 | −0.21 | 12.95 | 0.000627 | 0.015784 | Exportin-1 |
| 87 | P23743 | DGKA | −0.31 | 13.18 | 0.000638 | 0.015889 | Diacylglycerol kinase alpha |
| 88 | P14543 | NID1 | −0.35 | 13.68 | 0.000682 | 0.016787 | Nidogen-1 |
| 89 | Q9UIQ6 | LNPEP | −0.3 | 13.04 | 0.00072 | 0.017408 | Leucyl-cystinyl aminopeptidase |
| 90 | Q32P28 | P3H1 | 0.5 | 12.87 | 0.00073 | 0.017408 | Prolyl 3-hydroxylase 1 |
| 91 | P06730 | EIF4E | 0.77 | 13.27 | 0.000738 | 0.017408 | Eukaryotic translation initiation factor 4E |
| 92 | Q15008 | PSMD6 | −0.22 | 12.96 | 0.000747 | 0.017408 | 26S proteasome non-ATPase regulatory subunit 6 |
| 93 | P10599 | TXN | 0.45 | 13.66 | 0.000747 | 0.017408 | Thioredoxin |
| 94 | O95299 | NDUFA10 | −0.23 | 12.9 | 0.000778 | 0.017795 | NADH dehydrogenase [ubiquinone] 1 alpha subcomplex subunit 10, mitochondrial |
| 95 | Q52LJ0 | FAM98B | 0.7 | 13.59 | 0.00078 | 0.017795 | Protein FAM98B |
| 96 | O95819 | MAP4K4 | 0.55 | 14.63 | 0.000791 | 0.01784 | Mitogen-activated protein kinase kinase kinase kinase 4 |
| 97 | Q8IV53 | DENND1C | 0.66 | 13.19 | 0.000835 | 0.018443 | DENN domain-containing protein 1C |
| 98 | P51884 | LUM | 2.03 | 15.33 | 0.00085 | 0.018443 | Lumican |
| 99 | P09917 | ALOX5 | −0.19 | 12.9 | 0.000851 | 0.018443 | Arachidonate 5-lipoxygenase |
| 100 | P55957 | BID | 0.98 | 13.87 | 0.000851 | 0.018443 | BH3-interacting domain death agonist |
| 101 | Q9BPX5 | ARPC5L | 0.7 | 13.69 | 0.000884 | 0.018961 | Actin-related protein 2/3 complex subunit 5-like protein |
| 102 | Q9NS28 | RGS18 | 0.75 | 13.35 | 0.000907 | 0.019263 | Regulator of G-protein signaling 18 |
| 103 | O00193 | SMAP | 0.38 | 12.87 | 0.000947 | 0.019304 | Small acidic protein |
| 104 | O95544 | NADK | 0.84 | 13.34 | 0.000948 | 0.019304 | NAD kinase |
| 105 | P11908 | PRPS2 | 1.54 | 13.64 | 0.000948 | 0.019304 | Ribose-phosphate pyrophosphokinase 2 |
| 106 | Q13057 | COASY | −0.3 | 12.88 | 0.000955 | 0.019304 | Bifunctional coenzyme A synthase |
| 107 | Q9BY77 | POLDIP3 | 0.64 | 12.95 | 0.000957 | 0.019304 | Polymerase delta-interacting protein 3 |
| 108 | Q86YP4 | GATAD2A | 2.03 | 14.08 | 0.000963 | 0.019304 | Transcriptional repressor p66-alpha |
| 109 | P17900 | GM2A | 0.95 | 13.05 | 0.00098 | 0.019473 | Ganglioside GM2 activator |
| 110 | Q8NI27 | THOC2 | −0.42 | 12.97 | 0.00102 | 0.019964 | THO complex subunit 2 |
| 111 | P60660 | MYL6 | −0.35 | 15.44 | 0.001039 | 0.019964 | Myosin light polypeptide 6 |
| 112 | Q13045 | FLII | −0.2 | 13.48 | 0.001044 | 0.019964 | Protein flightless-1 homolog |
| 113 | P14174 | MIF | 1.84 | 15.48 | 0.001049 | 0.019964 | Macrophage migration inhibitory factor |
| 114 | Q86Y39 | NDUFA11 | 0.48 | 13.48 | 0.001051 | 0.019964 | NADH dehydrogenase [ubiquinone] 1 alpha subcomplex subunit 11 |
| 115 | P12109 | COL6A1 | 1.66 | 14.75 | 0.001074 | 0.020052 | Collagen alpha-1(VI) chain |
| 116 | Q08722 | CD47 | −1.21 | 15.13 | 0.001077 | 0.020052 | Leukocyte surface antigen CD47 |
| 117 | Q9NVZ3 | NECAP2 | 0.6 | 13.39 | 0.001083 | 0.020052 | Adaptin ear-binding coat-associated protein 2 |
| 118 | Q9BRA2 | TXNDC17 | 0.65 | 13.95 | 0.001121 | 0.020576 | Thioredoxin domain-containing protein 17 |
| 119 | Q16401 | PSMD5 | −0.55 | 12.83 | 0.001208 | 0.021994 | 26S proteasome non-ATPase regulatory subunit 5 |
| 120 | P14625 | HSP90B1 | −0.22 | 13.99 | 0.001298 | 0.023421 | Endoplasmin |
| 121 | Q8NCG7 | DAGLB | 0.48 | 12.87 | 0.001353 | 0.024214 | Sn1-specific diacylglycerol lipase beta |
| 122 | Q15796 | SMAD2 | 0.84 | 13.29 | 0.00138 | 0.024501 | Mothers against decapentaplegic homolog 2 |
| 123 | P01911 | HLA-DRB1 | 0.66 | 14.51 | 0.001503 | 0.02647 | HLA class II histocompatibility antigen, DRB1-15 beta chain |
| 124 | P49773 | HINT1 | 0.34 | 13.97 | 0.001603 | 0.027994 | Histidine triad nucleotide-binding protein 1 |
| 125 | P84243 | H3-3A | 0.71 | 12.9 | 0.001653 | 0.028452 | Histone H3.3 |
| 126 | Q8IYM9 | TRIM22 | −0.31 | 12.82 | 0.001655 | 0.028452 | E3 ubiquitin-protein ligase TRIM22 |
| 127 | Q15056 | EIF4H | 0.6 | 13.81 | 0.001734 | 0.029567 | Eukaryotic translation initiation factor 4H |
| 128 | P04259 | KRT6B | 1.79 | 13.9 | 0.00183 | 0.030966 | Keratin, type II cytoskeletal 6B |
| 129 | Q13576 | IQGAP2 | −0.22 | 13.26 | 0.001865 | 0.031298 | Ras GTPase-activating-like protein IQGAP2 |
| 130 | Q93009 | USP7 | −0.27 | 13.32 | 0.001892 | 0.031298 | Ubiquitin carboxyl-terminal hydrolase 7 |
| 131 | P09543 | CNP | −0.34 | 12.78 | 0.001893 | 0.031298 | 2′,3′-cyclic-nucleotide 3′-phosphodiesterase |
| 132 | P54709 | ATP1B3 | 0.36 | 13.19 | 0.001927 | 0.031614 | Sodium/potassium-transporting ATPase subunit beta-3 |
| 133 | Q8N4P3 | HDDC3 | 0.38 | 12.82 | 0.001961 | 0.031932 | Guanosine-3′,5′-bis(diphosphate) 3′-pyrophosphohydrolase MESH1 |
| 134 | P68402 | PAFAH1B2 | 0.41 | 12.91 | 0.002019 | 0.0324 | Platelet-activating factor acetylhydrolase IB subunit beta |
| 135 | P22694 | PRKACB | 0.62 | 13.1 | 0.002019 | 0.0324 | cAMP-dependent protein kinase catalytic subunit beta |
| 136 | P39687 | ANP32A | 0.36 | 14.59 | 0.002071 | 0.032871 | Acidic leucine-rich nuclear phosphoprotein 32 family member A |
| 137 | Q9H3G5 | CPVL | 0.39 | 13.61 | 0.002079 | 0.032871 | Probable serine carboxypeptidase CPVL |
| 138 | P62304 | SNRPE | 0.43 | 12.95 | 0.002122 | 0.033305 | Small nuclear ribonucleoprotein E |
| 139 | P02749 | APOH | 0.78 | 14.82 | 0.002154 | 0.033305 | Beta-2-glycoprotein 1 |
| 140 | Q8N5M9 | JAGN1 | 0.44 | 13.09 | 0.002171 | 0.033305 | Protein jagunal homolog 1 |
| 141 | Q6IAA8 | LAMTOR1 | −0.3 | 12.72 | 0.00218 | 0.033305 | Ragulator complex protein LAMTOR1 |
| 142 | Q9Y3B7 | MRPL11 | 0.74 | 13.36 | 0.002183 | 0.033305 | 39S ribosomal protein L11, mitochondrial |
| 143 | Q96JB5 | CDK5RAP3 | 1.37 | 13.69 | 0.002288 | 0.034652 | CDK5 regulatory subunit-associated protein 3 |
| 144 | P18583 | SON | 1.1 | 13.47 | 0.00231 | 0.034748 | Protein SON |
| 145 | Q9Y2T2 | AP3M1 | −0.36 | 13.23 | 0.002378 | 0.035172 | AP-3 complex subunit mu-1 |
| 146 | P49327 | FASN | −0.22 | 13.12 | 0.00238 | 0.035172 | Fatty acid synthase |
| 147 | O14735 | CDIPT | 1.07 | 13.53 | 0.002395 | 0.035172 | CDP-diacylglycerol-inositol 3-phosphatidyltransferase |
| 148 | P50851 | LRBA | −0.23 | 13.29 | 0.002403 | 0.035172 | Lipopolysaccharide-responsive and beige-like anchor protein |
| 149 | Q86VM9 | ZC3H18 | −0.36 | 12.91 | 0.002455 | 0.035476 | Zinc finger CCCH domain-containing protein 18 |
| 150 | Q9NZK5 | ADA2 | −0.19 | 13.15 | 0.002466 | 0.035476 | Adenosine deaminase 2 |
| 151 | P01042 | KNG1 | 0.74 | 13.86 | 0.002473 | 0.035476 | Kininogen-1 |
| 152 | P46926 | GNPDA1 | −0.31 | 12.92 | 0.002496 | 0.035565 | Glucosamine-6-phosphate isomerase 1 |
| 153 | Q9BUQ8 | DDX23 | −0.39 | 12.96 | 0.00253 | 0.03569 | Probable ATP-dependent RNA helicase DDX23 |
| 154 | Q92506 | HSD17B8 | −0.56 | 13.61 | 0.002538 | 0.03569 | Estradiol 17-beta-dehydrogenase 8 |
| 155 | Q9P035 | HACD3 | −0.27 | 13.02 | 0.002585 | 0.036072 | Very-long-chain (3R)-3-hydroxyacyl-CoA dehydratase 3 |
| 156 | O43670 | ZNF207 | 0.71 | 13.66 | 0.002598 | 0.036072 | BUB3-interacting and GLEBS motif-containing protein ZNF207 |
| 157 | P16109 | SELP | −0.71 | 14.99 | 0.002692 | 0.037136 | P-selectin |
| 158 | P07996 | THBS1 | −0.44 | 15.63 | 0.002759 | 0.037818 | Thrombospondin-1 |
| 159 | P51148 | RAB5C | 0.61 | 13.94 | 0.002839 | 0.038672 | Ras-related protein Rab-5C |
| 160 | P30046 | DDT | 0.32 | 13.57 | 0.002967 | 0.040172 | D-dopachrome decarboxylase |
| 161 | Q9BTT0 | ANP32E | 0.44 | 13.67 | 0.002997 | 0.040324 | Acidic leucine-rich nuclear phosphoprotein 32 family member E |
| 162 | P01909 | HLA-DQA1 | 0.3 | 12.9 | 0.003031 | 0.040522 | HLA class II histocompatibility antigen, DQ alpha 1 chain |
| 163 | Q9H4I9 | SMDT1 | 0.68 | 13.48 | 0.003092 | 0.041051 | Essential MCU regulator, mitochondrial |
| 164 | Q9Y5Z4 | HEBP2 | 0.21 | 13.05 | 0.003108 | 0.041051 | Heme-binding protein 2 |
| 165 | P42126 | ECI1 | 0.6 | 13.03 | 0.003131 | 0.041095 | Enoyl-CoA delta isomerase 1, mitochondrial |
| 166 | Q9C0C9 | UBE2O | −0.24 | 13.08 | 0.003192 | 0.041121 | (E3-independent) E2 ubiquitin-conjugating enzyme |
| 167 | P62857 | RPS28 | 0.67 | 15.39 | 0.003194 | 0.041121 | 40S ribosomal protein S28 |
| 168 | Q02338 | BDH1 | 1.52 | 14.41 | 0.003195 | 0.041121 | D-beta-hydroxybutyrate dehydrogenase, mitochondrial |
| 169 | Q86WV1 | SKAP1 | 1.14 | 13.51 | 0.00321 | 0.041121 | Src kinase-associated phosphoprotein 1 |
| 170 | P28072 | PSMB6 | 0.34 | 13.13 | 0.003227 | 0.041121 | Proteasome subunit beta type-6 |
| 171 | O75947 | ATP5PD | −0.31 | 14.52 | 0.003294 | 0.04173 | ATP synthase subunit d, mitochondrial |
| 172 | P01344 | IGF2 | 1.26 | 14.88 | 0.003353 | 0.042227 | Insulin-like growth factor II |
| 173 | Q96CX2 | KCTD12 | 0.61 | 14.27 | 0.003415 | 0.042752 | BTB/POZ domain-containing protein KCTD12 |
| 174 | P16150 | SPN | −0.66 | 15.38 | 0.003444 | 0.042806 | Leukosialin |
| 175 | P07477 | PRSS1 | 2.06 | 17.29 | 0.003458 | 0.042806 | Trypsin-1 |
| 176 | Q8IV08 | PLD3 | 0.43 | 12.92 | 0.00351 | 0.043046 | Phospholipase D3 |
| 177 | P62277 | RPS13 | 0.34 | 14.07 | 0.003518 | 0.043046 | 40S ribosomal protein S13 |
| 178 | P62195 | PSMC5 | −0.28 | 12.86 | 0.003549 | 0.043146 | 26S proteasome regulatory subunit 8 |
| 179 | O95866 | MPIG6B | 1.07 | 16.4 | 0.003566 | 0.043146 | Megakaryocyte and platelet inhibitory receptor G6b |
| 180 | Q13761 | RUNX3 | 0.41 | 12.98 | 0.003604 | 0.043363 | Runt-related transcription factor 3 |
| 181 | P08708 | RPS17 | 0.3 | 13.25 | 0.003664 | 0.043527 | 40S ribosomal protein S17 |
| 182 | P62330 | ARF6 | 0.87 | 13.46 | 0.003688 | 0.043527 | ADP-ribosylation factor 6 |
| 183 | P25789 | PSMA4 | 0.42 | 13.69 | 0.003701 | 0.043527 | Proteasome subunit alpha type-4 |
| 184 | P12236 | SLC25A6 | −0.29 | 15.3 | 0.003703 | 0.043527 | ADP/ATP translocase 3 |
| 185 | Q9NQG5 | RPRD1B | −0.37 | 13.01 | 0.003718 | 0.043527 | Regulation of nuclear pre-mRNA domain-containing protein 1B |
| 186 | P20340 | RAB6A | −0.35 | 14.33 | 0.003816 | 0.044395 | Ras-related protein Rab-6A |
| 187 | P17676 | CEBPB | 1.26 | 13.57 | 0.003833 | 0.044395 | CCAAT/enhancer-binding protein beta |
| 188 | O60831 | PRAF2 | 0.68 | 13.17 | 0.003879 | 0.044515 | PRA1 family protein 2 |
| 189 | P62140 | PPP1CB | 0.91 | 15.63 | 0.003884 | 0.044515 | Serine/threonine-protein phosphatase PP1-beta catalytic subunit |
| 190 | Q86UT6 | NLRX1 | −0.33 | 12.84 | 0.003926 | 0.044761 | NLR family member X1 |
| 191 | Q9Y3B2 | EXOSC1 | 0.41 | 12.98 | 0.003977 | 0.045099 | Exosome complex component CSL4 |
| 192 | O76074 | PDE5A | −0.27 | 13.36 | 0.004052 | 0.045708 | cGMP-specific 3′,5′-cyclic phosphodiesterase |
| 193 | Q9UII2 | ATP5IF1 | −0.39 | 13.87 | 0.00417 | 0.046799 | ATPase inhibitor, mitochondrial |
| 194 | Q99961 | SH3GL1 | −0.29 | 13.41 | 0.004231 | 0.047238 | Endophilin-A2 |
| 195 | O00487 | PSMD14 | 0.88 | 13.34 | 0.004419 | 0.049082 | 26S proteasome non-ATPase regulatory subunit 14 |
| 196 | Q96K37 | SLC35E1 | −0.35 | 12.86 | 0.004464 | 0.049327 | Solute carrier family 35 member E1 |
| Sr # | Protein Accessions | Genes | logFC.V1 | AveExpr.V1 | logFC.V2 | AveExpr.V2 | Protein Descriptions |
|---|---|---|---|---|---|---|---|
| 1 | Q9Y3B2 | EXOSC1 | 0.848601 | 12.98093 | 0.406504 | 12.9809302 | Exosome complex component CSL4 |
| 2 | P55957 | BID | 1.594553 | 13.86545 | 0.98241 | 13.8654541 | BH3-interacting domain death agonist |
| 3 | Q15370 | ELOB | 1.001451 | 13.10707 | 0.993034 | 13.1070734 | Elongin-B |
| 4 | P17676 | CEBPB | 2.159903 | 13.57377 | 1.255927 | 13.5737735 | CCAAT/enhancer-binding protein beta |
| 5 | Q8NHV1 | GIMAP7 | 0.904981 | 12.99537 | 0.77902 | 12.9953678 | GTPase IMAP family member 7 |
| 6 | Q92769 | HDAC2 | 0.523821 | 12.94668 | 0.498368 | 12.9466806 | Histone deacetylase 2 |
| 7 | Q9BY77 | POLDIP3 | 0.874112 | 12.94939 | 0.640527 | 12.949388 | Polymerase delta-interacting protein 3 |
| 8 | P01909 | HLA-DQA1 | 0.455705 | 12.89788 | 0.298861 | 12.8978826 | HLA class II histocompatibility antigen, DQ alpha 1 chain |
| 9 | P02656 | APOC3 | 1.57864 | 14.73972 | 2.034025 | 14.7397213 | Apolipoprotein C-III |
| 10 | P30048 | PRDX3 | 0.751728 | 14.71094 | 0.821021 | 14.7109441 | Thioredoxin-dependent peroxide reductase, mitochondrial |
| 11 | P62857 | RPS28 | 0.988089 | 15.38677 | 0.670676 | 15.3867658 | 40S ribosomal protein S28 |
| 12 | Q02750 | MAP2K1 | 2.535592 | 15.39421 | 2.643298 | 15.394209 | Dual specificity mitogen-activated protein kinase kinase 1 |
| 13 | Q8IV08 | PLD3 | 0.62771 | 12.92078 | 0.43252 | 12.9207843 | Phospholipase D3 |
| 14 | P51148 | RAB5C | 0.857086 | 13.93679 | 0.60824 | 13.9367931 | Ras-related protein Rab-5C |
| 15 | O14980 | XPO1 | −0.255908 | 12.95095 | −0.211783 | 12.9509484 | Exportin-1 |
| 16 | Q02108 | GUCY1A1 | 0.485112 | 12.90377 | 0.58852 | 12.9037683 | Guanylate cyclase soluble subunit alpha-1 |
| 17 | Q7Z4Q2 | HEATR3 | 0.44294 | 12.80701 | 0.408966 | 12.8070147 | HEAT repeat-containing protein 3 |
| 18 | P42025 | ACTR1B | 0.515136 | 12.99252 | 0.79344 | 12.9925248 | Beta-centractin |
| 19 | Q86WV1 | SKAP1 | 1.573969 | 13.50938 | 1.136388 | 13.5093818 | Src kinase-associated phosphoprotein 1 |
| 20 | Q8N699 | MYCT1 | 1.3055 | 13.31634 | 1.126395 | 13.3163412 | Myc target protein 1 |
| 21 | O00483 | NDUFA4 | 1.946313 | 14.82427 | 2.44735 | 14.8242724 | Cytochrome c oxidase subunit NDUFA4 |
| 22 | Q86YP4 | GATAD2A | 2.446766 | 14.07985 | 2.030024 | 14.0798512 | Transcriptional repressor p66-alpha |
| 23 | O75116 | ROCK2 | −0.269602 | 13.27577 | −0.235161 | 13.275773 | Rho-associated protein kinase 2 |
| 24 | P04350 | TUBB4A | 0.556699 | 12.93662 | 0.676363 | 12.936615 | Tubulin beta-4A chain |
| 25 | Q13363 | CTBP1 | 0.418212 | 13.33699 | 0.43115 | 13.3369899 | C-terminal-binding protein 1 |
| 26 | P42285 | MTREX | 0.523091 | 12.85032 | 0.497444 | 12.8503171 | Exosome RNA helicase MTR4 |
| 27 | O00193 | SMAP | 0.432867 | 12.86767 | 0.384342 | 12.8676676 | Small acidic protein |
| 28 | P46379 | BAG6 | 0.910913 | 13.18182 | 0.940548 | 13.1818226 | Large proline-rich protein BAG6 |
| 29 | O00487 | PSMD14 | 1.117681 | 13.3401 | 0.879198 | 13.3401005 | 26S proteasome non-ATPase regulatory subunit 14 |
| 30 | P04424 | ASL | 0.447448 | 13.02412 | 0.598387 | 13.0241187 | Argininosuccinate lyase |
| 31 | Q96K37 | SLC35E1 | −0.442733 | 12.86068 | −0.348354 | 12.860683 | Solute carrier family 35 member E1 |
| 32 | Q9UIA9 | XPO7 | 2.14244 | 14.44199 | 2.074225 | 14.4419886 | Exportin-7 |
| 33 | O95819 | MAP4K4 | 0.57493 | 14.63426 | 0.551376 | 14.6342571 | Mitogen-activated protein kinase kinase kinase kinase 4 |
| 34 | Q8NFV4 | ABHD11 | 0.394209 | 12.85493 | 0.461129 | 12.8549305 | Protein ABHD11 |
| 35 | Q8NCG7 | DAGLB | 0.515791 | 12.86969 | 0.478891 | 12.8696866 | Sn1-specific diacylglycerol lipase beta |
| 36 | Q9Y3B7 | MRPL11 | 0.833267 | 13.35751 | 0.744418 | 13.3575081 | 39S ribosomal protein L11, mitochondrial |
| 37 | P12829 | MYL4 | 1.011231 | 13.40768 | 1.625336 | 13.40768 | Myosin light chain 4 |
| 38 | Q99961 | SH3GL1 | −0.341088 | 13.4084 | −0.286379 | 13.4084045 | Endophilin-A2 |
| 39 | O60831 | PRAF2 | 0.793311 | 13.16934 | 0.67582 | 13.1693404 | PRA1 family protein 2 |
| 40 | O95182 | NDUFA7 | 1.092824 | 13.77569 | 1.368828 | 13.7756949 | NADH dehydrogenase [ubiquinone] 1 alpha subcomplex subunit 7 |
| 41 | O95168 | NDUFB4 | 1.403307 | 14.4717 | 2.198141 | 14.4716973 | NADH dehydrogenase [ubiquinone] 1 beta subcomplex subunit 4 |
| 42 | Q96JB5 | CDK5RAP3 | 1.487408 | 13.68659 | 1.365529 | 13.6865904 | CDK5 regulatory subunit-associated protein 3 |
| 43 | Q6DD87 | ZNF787 | 0.449662 | 12.83611 | 0.524829 | 12.8361067 | Zinc finger protein 787 |
| 44 | P68402 | PAFAH1B2 | 0.442696 | 12.91273 | 0.414401 | 12.9127301 | Platelet-activating factor acetylhydrolase IB subunit beta |
| 45 | Q9P035 | HACD3 | −0.293977 | 13.0163 | −0.2693 | 13.0163005 | Very-long-chain (3R)-3-hydroxyacyl-CoA dehydratase 3 |
| 46 | Q9Y333 | LSM2 | −0.334766 | 12.85472 | −0.365537 | 12.8547206 | U6 snRNA-associated Sm-like protein LSm2 |
| 47 | Q9C0C9 | UBE2O | −0.270949 | 13.07538 | −0.243153 | 13.075381 | (E3-independent) E2 ubiquitin-conjugating enzyme |
| 48 | Q15056 | EIF4H | 0.623605 | 13.81299 | 0.603652 | 13.8129855 | Eukaryotic translation initiation factor 4H |
| 49 | O95299 | NDUFA10 | −0.218766 | 12.90348 | −0.228773 | 12.9034786 | NADH dehydrogenase [ubiquinone] 1 alpha subcomplex subunit 10, mitochondrial |
| 50 | Q9Y5Z4 | HEBP2 | 0.231251 | 13.05045 | 0.21175 | 13.0504482 | Heme-binding protein 2 |
| 51 | O14735 | CDIPT | 1.111774 | 13.53497 | 1.071985 | 13.5349659 | CDP-diacylglycerol-inositol 3-phosphatidyltransferase |
| 52 | Q32P28 | P3H1 | 0.458678 | 12.86789 | 0.499696 | 12.8678948 | Prolyl 3-hydroxylase 1 |
| 53 | P08697 | SERPINF2 | 1.255988 | 15.87848 | 2.053464 | 15.8784812 | Alpha-2-antiplasmin |
| 54 | Q8WXF7 | ATL1 | 0.348227 | 12.86694 | 0.39655 | 12.8669358 | Atlastin-1 |
| 55 | P01911 | HLA-DRB1 | 0.641901 | 14.50714 | 0.663274 | 14.507142 | HLA class II histocompatibility antigen, DRB1-15 beta chain |
| 56 | P11908 | PRPS2 | 1.425429 | 13.63723 | 1.541265 | 13.6372317 | Ribose-phosphate pyrophosphokinase 2 |
| 57 | Q86UT6 | NLRX1 | −0.351884 | 12.83793 | −0.329374 | 12.8379265 | NLR family member X1 |
| 58 | Q9UIQ6 | LNPEP | −0.26494 | 13.0362 | −0.302072 | 13.0361981 | Leucyl-cystinyl aminopeptidase |
| 59 | P17568 | NDUFB7 | 0.90106 | 13.50154 | 1.231176 | 13.5015444 | NADH dehydrogenase [ubiquinone] 1 beta subcomplex subunit 7 |
| 60 | Q9NS28 | RGS18 | 0.659701 | 13.35256 | 0.74681 | 13.352561 | Regulator of G-protein signaling 18 |
| 61 | P28838 | LAP3 | −0.27955 | 13.87283 | −0.335483 | 13.8728298 | Cytosol aminopeptidase |
| 62 | Q92597 | NDRG1 | 0.686343 | 13.95879 | 1.152069 | 13.9587948 | Protein NDRG1 |
| 63 | Q9Y2T2 | AP3M1 | −0.347239 | 13.2346 | −0.363207 | 13.2345966 | AP-3 complex subunit mu-1 |
| 64 | Q00577 | PURA | 0.686034 | 13.19965 | 1.050156 | 13.1996452 | Transcriptional activator protein Pur-alpha |
| 65 | Q13813 | SPTAN1 | −0.198628 | 13.121 | −0.255255 | 13.1210042 | Spectrin alpha chain, non-erythrocytic 1 |
| 66 | Q8N4P3 | HDDC3 | 0.351613 | 12.82065 | 0.384854 | 12.8206512 | Guanosine-3′,5′-bis(diphosphate) 3′-pyrophosphohydrolase MESH1 |
| 67 | Q13057 | COASY | −0.25482 | 12.88284 | −0.299964 | 12.8828366 | Bifunctional coenzyme A synthase |
| Sr # | Group | Differentially Expressed Proteins |
|---|---|---|
| 1 | Converter | COX5A,MT-CO2,VASP,C3,LSM3,EIF5A,GC,BID,ALB,ZNF207,AHSG,RAB32,UQCRH,F2,CMAS,A2M,SH3BGRL,AFP,SERPINF1,SERPINC1,BANF1,CALM1;CALM2;CALM3,GRB2,SAP18,UQCRQ,WASF2,ISOC1,AHNAK,C4A,ADD3,CNN2,SLTM,HIST1H1E,SF3B2,GLIPR2,FN1,LPCAT3,MTPN,COX7A2,SKP1,ABCC4,RPS26,PRPS1,ITIH2,HBA2,NONO,RAB6A,OGDH,EXOSC1,SNRPF,UQCR10,RAB11B,USP14,PAFAH1B3,ITIH3,RAE1,SLC30A7,U2AF2,RBM8A,COX6B1,GP1BA,WARS,GIMAP4,DDT,DNAJC13,MYCT1,ARPC3,SMARCC2,ENO2,HCLS1,APOB,PPP1CA,VAT1,RPL31,FBLN1,BLVRA,COL1A1,CAB39,AK2,OSBPL8,CTSB,CNDP2,TPD52L2,LTA4H,TUFM,ARF3;ARF1,ACTG1,PCYT1A,SUCLA2,SNX2,ST13,LAMTOR4,LMAN2,CLEC1B,SYNGR2,RAB18,NDUFA10,PCMT1,PDXK,COL6A1,SARS,ANXA11,NDUFB6,TRAF3IP3,WAS,RAB3D,ZYX,SLC9A3R1,DAD1,UBXN1,TFAM,SASH3,PGK1,TMPO,G3BP1,ALDOA,HM13,RNH1,BIN2,RPL36A;RPL36AL,PSMC2,ACO2,APOH,CEBPB,RPL9P8,TCP1,HNRNPA3,RBX1,PSIP1,GATD3B;GATD3A,PAK2,HSD17B11,HIST1H2BJ,EEF1A1;EEF1A1P5,SCP2,MRE11,COX5B,CHCHD2,IGFBP2,MYL6,NUDC,RO60,PNKD,RAB6B,SART1,PLPBP,DTD1,SRP9,MAGOHB,GART,INPP5A,BAZ1B,COL1A2,MAT2A,ABRACL,CHMP1B,PRDX1,JPT1,HLA-DQA1 |
| 2 | NonConverter | OSBPL8 |
Disclaimer/Publisher’s Note: The statements, opinions and data contained in all publications are solely those of the individual author(s) and contributor(s) and not of MDPI and/or the editor(s). MDPI and/or the editor(s) disclaim responsibility for any injury to people or property resulting from any ideas, methods, instructions or products referred to in the content. |
© 2023 by the authors. Licensee MDPI, Basel, Switzerland. This article is an open access article distributed under the terms and conditions of the Creative Commons Attribution (CC BY) license (https://creativecommons.org/licenses/by/4.0/).
Share and Cite
Zafarullah, M.; Li, J.; Salemi, M.R.; Phinney, B.S.; Durbin-Johnson, B.P.; Hagerman, R.; Hessl, D.; Rivera, S.M.; Tassone, F. Blood Proteome Profiling Reveals Biomarkers and Pathway Alterations in Fragile X PM at Risk for Developing FXTAS. Int. J. Mol. Sci. 2023, 24, 13477. https://doi.org/10.3390/ijms241713477
Zafarullah M, Li J, Salemi MR, Phinney BS, Durbin-Johnson BP, Hagerman R, Hessl D, Rivera SM, Tassone F. Blood Proteome Profiling Reveals Biomarkers and Pathway Alterations in Fragile X PM at Risk for Developing FXTAS. International Journal of Molecular Sciences. 2023; 24(17):13477. https://doi.org/10.3390/ijms241713477
Chicago/Turabian StyleZafarullah, Marwa, Jie Li, Michelle R. Salemi, Brett S. Phinney, Blythe P. Durbin-Johnson, Randi Hagerman, David Hessl, Susan M. Rivera, and Flora Tassone. 2023. "Blood Proteome Profiling Reveals Biomarkers and Pathway Alterations in Fragile X PM at Risk for Developing FXTAS" International Journal of Molecular Sciences 24, no. 17: 13477. https://doi.org/10.3390/ijms241713477