Article

Identification of Photosynthesis Characteristics and Chlorophyll Metabolism in Leaves of Citrus Cultivar (Harumi) with Varying Degrees of Chlorosis

1
College of Horticulture, Sichuan Agricultural University, Chengdu 611130, China
2
Institute of Pomology and Olericulture, Sichuan Agricultural University, Chengdu 611130, China
*
Authors to whom correspondence should be addressed.
These authors contributed equally to this work.
Int. J. Mol. Sci. 2023, 24(9), 8394; https://doi.org/10.3390/ijms24098394
Submission received: 1 March 2023 / Revised: 22 April 2023 / Accepted: 5 May 2023 / Published: 7 May 2023

Abstract

:
In autumn and spring, citrus leaves with a Ponkan (Citrus reticulata Blanco cv. Ponkan) genetic background (Harumi, Daya, etc.) are prone to abnormal physiological chlorosis. The effects of different degrees of chlorosis (normal, mild, moderate and severe) on photosynthesis and the chlorophyll metabolism of leaves of Citrus cultivar (Harumi) were studied via field experiment. Compared with severe chlorotic leaves, the results showed that chlorosis could break leaf metabolism balance, including reduced chlorophyll content, photosynthetic parameters, antioxidant enzyme activity and enzyme activity related to chlorophyll synthesis, increased catalase and decreased enzyme activity. In addition, the content of chlorophyll synthesis precursors showed an overall downward trend expected for uroporphyrinogen III. Furthermore, the relative expression of genes for chlorophyll synthesis (HEMA1, HEME2, HEMG1 and CHLH) was down-regulated to some extent and chlorophyll degradation (CAO, CLH, PPH, PAO and SGR) showed the opposite trend with increased chlorosis. Changes in degradation were more significant. In general, the chlorosis of Harumi leaves might be related to the blocked transformation of uroporphyrinogen III (Urogen III) to coproporphyrinogen III (Coprogen III), the weakening of antioxidant enzyme system activity, the weakening of chlorophyll synthesis and the enhancement in degradation.

1. Introduction

Citrus, one of the world’s most important fruit crops in the family Rutaceae [1], is grown in more than 140 countries, mainly in tropical and subtropical regions [2]. Citrus fruits are rich in bioactive substances, such as essential oils, carotenoids, flavonoids, acacia and limonoids, which have significant effects in terms of anti-inflammation, anti-oxidation, immune regulation, prevention and treatment of multiple respiratory diseases [3,4]. Harumi, which is a late-maturing hybrid citrus [‘F 2432’ Ponkan (Citrus reticulata) × Kiyomi tangor (Citrus unshiu × Citrus sinensis)] [5], has been increasingly planted in China and favored by many consumers because of its high quality, high yield and abundant nutrients [6]. However, after years of field observation, we found that citrus (Harumi, Daya, etc.) leaves with a Ponkan (Citrus reticulata Blanco cv. Ponkan) genetic background were prone to abnormal physiological chlorosis. Leaf color variation is a common type of mutation, which is usually caused by abnormal chlorophyll synthesis and metabolism pathways caused by gene mutation [7]. The most common leaf color mutations are chlorosis and albino. Chlorotic leaf is a product of reduced chlorophyll content. Many scholars have explored the cause and found that disrupted chlorophyll biosynthesis [8], accelerated chlorophyll degradation [9] and reduced chlorophyll protection activity and pigment [10] may lead to changes in plant leaf color.
Chlorophyll (Chl) is the main photosynthetic pigment of plants. The proper provision of Chl is a key condition for the smooth performance of photosynthesis [11]. Chlorophylls (Chls, Chl a and Chl b) are tetrapyrrole molecules essential for photosynthetic light harvesting and energy transduction [12]. Changes in natural conditions, such as light and temperature, affect the process of chlorophyll synthesis and degradation, resulting in changes in Chl content. When Chl content changes in plants, various leaf color mutant phenotypes occur, including chlorina, virescent, albino, yellow-green and stay-green. Leaf color mutants develop from the inhibition of genes that regulate Chl biosynthesis and chloroplast development [13]. The total Chl content per unit of leaf area is one of the most sensitive factors to nutrient availability and different environmental stresses [14]. In addition, chlorophyll a (Chl a) is essential for photochemistry, which, in its excited state, converts light energy into electricity, while chlorophyll b (Chl b) provides plants with an advantage in harvesting light around 450 nm, a wavelength region of light that is not efficiently absorbed by Chl a [11,15]. However, Chl, which is a potential cellular phytotoxin, must be degraded when there is excess Chl and its derivatives [16]. Otherwise, reactive oxygen species (ROS) produced by excess Chl can lead to leaf cell death when Chl degradation is inhibited [17,18].
In recent years, the study of chlorophyll synthesis and the degradation pathway has become a hot topic [19,20,21]. Chl metabolism is strictly regulated at different stages of plant development [14]. A study on tomato chlorophyll has shown that the slym1 gene negatively regulates photosynthesis. The binding of Slym1 to the intermediate protein MP (ID: 101256896) leads to the interaction between MP and HY5, resulting in the accumulation of a large amount of unbound HY5 in the cell, thus accelerating the breakdown of chlorophyll [22]. Chlide a oxygenase (CAO) is the only enzyme found to catalyze the conversion of Chl a to Chl b [12]. SGR1 plays a key role in chlorophyll degradation, and plants lacking SGR1 exhibit a strong green-preserving phenotype [23,24]. Pentatricopeptide repeat (PPR) proteins have been shown to influence chloroplast development and chlorophyll accumulation by editing the RNA of chloroplast genes [25]. Soluble versus membrane localization of glutamyl-tRNA reductase (GluTR) has also been shown to be related to chlorophyll content [26]. The Chl biosynthesis pathway in plant tissue is now largely elucidated, but its catabolism regulation is incomplete. Leaf senescence is caused by the breakdown of chlorophyll and the resulting chlorosis of the leaves. In these processes, chlorophyll is broken down in the PAO/Phyllobilin pathway [27,28].
Many studies have focused on the analysis of the expression of relevant genes during photosynthesis, and the regulation of corresponding protein levels [29,30]. However, in this experiment, we investigated photosynthesis, the antioxidant enzyme system, chlorophyll synthesis and degradation metabolism in the common citrus variety Harumi. Chlorophyll metabolism is very complex. Among them, the process of chlorophyll biosynthesis takes L-glutamy-tRNA as a substrate. Under the joint action of a variety of enzymes and related genes, it takes 16 steps to finally synthesize chlorophyll [31]. In chlorophyll synthesis, any problem with any link may lead to abnormal chlorophyll metabolism [25]. Therefore, it is necessary to further study the intermediates, enzyme activities and gene expression related to the chlorophyll metabolism pathway. It is also of great significance to investigate the causes of abnormal chlorosis (one-year-old leaves on autumn shoots, senescence of leaves not yet occurred) of Harumi leaves to promote the normal growth, yield and quality formation of citrus fruits.

2. Results

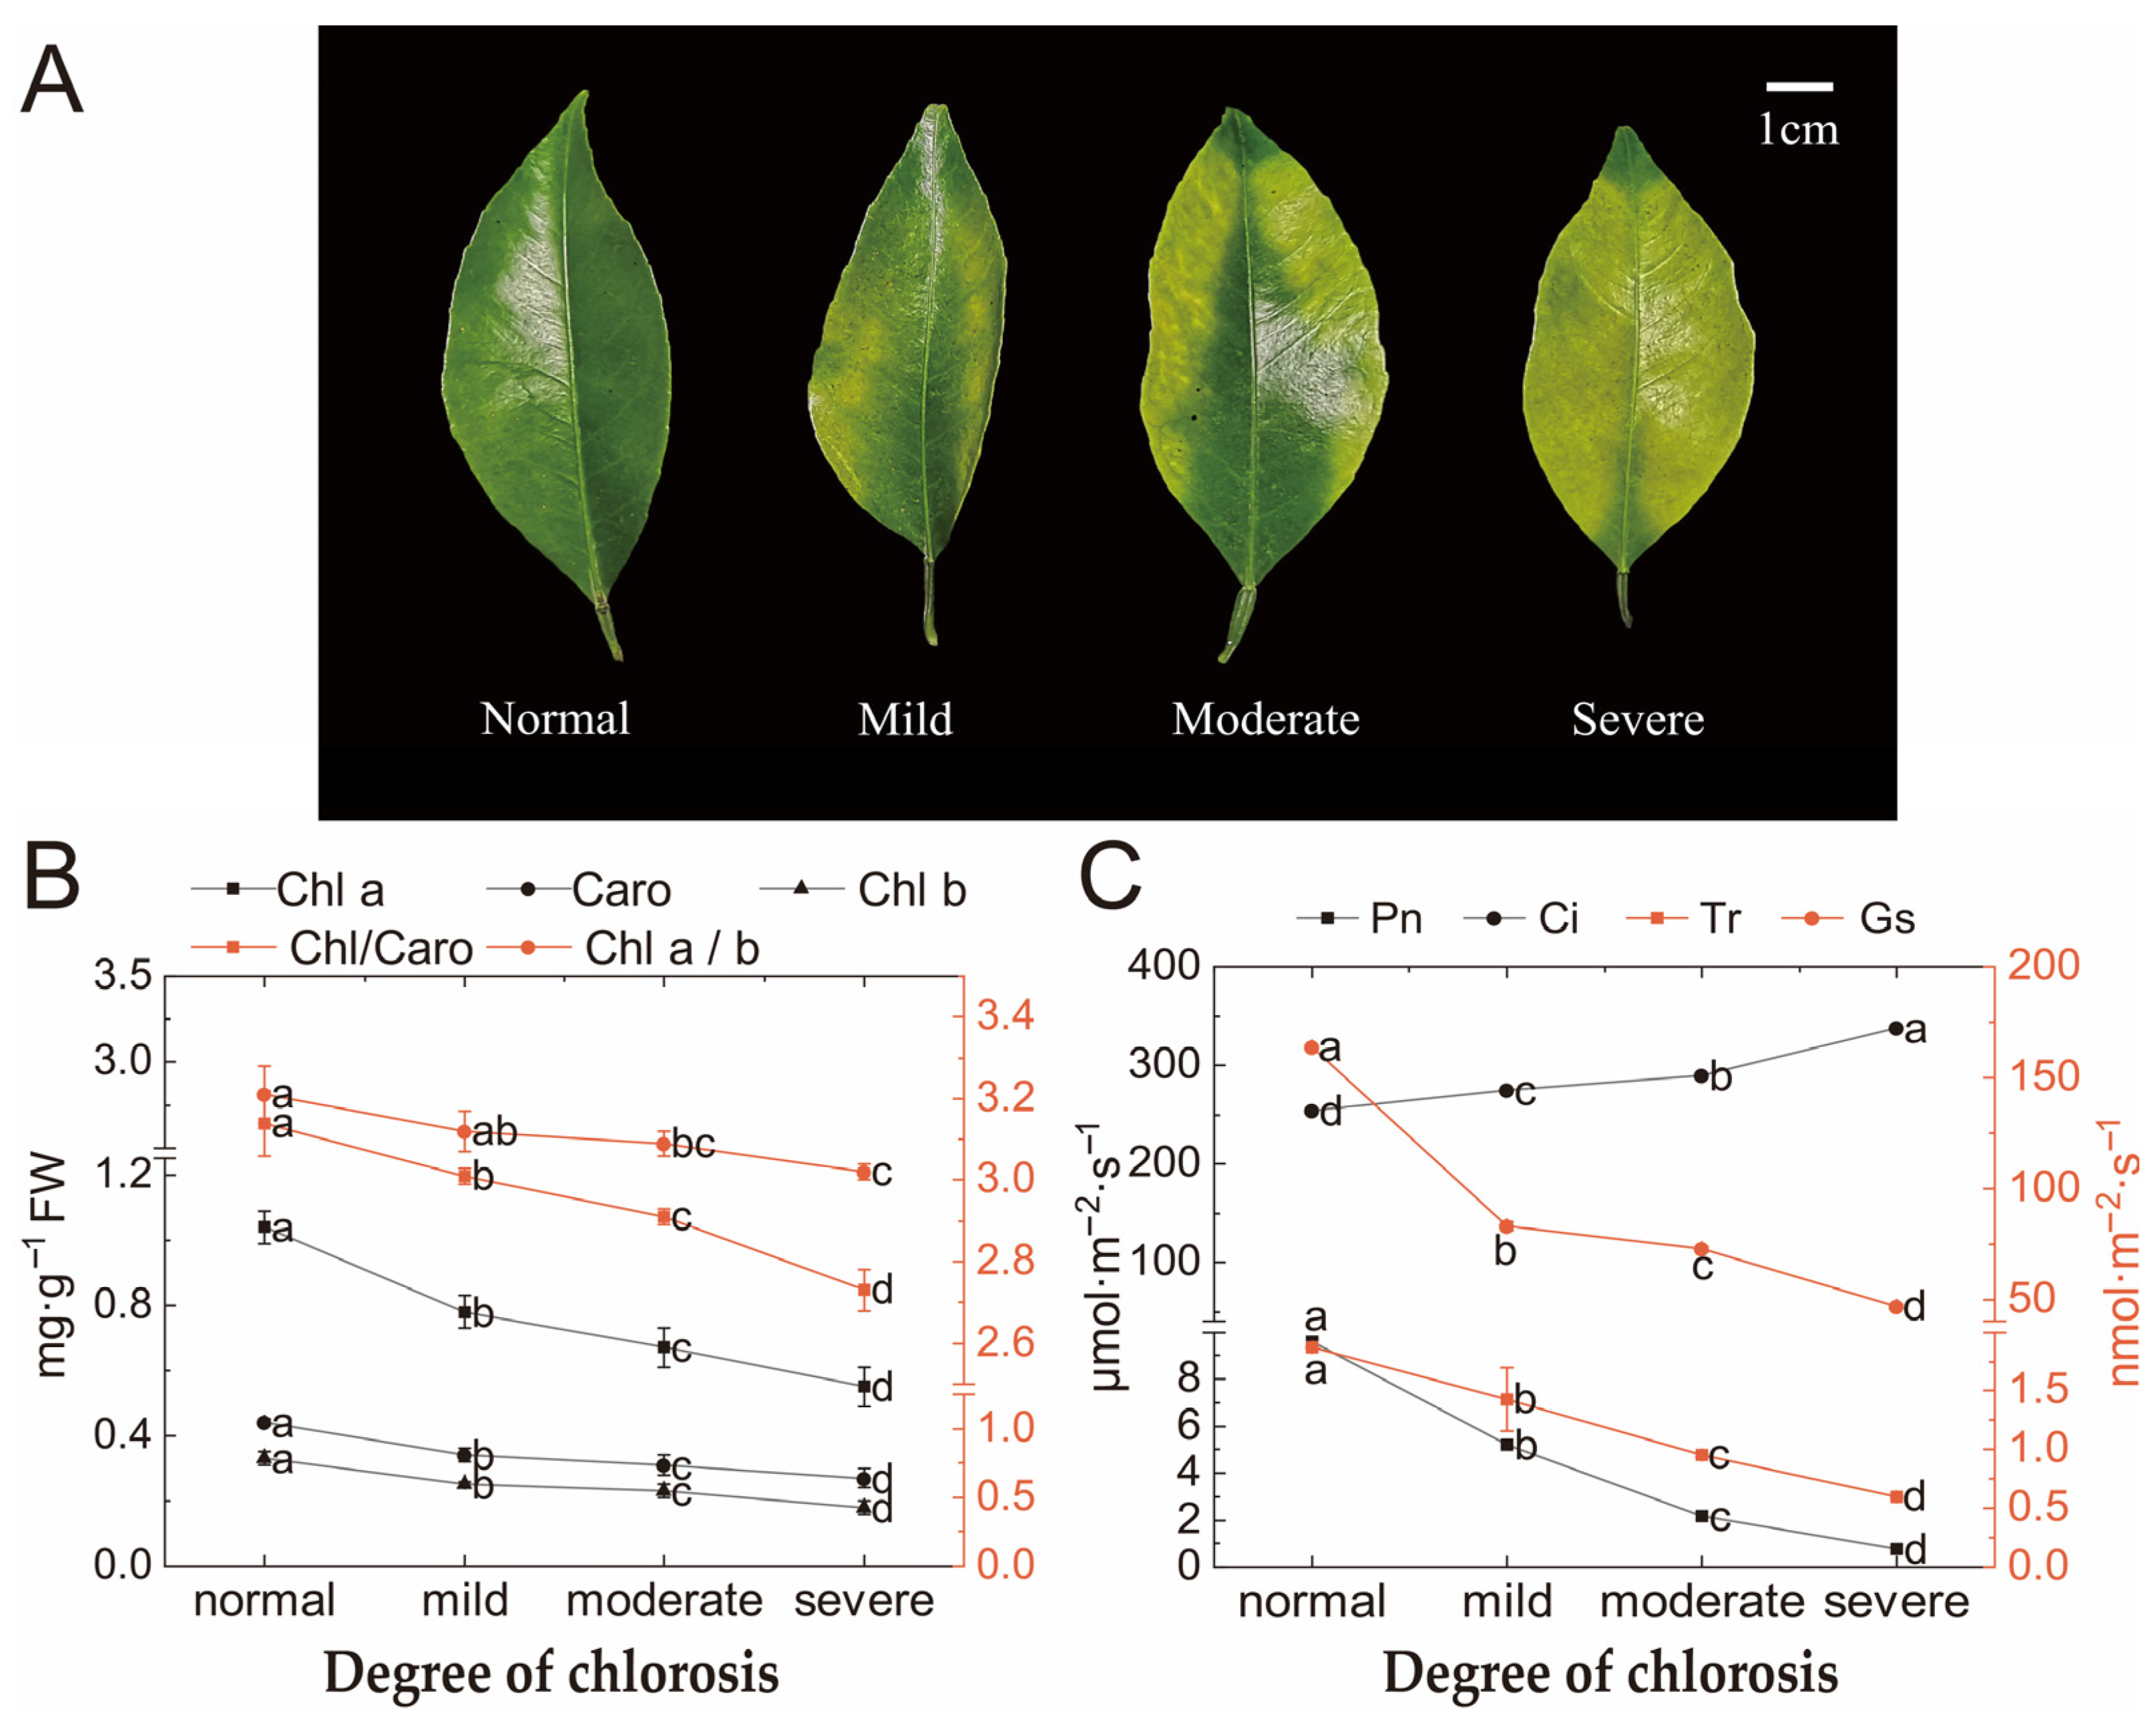
2.1. Photosynthetic Pigments and Photosynthetic Parameters

Photosynthetic pigments in leaves decreased with the degree of chlorosis (Figure 1B). The photosynthetic pigments of normal leaves were significantly higher than leaves with moderate and severe chlorosis. There was no significant difference in the chlorophyll a/b ratio, but there was a significant difference in the chlorophyll/carotenoid ratio. The chlorophyll/carotenoid ratio decreased significantly with the increase in chlorosis degree, and the maximum decrease was 18.50%. The analysis of gas exchange parameters showed that as chlorosis deepened, Pn (net photosynthesis rate), Tr (transpiration rate) and Gs (stomatal conductance) values significantly decreased, excluding an increase in Ci (intercellular CO2 concentration) (Figure 1C). Pn, Tr and Gs showed linear regression with R2 = 0.9928, R2 = 0.9791 and R2 = 0.9776 with total chlorophyll, respectively. However, no linear correlation was found between Ci and total chlorophyll (Table 1).

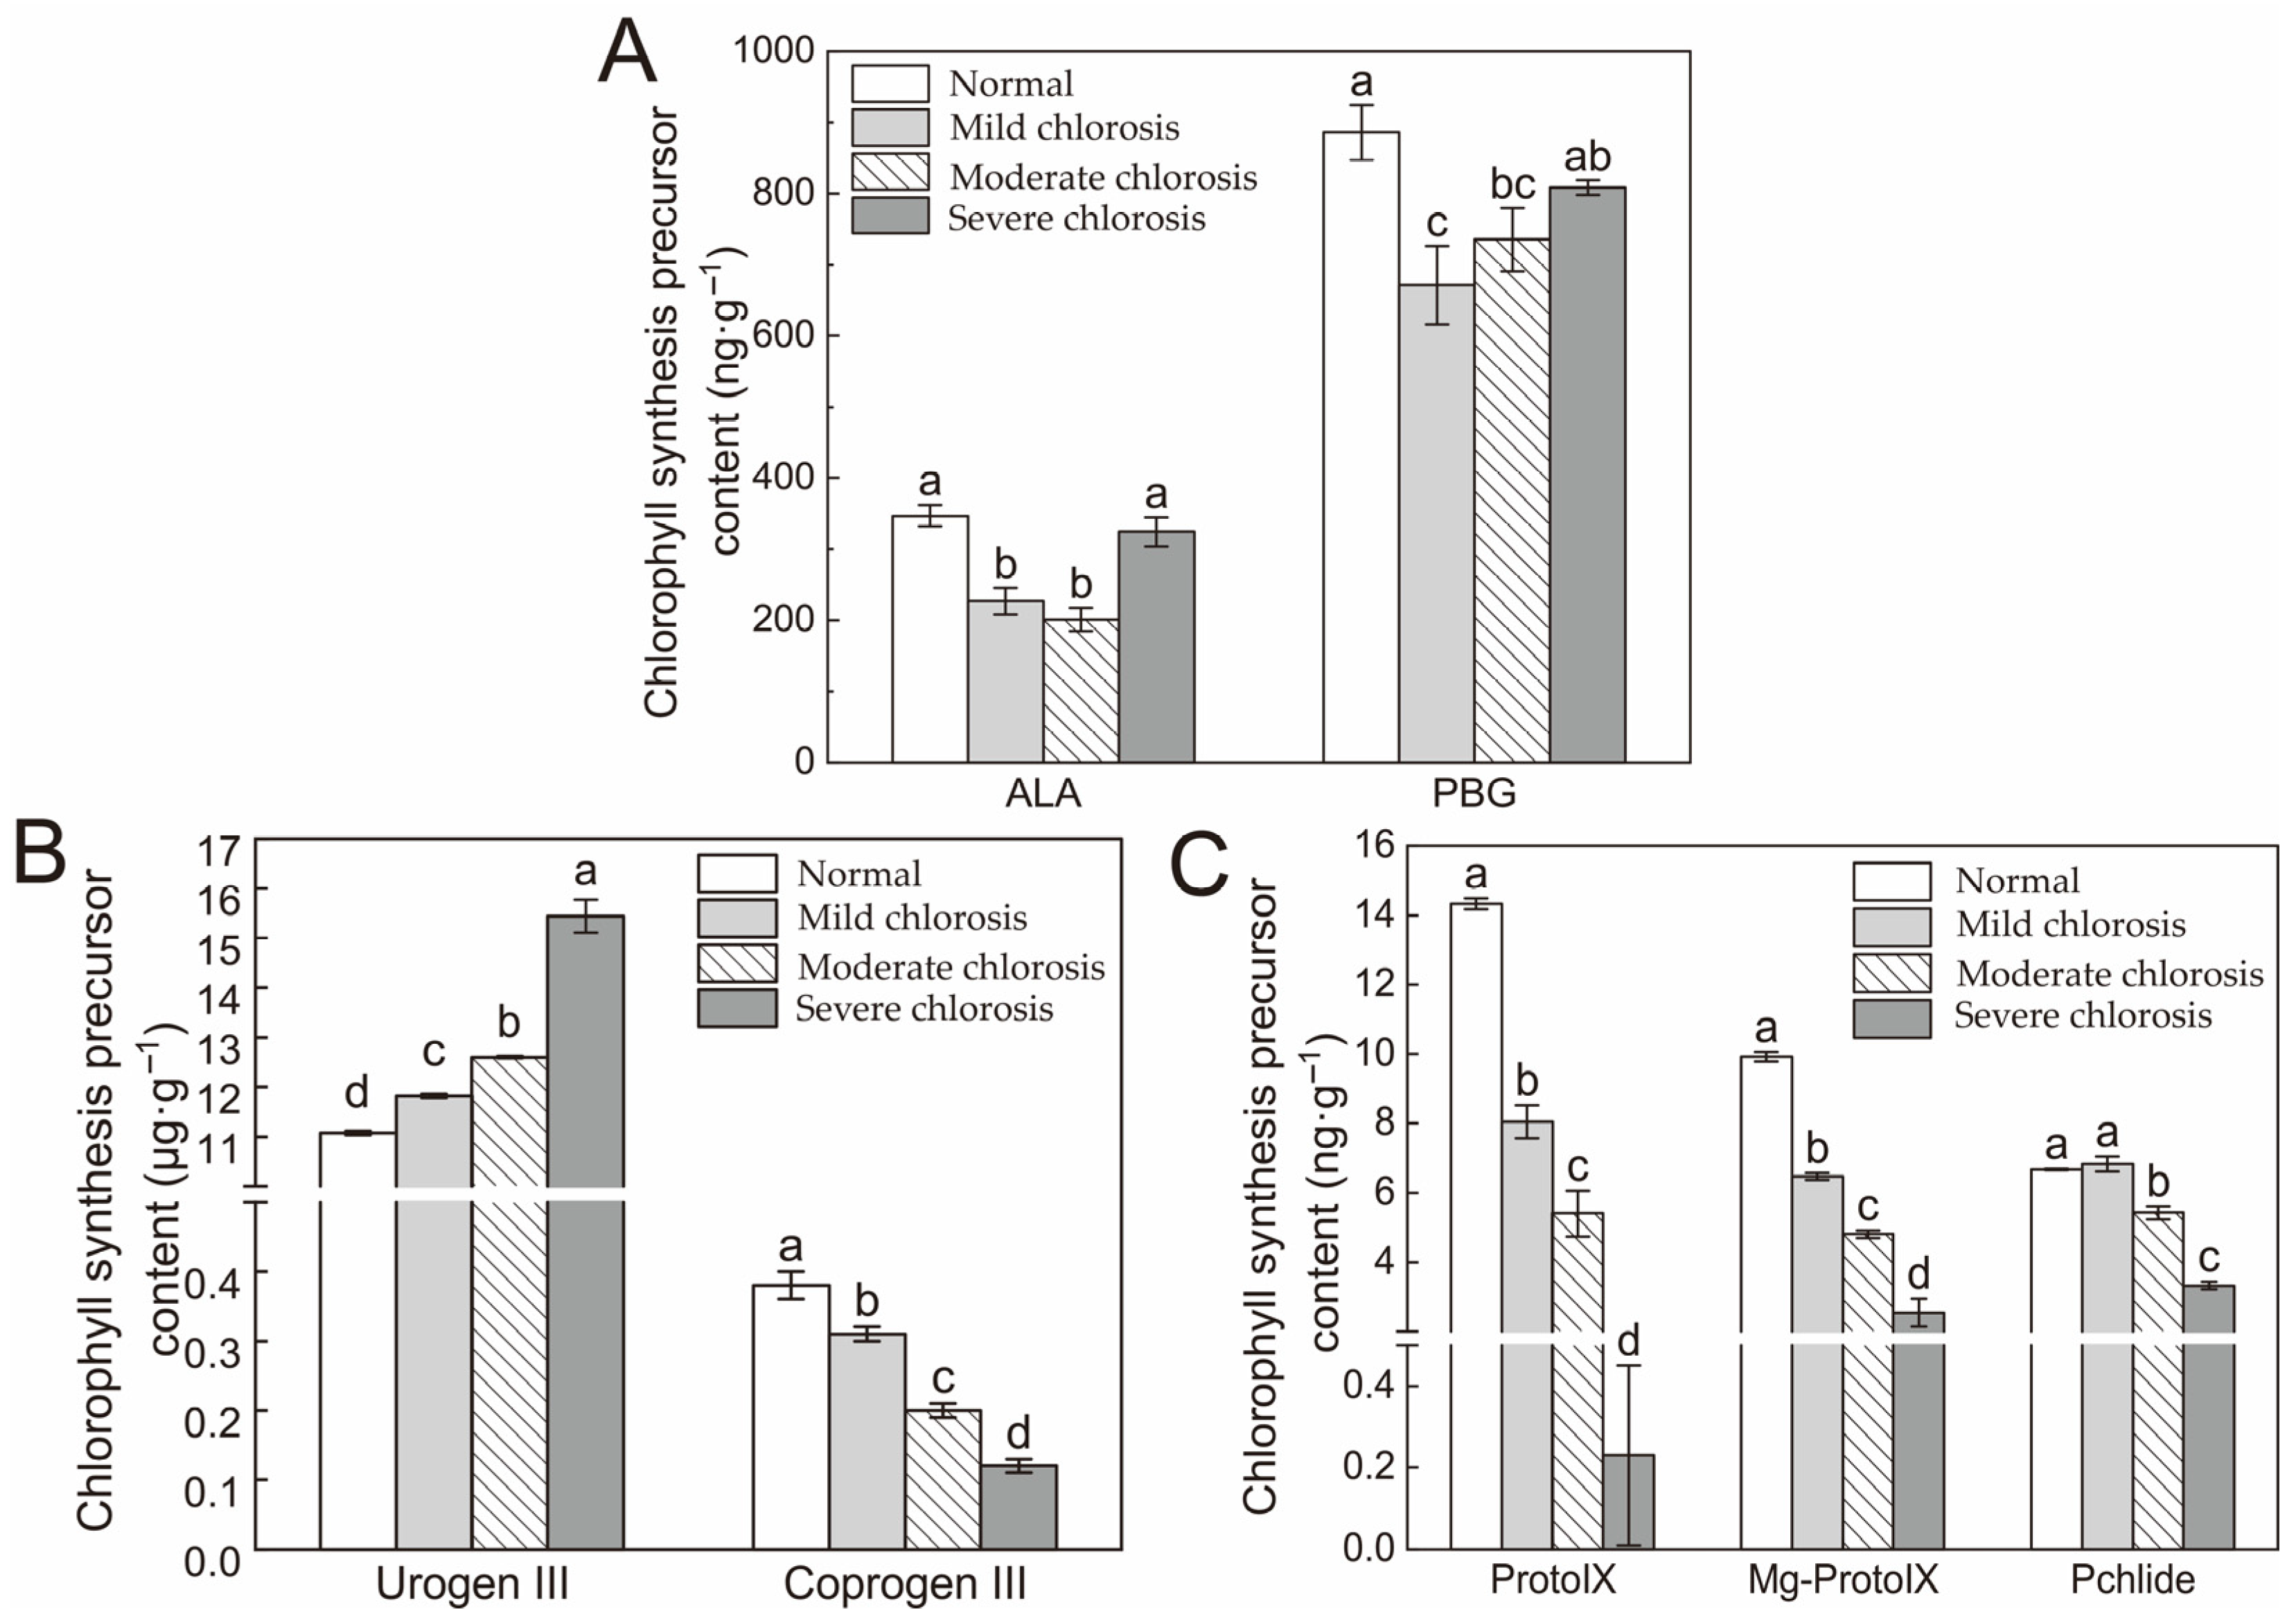
2.2. Chlorophyll Synthesis Precursors

The contents of Coprogen III, Proto IX (protoporphyrin IX), Mg-Proto IX (Mg-protoporphyrin IX) and Pchlide (protochlorophyllide) in chlorotic leaves were significantly lower than those of the normal leaves, except for Urogen III, ALA (δ-5-aminolevulinic acid) and PBG (porphobilinogen) (Figure 2). Changes in ALA and PBG contents were basically the same, decreasing in mild and moderate chlorotic leaves and then increasing in severe chlorotic leaves (Figure 2A). The higher the degree of chlorosis, the lower the content of Coprogen III, Proto IX, Mg-Proto IX and Pchlide, but the higher the content of Urogen III. All of the levels of chlorosis represented significant differences for each other (excluding Pchlide) (Figure 2B). Pchlide content showed a decreasing trend while there were no significant differences between the normal and mild chlorosis leaves (Figure 2C). Compared with the normal leaves, the precursors of severe chlorosis had extremely significant changes. Urogen III, Pchlide, Coprogen III, Mg-Proto IX and Proto IX in leaves with severe chlorosis were 139.4%, 49.9%, 31.6%, 25.6% and 1.6% of normal leaves, respectively.

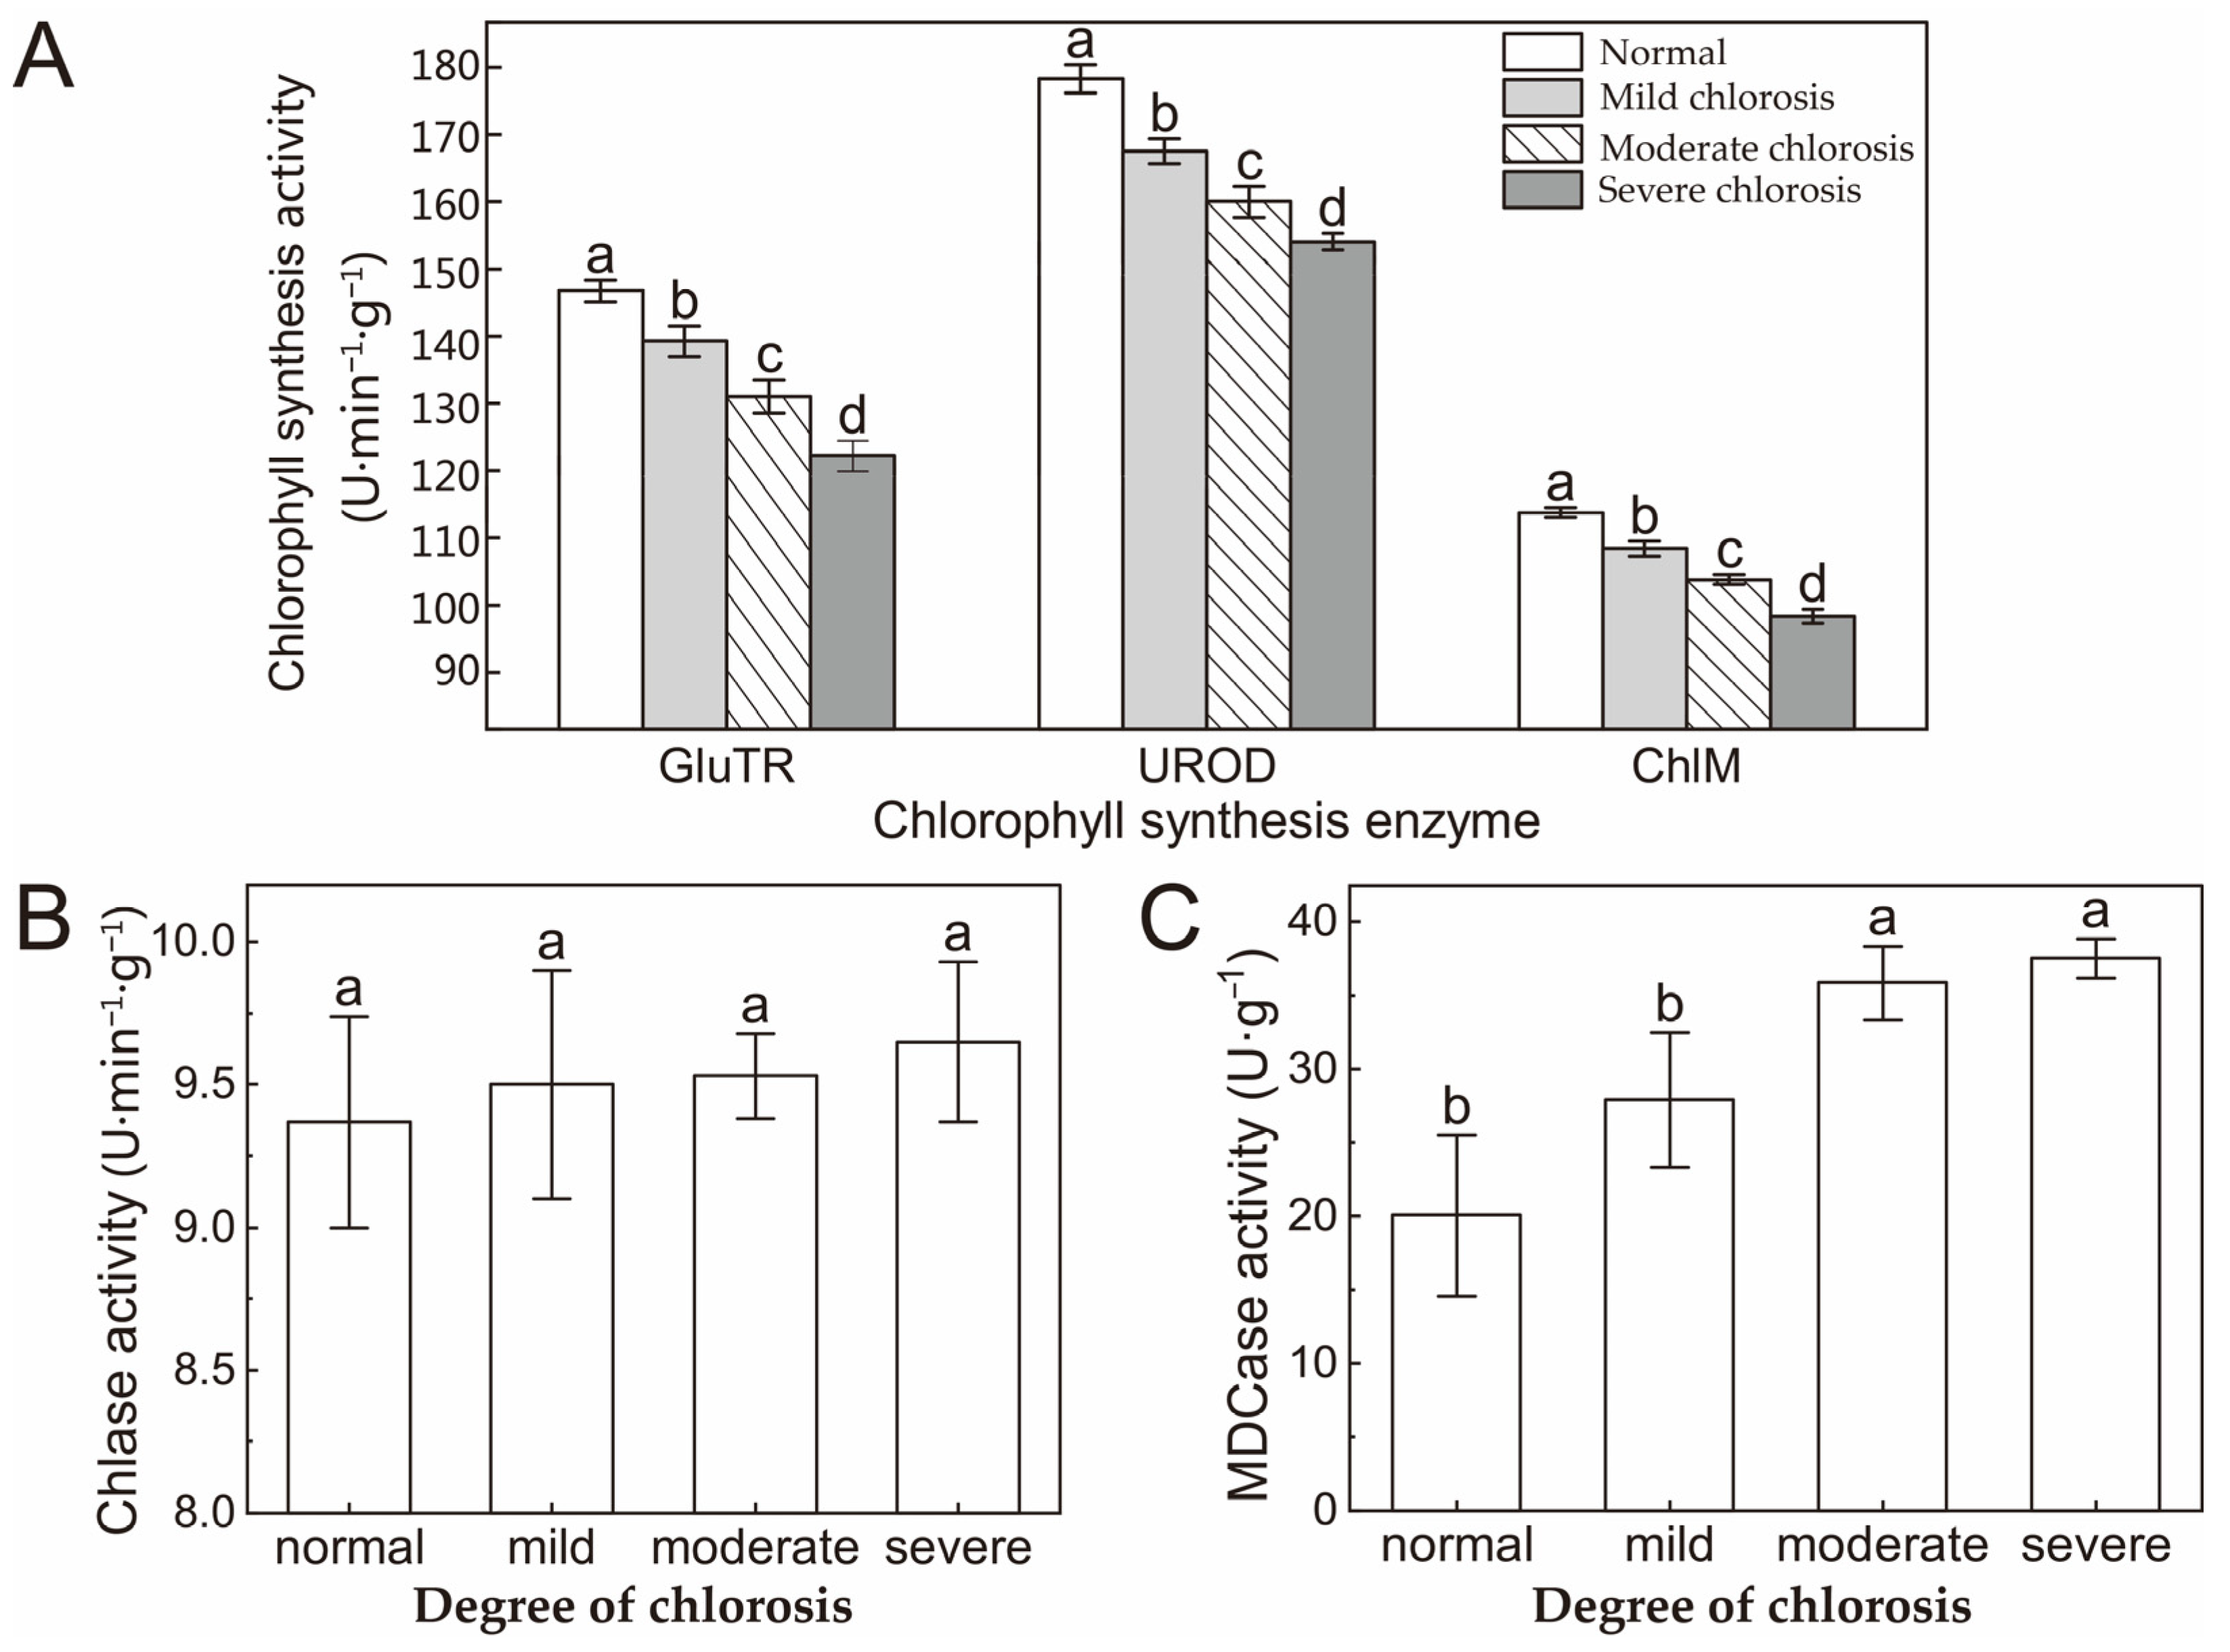
2.3. Activity of Chlorophyll Synthesis and Degradation Enzyme

In chlorotic Harumi leaves, the highest levels of Glu-TR (Glu-tRNAs), UROD (uroporphyrinogen decarboxylase) and ChlM (magnesium protoporphyrin IX methyltransferase) activity were detected in normal leaves (Figure 3A), and the lowest levels were found in leaves with severe chlorosis. Activity decreased continuously and significantly throughout the chlorosis process. In addition, UROD activity was negatively correlated with the content of Urogen III (R2 = −0.8893), but positively correlated with Croprogen III (R2 = 0.9824) (Figure 3A). There were no significant differences in the activities of Chlase (chlorophyllase) and MDCase (Mg-dechelatase) as the degrees of chlorosis increased. In the process of deepening the degree of chlorosis, there was no significant change in the chlase activity in leaves (Figure 3B). For Mg-dechelatase activity, although there was a tendency for it to increase, only a significant difference was observed between severe chlorosis and normal leaves, but no significant difference was found between normal and mild chlorosis or moderate and severe chlorosis (Figure 3C).

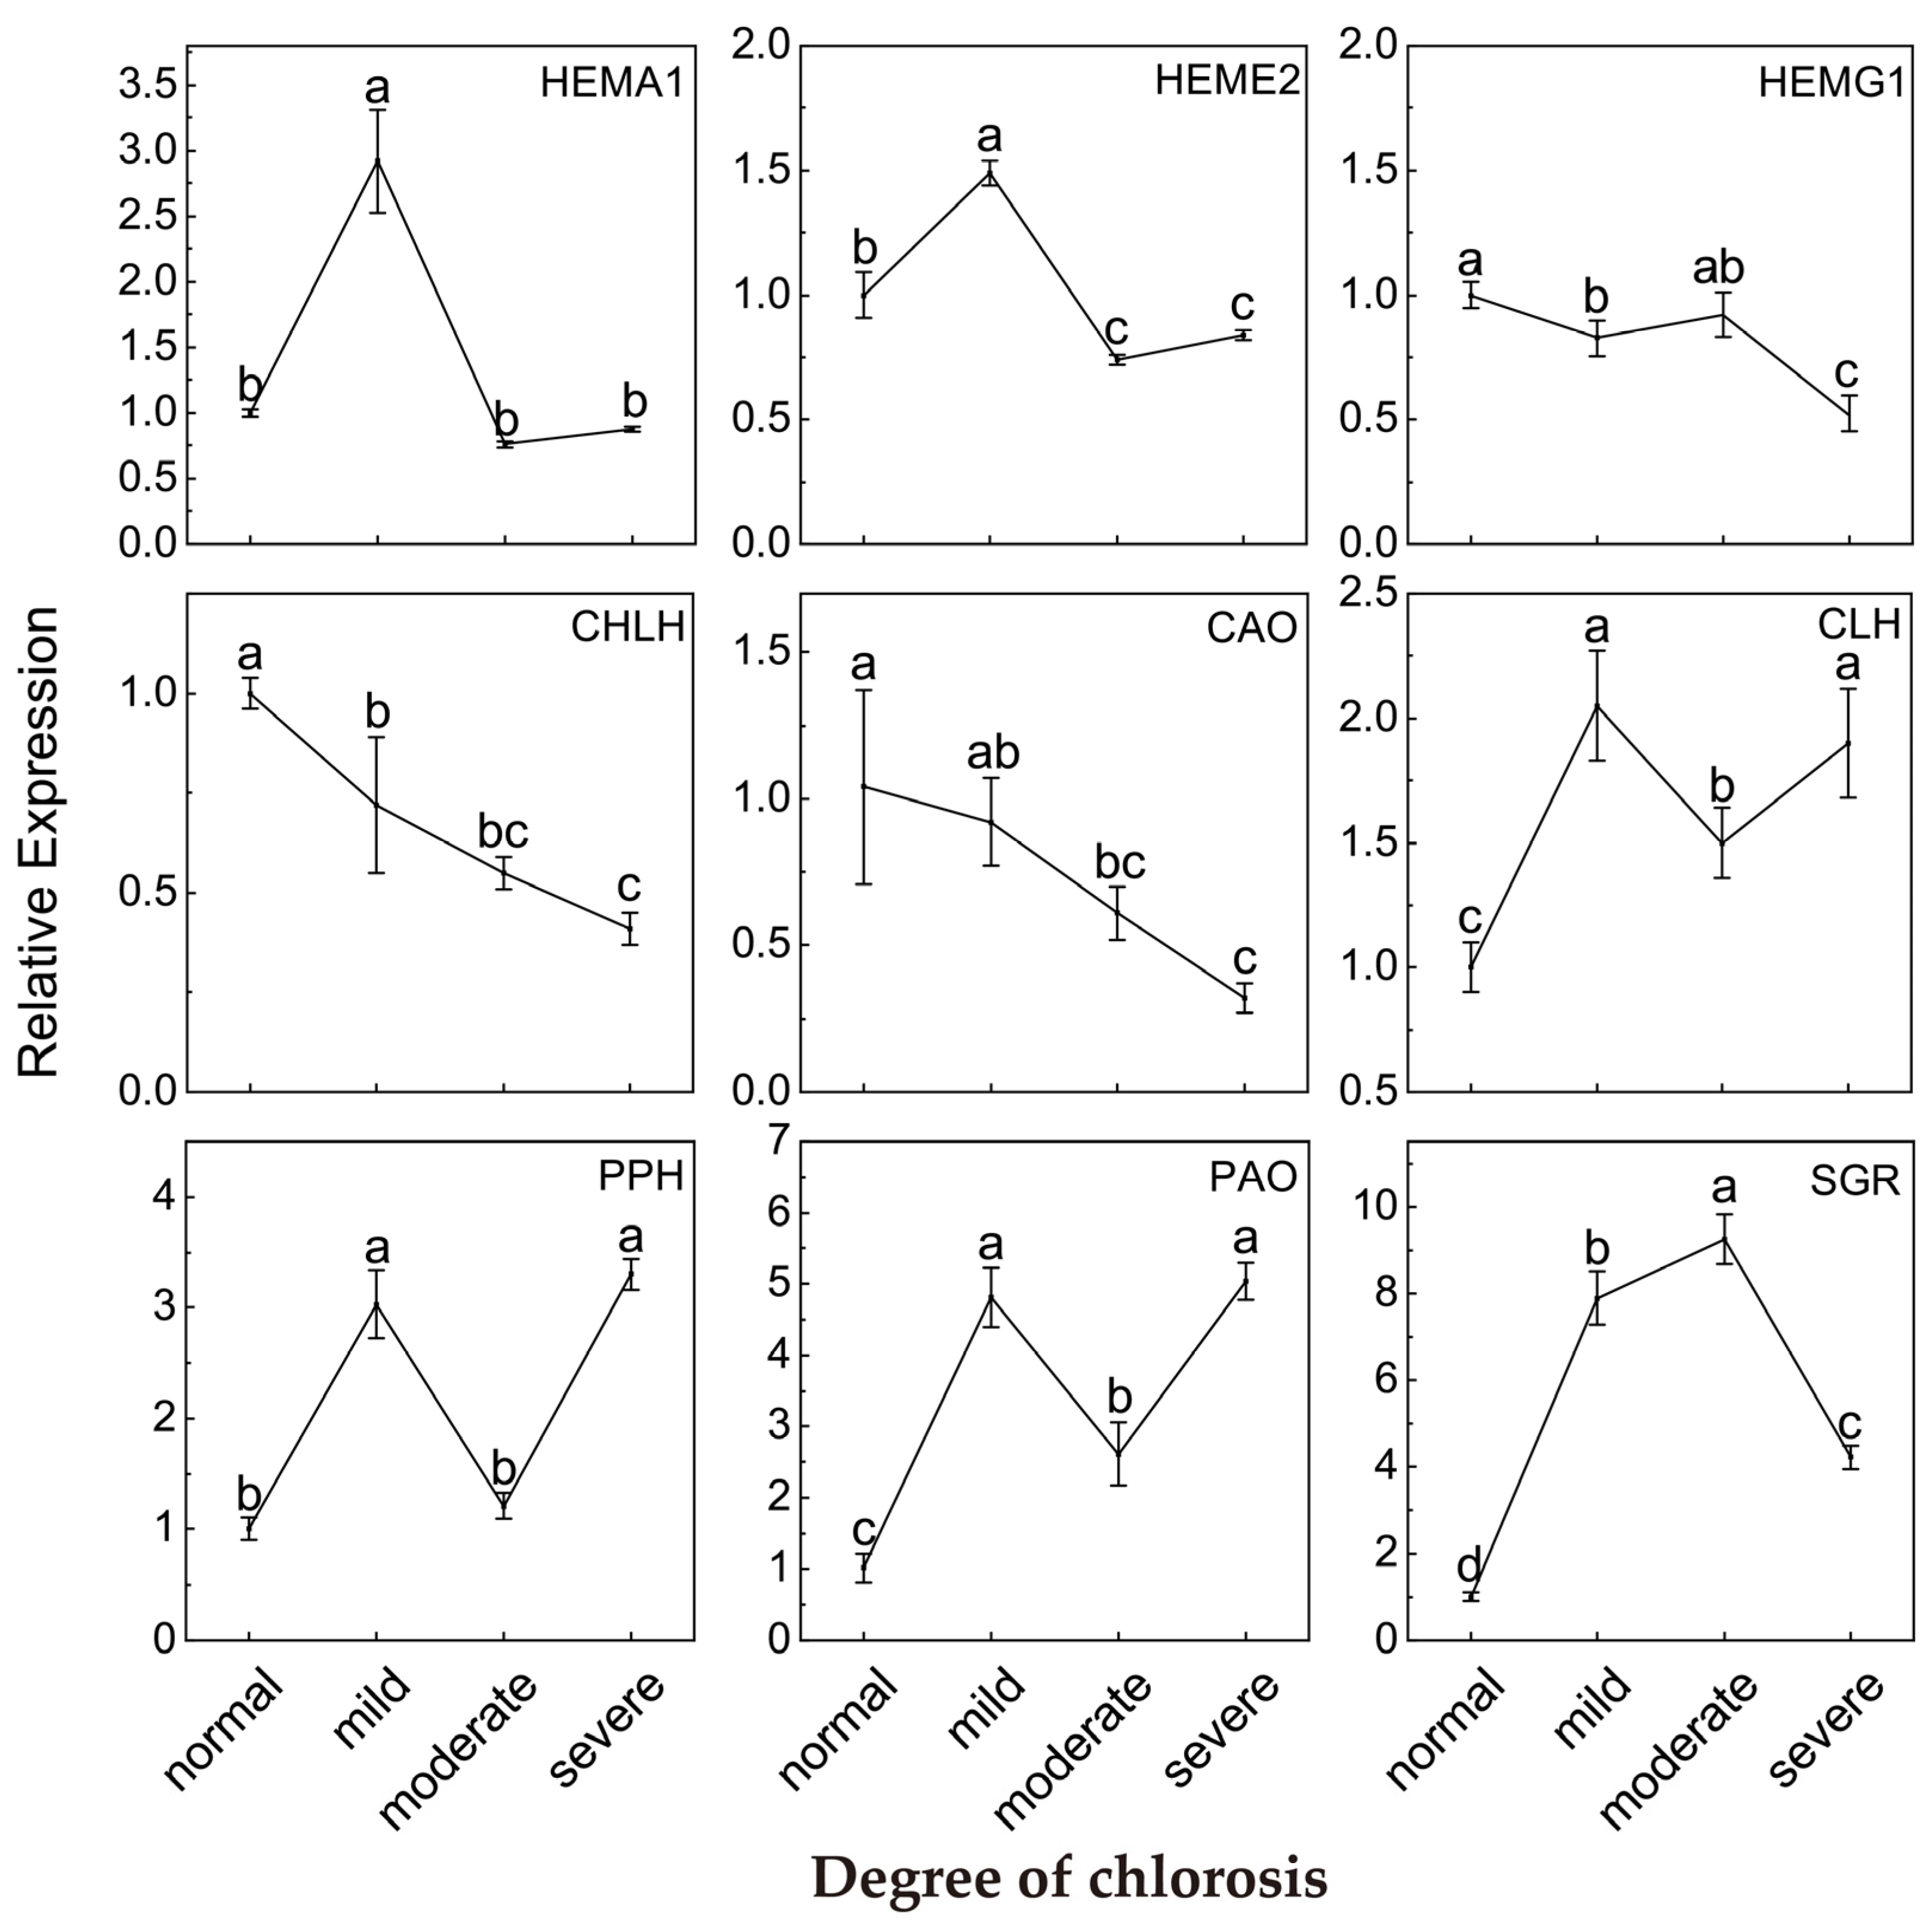
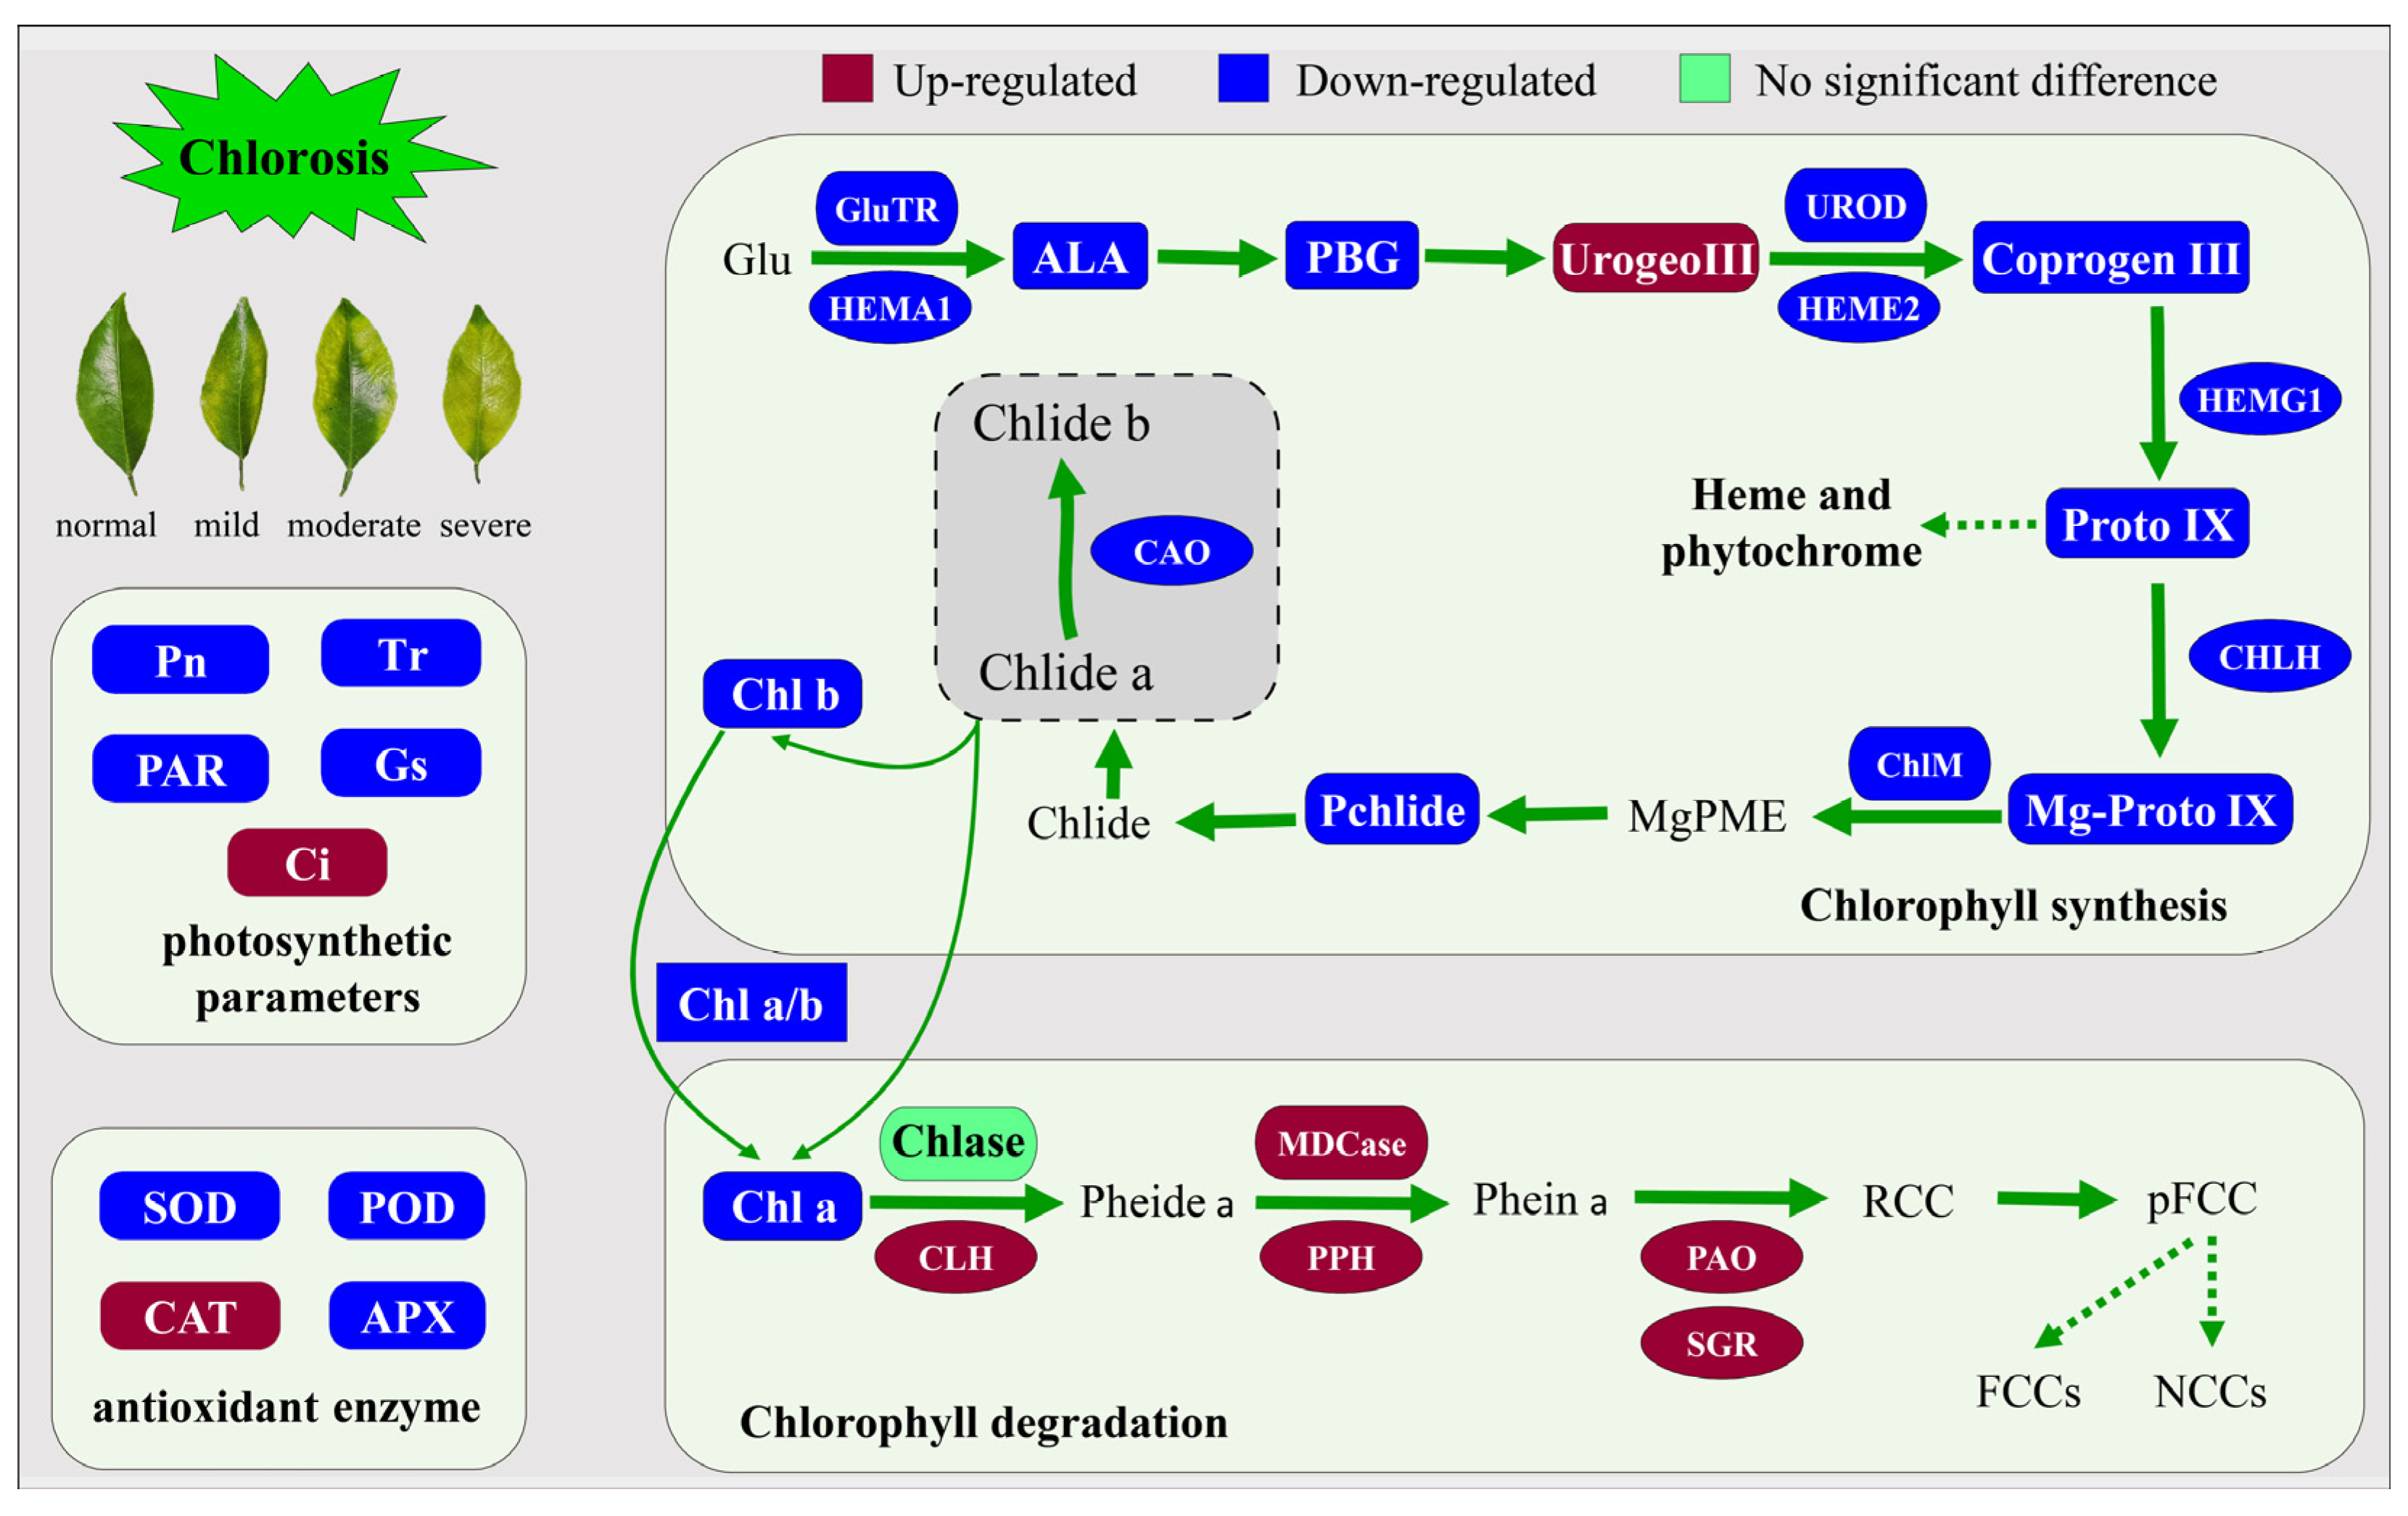
2.4. Relative Expression of Genes Involved in Chlorophyll Metabolism Pathway

Relative expression data showed that the chlorosis of Harumi leaves had significant effects on key genes in the chlorophyll synthesis and degradation pathway chlorosis (Figure 4). As chlorosis intensified, downstream CHLH expression for chlorophyll synthesis was significantly down-regulated, while upstream HEMA1, HEME2 and HEMG1 were also down-regulated to some degree. In addition, HEMA1 and HEME2 were expressed the highest in mild chlorotic leaves, which were significantly higher than normal, moderate and severe chlorotic leaves. It could be seen that the chlorosis of Harumi leaves may have been due to the blocking of the chlorophyll synthesis pathway.
Key gene data for chlorophyll degradation indicated that the leaf chlorosis of Harumi increased the expression of CLH, PPH, PAO and SGR, and the expression of CAO involved in chlorophyll b (chl b) synthesis was significantly down-regulated during leaf chlorosis. The maximum expression of CLH, PPH and PAO was found in mild chlorotic leaves, which was consistent with the expression of the above metabolic genes HEMA1 and HEME2. In addition, stay-green (SGR), which was significantly down-regulated in severe chlorotic leaves, was lower than mild and moderate chlorotic leaves, but still higher than normal leaves. The results showed that the chlorophyll degradation was promoted in chlorotic Harumi leaves.

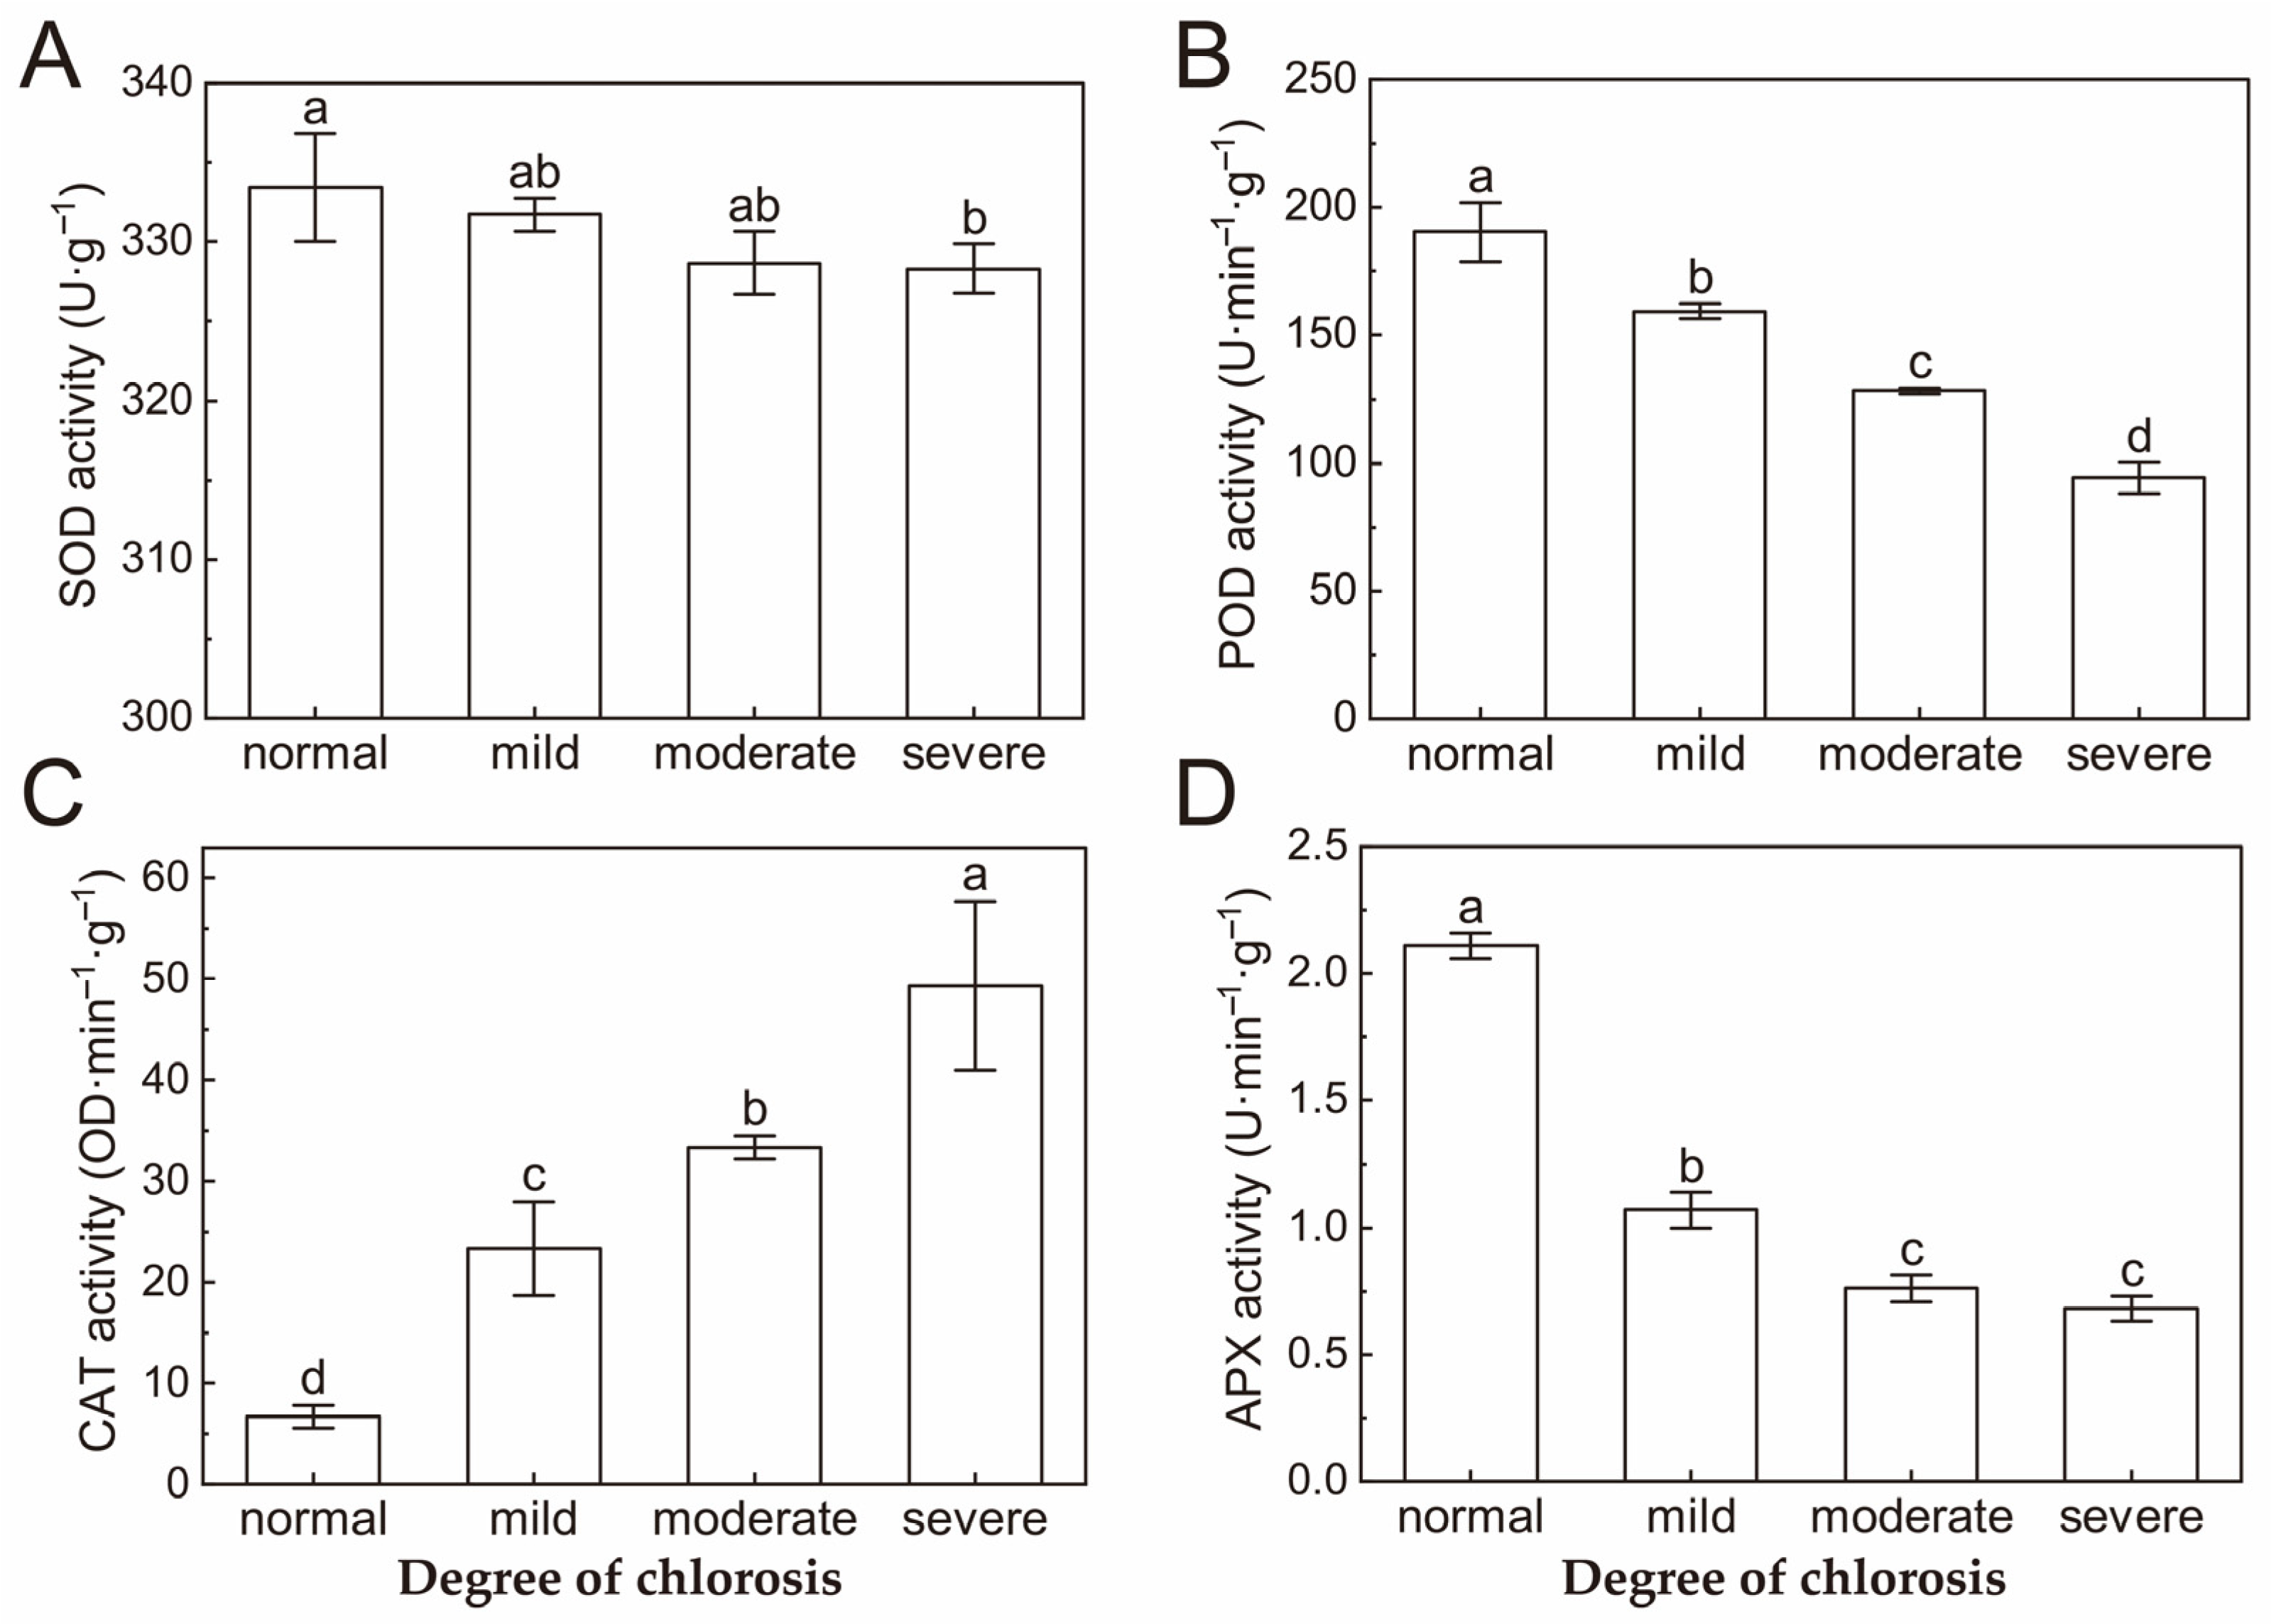
2.5. Antioxidant Enzyme Activity

With the exception of CAT (catalase), all antioxidant enzyme activities in the citrus leaves of Harumi decreased with the deepening of chlorosis (Figure 5). SOD (superoxide dismutase), POD (peroxidase) and APX (ascorbate peroxidase) enzyme activities decreased with increasing degrees of chlorosis, but CAT activity increased. Moreover, the values showed significant variation in the activity of POD and CAT enzymes. The significant difference only existed between normal and severe chlorotic leaves for SOD. APX activity in different degrees of chlorosis was significantly different from normal leaves (Figure 5D).

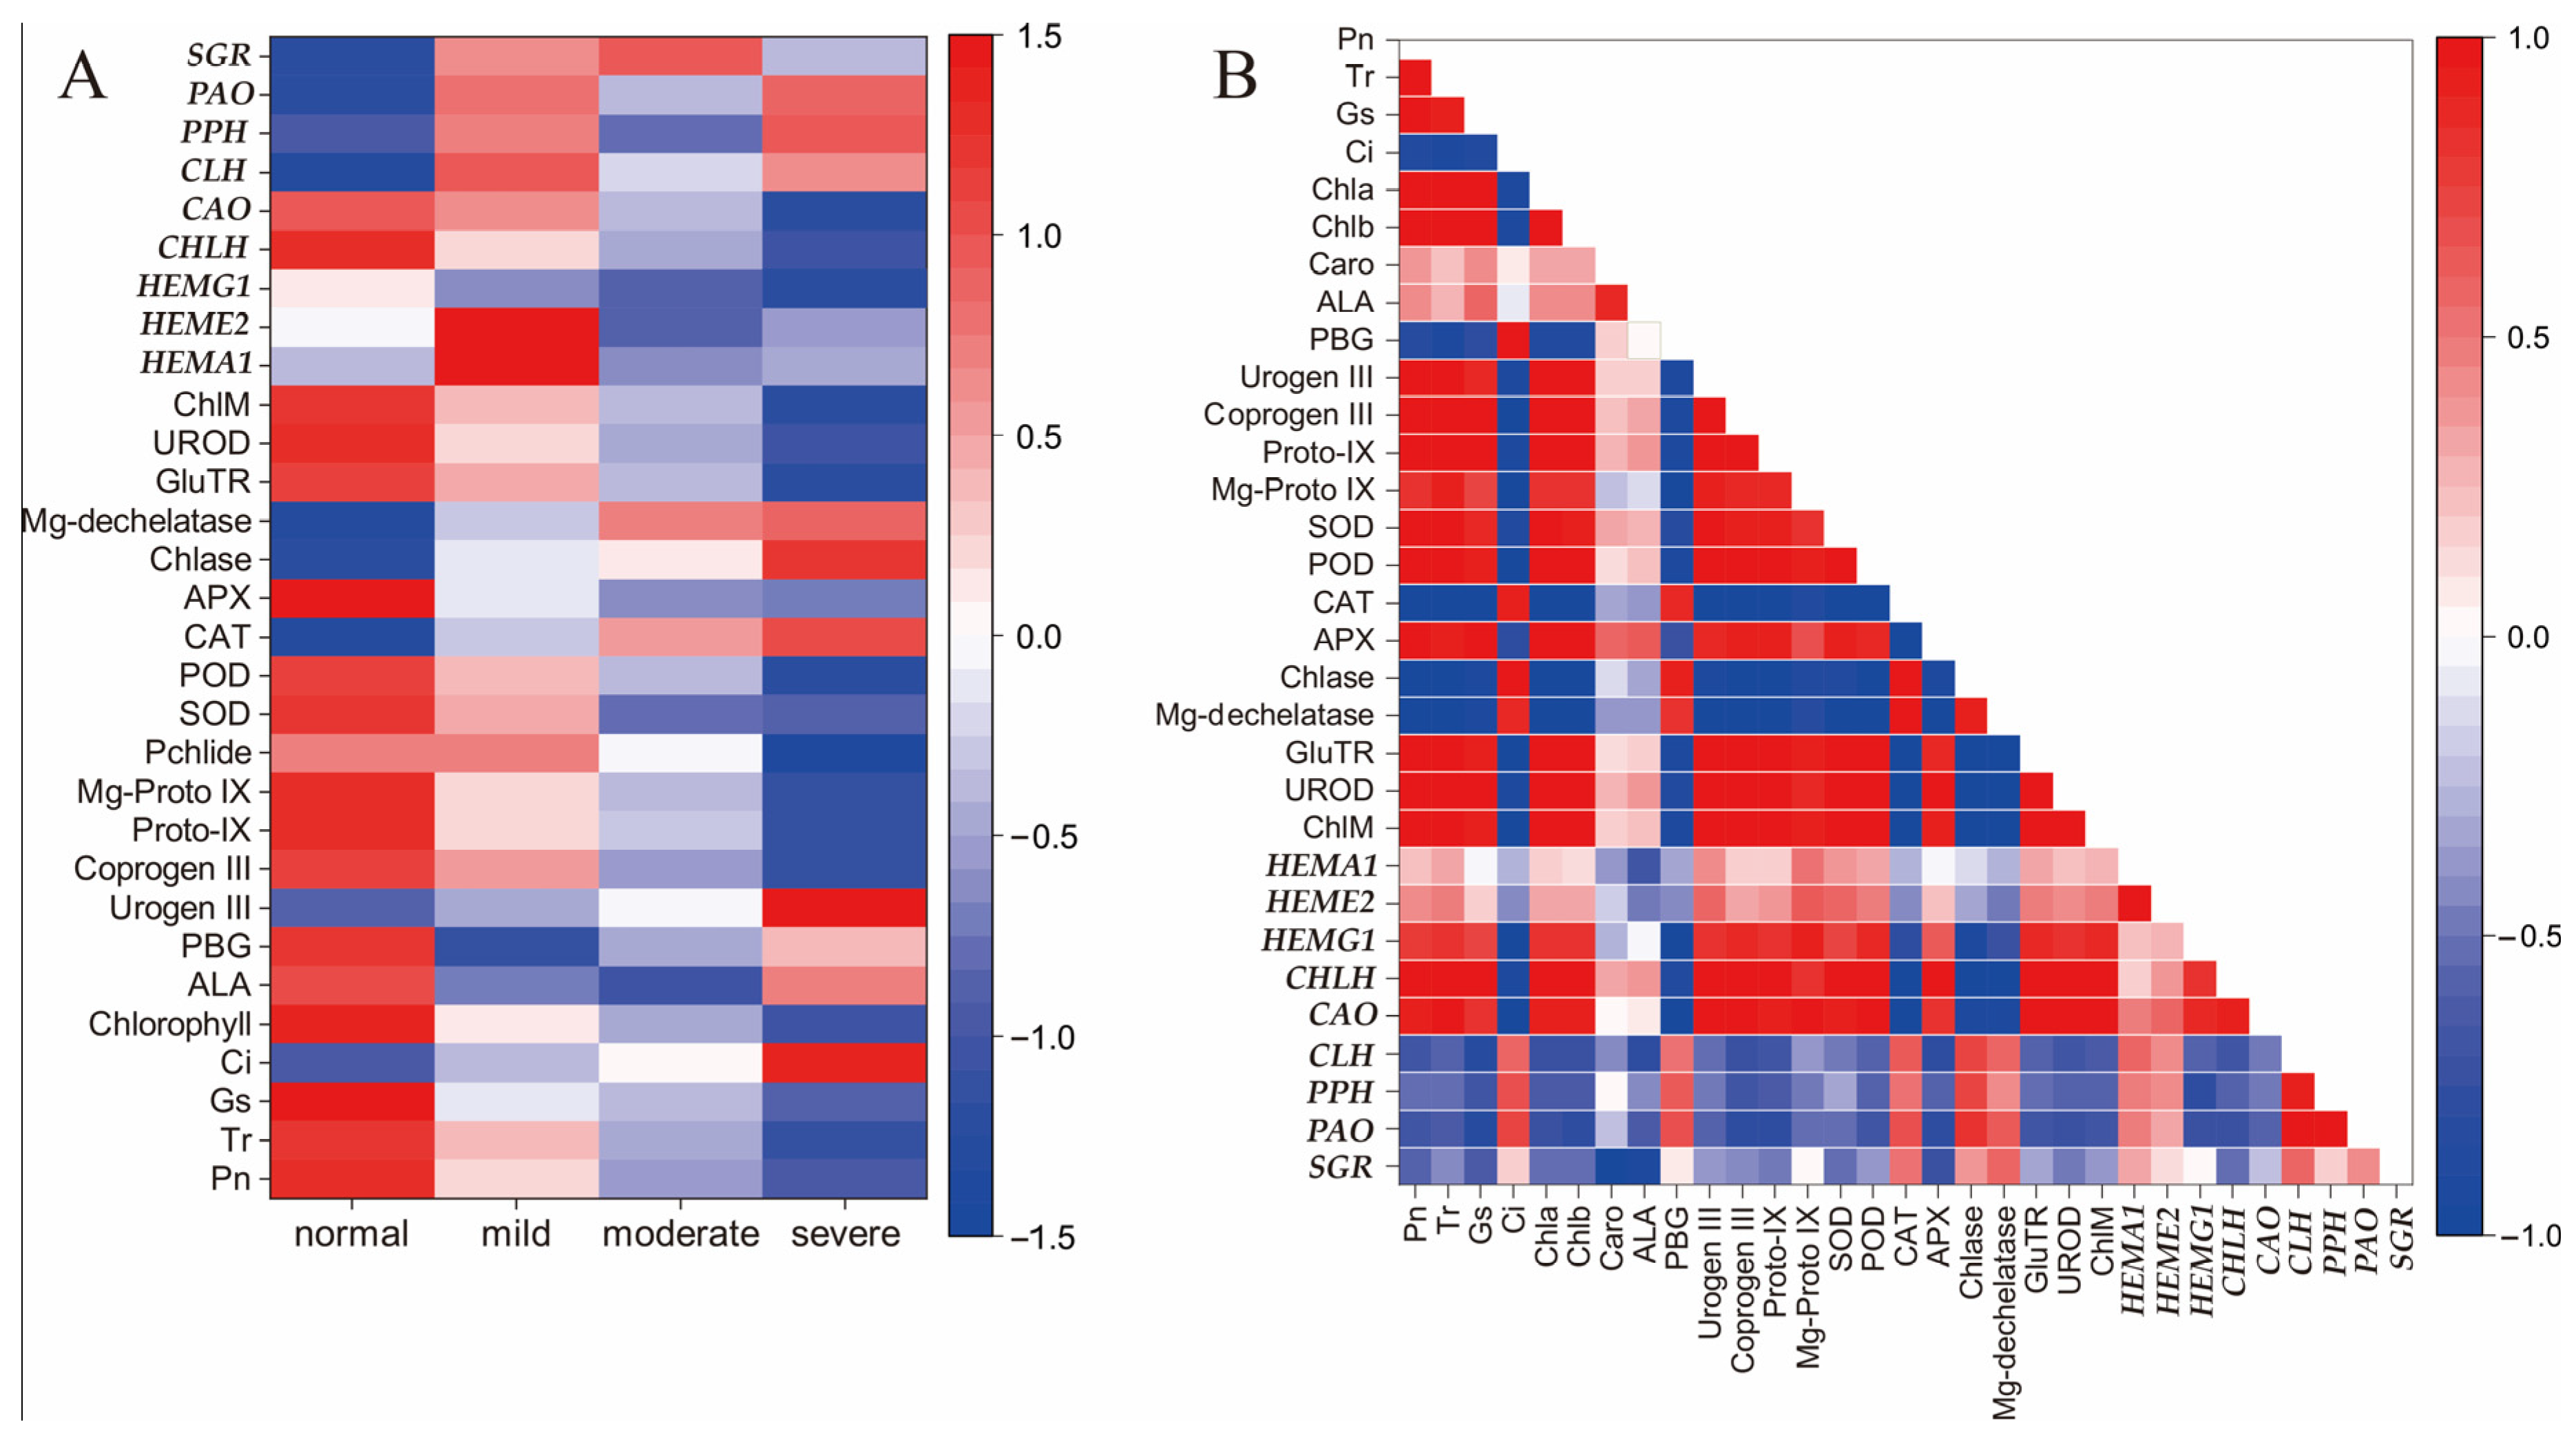
2.6. Correlation Analysis

According to the analysis, we observed both positive and negative correlations between the indicators (Figure 6). There were significant negative correlations between chlorosis index, photosynthesis and chlorophyll parameters (p ≤ 0.05). The expression of SGR, PAO, PPH and CLH was positively correlated with the chlorosis index, while HEMA1, HEME2 and HEMG1 had no significant correlation with the chlorosis index (Figure 6A). Notably, ALA and PBG content were significantly negatively correlated with the expression of SGR (p ≤ 0.05), but there was no significant correlation with other indicators (Figure 6B). The expression of key genes involved in chlorophyll catabolism (CLH, PPH, PAO and SGR) was negatively correlated with PBG, Coprogen III, Proto-IX, Mg-Proto IX and Pchlide content; however, a positive correlation was found between the expression of chlorophyll degradation genes (except SGR) and Urogen III content. Moreover, there was a positive correlation between the expression of chlorophyll catabolism genes and CAT activity, Chlase activity and Mg-dechelatase activity. The expression of key genes in chlorophyll catabolism was negatively correlated with the expression of chlorophyll synthesis genes (HEMA1, HEME2, HEMG1, CHLH and CAO), although not significantly.

3. Discussion

Before this experiment, we found that the soil in the sampling garden lacked Mg by measuring the content of mineral elements, which led to the chlorosis of leaves of Citrus cultivar (Harumi). Via the determination of other indicators of leaves in this experiment, a more comprehensive and in-depth exploration was conducted of the physiological mechanism of chlorosis of Harumi leaves.
As chlorosis increased, Pn, Tr and Gs showed a significant downward trend, while Ci showed a significant upward trend. It can be concluded that the fact that the photosynthetic capacity of leaves decreased and the photosynthetic rate decreased may have been caused by stomatal restriction or nonstomatal restriction factors. Ci decreasing and Ls increasing shows that the photosynthetic rate decreasing mainly comes from the stomatal limitation; Ci increasing and Ls decreasing indicates that nonstomatal limitation is the main cause [32,33]. In this experiment, Ci showed a significant increasing trend, but Ls still needed to be further studied to determine the reason for the decline in the photosynthetic rate in chlorotic leaves. Compared with normal leaves, chlorophyll content, carotenoid content and the chlorophyll/carotenoid ratio of chlorotic leaves showed a significant downward trend. This result indicated that leaf chlorosis was related to the content of the main photosynthetic pigments and the effect of chlorosis on chlorophyll content was greater than that of carotenoids. As the chlorophyll/carotenoid ratio decreased linearly, chlorophyll’s ability to cover the leaf color decreased, and the leaf became chlorotic to varying degrees [34]. Compared to other citrus varieties, chlorophyll b content in normal Harumi leaves was very low, which could be attributed to the species characteristics. We hypothesized that this might also have been one of the reasons why citrus leaves with a Ponkan (Citrus reticulata Blanco cv. Ponkan) genetic background were prone to chlorosis in autumn and spring. In addition, chlorophyll synthesis precursors in chlorotic leaves decreased significantly compared to normal leaves, except for Urogen III. It was speculated that the transformation pathway from Urogen III to coprogen III was blocked, which led to the abnormal blocking of the entire chlorophyll biosynthesis pathway.
In order to analyze the rules of key substances in chlorophyll metabolism, the activities of enzymes related to chlorophyll metabolism and the expression of related genes were further studied. The results showed that the activities of the chlorophyll synthesis enzymes GluTR, UROD and ChlM decreased significantly with the intensification of chlorosis, but the activities of the chlorophyll degradation enzymes Chlase and MDCase did not change significantly. At the same time, genes related to chlorophyll synthesis showed a nonlinear downward trend, while genes related to chlorophyll degradation showed a nonlinear upward trend. Therefore, we speculate that abnormal chlorophyll metabolism in chlorotic leaves is more likely to be related to blocking the chlorophyll synthesis pathway. In the chlorophyll synthesis pathway, the significant decrease in UROD activity and the decrease in HEME2 (a related regulatory gene) jointly hinder the transformation from Urogen III to Coprogen III, which may be an important reason for the blocking of the chlorophyll synthesis pathway [35,36]. The expression level of the stay-green gene (SGR) increased significantly in chlorotic leaves, which may be related to the irregular upward trend in PPH and PAO gene expression [37]. SGR is closely related to chlorophyll degradation and may promote chlorophyll degradation by activating multiple chlorophyll degrading enzymes and the phototrapping complex. The relative expression level of the SGR gene decreased suddenly in severely chlorotic leaves, and was only higher than that in normal leaves, indicating that the stay-green gene (SGR) was involved in the process of the chlorosis of Harumi leaves, and chlorosis promoted the degradation of chlorophyll in Harumi leaves to a certain extent, but excessive chlorosis would lead to a reduced expression level of the SGR gene, and the reasons for this need to be further explored.
Previous studies have shown that the relative relationship between Chlase activity and CAO gene expression is closely related to the transformation from chlorophyll a to chlorophyll b [38]. In this experiment, compared with normal leaves, Chlase enzyme activity in chlorotic leaves did not show an obvious upward trend, while CAO gene expression showed a certain downward trend. This result also confirmed previous speculation to some extent that the chlorosis Harumi plant was more likely to be caused by abnormal chlorophyll anabolism (Figure 7).
In order to maintain normal growth, plants often remove excess reactive oxygen species through the antioxidant enzyme system [39]. Plants will produce a large number of reactive oxygen species in the process of their own metabolism or under external stress. If they are not removed in time, they will have a serious toxic effect on plant growth and development, and affect plant signal transduction and cell membrane stability [40]. It has been reported that oxidative stress is induced to cause a dramatic decrease in photosynthetic pigments [33]. In this experiment, except for CAT, the activity of other antioxidant enzymes in chlorotic leaves showed a downward trend compared to those in normal leaves. POD and APX activity decreased significantly as chlorosis increased. Therefore, it is speculated that a decrease in POD and APX enzyme activities leads to a decrease in the antioxidant capacity of Harumi leaves, which may lead to the content of active oxygen species exceeding the normal level and reactive oxygen species destroying chlorophyll and affecting the formation of photosynthetic pigments, resulting in metabolic disorder and chlorosis of the leaves. Further measurements of oxygen reactive species concentration are needed to confirm this hypothesis. CAT activity did not change significantly in normal, mild and moderate chlorosis leaves, but increased significantly in severe chlorosis leaves. It may be that the membrane lipid peroxidation of heavily chlorotic leaves promoted the increase in CAT activity via negative feedback regulation [41].

4. Materials and Methods

4.1. Plant Material and Treatment

According to the classification standard of Xing [42], leaves were divided into normal, mild, moderate and severe chlorotic leaves (Figure 1A). We selected nine Citrus trees (Citrus reticulata × Citrus sinensis Harumi) that had been grafted for five years in a small plot with strong growth and were basically the same tree shape: three trees had one treatment, with three independent real repetitions. Leaves were sampled from the farm of Danling County, Meishan City, Sichuan Province (30°02′ N, 103°52′ E, altitude 527 m), where the soil organic matter content was 4.12%, and the pH was slightly acidic (pH = 6.6). We collected the samples at 9:00–12:00 in early April at a temperature of 18–22 °C and irradiance of 11,300–11,450 kj/m2. For each tree, 8 leaves with varying degrees of chlorosis and 8 normal leaves, which were from autumn shoots of the previous year, were collected from 4 directions in the east, south, west and north.
The collected leaves were grouped, placed in a foam box with dry ice and brought back to the laboratory. We performed the following treatments on all samples: wash tissue surface dirt with clean water and distilled water, wipe dry with paper towels, cut the leaves avoiding the main vein portion and mix thoroughly. Some leaves were used for the determination of photosynthetic pigments (chlorophyll a, chlorophyll b and carotenoid), and others were treated with liquid nitrogen and stored at −80 °C for the determination of antioxidant enzyme activity, chlorophyll precursor substance synthesis content, intermediate metabolites of chlorophyll degradation, enzyme activities of chlorophyll metabolism and key regulatory genes.

4.2. Determination of Photosynthetic Parameters

A total of 5–8 typical leaves with the same growth and similar illumination at the same leaf position for each chlorosis level (normal, mild, moderate and severe) between 9:30 and 11:00 on a clear day, avoiding the main vein, were selected and used for the determination of the photosynthetic index. Pn, Tr, Gs and Ci were monitored using a portable photosynthesis measuring instrument (LI-6400; Licor, Lincoln, NE, USA) (setting parameters: illumination 800 µmol·m−2·s−1, CO2 concentration 400 µmol·mol−1, temperature 25 °C, relative humidity 82 ± 0.5%).

4.3. Determination of Photosynthetic Pigments

The determination of photosynthetic pigment content was adopted and improved from the method of Arnon [43]. Fresh leaves were cut and mixed, 0.1 g was weighed and placed in a 10 mL centrifuge tube, 10 mL of 95% ethanol was added and extracted in the dark until the leaves were completely white (about 24 h), 95% ethanol was the blank control and OD values of 663 nm, 645 nm and 470 nm were measured using an enzyme calibration system (Thermo Fisher Scientific, multiskan go). We calculated chlorophyll a (Chl) (a), chlorophyll b (Chl b), carotenoid and total chlorophyll (T-Chl) content, respectively.
We calculated the concentration of each pigment in the leaves (mg·g−1) according to the following equations:
Chl a content = 12.21 × OD663 − 2.81 × OD645.
Chl b content = 20.13 × OD645 − 5.03 × OD663.
Caroteniod content = (1000 × OD474 − 3.27a − 104b)/229 (a and b indicate the content of Chl a and Chl b, respectively).
T-Chl content = Chl a + Chl b.

4.4. Determination of Chlorophyll Synthesis Precursor Substance Content

Plant δ-5-aminolevulinic acid (δ-ALA) ELISA Kit (catalog number: ZK-8135) and Plant Bilinogen (PBG) ELISA Kit (catalog number: ZK-7842) (Shanghai Zhen Ke Biological Technology Co., Ltd., Shanghai, China) were used to determine the content of ALA and PBG.
The method of measuring Urogen III and Coprogen III was taken from Yu et al. [44]. A 0.3 g leaf sample was weighed and the appropriate amount of liquid nitrogen was added and fully grinded, transferred to a centrifuge tube with 3 mL 0.067 M phosphate buffer (pH 6.8) and centrifuged at 12,000 rpm for 10 min; 1.5 mL of supernatant was taken and 75 μL of 1% Na2S2O3 was added, shaken vigorously, irradiated with strong illumination for 20 min, had its pH adjusted to 3.5 using glacial acetic acid and then was extracted with 3 mL of ether. The OD value of the water phase at 405.5 nm was measured after stratification. The content of Urogen III was calculated using the molar extinction coefficient (5.48 × 10⁵ mol−1·cm−1) of 405.5 nm. Then, the ether extract above was extracted using 1 mL 0.1 M HCl, and the salt phase OD value was determined at a wavelength of 399.5 nm. The Coprogen III content was calculated at 4.89 × 10⁵ mol−1·cm−1 (molar extinction coefficient 399.5 nm) with 3 biological repetitions.
The determination of Proto-IX, Mg-Proto IX and Pchlide content was performed as described by Liu et al. [45]. A 0.3 g leaf sample was weighed, appropriate liquid nitrogen was added to it and it was grinded; 10 mL extraction solutions were added (acetone/ammonia water = 9:1), homogenized thoroughly and then centrifuged at 12,000 rpm for 10 min. The OD of the supernatant was measured at 575 nm, 590 nm and 628 nm, respectively, with 3 biological repetitions. The content was calculated by the following equations:
Proto-IX content = 0.18016 × OD575 − 0.04036 × OD628 − 0.04515 × OD590.
Mg-Proto IX content = 0.06077 × OD590 − 0.01937 × OD575 − 0.003423 × OD628.
Pchlide content = 0.03563 × OD628 + 0.007225 × OD590 − 0.02955× OD575.

4.5. Determination of Antioxidant Enzyme Activity

SOD activity was measured as described by Heath et al. [46]. The guaiacol colorimetric method [47] was used to determine POD activity. The determination of CAT and APX activities was determined using ultraviolet spectrophotometry [48].

4.6. Determination of Enzyme Activity Related to Chlorophyll Synthesis

Plant Glu-tRNAs ELISA Kit (catalog number: ZK-8377), plant Magnesium protoporphyrin IX methyltransferase (ChlM) ELISA Kit (catalog number: ZK-8381) and plant uroporphyrinogen decarboxylase (UROD) ELISA Kit (catalog number: ZK-8383) (Shanghai Zhen Ke Biological Technology Co., Ltd., Shanghai, China) were used to extract enzymes and determine GluTR, UROD and ChlM activities.

4.7. Determination of the Chlase (Chlorophyllase) and Mg-Dechelatase Activity

4.7.1. Enzyme Extraction

The method described by Costa [49] was used for the extraction of Chlase and Mg-dechelatase. We took 1 g frozen leaves, grinded them into fine powder in liquid nitrogen and poured them into 3 mL of the following extraction buffer: 0.1 M sodium phosphate buffer (pH 6.0), 0.2% (v/v) Triton X-100, 30 g/L PVP, 1 mM phenyl methyl sulfonyl fluoride (PMSF) and 5 mM cysteine. The mixture was placed on a low temperature shaker at 4 °C for 1 h and then centrifuged at 9000× g for 20 min at 4 °C. The supernatant was crude enzyme extract.

4.7.2. Preparation of Substrates

The preparation of chlorophyll refers to the method of Harpaz-Saad [35], with a few modifications. To 10 g fresh leaves of Harumi, 20 mL of chilled (−20 °C) 80% acetone was added and extracted in the dark at 4 °C for 12 h. It was centrifuged at 10,000× g for 15 min at 4 °C, and then the supernatant was taken to determine its absorbance at 645 nm and 663 nm. Chl a (µg/mL) = 12.7A663–2.69A645; then, we diluted the supernatant to 60 μg/mL.

4.7.3. Chlorophyllase Activity

Chlase activity was measured via the method described by Suzuki et al. [50]. The reaction mixture contained 0.3 mL crude enzyme extract, 1 mL of phosphate buffer 0.1 M (pH 7.0) with 0.15% Triton X-100 and 0.3 mL acetone solution. We incubated the mixture at 40 °C for 60 min in the dark and stirred it frequently. After 60 min, 3 mL of acetone at 4 °C was added immediately to terminate the reaction, and 3 mL of hexane was added to extract the remaining Chl. The mixture was vigorously stirred until an emulsion formed, and then it was centrifuged at 9000× g for 2 min at 4 °C. Absorption was measured at 667 nm of the lower water layer to determine the chlase activity. The extinction coefficient was 76.79 mmol cm−1 [51].

4.7.4. Mg-Dechelatase Activity

Substrates were prepared from Chl as described by Suzuki et al. [50] and stored in the dark at −20 °C for standby. The Mg-dechelatase activity determination procedure was taken from Suzuki et al. [35]. The reaction system consisted of 50 mM Tris-Tricine buffers (pH 8.8), 10 μL substrate and 200 μL crude enzyme extract, with a total volume of 3 mL. We incubated the mixture at 37 °C for 30 min and determined the absorbance at 692 nm. An increase of 0.001 within 30 min was expressed as a unit of enzyme activity.

4.7.5. Detection of Related Gene Expression in Chlorophyll Metabolism Pathway

An RNAprep Pure Polysaccharide Polyphenol Plant Total RNA Extraction Kit (Tiangen Biotech, Beijing, China) was used to extract total RNA from the leaves, and the ReverTra Ace® qPCR RT Master Mix Kit was used to synthesize cDNA. We used qRT-PCR primers (Table 2), as described by Pillitteri et al. [52]. Primers were synthesized by Tsingke Biotechnology Co., Ltd. (Beijing, China). RT-qPCR was performed using a 2X M5 HiPer SYBR Premix EsTaq (Mei5 Biotechnology Co., Ltd.) and a CFX96 Real-Time PCR Detection System (Bio-Rad, Hercules, CA, USA) instrument.
First, the relevant gene sequence was found in Arabidopsis thaliana, and then the gene sequence was blasted in the Citrus Pan-genome to Breeding Database (http://citrus.hzau.edu.cn/index.php, accessed on 1 January 2023); then, primers were designed using Primer3 (http://bioinfo.ut.ee/primer3–0.4.0/, accessed on 12 January 2023) and synthesized by Sangon Biotech. The genes in the table are HEMA1, HEME2, HEMG1, CHLH, CAO, CLH, PPH, PAO, SGR and Actin. Primer 0.8 μL, ddH2O 7.6 μL, 2× M5 HiPer SYBR Premix EsTaq 10 μL and cDNA 1.6 μL formed the composition of the 20 μL reaction system. The quantitative PCR fluorescence reaction program was 95 °C predenaturation for 30 s, 95 °C denaturation for 5 s and 53 °C annealing for 30 s, and fluorescence signals were collected at 53 °C for 40 PCR amplification cycles. The internal reference gene was Actin (Citrus sinensis actin-7), and there were three technical replicates and three biological replicates for each sample. The 2−ΔΔCT method [53] was used to calculate the relative expression of the gene.

4.8. Correlation and Statistical Analysis

The data were analyzed using Duncan’s multiple range test with SPSS 26.0 at the p < 0.05 level of significance. Pearson correlation analysis was used to analyze the correlation between 32 indicators of photosynthesis and chlorophyll degradation. Graphical representation was drawn using Origin 2021.

5. Conclusions

This experiment investigated the differences in photosynthesis characteristics and chlorophyll metabolism in the leaves of Citrus cultivar (Harumi) with different degrees of chlorosis. The results showed that photosynthesis characteristics, chlorophyll metabolism and the leaf antioxidant enzyme system were correlated. Abnormal UROD activity and HEME2 gene expression played key roles in the chlorophyll synthesis pathway, which hindered the key pathway of transformation of Urogen III into Coprogen III and led to the inhibition of chlorophyll synthesis. At the same time, the combined action of MDCase activity and SGR gene expression might have caused excessive chlorophyll degradation to some extent. Abnormal chlorophyll metabolism led to a decrease in chlorophyll content, which eventually led to leaf chlorosis and affected the photosynthesis process. In addition, the decrease in antioxidant enzyme activity mainly caused by POD and APX led to a decrease in plant antioxidant capacity, and negatively promoted an increase in CAT content in severely chlorotic leaves, which led to leaf chlorosis and photosynthesis disorder.
In summary, the blocked transformation of Urogen III to Coprogen III, excessive chlorophyll degradation and the weakening of antioxidant enzyme system activity might have particularly important impacts on the chlorosis of Harumi leaves. Although the specific regulatory mechanism needs further study, we identified the key substances, enzymes and genes that may cause chlorosis, as well as possible abnormal chains. These data provided a basis for further follow-up studies, for example on the reason why the transformation from Urogen III to Coprogen III was blocked, methods to solve the chlorosis of Harumi leaves, the chlorosis mechanism of other citrus varieties and so on.

Author Contributions

Conceptualization, B.X. and L.L. (Ling Li); methodology, B.X.; software, L.L. (Ling Liao); validation, B.X., Z.W. and Q.L.; formal analysis, H.M.; investigation, L.W.; resources, Y.B.; data curation, X.Z.; writing—original draft preparation, B.X. and L.L. (Ling Li); writing—review and editing, Z.W.; visualization, X.W. and M.Z.; supervision, H.D. and G.S.; project administration, Z.W.; funding acquisition, Z.W. All authors have read and agreed to the published version of the manuscript.

Funding

This study was funded by the National Key R&D Program of China (2021YFD1600802-02) and the Science and Technology Department of Sichuan Province, China (2021ZHCG0084).

Institutional Review Board Statement

Not applicable.

Informed Consent Statement

Not applicable.

Data Availability Statement

Not applicable.

Conflicts of Interest

The authors declare no conflict of interest.

References

  1. Naseer, M.A.U.R.; Mehdi, M.; Ashfaq, M.; Hassan, S.; Abid, M. Effect of Marketing Channel Choice on the Profitability of Citrus Farmers: Evidence Form Punjab-Pakistan. Pak. J. Agric. Sci. 2019, 56, 1003–1011. [Google Scholar]
  2. Sun, L.; Nasrullah; Ke, F.; Nie, Z.; Wang, P.; Xu, J. Citrus Genetic Engineering for Disease Resistance: Past, Present and Future. Int. J. Mol. Sci. 2019, 20, 5256. [Google Scholar] [CrossRef] [PubMed]
  3. Lu, X.; Zhao, C.; Shi, H.; Liao, Y.; Xu, F.; Du, H.; Xiao, H.; Zheng, J. Nutrients and bioactives in citrus fruits: Different citrus varieties, fruit parts, and growth stages. Crit. Rev. Food Sci. Nutr. 2021, 63, 2018–2041. [Google Scholar] [CrossRef] [PubMed]
  4. Singh, B.; Singh, J.P.; Kaur, A.; Singh, N. Phenolic composition, antioxidant potential and health benefits of citrus peel. Food Res. Int. 2020, 132, 109114. [Google Scholar] [CrossRef] [PubMed]
  5. Takishita, F.; Nishikawa, F.; Matsumoto, H.; Kato, M. Fruit Thinning and Physiological Disorders in Citrus Variety ‘Harumi’. Rev. Agric. Sci. 2021, 9, 20–31. [Google Scholar] [CrossRef]
  6. Liao, L.; Li, Y.; Bi, X.; Xiong, B.; Wang, X.; Deng, H.; Zhang, M.; Sun, G.; Jin, Z.; Huang, Z.; et al. Transcriptome analysis of Harumi tangor fruits: Insights into interstock-mediated fruit quality. Front. Plant Sci. 2022, 13, 995913. [Google Scholar] [CrossRef] [PubMed]
  7. Gustafsson, Å. The Plastid Development in Various Types of Chlorophyll Mutations. Hereditas 1942, 28, 483–492. [Google Scholar] [CrossRef]
  8. Shalygo, N.; Czarnecki, O.; Peter, E.; Grimm, B. Expression of chlorophyll synthase is also involved in feedback-contro l of chlorophyll biosynthesis. Plant Mol. Biol. 2009, 71, 425–436. [Google Scholar] [CrossRef]
  9. Qiu, K.; Li, Z.; Yang, Z.; Chen, J.; Wu, S.; Zhu, X.; Gao, S.; Gao, J.; Ren, G.; Kuai, B.; et al. EIN3 and ORE1 Accelerate Degreening during Ethylene-Mediated Leaf Sene scence by Directly Activating Chlorophyll Catabolic Genes in Arabidops is. PLoS Genet. 2015, 11, e1005399. [Google Scholar] [CrossRef]
  10. Sandhu, D.; Coleman, Z.; Atkinson, T.; Rai, K.M.; Mendu, V. Genetics and Physiology of the Nuclearly Inherited Yellow Foliar Mutan ts in Soybean. Front. Plant Sci. 2018, 9, 471. [Google Scholar] [CrossRef]
  11. Khan, I.; Zada, A.; Jia, T.; Hu, X. Effect of the Enhanced Production of Chlorophyll b on the Light Acclimation of Tomato. Int. J. Mol. Sci. 2023, 24, 3377. [Google Scholar] [CrossRef] [PubMed]
  12. Hu, X.; Gu, T.; Khan, I.; Zada, A.; Jia, T. Research Progress in the Interconversion, Turnover and Degradation of Chlorophyll. Cells 2021, 10, 3134. [Google Scholar] [CrossRef] [PubMed]
  13. Kasahara, M.; Kagawa, T.; Oikawa, K.; Suetsugu, N.; Miyao, M.; Wada, M. Chloroplast avoidance movement reduces photodamage in plants. Nature 2002, 420, 829–832. [Google Scholar] [CrossRef] [PubMed]
  14. Rissler, H.M.; Durnford, D.G. Isolation of a novel carotenoid-rich protein in Cyanophora paradoxa that is immunologically related to the light-harvesting complexes of photosynthetic eukaryotes. Plant Cell Physiol. 2005, 46, 416–424. [Google Scholar] [CrossRef]
  15. Tanaka, R.; Tanaka, A. Chlorophyll cycle regulates the construction and destruction of the light-harvesting complexes. Biochim. Et Biophys. Acta-Bioenerg. 2011, 1807, 968–976. [Google Scholar] [CrossRef]
  16. Hortensteiner, S. Update on the biochemistry of chlorophyll breakdown. Plant Mol. Biol. 2013, 82, 505–517. [Google Scholar] [CrossRef] [PubMed]
  17. op den Camp, R.G.; Przybyla, D.; Ochsenbein, C.; Laloi, C.; Kim, C.; Danon, A.; Wagner, D.; Hideg, E.; Gobel, C.; Feussner, I.; et al. Rapid induction of distinct stress responses after the release of singlet oxygen in Arabidopsis. Plant Cell 2003, 15, 2320–2332. [Google Scholar] [CrossRef]
  18. Mur, L.A.; Aubry, S.; Mondhe, M.; Kingston-Smith, A.; Gallagher, J.; Timms-Taravella, E.; James, C.; Papp, I.; Hortensteiner, S.; Thomas, H.; et al. Accumulation of chlorophyll catabolites photosensitizes the hypersensitive response elicited by Pseudomonas syringae in Arabidopsis. New Phytol. 2010, 188, 161–174. [Google Scholar] [CrossRef] [PubMed]
  19. Hauenstein, M.; Hortensteiner, S.; Aubry, S. Side-chain modifications of phyllobilins may not be essential for chlorophyll degradation in Arabidopsis. Plant Direct 2022, 6, e441. [Google Scholar] [CrossRef]
  20. Yamatani, H.; Ito, T.; Nishimura, K.; Yamada, T.; Sakamoto, W.; Kusaba, M. Genetic analysis of chlorophyll synthesis and degradation regulated by BALANCE of CHLOROPHYLL METABOLISM. Plant Physiol. 2022, 189, 419–432. [Google Scholar] [CrossRef]
  21. Schumacher, I.; Menghini, D.; Ovinnikov, S.; Hauenstein, M.; Fankhauser, N.; Zipfel, C.; Hortensteiner, S.; Aubry, S. Evolution of chlorophyll degradation is associated with plant transition to land. Plant J. 2022, 109, 1473–1488. [Google Scholar] [CrossRef] [PubMed]
  22. Cheng, M.; Meng, F.; Mo, F.; Qi, H.; Wang, P.; Chen, X.; Liu, J.; Ghanizadeh, H.; Zhang, H.; Wang, A. Slym1 control the color etiolation of leaves by facilitating the decomposition of chlorophyll in tomato. Plant Sci. 2022, 324, 111457. [Google Scholar] [CrossRef] [PubMed]
  23. Sato, Y.; Morita, R.; Nishimura, M.; Yamaguchi, H.; Kusaba, M. Mendel’s green cotyledon gene encodes a positive regulator of the chlorophyll-degrading pathway. Proc. Natl. Acad. Sci. USA 2007, 104, 14169–14174. [Google Scholar] [CrossRef] [PubMed]
  24. Bell, A.; Moreau, C.; Chinoy, C.; Spanner, R.; Dalmais, M.; Le Signor, C.; Bendahmane, A.; Klenell, M.; Domoney, C. SGRL can regulate chlorophyll metabolism and contributes to normal plant growth and development in Pisum sativum L. Plant Mol. Biol. 2015, 89, 539–558. [Google Scholar] [CrossRef] [PubMed]
  25. Rojas, M.; Yu, Q.; Williams-Carrier, R.; Maliga, P.; Barkan, A. Engineered PPR proteins as inducible switches to activate the expression of chloroplast transgenes. Nat. Plants 2019, 5, 505–511. [Google Scholar] [CrossRef]
  26. Armarego-Marriott, T.; Sandoval-Ibanez, O.; Kowalewska, L. Beyond the darkness: Recent lessons from etiolation and de- etiolation studies. J. Exp. Bot. 2020, 71, 1215–1225. [Google Scholar] [CrossRef]
  27. Hirashima, M.; Tanaka, R.; Tanaka, A. Light-independent cell death induced by accumulation of pheophorbide a in Arabidopsis thaliana. Plant Cell Physiol. 2009, 50, 719–729. [Google Scholar] [CrossRef]
  28. Wuthrich, K.L.; Bovet, L.; Hunziker, P.E.; Donnison, I.S.; Hortensteiner, S. Molecular cloning, functional expression and characterisation of RCC reductase involved in chlorophyll catabolism. Plant J. 2000, 21, 189–198. [Google Scholar] [CrossRef]
  29. Hortensteiner, S.; Krautler, B. Chlorophyll breakdown in higher plants. Biochim. Biophys. Acta 2011, 1807, 977–988. [Google Scholar] [CrossRef]
  30. Yamasato, A.; Nagata, N.; Tanaka, R.; Tanaka, A. The N-terminal domain of chlorophyllide a oxygenase confers protein instability in response to chlorophyll B accumulation in Arabidopsis. Plant Cell 2005, 17, 1585–1597. [Google Scholar] [CrossRef]
  31. Collignon, L.N.; Normand, C.B. Photobiology: Principles, Applications, and Effects; Nova Science Publishers, Inc.: New York, NY, USA, 2011. [Google Scholar]
  32. Zeiger, E.; Field, C. Photocontrol of the Functional Coupling between Photosynthesis and Stomatal Conductance in the Intact Leaf: Blue Light and Par-Dependent Photosystems in Guard Cells. Plant Physiol. 1982, 70, 370–375. [Google Scholar] [CrossRef] [PubMed]
  33. Lu, F.; Hu, P.; Lin, M.; Ye, X.; Chen, L.; Huang, Z. Photosynthetic Characteristics and Chloroplast Ultrastructure Responses of Citrus Leaves to Copper Toxicity Induced by Bordeaux Mixture in Greenhouse. Int. J. Mol. Sci. 2022, 23, 9835. [Google Scholar] [CrossRef] [PubMed]
  34. Adams Iii, W.; Demmig-Adams, B.; Garab, G.; Govindjee. Non-Photochemical Quenching and Energy Dissipation in Plants, Algae and Cyanobacteria. In Advances in Photosynthesis and Respiration, Including Bioenergy and Related Processes, 1st ed.; Springer: Dordrecht, The Netherlands, 2014. [Google Scholar]
  35. Harpaz-Saad, S.; Azoulay, T.; Arazi, T.; Ben-Yaakov, E.; Mett, A.; Shiboleth, Y.M.; Hörtensteiner, S.; Gidoni, D.; Gal-On, A.; Goldschmidt, E.E.; et al. Chlorophyllase is a rate-limiting enzyme in chlorophyll catabolism and is posttranslationally regulated. Plant Cell 2007, 19, 1007–1022. [Google Scholar] [CrossRef] [PubMed]
  36. Lv, J.; Zhang, M.; Bai, L.; Han, X.; Ge, Y.; Wang, W.; Li, J. Effects of 1-methylcyclopropene (1-MCP) on the expression of genes involved in the chlorophyll degradation pathway of apple fruit during storage. Food Chem. 2020, 308, 125707. [Google Scholar] [CrossRef] [PubMed]
  37. Tu, M.Y.; Wu, Y.Y.; Li, J.; Chen, D.; Jiang, G.L.; Song, H.Y.; Yin, X.R.; Liu, X.F.; Li, M.Z.; Sun, S.X. Transcriptome analysis reveals the roles of chlorophyll a/b-binding proteins (CABs) and stay-green (SGR) in chlorophyll degradation during fruit development in kiwifruit. N. Z. J. Crop Hortic. Sci. 2021, 49, 106–126. [Google Scholar] [CrossRef]
  38. Duncan, J.; Bibby, T.; Tanaka, A.; Barber, J. Exploring the ability of chlorophyll b to bind to the CP43′ protein induced under iron deprivation in a mutant of Synechocystis PCC 6803 containing the cao gene. FEBS Lett. 2003, 541, 171–175. [Google Scholar] [CrossRef]
  39. Corpas, F.J.; Gupta, D.K.; Palma, J.M. Antioxidants and Antioxidant Enzymes in Higher Plants, 1st ed.; Springer International Publishing: Cham, Switzerland, 2018. [Google Scholar]
  40. Khan, M.I.R.; Khan, N.A. Reactive Oxygen Species and Antioxidant Systems in Plants: Role and Regulation under Abiotic Stress, 1st ed.; Springer: Singapore, 2017. [Google Scholar]
  41. Kyungwon, M.; Bing, L.; Sang-Ryong, L.; Rajeev, A. Supplemental calcium improves freezing tolerance of spinach (Spinacia oleracea L.) by mitigating membrane and photosynthetic damage, and bolstering anti-oxidant and cell-wall status. Sci. Hortic. 2021, 288, 110212. [Google Scholar]
  42. Xing, F.; Fu, X.-z.; Wang, N.-q.; Xi, J.-l.; Huang, Y.; Zhou, W.; Ling, L.-l.; Peng, L.-z. Physiological changes and expression characteristics of ZIP family genes under zinc deficiency in navel orange (Citrus sinensis). J. Integr. Agric. 2016, 15, 803–811. [Google Scholar] [CrossRef]
  43. Arnon, D.I. Copper Enzymes in Isolated Chloroplasts. Polyphenoloxidase in Beta Vulgaris. Plant Physiol. 1949, 24, 1–15. [Google Scholar] [CrossRef]
  44. Yu, X.; Hu, S.; He, C.; Zhou, J.; Qu, F.; Ai, Z.; Chen, Y.; Ni, D. Chlorophyll Metabolism in Postharvest Tea (Camellia sinensis L.) Leaves: Variations in Color Values, Chlorophyll Derivatives, and Gene Expression Levels under Different Withering Treatments. J. Agric. Food Chem. 2019, 67, 10624–10636. [Google Scholar] [CrossRef]
  45. Liu, J.; Wang, J.; Yao, X.; Zhang, Y.; Li, J.; Wang, X.; Xu, Z.; Chen, W. Characterization and fine mapping of thermo-sensitive chlorophyll deficit mutant1 in rice (Oryza sativa L.). Breed. Sci. 2015, 65, 161–169. [Google Scholar] [CrossRef] [PubMed]
  46. Heath, R.L.; Packer, L. Photoperoxidation in Isolated Chloroplasts I. Kinetics and Stoichiometry of Fatty Acid Peroxidation. Arch. Biochem. Biophys. 2022, 726, 109248. [Google Scholar] [CrossRef] [PubMed]
  47. Sosa Alderete, L.G.; Ronchi, H.; Monjes, N.M.; Agostini, E. Tobacco hairy root’s peroxidases are rhythmically controlled by phenol exposure. Enzym. Microb. Technol. 2021, 149, 109856. [Google Scholar] [CrossRef] [PubMed]
  48. An, Y.; Shen, Y.-b.; Zhang, Z.-x. Effects of mechanical damage and herbivore wounding on H2O2 metabolism and antioxidant enzyme activities in hybrid poplar leaves. J. For. Res. 2009, 20, 156–160. [Google Scholar] [CrossRef]
  49. Costa, M.L.; Civello, P.M.; Chaves, A.R.; Martínez, G.A. Effect of ethephon and 6-benzylaminopurine on chlorophyll degrading enzymes and a peroxidase-linked chlorophyll bleaching during post-harvest senescence of broccoli (Brassica oleracea L.) at 20 °C. Postharvest Biol. Technol. 2005, 35, 191–199. [Google Scholar] [CrossRef]
  50. Suzuki, T.; Kunieda, T.; Murai, F.; Morioka, S.; Shioi, Y. Mg-dechelation activity in radish cotyledons with artificial and native substrates, Mg-chlorophyllin a and chlorophyllide a. Plant Physiol. Biochem. 2005, 43, 459–464. [Google Scholar] [CrossRef]
  51. Arkus, K.A.; Cahoon, E.B.; Jez, J.M. Mechanistic analysis of wheat chlorophyllase. Arch. Biochem. Biophys. 2005, 438, 146–155. [Google Scholar] [CrossRef]
  52. Pillitteri, L.J.; Lovatt, C.J.; Walling, L.L. Isolation and Characterization of LEAFY and APETALA1 Homologues from Citrus sinensis L. Osbeck ‘Washington’. J. Am. Soc. Hortic. Sci. 2004, 129, 845–856. [Google Scholar] [CrossRef]
  53. Livak, K.J.; Schmittgen, T.D. Analysis of relative gene expression data using real-time quantitative PCR and the 2(-Delta Delta C(T)) Method. Methods 2001, 25, 402–408. [Google Scholar] [CrossRef]
Figure 1. Leaves were in different degrees of chlorosis (A) and the effect of different degrees of chlorosis on photosynthetic pigments (B) and photosynthetic parameters (C). Values are shown as mean ± SD (n = 3). Different letters above the bar chart indicate significant differences between different treatments (p < 0.05). FW, fresh weight. SD, standard deviation.
Ijms 24 08394 g001
Figure 2. Effect of different degrees of chlorosis on the precursor of chlorophyll synthesis. ALA and PBG (A), Urogen III and coprogen III (B), Proto IX and Mg-Proto IX (C). Values are shown as mean ± SD (n = 3). Different letters above the bar chart indicate significant differences between different treatments (p < 0.05).
Ijms 24 08394 g002
Figure 3. Effect of different degrees of chlorosis on GluTR, UROD and ChlM activity (A), chlorophyllase activity (B) and Mg-dechelatase activity (C). Values are shown as mean ± SD (n = 3). Different letters above the bar chart indicate significant differences between different treatments (p < 0.05). Chlase—chlorophyllase. MDCase—Mg-dechelatase. SD—standard deviation.
Ijms 24 08394 g003
Figure 4. Effect of different degrees of chlorosis on the expression of HEMA1, HEME2, HEMG1, CHLH, CAO, CLH, PPH, PAO and SGR. Values are shown as mean ± SD (n = 3). Different letters above the bar chart indicate significant differences between different treatments (p < 0.05). SD, standard deviation.
Ijms 24 08394 g004
Figure 5. Effect of different degrees of chlorosis on SOD activity (A), POD activity (B), CAT activity (C) and APX activity (D). Values are shown as mean ± SD (n = 3). Different letters above the bar chart indicate significant differences between different treatments (p < 0.05). SD, standard deviation.
Ijms 24 08394 g005
Figure 6. Correlation between indicators and different degrees of leaf chlorosis (A), and correlations between photosynthesis and chlorophyll metabolism indicators in leaf chlorosis (B). The positive correlation between indicators is indicated by red, and the negative correlation between indicators is indicated by blue.
Ijms 24 08394 g006
Figure 7. Leaf chlorosis regulatory network for chlorophyll synthesis and degradation, photosynthetic gas exchange parameters and antioxidant enzyme system in Harumi.
Ijms 24 08394 g007
Table 1. Determination coefficients between chlorophyll pigments and photosynthesis parameters.
Correlation CoefficientsPnTrGsCi
Chl a0.98980.96810.94560.8462
Chl b0.98060.95570.95630.8479
Carotenoid0.98000.92580.98060.7800
T-Chl0.98560.95860.95580.8402
Table 2. Primer sequences used for gene expression analysis.
Gene NameAccession NumberLengthForward (5′–3′)Reverse (5′–3′)
HEMA1XM_006472322136GTCTTCACCAGCACAGCATCTGACACAAGAGCCCACATTACGAGGAA
HEME2XM_00648614762CTGTAGCGGAACCGAAAAATG TCCTCGAACAGCTTTCAGCAA
HEMG1XM_006444561162TTCTGTAGATGCTGCCGGTGAATGTTTCCACCCCTTGGCT
CHLHXM_00648992589GTGGCGACCCTATCAGGAACTGCTGCTGTGGTGGGAATAG
CAOXM_00647272357TCGCATCCAATGCCCATATTTCTCGCATTTCCCATCTGTT
CLHXM_00644393262GAAACGAATCGAGGGATCCACTTCAGAAACGCCACCACAA
PPHXM_00648287761GATGCAGGTAGTTTCCCAAAAGAGCAAGCCCGGAATTAAAACC
PAOXM_00648793360AAGCAAGAATTTGTCTCCACTACGATCTGATGCTGCAGGGTCTGA
SGRXM_006477286167CAAGGTCATCTCATCAAGGAGATTCTACTCCGTTCTTACAAG
ActinXM_006464503195CATCCCTCAGCACCTTCCCCAACCTTAGCACTTCTCC
Disclaimer/Publisher’s Note: The statements, opinions and data contained in all publications are solely those of the individual author(s) and contributor(s) and not of MDPI and/or the editor(s). MDPI and/or the editor(s) disclaim responsibility for any injury to people or property resulting from any ideas, methods, instructions or products referred to in the content.

