1. Introduction
Inflammation is a biological defense response that protects the host from various stimuli, such as invading infectious microorganisms—bacteria and viruses, physical stimuli—burns and frostbite, and ultraviolet light [
1].
In mammals, there are two types of inflammation: acute and chronic [
2,
3]. Acute inflammation is short-lived and disappears when the role of the inflammatory response is over. However, if that acute inflammation persists or the substances that promote inflammation are not removed, it can become chronic. Chronic inflammation is not a specific disease but a mechanistic process that can lead to long-term tissue destruction and functional impairment. It is a crucial factor causing almost all potentially disabling or life-threatening illnesses, including cardiovascular diseases, diabetes, cancer, arthritis, neurological diseases, and bowel diseases. Therefore, it is essential to prevent chronic inflammation to reduce the risk of chronic diseases and improve quality of life.
The most conventional drugs used for managing chronic inflammation include over-the-counter nonsteroidal anti-inflammatory drugs (NSAIDs) and prescribed drugs—corticosteroids, statins, etc. However, gastrointestinal, cardiovascular, hepatic, renal, brain, and pulmonary side effects of NSAIDs and steroids are well-known [
4,
5]. Therefore, in recent years, much attention has been devoted to exploring anti-inflammatory natural products and dietary supplements with fewer side effects that may remove inflammation triggers and alleviate inflammation-induced chronic diseases [
6,
7].
Recently, algae have been reported to produce a variety of compounds, such as polysaccharides, lipids, proteins, and pigments [
8]. Algae are photosynthetic organisms that grow in various habitats, including lakes, rivers, and sewage systems. Large algae (seaweeds) and microalgae (single cells) are the two main categories of algae. It is also worth mentioning that algae can be mass-produced. Moreover, they can withstand a wide range of temperatures, salinities, and pH levels [
8]. Because of these characteristics, algae have the potential to be a valuable natural resource for novel bioactive compounds.
Several bioactivities have been found in many species of algae. For example, the
Aurantiochytrium mangrovei 18W-13a and
Aurantiochytrium limacinum 4W-1b contain several bioactive substances, such as squalene, and have anti-inflammatory properties [
9,
10]. In addition, carotenoids from
Haematococcus pluvialis and
Dunaliella salina, and hydrocarbons from
Chlorella vulgaris and
Phaeodactylum tricornutum, have been reported to have anti-inflammatory properties [
11,
12,
13,
14].
Botryococcus, a type of freshwater green microalgae, can accumulate large amounts of hydrocarbons. While its potential as a petroleum substitute is garnering attention, it has also been discovered to be beneficial as a useful bioresource. Recently, microalgal extract from the green algae,
Botryococcus braunii, has been shown to promote neurogenesis in mice by stimulating energy production, exerting anti-stress and anti-depressant effects, and suppressing neuroinflammation. [
15].
Botryococcus terribilis (BT), a recently identified
Botryococcus strain, is one of the most common species in Cuba and southern Spain, with a tropical distribution [
16]. HPLC analysis of the BT extract identified two major compounds: methylated-meijicoccene, a new molecule, and C32 botryococcene, a triterpene [
17]. In BT extract, methylated-meijicoccene is present abundantly at 42.7%. Our earlier studies have shown that BT and its components may promote hair growth [
17] and exhibit antidepressant-like properties [
18]. However, its comprehensive bioactive potential remains to be explored.
In this present study, we investigated the anti-inflammatory effects of ethanol extract of BT (BTEE) in lipopolysaccharide (LPS)-stimulated RAW264 cells, a macrophage-like cell, originating from Abelson leukemia virus-transformed cell line derived from BALB/c mice [
19]. RAW264 cells exhibit a reasonably stable, mature, and adherent macrophage phenotype, a high proliferation rate, and maintain functional characteristics such as nitric oxide (NO) production in response to LPS stimulation for up to 30 successive passages [
20]. Therefore, RAW 264 cells have been widely used for preliminary screening of natural products with anti-inflammatory activities and to predict their prospective effect in vivo or on primary cells. We further performed an untargeted whole-genome transcriptomic analysis on BTEE-treated and LPS-stimulated RAW264 cells for the prediction of the interaction of BTEE on possible molecular targets and biological pathways.
2. Results
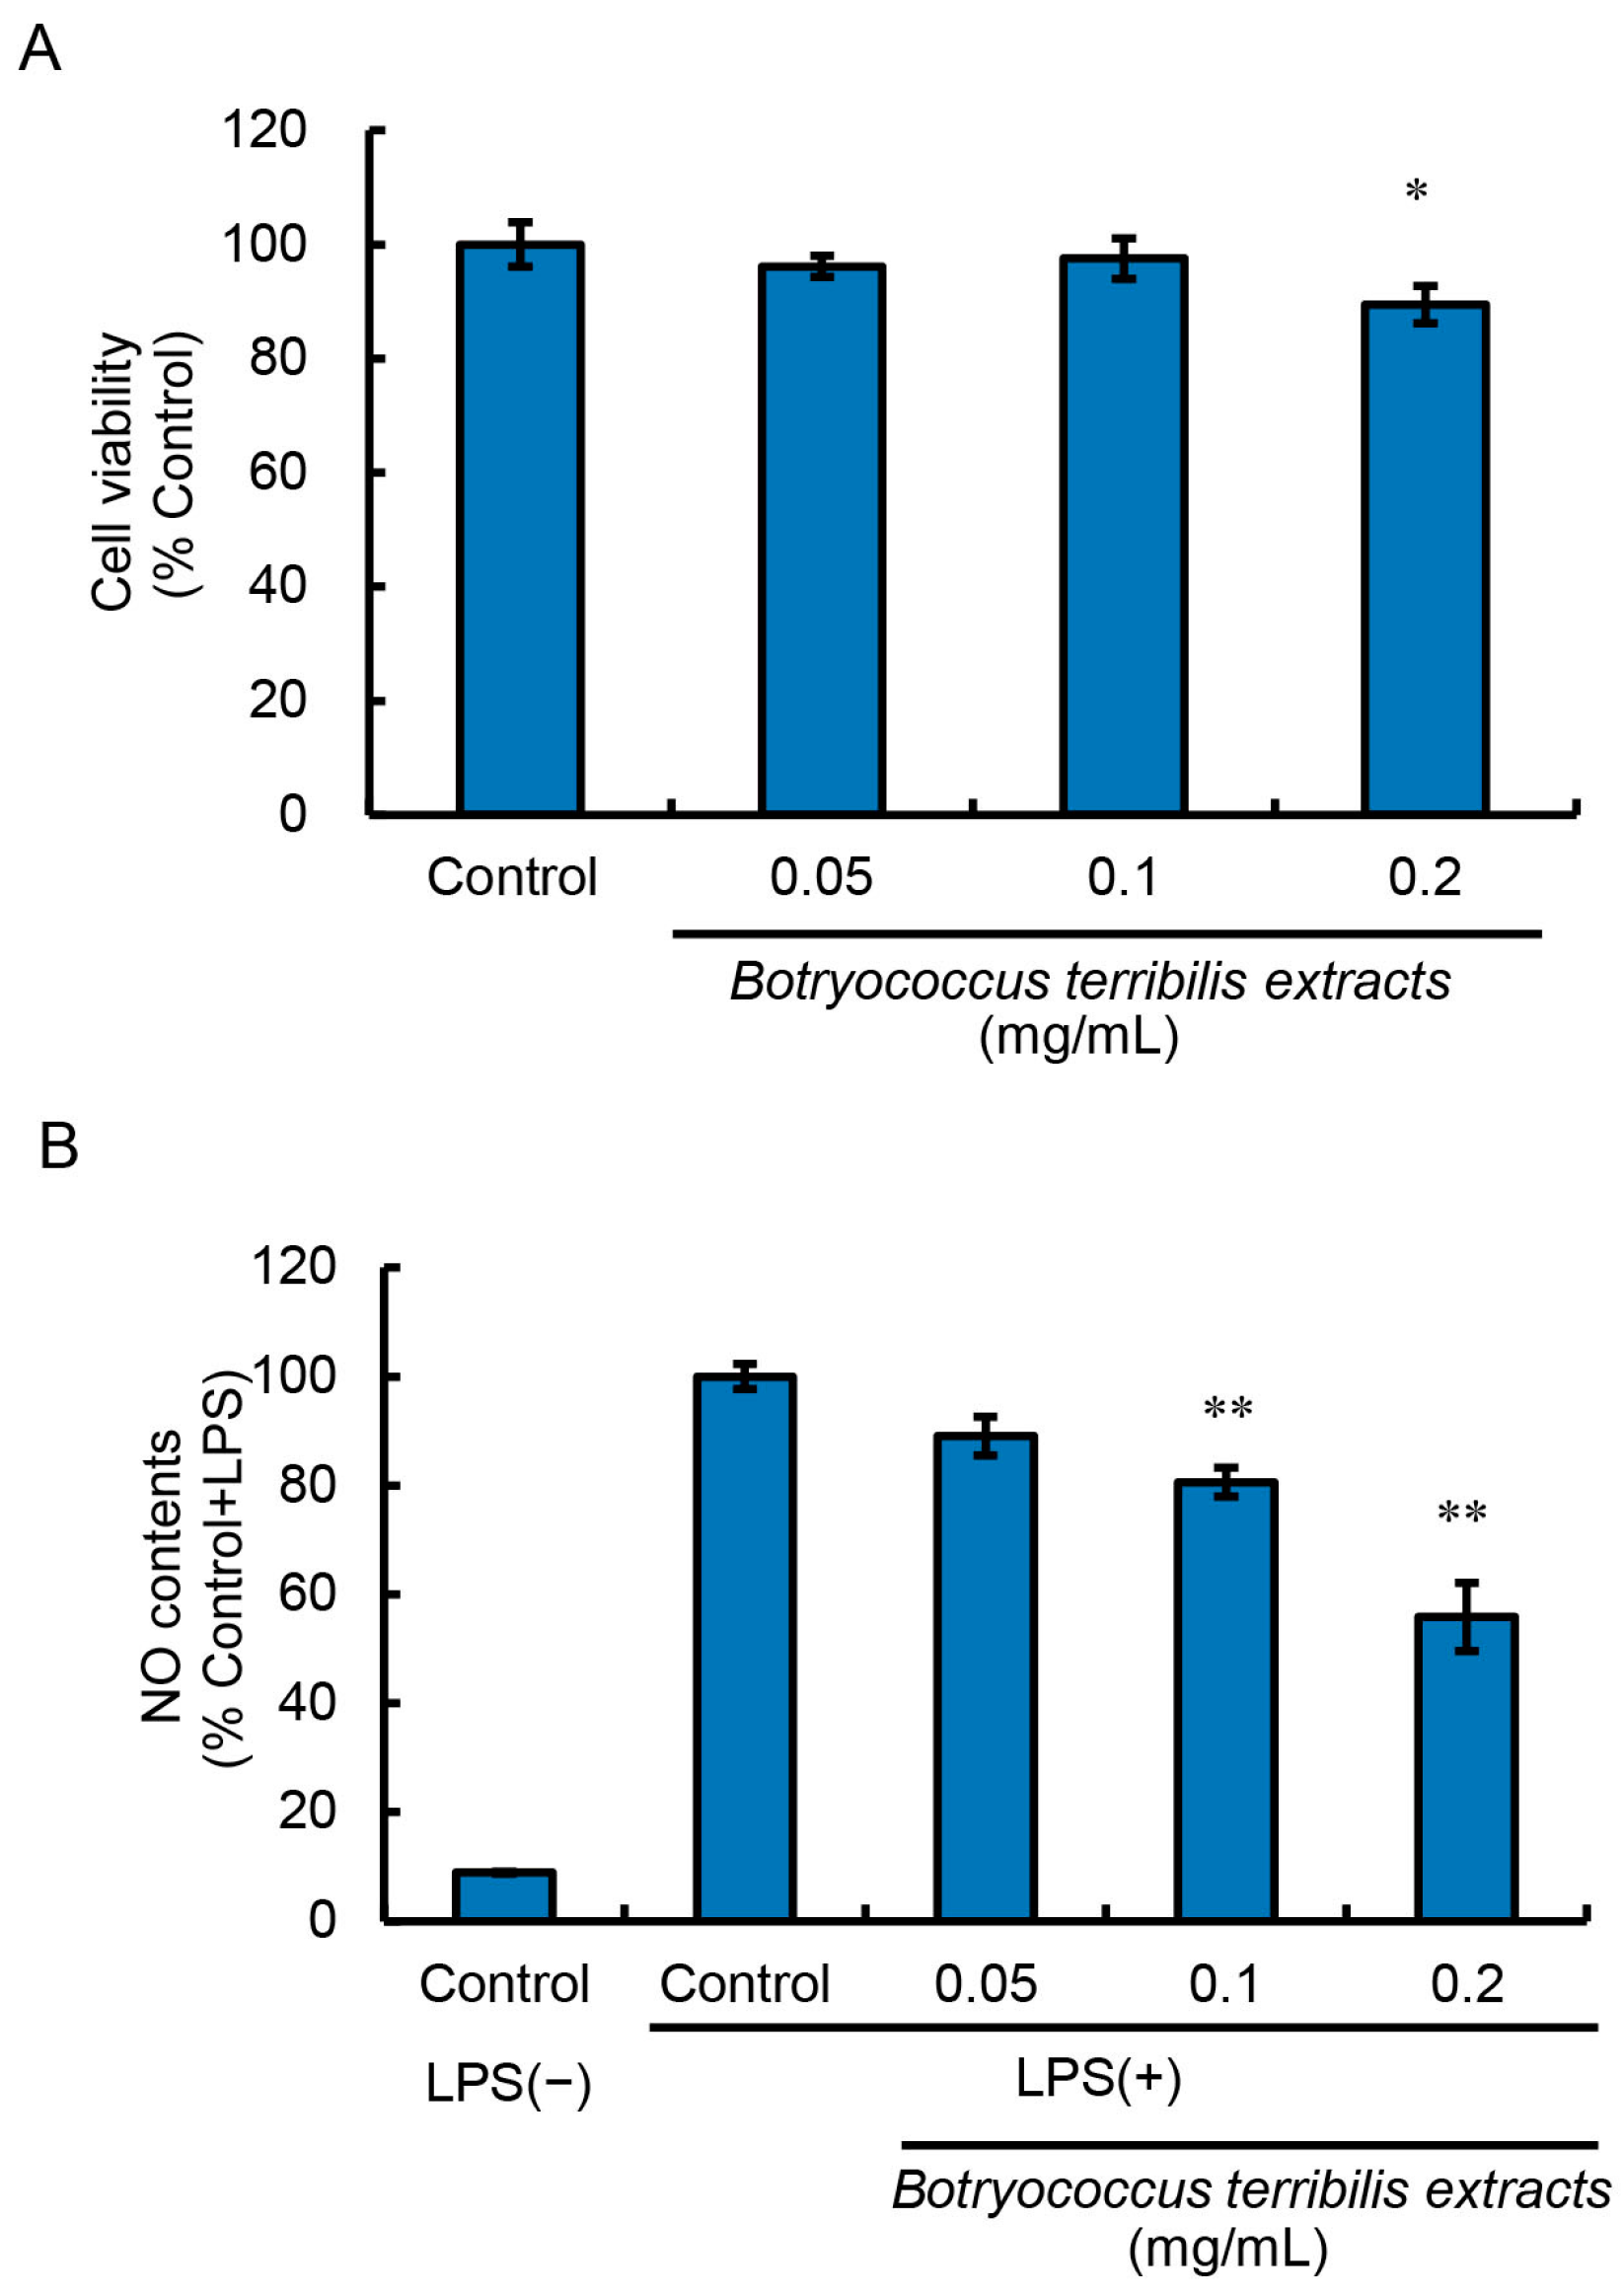
2.1. Cytotoxic Effect of BTEE on RAW264 Cells
RAW264 cells were treated with BTEE diluted at 1/2000 (0.05 mg/mL), 1/1000 (0.1 mg/mL), and 1/500 (0.2 mg/mL). The cytotoxicity of BTEE was evaluated using the MTT assay. BTEE showed no significant cytotoxicity up to the concentration of 0.1 mg/mL (
Figure 1A).
2.2. Effect of BTEE on LPS-Induced Nitric Oxide Production
Nitric oxide (NO) is a signaling molecule that plays a critical role in the immune system [
21]. The overproduction of NO has been implicated in a variety of pathophysiological conditions [
22]. Therefore, suppression of NO production has become an important target in treating inflammation. Consequently, we examined the effect of BTEE on LPS-induced NO production.
Upon LPS stimulation, NO production was not significantly increased until 6 h; however, NO content significantly increased after 16 h of LPS stimulation. Therefore, we examined the effects of BTEE on NO production after 16 h of LPS stimulation.
We found that BTEE pretreatments for 24 h at the dilutions of 1/2000 (0.05 mg/mL), 1/1000 (0.1 mg/mL), and 1/500 (0.2 mg/mL) could significantly reduce NO production 16 h post-LPS stimulation in a dose-dependent manner (
Figure 1B).
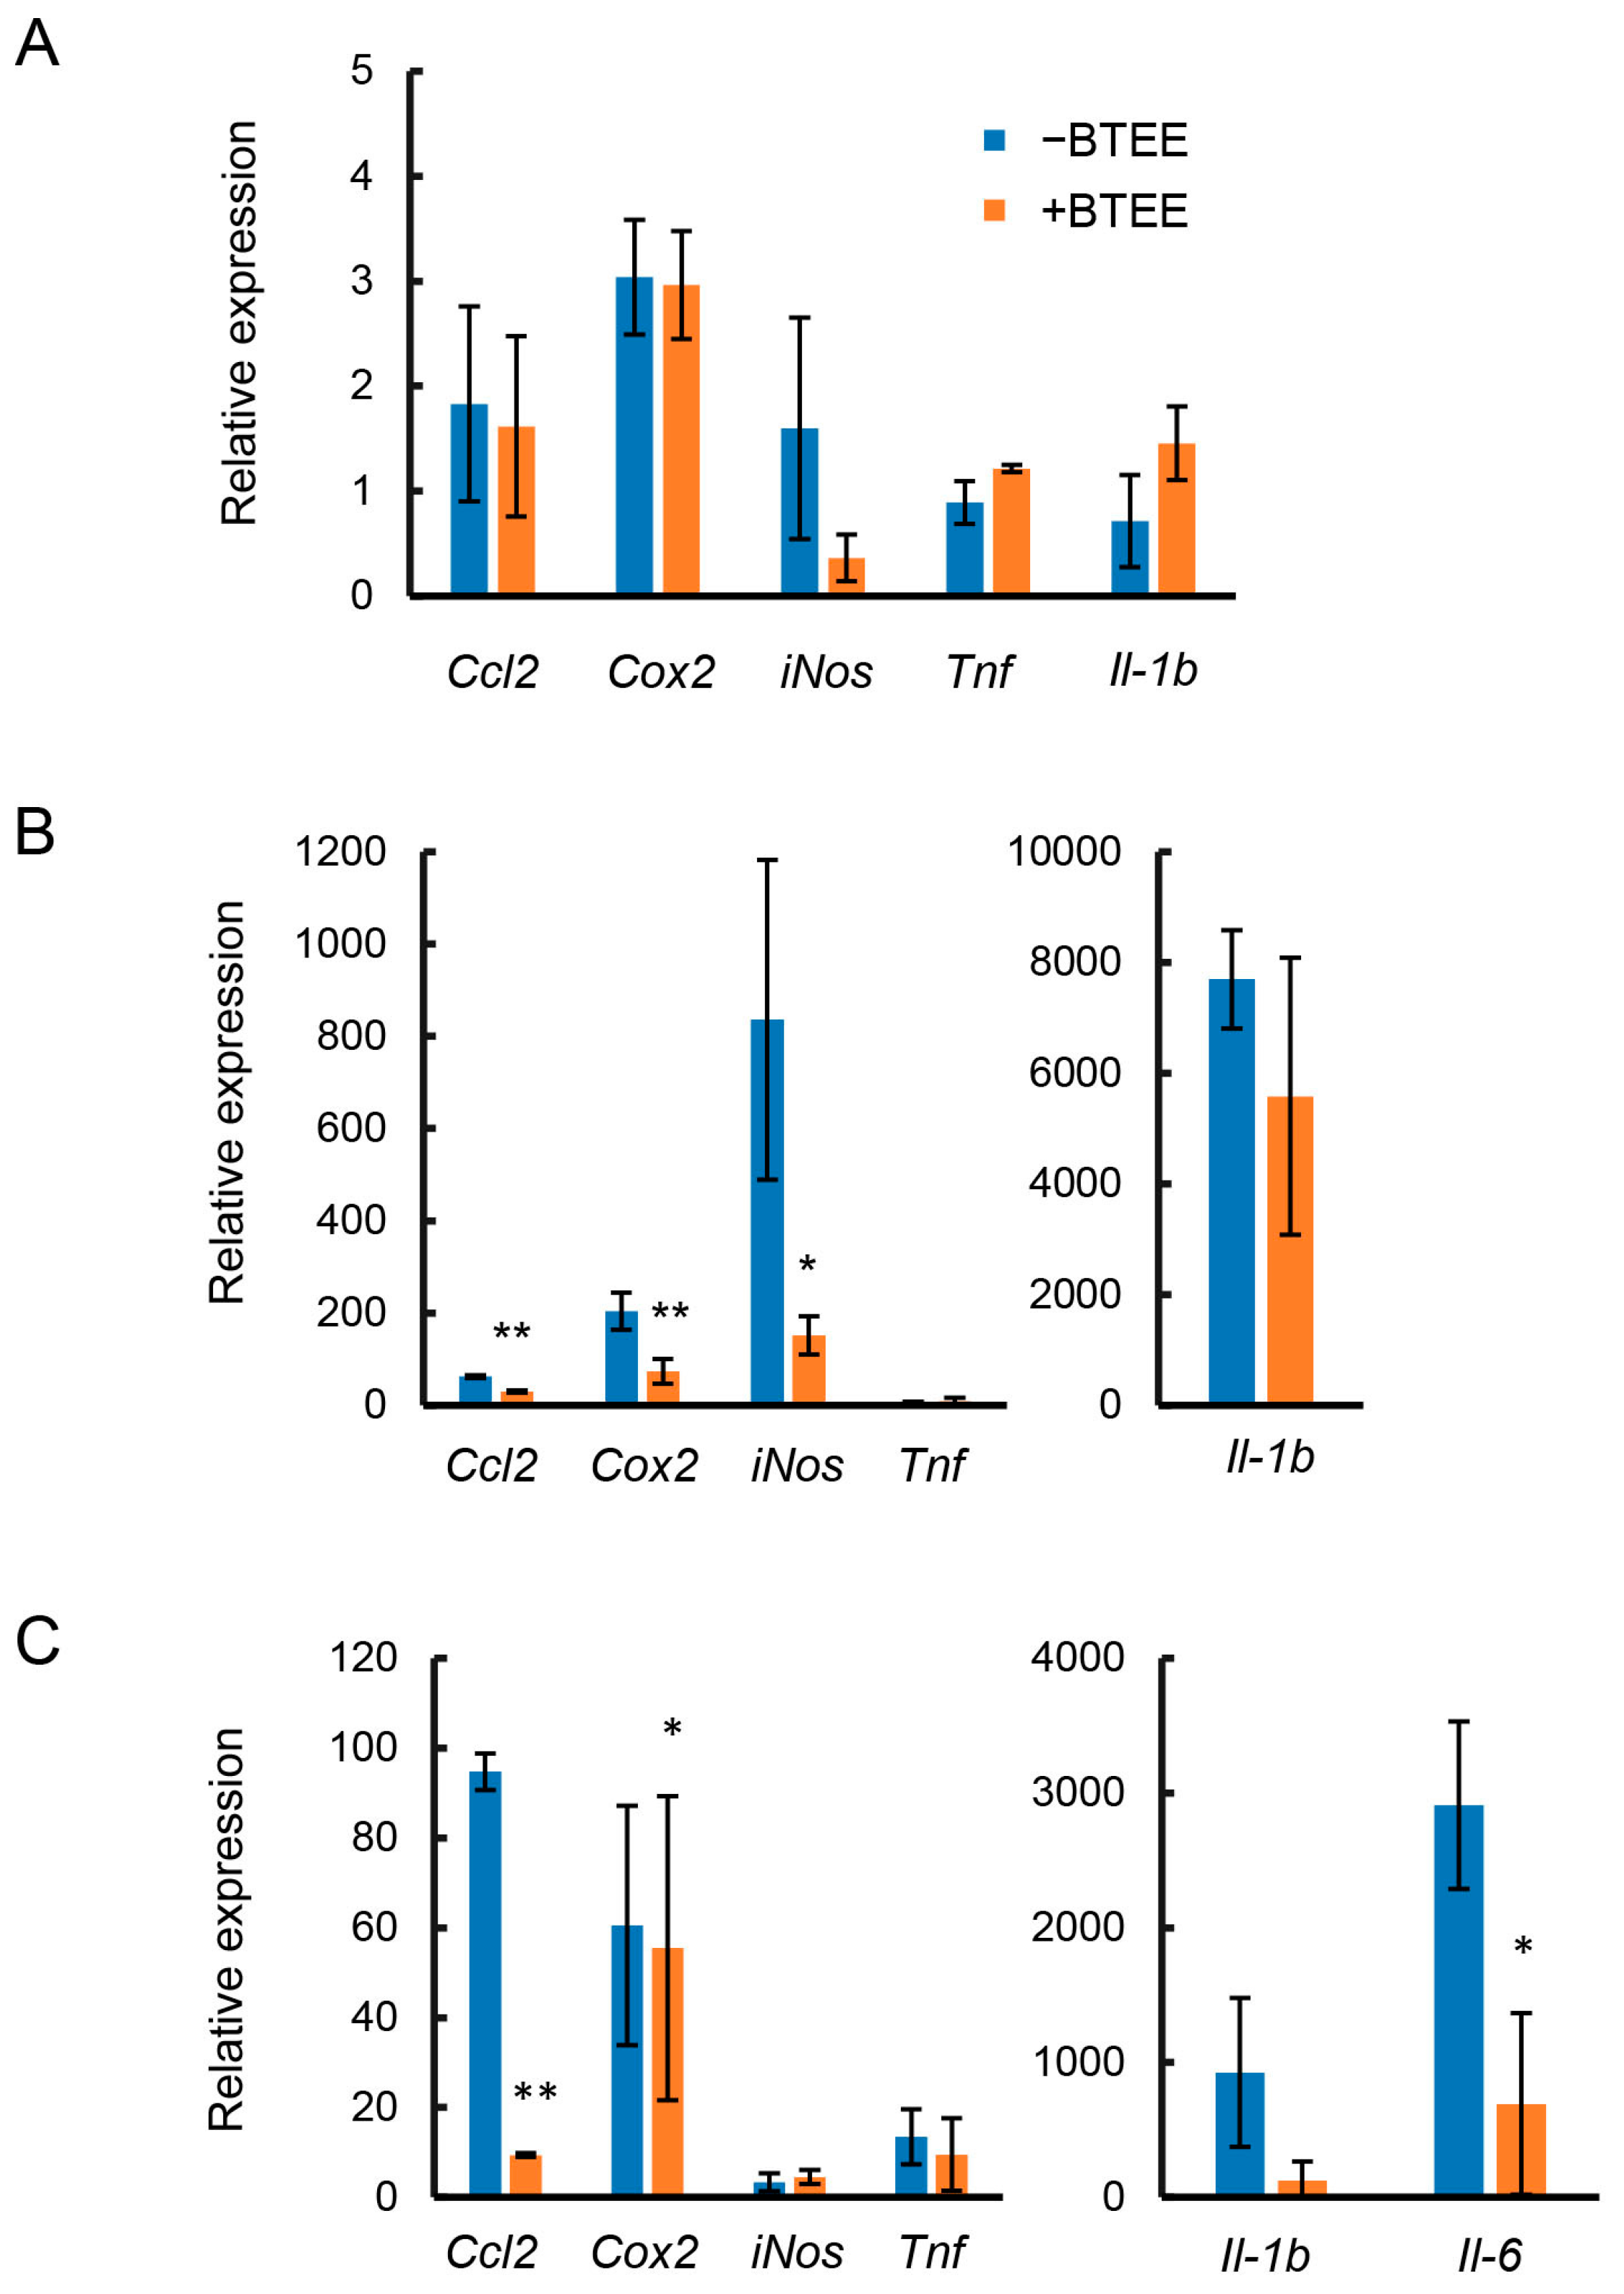
2.3. Effects of BTEE on Gene Expression of Inflammatory Mediators
As described above, BTEE was found to have an anti-inflammatory effect. Therefore, we next evaluated whether pretreatment with BTEE could alter the expression of representative inflammation-related mediators, C-C motif chemokine ligand 2 (Ccl2), interleukin 1 beta (Il1b), inducible nitric oxide synthase (iNos), cyclooxygenase 2 (Cox2), tumor necrosis factor (Tnf), and interleukin 6 (Il6), in RAW264 cells.
Before LPS stimulation, no significant difference was observed in
Ccl2,
Cox2,
iNos,
Tnf, and
Il1b expression between control (BTEE-) and BTEE-treated (BTEE+) conditions (
Figure 2A). At 6 h of LPS stimulation, there was no expression of
Il6. In addition, there was no change in
Tnf expression. Significant decreases were observed in
Ccl2 and
iNos expressions and a decreasing trend was observed in
Il1β expression (
Figure 2B). At 17 h of LPS stimulation,
Ccl2,
Cox2,
Tnf, and
Il6 were significantly decreased in the BTEE-treated cells compared to control cells (
Figure 2C).
Il1b showed a decreasing trend (
Figure 2C). However, there was no change in
iNos expression. Previous studies demonstrated that the mRNA expression of iNos reaches its peak from 6 to 8 h after LPS stimulation and then gradually decreases with time [
23,
24], which may explain the very low expression of
iNos at 17 h post-LPS stimulation in our study (
Figure 2C). Additionally, in RAW264 cells, iNOS mRNA and protein expressions are found to diminish before NO content reaches its maximum. A high level of NO content is found long after iNOS protein and mRNA expressions begin to decline [
24], which is consistent with our observation of high NO content 16 h after LPS stimulation (
Figure 1B).
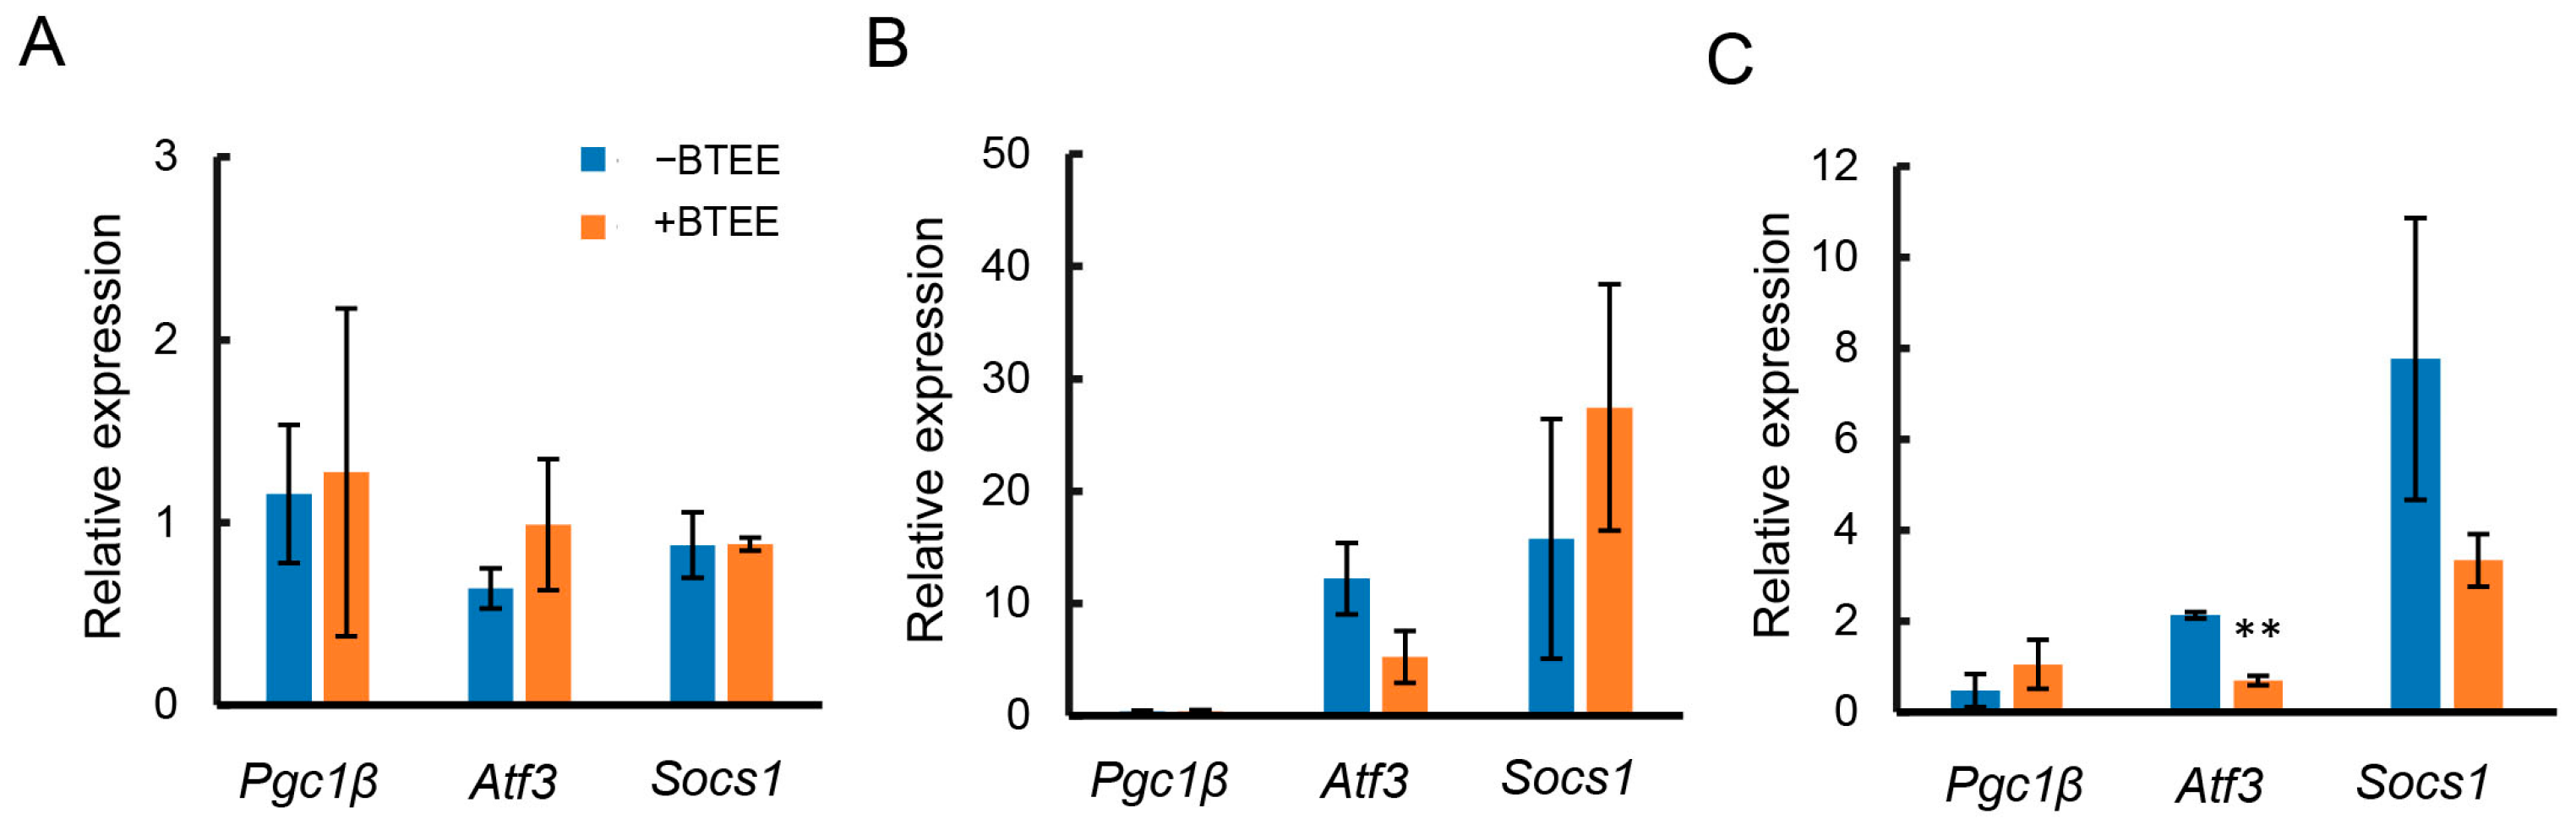
2.4. Effects of BTEE on mRNA Expressions of Anti-Inflammatory Mediators
As described above, treatment with the BTEE on RAW264 cells suppressed the gene expressions of inflammatory mediators. Therefore, we next evaluated whether pretreatment with BTEE could alter the gene expressions of representative anti-inflammatory mediators, peroxisome proliferator-activated receptor-gamma coactivator 1 beta (Pgc1b), activating transcription factor 3 (Atf3), and suppressing cytokine signaling 1 (Socs1), in RAW264 cells.
Before LPS stimulation, there was no significant difference in the expressions of
Pgc1b,
Atf3, and
Socs1 (
Figure 2A). At 6 h of LPS stimulation,
Atf3 tended to decrease,
Pgc1b remained unchanged, and
Socs1 tended to increase in BTEE-treated cells compared to control cells (
Figure 3B).
At 17 h of LPS stimulation,
Atf3 was significantly decreased,
Socs1 showed a decreasing trend, and
Pgc1b showed an increasing trend in the BTEE-treated condition compared to the nontreated condition (
Figure 3C).
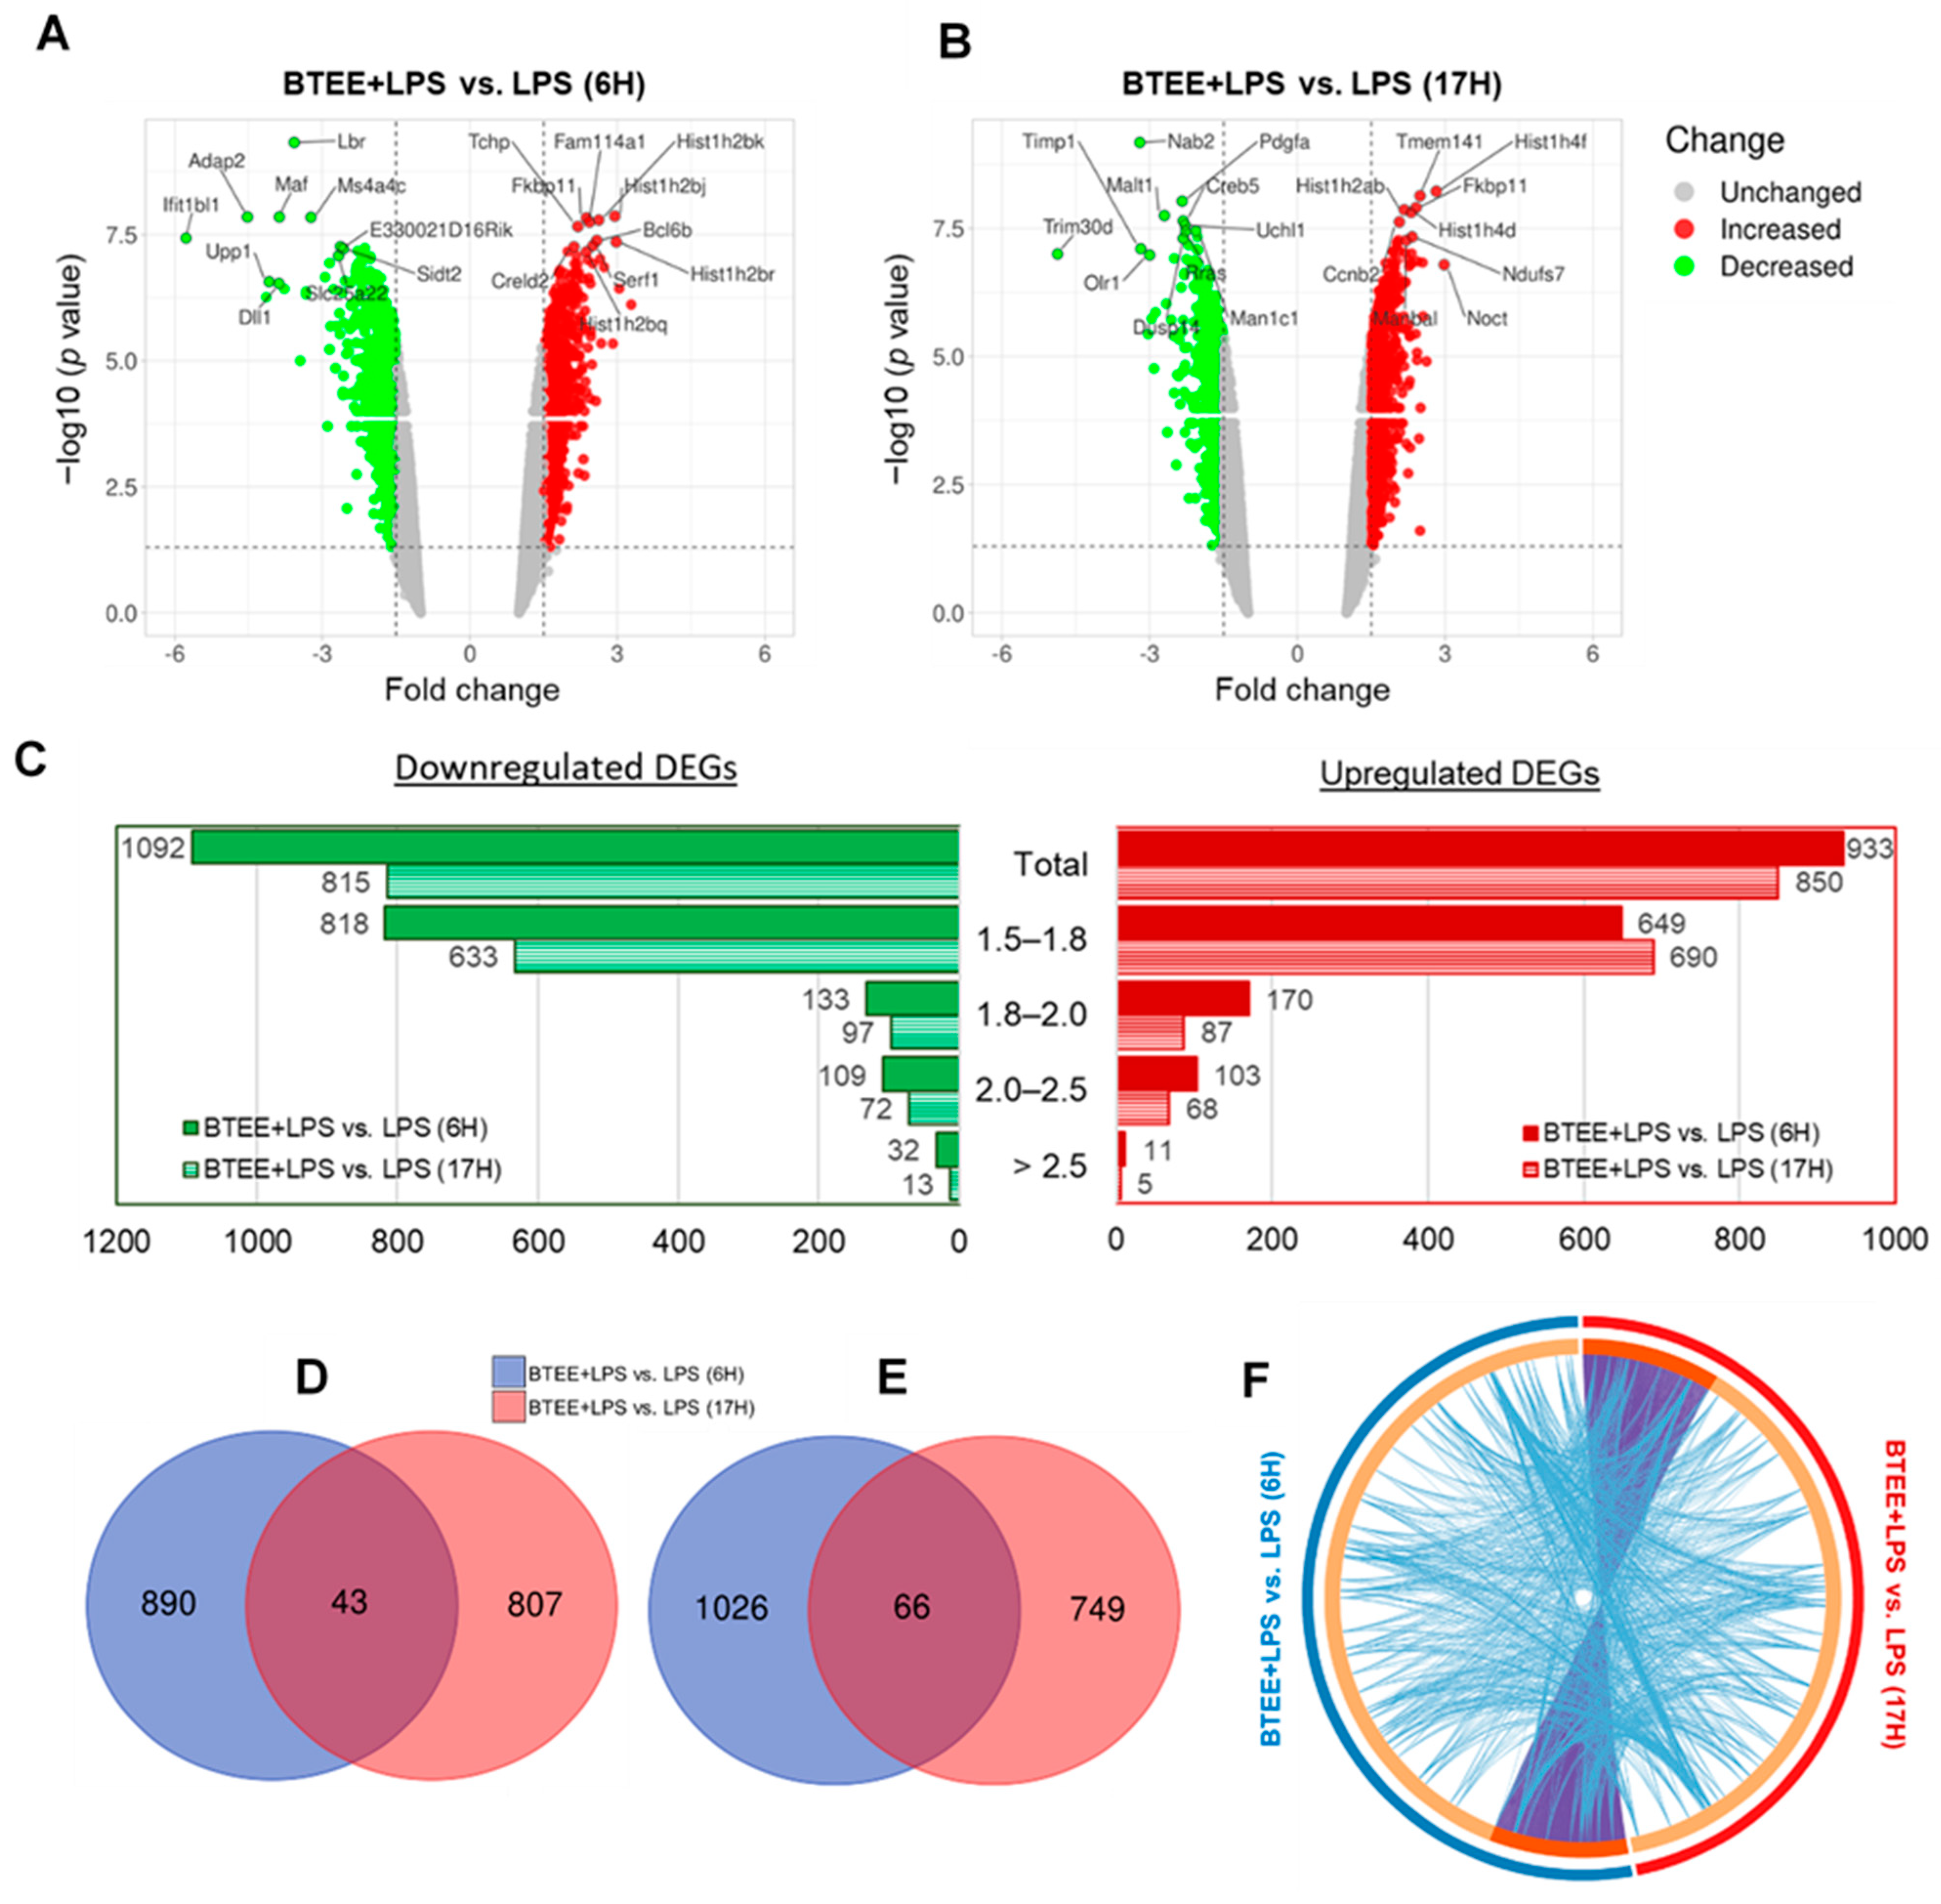
2.5. Characteristics of Gene Expression Profiling in BTEE-Treated RAW264 Cells
We performed whole-genome DNA microarray analysis to investigate the changes in gene expression in LPS-stimulated RAW264 cells treated with BTEE for 6 or 17 h.
A total of 21,978 genes were identified by the Clariom S assay (mouse). After 6 h of LPS stimulation, 2350 genes were differentially expressed in the BTEE-treated group compared to the nontreated group. After deleting duplicates and ‘no symbol’ genes, 2026 differentially expressed genes (DEGs) were identified; among them, 1092 DEGs were downregulated and 933 DEGs were upregulated (
Figure 4A). At 17 h of LPS stimulation, 1665 DEGs were identified in the BTEE-treated group compared to the nontreated group; among them, 815 DEGs were downregulated and 850 were upregulated (
Figure 4B).
Figure 4C shows the distribution of fold changes in 6 h and 17-h conditions. A total of 43 genes were commonly upregulated (
Figure 4D) and 66 genes were commonly downregulated (
Figure 4E) in both 6 h and 17-h conditions. A complete list of common DEGs is provided in
Supplementary File S1. Although there were not many overlapped DEGs between 6 h and 17 h treatment conditions, there was significantly more functional overlap (
Figure 4F).
2.6. Gene Ontology and Pathway Enrichment Analyses of the BTEE-Induced RAW264 Cells
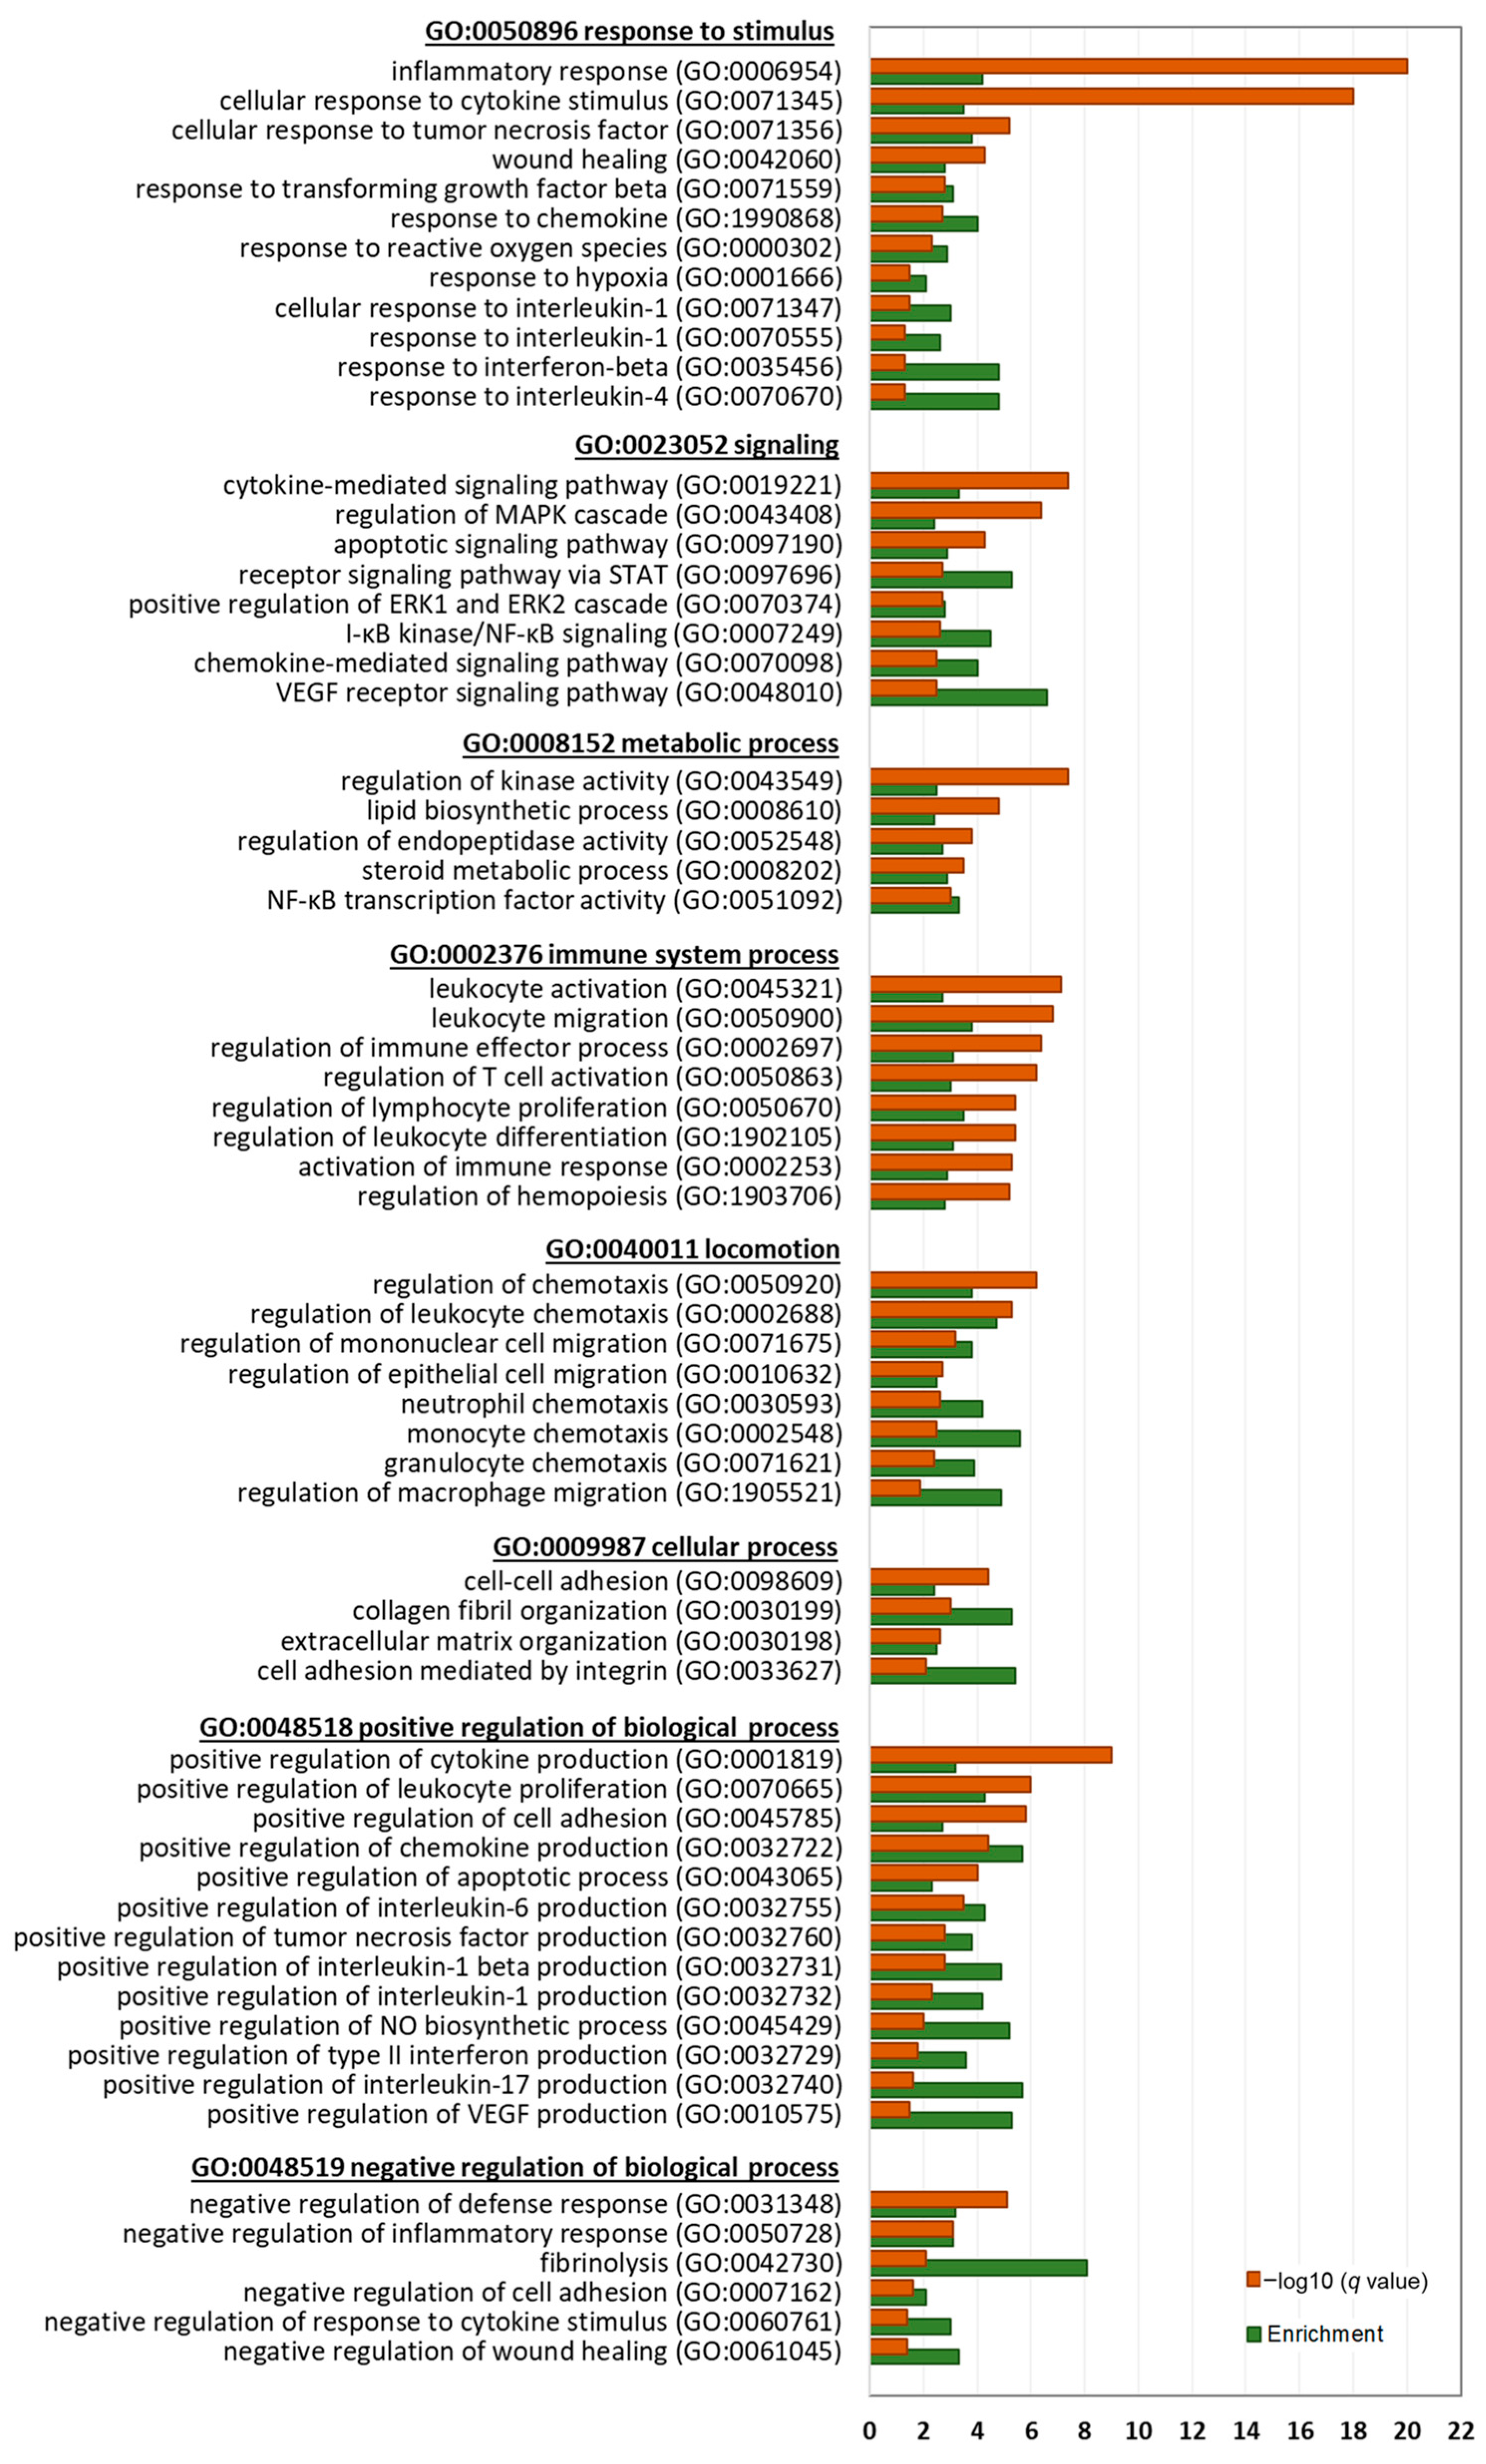
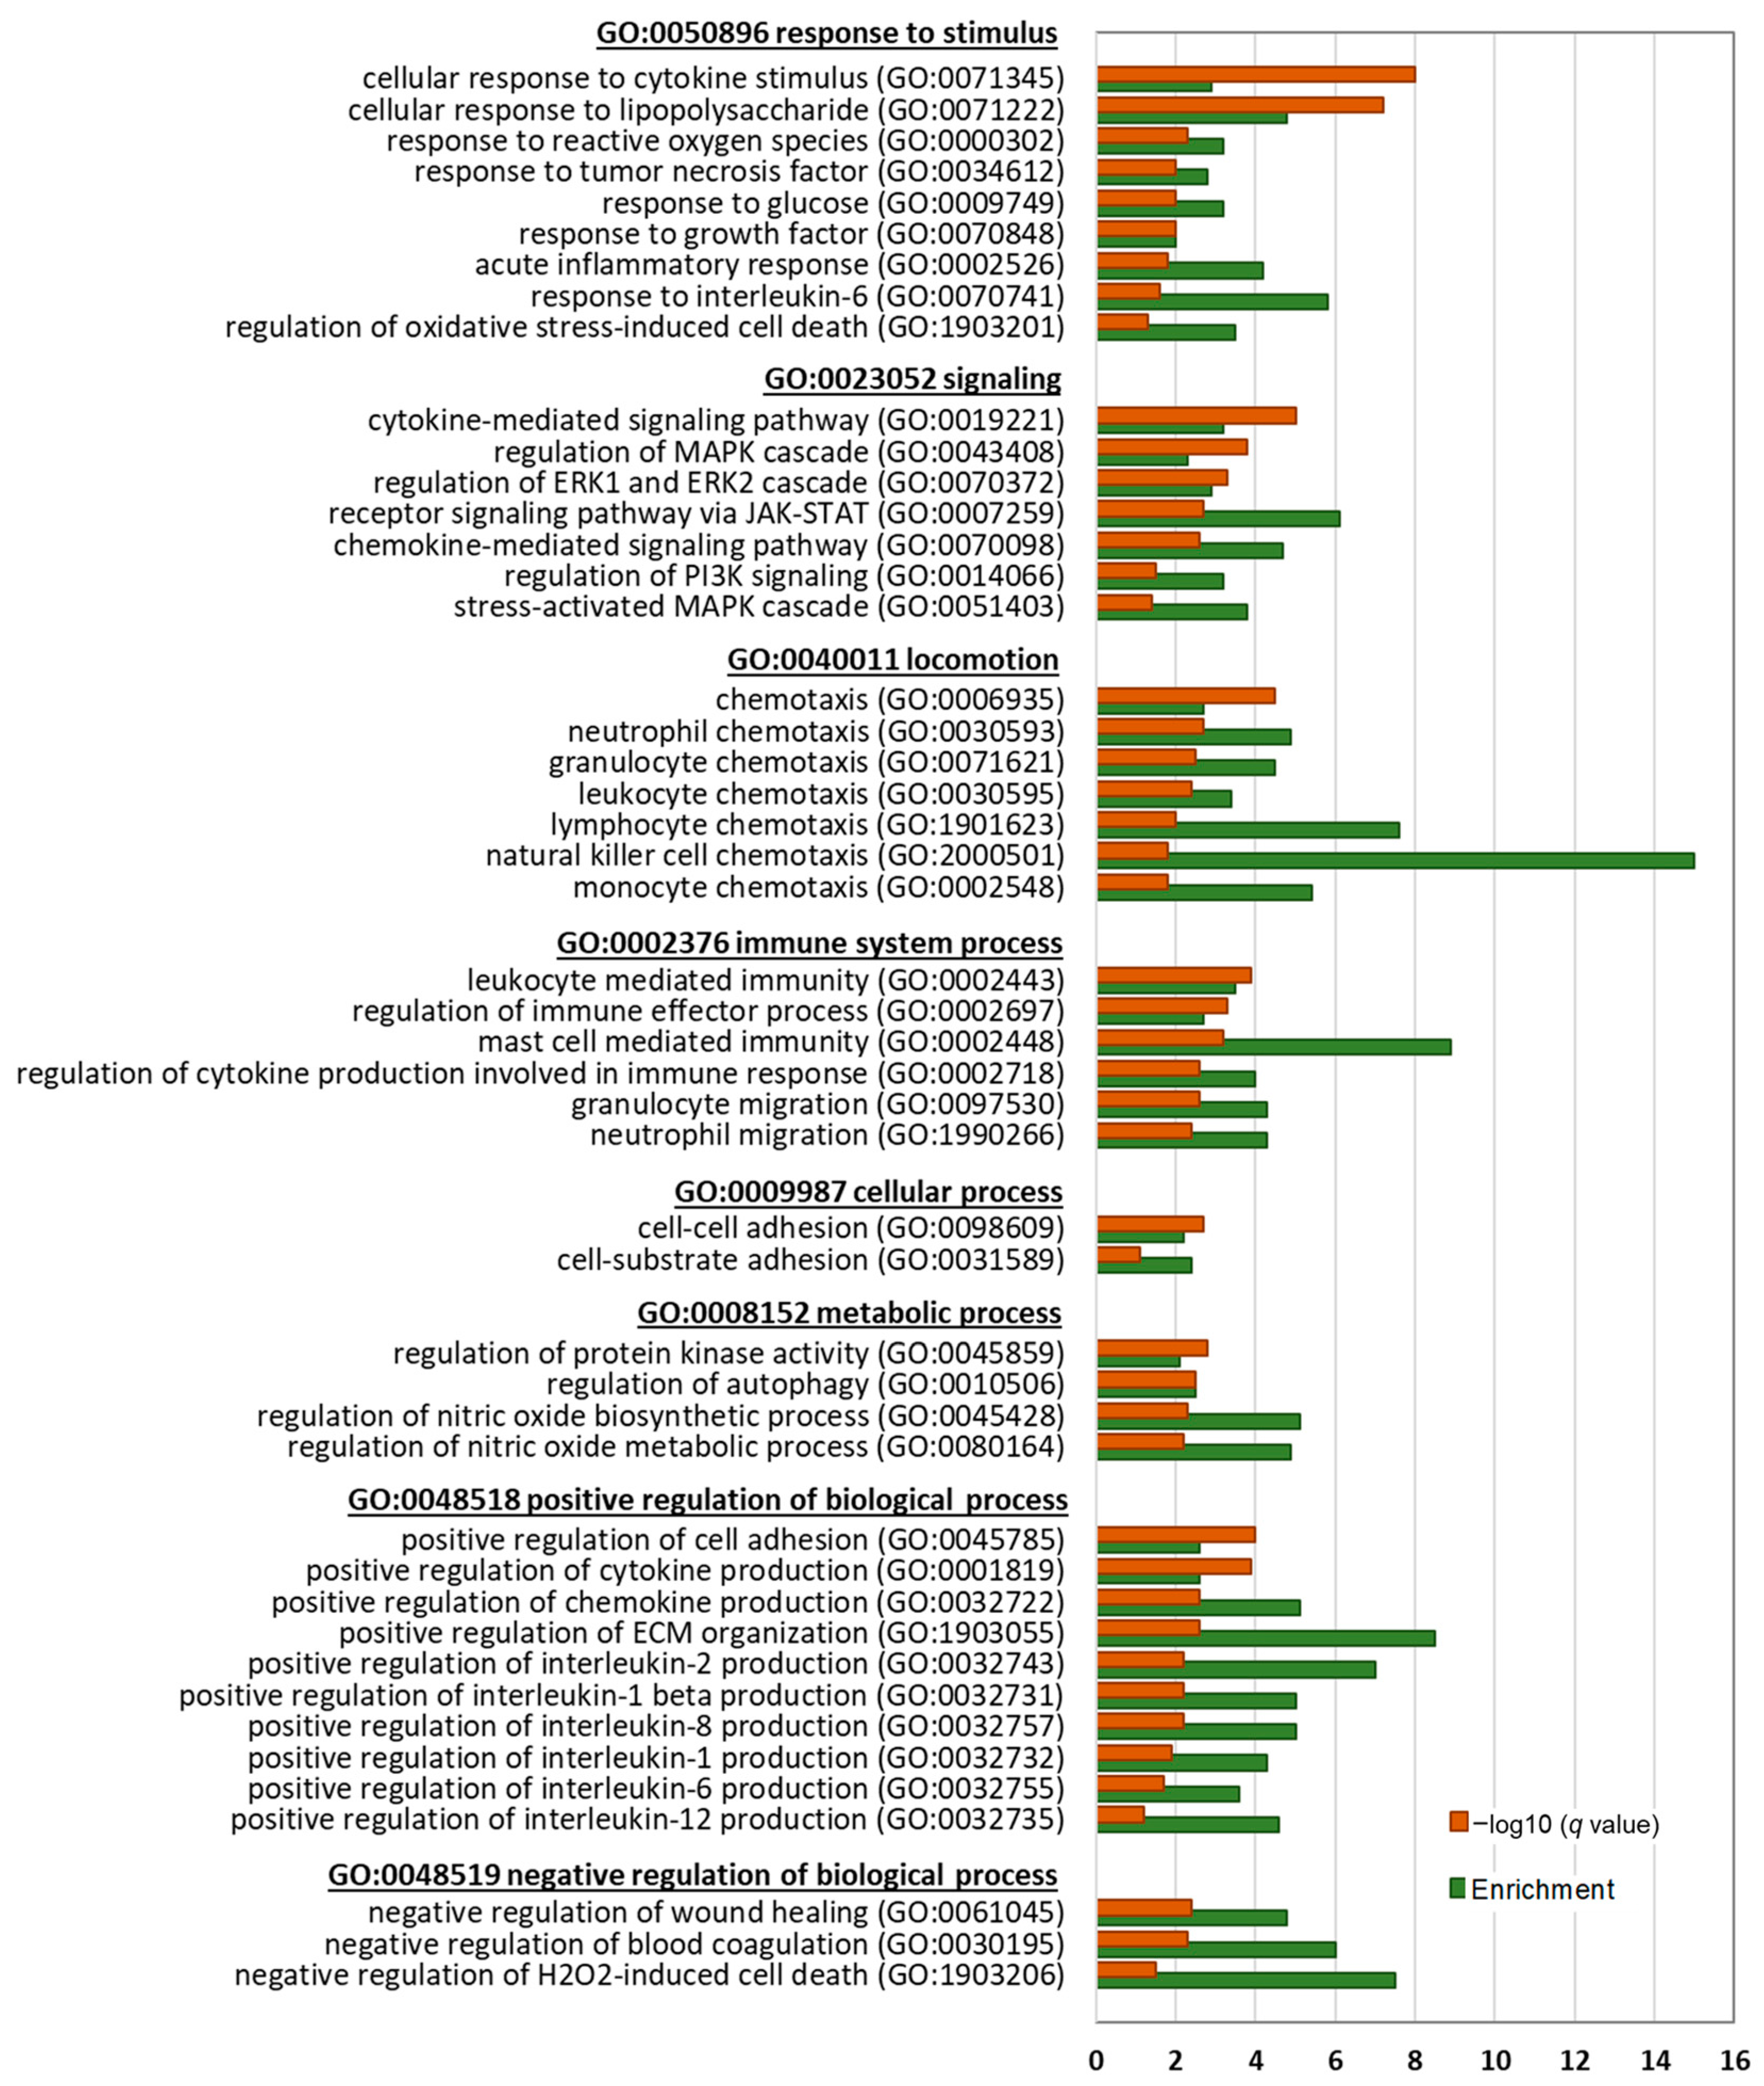
Next, we performed a detailed gene ontology (GO) analysis of significantly enriched biological processes (BP) by the DEGs to identify key biological themes regulated by BTEE (
Figure 5 and
Figure 6).
Downregulated DEGs at both 6-h and 17-h conditions significantly enriched parent GOBP terms of response to stimulus (GO:0050896), signaling (GO:0023052), locomotion (GO:0040011), immune system process (GO:0002376), cellular process (GO:0009987), metabolic process (GO:0008152), positive regulation of biological process (GO:0048518), and negative regulation of biological process (GO:0048519). Genes related to cellular response to cytokine stimulus (GO:0071345), lipopolysaccharide (GO:0071222), reactive oxygen species (GO:0000302), and interleukin 6 (GO:0070741) were downregulated. Further, genes that are positively associated with cytokine production (GO:0001819), chemokine production (GO:0032722), interleukin 2 production (GO:0032743), interleukin 1 beta production (GO:0032731), interleukin 8 production (GO:0032757), interleukin 1 production (GO:0032732), and interleukin 12 production (GO:0032735) were significantly downregulated. Additionally, NO metabolic process (GO:0080164) and NO biosynthetic process (GO:0045428)-related genes were downregulated.
Another top enriched parent BP by the downregulated DEGs was ‘locomotion’, which included chemotaxis of neutrophil (GO:0030593), granulocyte (GO:0071621), leukocyte GO:0030595), lymphocyte (GO:1901623), natural killer cell (GO:2000501), and monocyte (GO:0002548). Cell–cell adhesion (GO:0098609), negative regulation of wound healing (GO:0061045), and ECM organization (GO:1903055)-associated genes were also downregulated.
Enriched signaling pathways by the downregulated DEGs included stress-activated MAPK cascade (GO:0051403), PI3K signaling (GO:0014066), receptor signaling pathway via JAK-STAT (GO:0007259), and ERK1 and ERK2 cascade (GO:0070372).
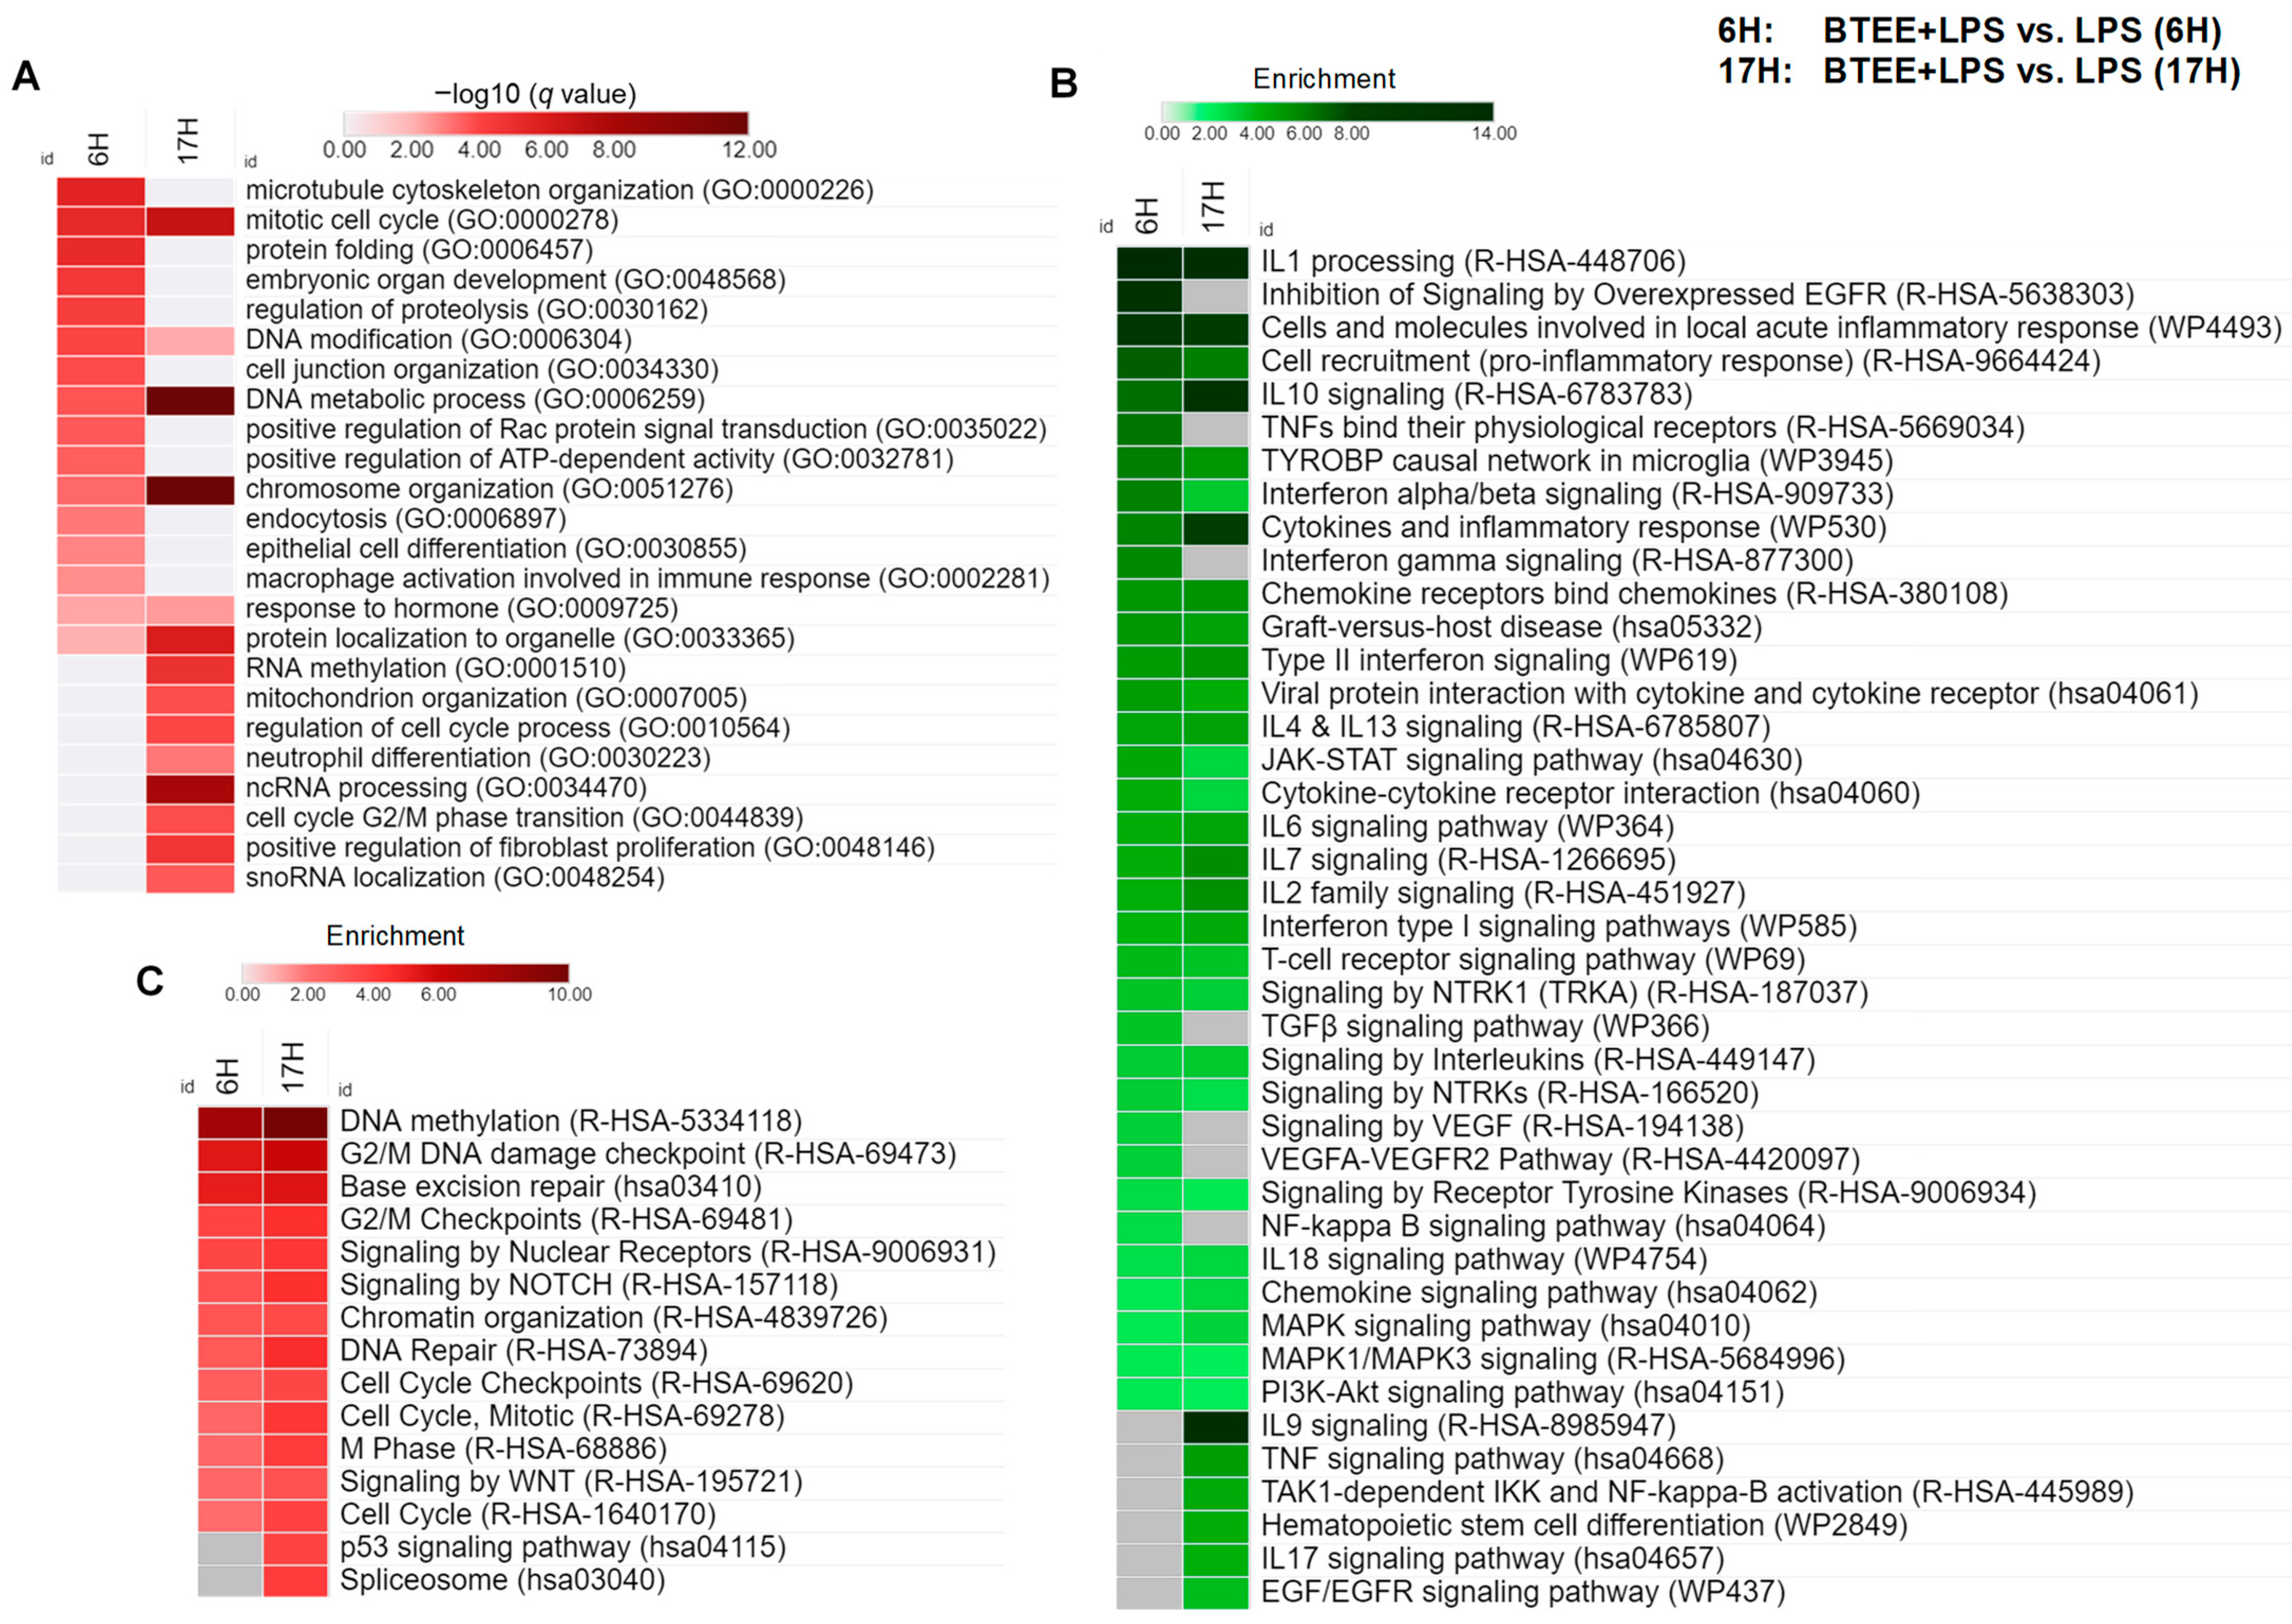
On the other hand, the upregulated DEGs were associated with the mitotic cell cycle (GO:0000278), cell cycle process (GO:0010564), cell cycle G2/M phase transition (GO:0044839), as well as protein folding (GO:0006457), DNA modification (GO:0006304), DNA metabolic process (GO:0006259), chromosome organization (GO:0051276), RNA methylation (GO:0001510), and mitochondrion organization (GO:0007005) (
Figure 7A).
Next, we performed pathway enrichment analysis to achieve mechanistic insight into gene lists overrepresented by BTEE (
Figure 7B,C). We used multiple pathway databases, including Reactome, Kyoto Encyclopedia of Genes and Genomes (KEGG), and WikiPathways, to obtain both broad and detailed pathway terms. IL1 processing was the top enriched pathway by the downregulated DEGs in both 6 h and 17-h conditions. Several IL pathways, such as ILs 2, 4, 6, 7, 10, 13, and 18, were enriched in both conditions, whereas ILs 9 and 17 were enriched in only 17-h condition. TNFs, transforming growth factor beta (TGFβ), interferons (IFNs), chemokine, and T cell receptor signaling pathways were also enriched by the downregulated DEGs. Downregulated DEGs in BTEE-treated conditions related to ‘cytokine–cytokine receptor interaction’ KEGG pathway are shown in
Supplementary Figure S1. Other important pathways include epidermal growth factor receptor (EGFR), vascular endothelial growth factor A (VEGF), neurotrophic tyrosine receptor kinase 1 (NTRK1), and nuclear factor-κB (NF-κB) pathways (
Figure 7B).
Enriched pathways by the upregulated DEGs included DNA methylation, DNA damage checkpoints, chromatin organization, base excision repair, the cell cycle, as well as signaling by NOTCH, WNT, nuclear receptors, and the p53 signaling pathway (
Figure 7C).
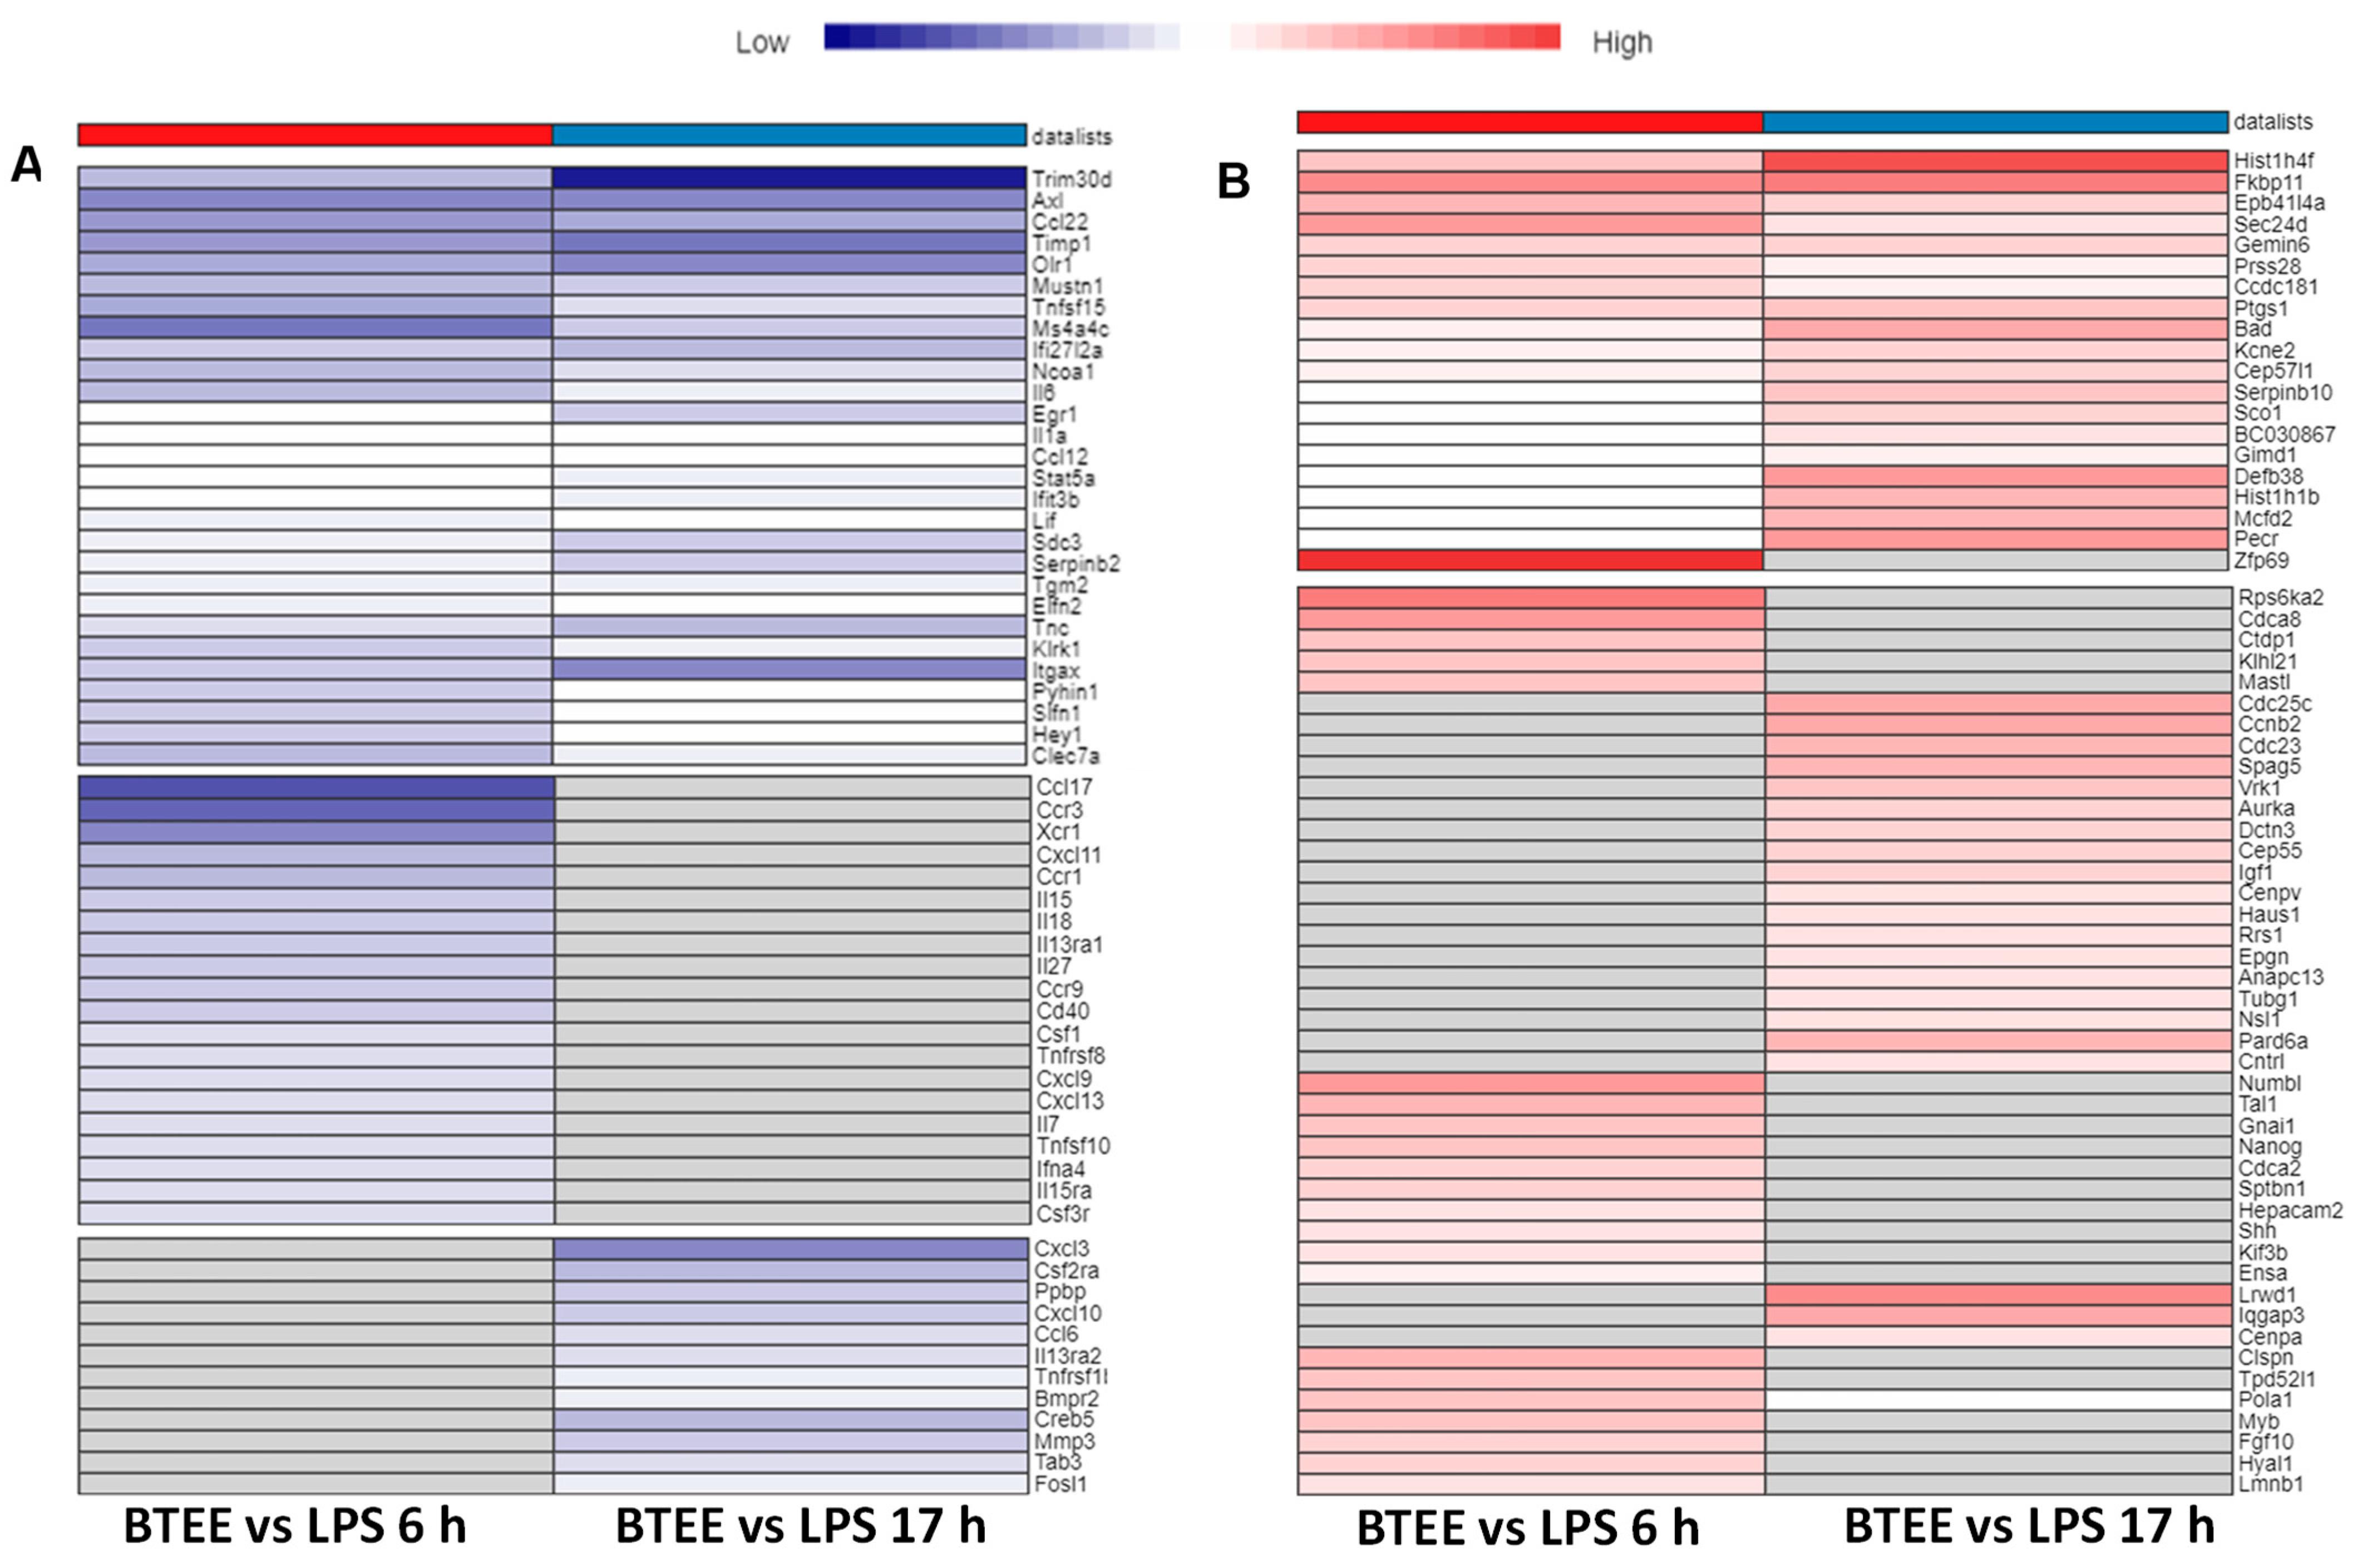
2.7. Common and Unique DEGs in BTEE-Treated 6-h and 17-h Conditions in RAW264 Cells
Key overlapped DEGs with enriched functions and their expressions are shown in heatmaps in
Figure 8. Although most of the enriched GOBPs and pathways were similar in both 6-h and 17-h experimental conditions (as shown in
Figure 5,
Figure 6 and
Figure 7), they did not always share the same DEGs (as shown in
Figure 8).
Several inflammatory cytokines were downregulated in both 6-h and 17-h conditions; however, there were several unique inflammatory mediators to each condition (
Figure 8A). Commonly upregulated DEGs were associated with the S phase of the cell cycle, whereas uniquely upregulated DEGs in both conditions were associated with the M phase of the cell cycle and mitotic cell division (
Figure 8B).
2.8. Protein–Protein Interaction Network Analysis of the Commonly Regulated DEGs in 6-h and 17-h conditions in RAW264 Cells
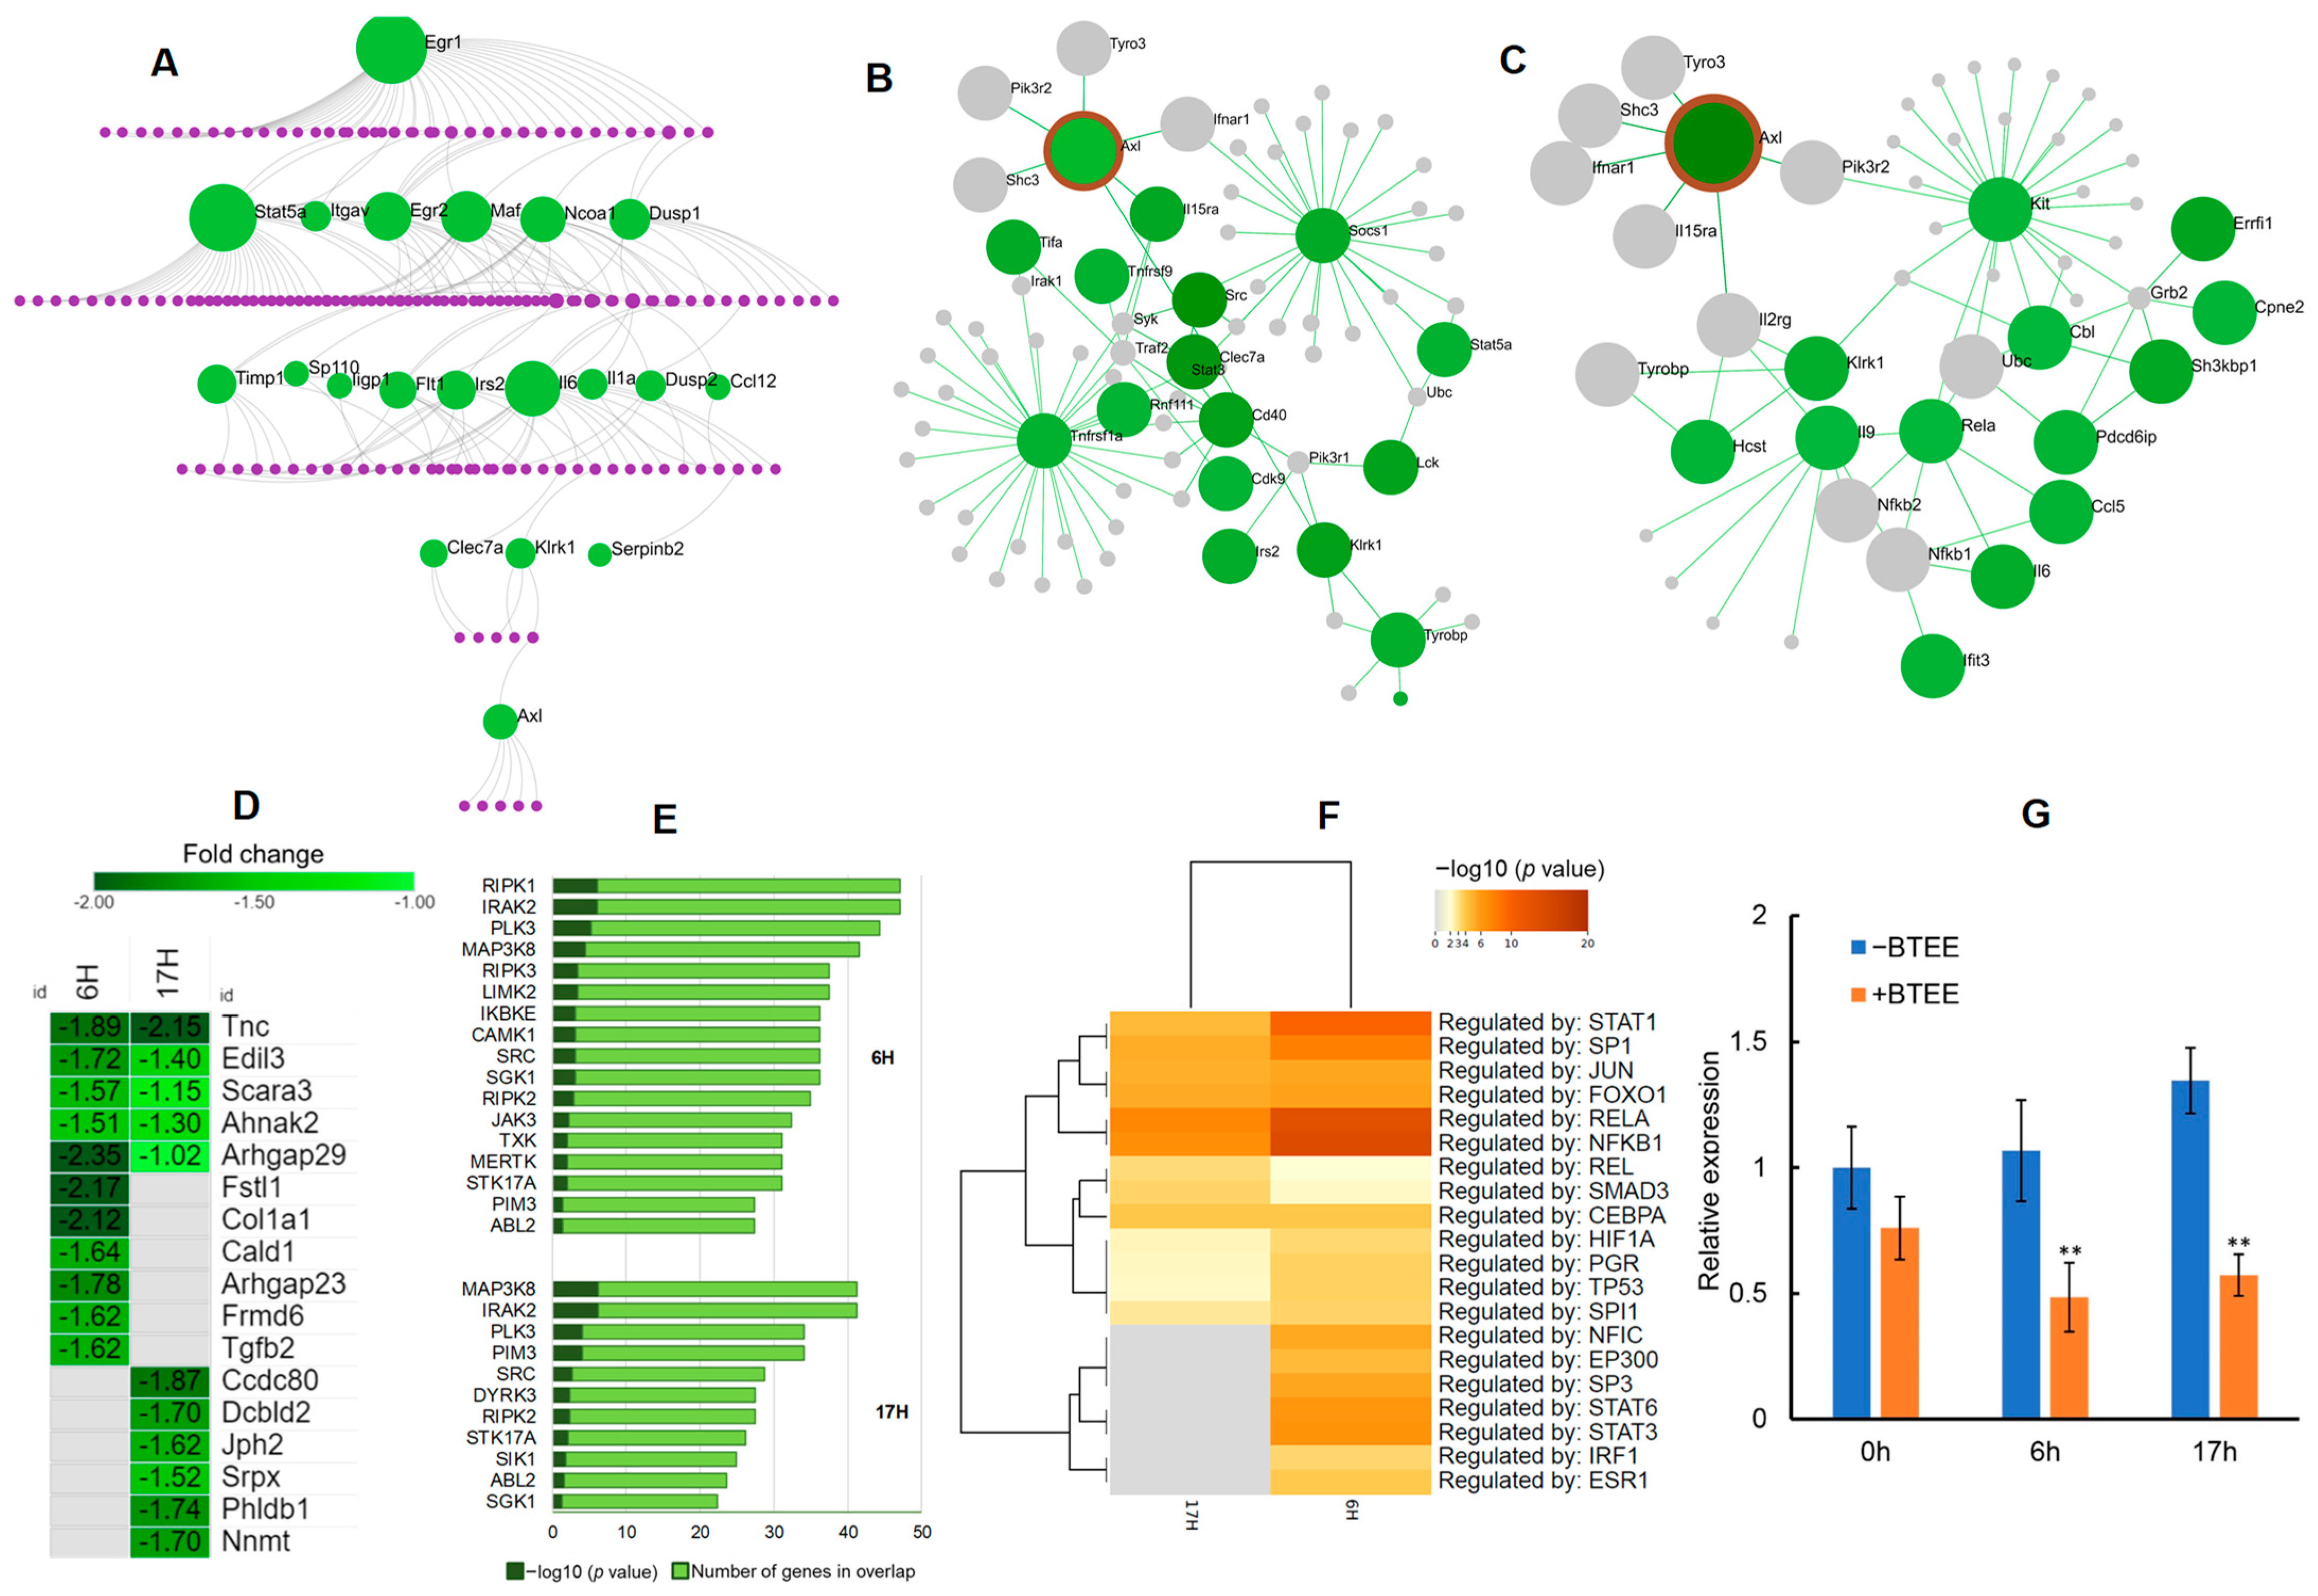
We performed a protein–protein interaction (PPI) network analysis to uncover the interacting genes and to predict the molecular targets of BTEE’s biological functions.
First, we built a first-order undirected PPI network using the InnateDB Interactome database [
25] consisting of common downregulated DEGs (
n = 66). PPI analysis identified 20 seeds and 179 interacting nodes with 199 edges (
Figure 9A). Early growth response 1 (
Egr1) was the top hub node with the highest degree (degree = 39, betweenness = 6279.43), followed by the signal transducer and activator of transcription 5A (
Stat5a; degree = 34, betweenness = 8203.75),
Il6 (degree = 20, betweenness = 2958.51), MAF BZIP transcription factor (
Maf; degree = 16, betweenness = 2594.85),
Egr2 (degree = 14, betweenness = 1688.33), and nuclear receptor coactivator 1 (
Ncoa1; degree = 12, betweenness = 2012.67). Enriched networks included Th17 cell differentiation (FDR = 3.41 × 10
−27), Jak-STAT signaling pathway (FDR = 6.24 × 10
−21), IL17 signaling pathway (FDR = 9.76 × 10
−16), TNF signaling pathway (FDR = 4.54 × 10
−14), PI3K-Akt signaling pathway (FDR = 8.54 × 10
−13), cytokine–cytokine receptor interaction (FDR = 4.50 × 10
−10), MAPK signaling pathway (FDR = 1.22 × 10
−8), T cell receptor signaling pathway (FDR = 1.87 × 10
−8), and Toll-like receptor signaling pathway (FDR = 1.20 × 10
−7). All hub nodes and network enrichment results are provided in
Supplementary File S2.
Undirected PPI analysis of the common downregulated DEGs leads to identifying an interesting downstream seed gene, AXL receptor tyrosine kinase (
Axl), a tyrosine kinase from the TAM family (
Figure 9A). Therefore, we further performed neighborhood analyses of the seed gene
Axl to examine the expression profile of genes highly connected to
Axl. We found several genes interacting with
Axl were downregulated in 6-h and 17-h conditions (
Figure 9B,C).
Further, we expanded
Axl with ‘All RNA-seq and ChIP-seq sample and signature search’ (ARCHS4) gene–gene coexpression matrix [
26] by identifying the top 100 genes that mostly coexpress with
Axl. Among the top 100 coexpressed genes, several were significantly downregulated in both 6-h and 17-h conditions (
Figure 9D).
AXL has been reported to exhibit crosstalk with numerous receptor tyrosine kinases (RTKs). Additionally, most AXL inhibitors are known to inhibit other protein kinases, preferentially RTKs. Therefore, we performed a kinase enrichment analysis of the downregulated DEGs to explore the overrepresented kinases (ARCHS4 kinases coexpression database). Top enriched kinases by the downregulated DEGs included mixed lineage kinases (RIPK1, RIPK2, and RIPK3), interleukin-1 receptor-associated kinase 2 (IRAK2), receptor tyrosine kinases (TXK, MERTK), nonreceptor tyrosine kinases (JAK3, ABL2, SRC), mitogen-activated protein kinase (MAP3K8), IκB kinase family (IKBKE), and polo-like kinase (PLK) (
Figure 9E). Details of kinase coexpression enrichment analysis can be found in
Supplementary File S3.
To explore other direct regulators of
Axl, we performed a TF enrichment analysis using the TRRUST (transcriptional regulatory relationships unraveled by sentence-based text mining) database (
Figure 9F) [
27]. Top enriched TFs by the downregulated DEGs included TFs that directly act on the
Axl promoter (SP1, SP3, and HIF1A), that regulate
Axl mRNA expression through other signaling pathways (JUN), and that regulate important downstream pathways of
Axl (STAT and NF-κB) [
28].
2.9. Chemical Perturbations from LINCS L1000 Library by the Downregulated DEGs
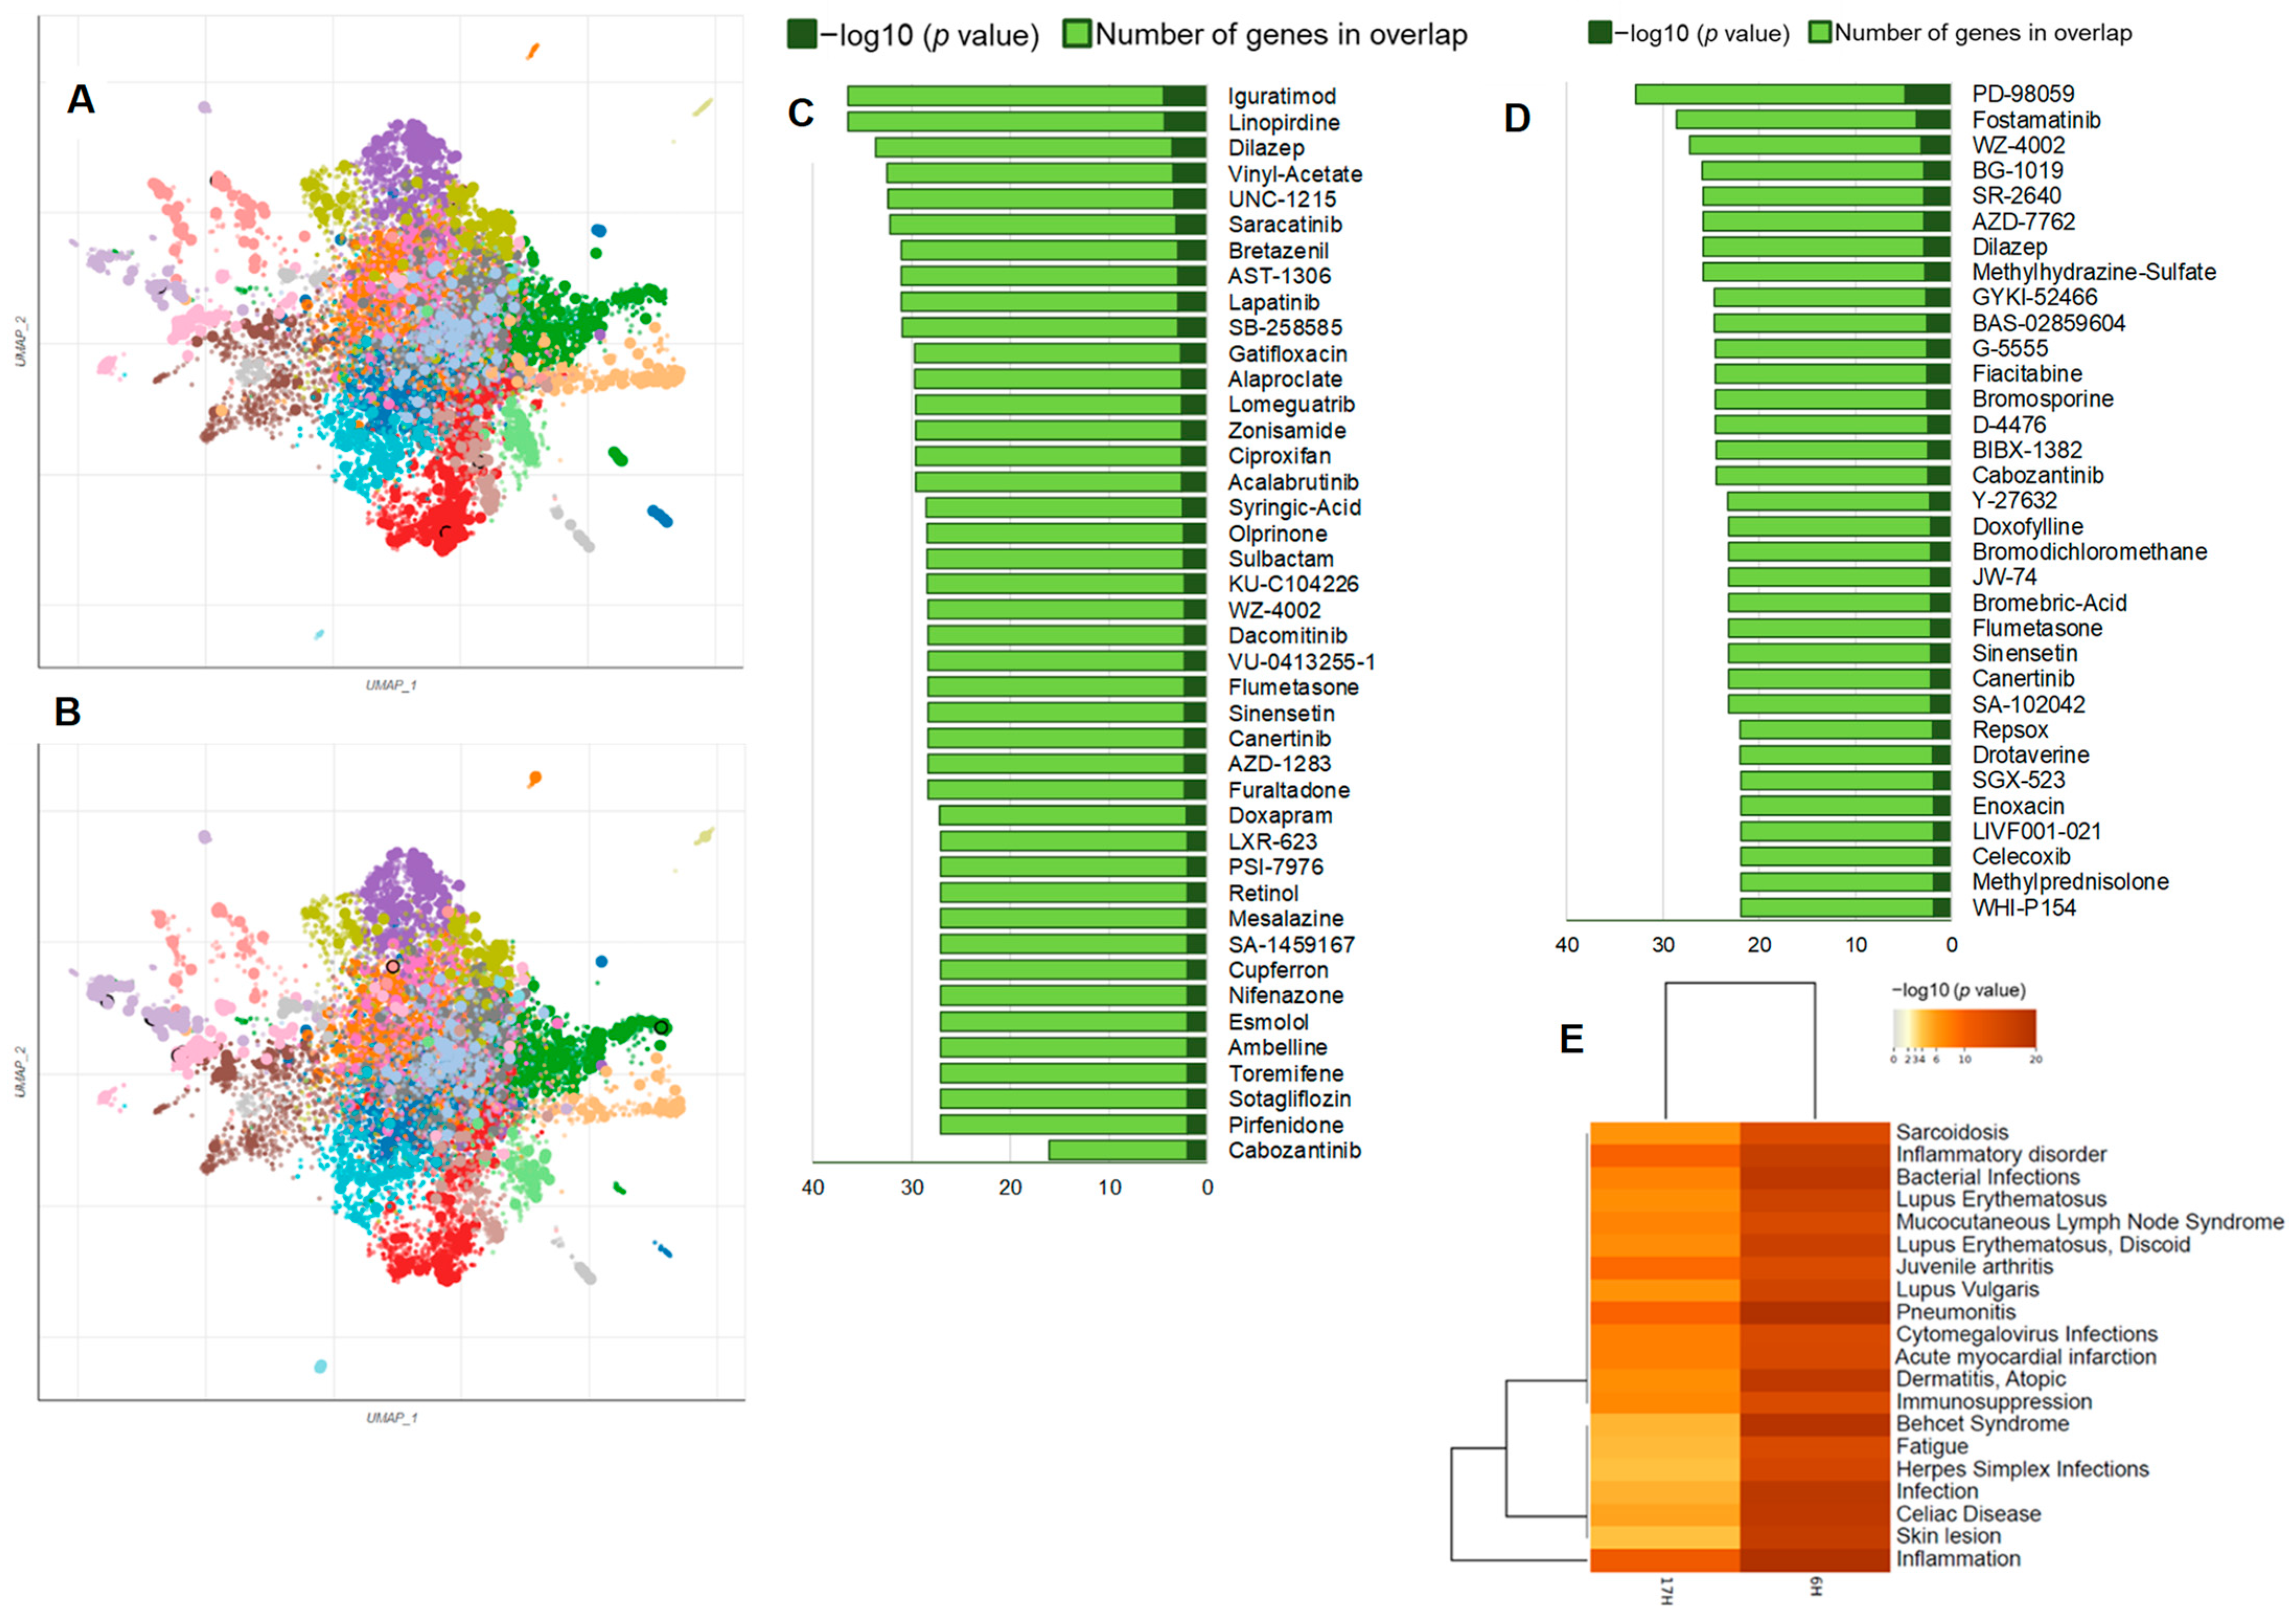
We have performed chemical/drug perturbations analysis using the LINCS L1000 library (
Figure 10A–D) [
29]. This analysis was limited to downregulated DEGs to examine the enrichment of
Axl inhibitors. We identified several enriched chemicals/drugs in BTEE-treated conditions that not only downregulate
Axl expression but also impact other genes through a complex network of both upstream and downstream regulatory interactions. For example, iguratimod, linopirdine, dilazep, vinyl-acetate, saracatinib, bretazenil, lapatinib, lomeguatrib, alaproclate, gatifloxacin, acalabrutinib, dacomitinib, and cabozantinib were enriched in 6-h condition, whereas fostamatinib, fiacitabine, dilazep, methylhydrazine-sulfate, bromosporine, cabozantinib, doxofylline, sinensetin, canertinib, celecoxib, and enoxacin were enriched in 17-h condition. Details of chemical perturbation enrichment analysis can be found in
Supplementary File S4. These findings suggest that BTEE may have the potential to mimic the functions of the identified enriched drug or chemicals.
Finally, we performed a disease–gene association enrichment analysis using the downregulated DEGs, which returned a list of diseases where BTEE is predicted to exert beneficial effects. Enriched disease terms included several inflammatory and autoimmune disorders as well as skin diseases (
Figure 10E). The DisGeNET database was used for the disease–gene association enrichment analysis [
30].
3. Discussion
BTEE exhibited anti-inflammatory effects that are mediated via the suppression of LPS-induced NO production and pro-inflammatory cytokines release. Further, an integrated whole-genome transcriptomic analysis predicted the interaction of BTEE on possible biological pathways and molecular targets.
Gene expression analysis showed that the expressions of six proinflammation-related genes,
Ccl2,
Cox2,
Tnf,
iNos, Il1b, and
Il6, differed depending on the duration of LPS stimulation; however, BTEE treatment could overall decrease their expression. On the other hand, BTEE treatment upregulated to some extent the expressions of three anti-inflammation-related genes,
Atf3,
Socs1, and
Pgc1β, at 6 h and 17 h post-LPS stimulation, respectively (
Figure 1,
Figure 2 and
Figure 3).
Integrative evaluations of transcriptomics obtained from compound-induced gene expression data derived from biological experiments can capture the compound’s possible biological responses and molecular targets. Therefore, in the present study, we comprehensively analyzed how BTEE pretreatment affected the changes in gene expression in LPS-stimulated RAW264 cells. Enrichment analysis suggested that BTEE significantly downregulated gene expressions related to the cellular response to cytokine stimulus, LPS, and reactive oxygen species. More specifically, genes positively associated with cytokine production, such as
ILs
1,
2,
8, and
12, and chemokine production, were downregulated in BTEE-treated cells. Additionally, signaling pathways of several tyrosine kinases—both receptor and nonreceptor—were downregulated, such as EGFR, VEGF, NTRK1, and NF-κB pathways (
Figure 5,
Figure 6 and
Figure 7B).
On the other hand, cell cycle, DNA methylation, DNA damage checkpoint, chromatin organization, as well as WNT, Notch, and p53 signaling pathways-related genes were significantly upregulated in BTEE-treated cells (
Figure 7A,C).
Further, PPI and node neighborhood analyses predicted that BTEE interacts with
Axl to exhibit its biological responses (
Figure 9). First, untargeted PPI analysis of the commonly downregulated genes in both 6 h and 17 h post-LPS stimulation conditions returned a list of 20 seed genes with the highest interactions. Among them,
Axl was the most downstream effector (
Figure 9A). Next, node neighborhood analyses and gene coexpression analysis suggested that BTEE not only affected the expression of AXL but also significantly downregulated several coexpressed and downstream gene expressions (
Figure 9B–D).
AXL is a member of the RTK family, the TAM receptors (TYRO3, AXL, MERTK) [
31]. The
Axl transcription process is also feedback controlled by other RTKs. Activated EGFR pathways and downstream MEK/ERK signaling were reported to promote AXL mRNA expression through the JUN transcription factor in a number of cancer cells [
32]. In line with previous studies on AXL inhibition, we also found that a number of tyrosine kinases and their signaling pathways were significantly downregulated in BTEE-treated cells (
Figure 7 and
Figure 9E). Additionally, AXL activation is associated with phosphatidylinositol 3-OH kinase (PI3K) and its downstream targets Akt, MAP kinase, Stat, and NF-κB signaling pathways [
33]. Our transcriptomic data showed that several of these
Axl downstream pathways were significantly downregulated by BTEE treatment.
Several TFs that directly act on the AXL promotor were found to be enriched by the downregulated DEGs (
Figure 9F), such as
Sp1/
Sp3 and hypoxia-inducible factor 1α (
Hif1α) [
34].
Additionally, chemical/drug perturbation analysis of the downregulated DEGs showed several known
Axl inhibitors, such as cabozantinib [
35], iguratimod [
36], fostamatinib [
37], and lapatinib [
38] (
Figure 10A–D). Finally, gene–disease association enrichment analysis predicts the potential of BTEE in several inflammatory and skin diseases (
Figure 10E). Altogether, our enrichment and network analyses suggest that the pattern of biological processes and pathways modulated by BTEE treatment is similar to those found in
Axl inhibitors.
Growth arrest-specific 6 (GAS6), an AXL ligand, has been well reported to bind to the receptor and to initiate a series of AXL downstream signaling factors [
39,
40]. In our study, we could not find any effect of BTEE on
Gas6 expression. However, AXL activation does not depend on GAS6 ligand-dependent dimerization only; instead, it exhibited several activation patterns, including GAS6 ligand-independent dimerization, heterophilic dimerization of AXL with a TAM family member (like MER or TYRO3) or with a non-TAM family protein, and ligand-independent activation through transcellular homophilic binding [
28]. Therefore, further studies need to clarify the mechanism of BTEE in interfering
Axl activation.
Accumulating evidence supporting the role of AXL in inflammation, and cancer progression, metastasis, and treatment resistance [
41,
42,
43,
44,
45], resulted in increased research attention on AXL inhibitors. Our study suggests that BTEE may exhibit anti-inflammatory effects by attenuating LPS-induced
Axl expression.
One aspect that needs to be addressed is that we used murine macrophage RAW264 cell line, an established in vitro model used interchangeably as putative analogs to human macrophages [
20,
46], in our study to examine the anti-inflammatory activities of BTEE. However, since the targeted outcome for most anti-inflammatory pharmacological and biomaterial research and development is proven to have efficacy and safety in humans, further testing of BTEE in human cell lines and in vivo is necessary.
Based on the above, BTEE is anticipated to be employed as a raw ingredient in nutraceuticals and functional foods to prevent or treat chronic inflammation as well as in cosmetics. According to our previous studies, the key components of BTEE include hydrocarbons, botryococcene, and methylated-meijicoccene, which have potential hair growth-promoting and anti-stress benefits [
17,
18]. We also examined the anti-inflammatory effects of botryococcene and methylated-meijicoccene on the LPS-mediated inflammatory responses in RAW264 cells; however, no significant effects were observed in the range of treatment concentrations of these compounds. Therefore, identifying the active compounds for the anti-inflammatory effects of BTEE is yet to be achieved.
4. Materials and Methods
4.1. Preparation of BTEE
Lyophilized powder of BT TEPMO-26 (100 mg) was extracted with 1 mL of 70% Ethanol at room temperature and in the dark for two weeks [
17]. After the extraction, the sample was centrifuged at 1000×
g for 10 min, and the supernatant was collected. The extracted sample’s supernatant was filtered through a 0.22 µm filter unit and stored at −20 °C in the dark until use.
4.2. Cell Culture of RAW264 Cells
RAW264 cells (Resource No. RCB0535) were purchased from RIKEN BioResource Center (RIKEN BRC, Tsukuba, Ibaraki, Japan). RAW264 cells were cultured in Dulbecco’s modified Eagle medium (DMEM) (Merck KGaA, Darmstadt, Germany) supplemented with 10% heat-inactivated fetal bovine serum (FBS) (Bio West, Nuaillé, France) and penicillin-streptomycin solution (Merck KGaA, Darmstadt, Germany) at 37 °C in a humidified incubator containing 5% CO2 using 75 cm2 flask (BD FALCON, Corning, NY, USA).
4.3. MTT Assay
To evaluate the effect of BTEE on cell viability, the MTT assay was performed. MTT reagent, 3-(4,5-dimethylthiazol-2-yl)-2,5-diphenyl tetrazolium bromide, was purchased from Dojindo Inc. (Kumamoto, Japan) [
9,
10].
In brief, RAW264 cells were seeded into a 96-well plate at the density of 2.0 × 10⁵ cells per well and incubated at 37 °C overnight. The RAW264 cells were treated with or without BTEE at 37 °C for 24 h. After treatment, MTT reagent was added to each well (10 μL/well) and incubated at 37 °C for 24 h. Then, the formazan crystal was dissolved with 100 μL of 10% Sodium Dodecyl Sulfate (SDS) (Fujifilm Wako Pure Chemical Co., Osaka, Japan) in each well and incubated overnight at 37 °C.
The absorbance was measured at 570 nm using a microplate reader, VARIOSKAN LUX (Thermofisher Scientific, Waltham, MA, USA). The values were normalized to the value of the medium and calculated as the percentage of control.
4.4. Preparation of LPS
LPS (E. coli O111:B4) was purchased from EMD Millipore Co. (Billerica, MA, USA). A total of 5 mg of LPS was dissolved in 2 mL of PBS (-) and stored at −80 °C in the dark until use. After the treatment, LPS solution (1 ng/mL) was added to each well and incubated for 16 h at 37 °C.
4.5. Measurement of NO Production
The Griess method measures the concentration of NO
2 by measuring the absorbance of the diazo compound generated by the coupling reaction (Griess reaction) [
9,
10]. RAW264 cells were seeded into a 96-well plate at 2.0 × 10
5 cells/mL density and incubated at 37 °C for 24 h. The cells were treated with or without BTEE at 37 °C for 24 h.
After the BTEE treatment, the LPS solution (1 ng/mL) was added to each well and incubated for 16 h at 37 °C. Then, the supernatant of the cell culture medium was mixed 1:1 with the Griess reagent (1% sulfanilic acid and 0.1% N-(1-Naphthyl) ethylenediamine Dihydrochloride in 2.5% phosphoric acid). The absorbance was measured at 540 nm using a microplate reader (VARIOSKAN LUX, Thermofisher Scientific), and the nitrite concentration was determined by a dilution of sodium nitrite (NaNO2) as a standard. Sulfanilic acid, Phosphoric acid, and NaNO2 were purchased from Fujifilm Wako Pure Chemical Co. N-(1-Naphthyl) ethylenediamine Dihydrochloride was purchased from Tokyo Chemical Industry Co., Ltd., (Tokyo, Japan).
4.6. RT-qPCR Analysis of Gene Expression in RAW264 Cells
RT-qPCR was performed to evaluate the effect of BTEE on gene expression in RAW264 cells [
10,
15]. For the quantification of gene expression, the TaqMan probe was used. Total RNA was extracted using ISOGEN (Nippon Gene Co., Ltd., Tokyo, Japan) following the manufacturer’s instructions. RAW264 cells were seeded at 2.0 × 10
5 cells/mL in 6-well dishes (BD FALCON, Corning) and incubated for 24 h at 37 °C. After that, cells were treated with or without 0.2 mg/mL BTEE and incubated for 24 h at 37 °C. After the treatment, LPS solution (1 ng/mL) was added to each well and incubated for 0, 6, or 17 h at 37 °C. After that, cells were lysed with 1 mL of ISOGEN. The lysates were obtained, and RNA was quantified using a Nanodrop 2000 spectrophotometer (Thermofisher Scientific). Next, reverse transcription reactions were carried out using SuperScript IV VILO Master Mix (Thermofisher Scientific) following the manufacturer’s instructions. For the quantification of amounts of transcripts, the TaqMan real-time RT-PCR amplification reactions were performed using the Applied Biosystems 7500 Fast Real-Time System (Thermofisher Scientific) following the manufacturer’s instructions.
All the primer sets and TaqMan Universal PCR Master mix were purchased from Thermofisher Scientific. Specific primers Glyceraldehyde-3-phosphate dehydrogenase (Gapdh) (Mm99999915_g1), Ccl2 (Mm00441242_m1), Tnf (Mm00443258_m1), Cox2 (Mm00478374_m1), iNos2 (Mm00440502_m1), Il6 (Mm00446190_m1), Il1b (Mm00434228_m1), Il10 (Mm01288386_m1), Atf3 (Mm00476032_m1), Socs1 (Mm00782550_s1), and Pgc1β (Mm00504730_m1) were used. Results of the mRNA levels of all genes were normalized using Gapdh as an internal control.
4.7. DNA Microarray Analysis for Gene Expression Profiling in RAW264 Cells
DNA microarray analysis was conducted following the manufacturer’s instructions provided by Thermofisher Scientific. In brief, as described above, total RNA from RAW264 cell was extracted using ISOGEN. Synthesis and in vitro transcription of complementary DNA (cDNA), purification and reverse transcription of cRNA, and synthesis, purification, fragmentation, and labelling of single-stranded cDNA (ss-cDNA) were performed using the GeneChip WT PLUS Reagent Kit (Thermofisher Scientific) following the manufacturer’s instructions. Cartridge Array Hybridization was performed using the cartridge array (Clariom S array, mouse; Thermofisher Scientific) on the GeneChip™ Fluidics Station (Thermofisher Scientific). Scanning was performed using the GeneChip Scanner (Thermofisher Scientific). Reagents from GeneChip™ Hybridization, Wash and Stain Kit were used for hybridization and scanning.
4.8. DNA Microarray Data Processing and Subsequent Analyses
The raw image data were normalized following the signal space transformation robust multi-chip analysis (SST-RMA) algorithm using the Transcriptome Analysis Console (TAC) software (ver. 4.0.2, Thermofisher Scientific). The SST-RMA method reduces background through GC Correction Version 4. Gene-level analysis was performed using the Limma Bioconductor package implemented in TAC software. One-way ANOVA followed by an empirical Bayes correction was performed for differential expression analysis. Detected Above Background (DABG) threshold was set to 0.05 and Pos/Neg area under the curve (AUC) threshold was set to 0.7. Finally, gene-level filter criteria were set as p value (one-way between-subject) <0.05 and fold change (in linear space) >1.5. Genes that passed the filter criteria were considered differentially expressed genes (DEGs). Subsequent analyses were performed using the DEGs between BTEE + LPS vs. LPS at 6 h (often refers to as 6H in the figures) and BTEE + LPS vs. LPS at 17-h conditions (often refers to as 17H in the figures).
Gene ontology (GO) and pathway enrichment analyses were performed using the web-based tool Metascape v3.5.20230101 (
http://metascape.org) (accessed on 8 January 2023) [
47]. TRRUST [
27] and DisGeNET [
30] databases were used for TF and disease–gene association enrichment analyses, respectively. PPI networks were built using the InnateDB Interactome database [
25] on the NetworkAnalyst tool version 3.0 (
https://www.networkanalyst.ca/NetworkAnalyst/home.xhtml) (accessed on 22 December 2022) [
48]. Heatmaps were generated using the Morpheus online tool (
https://software.broadinstitute.org/morpheus/) (accessed on 22 December 2022). Kinases coexpression and chemical perturbation analyses were performed on the Enrichr tool (
https://maayanlab.cloud/Enrichr/) (accessed on 22 December 2022) [
49] using the ARCHS4 [
26] and LINCS L1000 [
29] data sets, respectively.
4.9. Statistical Analysis
Results were expressed as mean ± standard deviations (SD). Student’s T-Test was used to determine the statistically significant difference between the means of the two groups. Graphs were prepared using Microsoft Excel software (version 2019).

 ,
, 


