
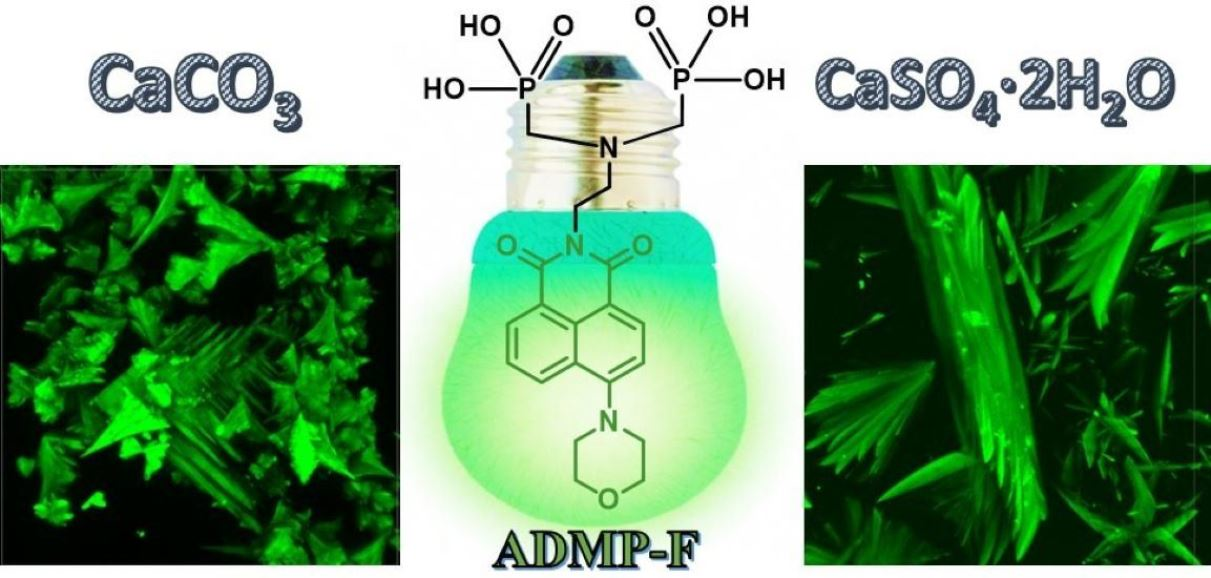
Fluorescent-Tagged Antiscalants—The New Materials for Scale Inhibition Mechanism Studies, Antiscalant Traceability and Antiscaling Efficacy Optimization during CaCO3 and CaSO4·2H2O Scale Formation

 ,
,  ,
, 
Abstract
:
1. Introduction
2. Results
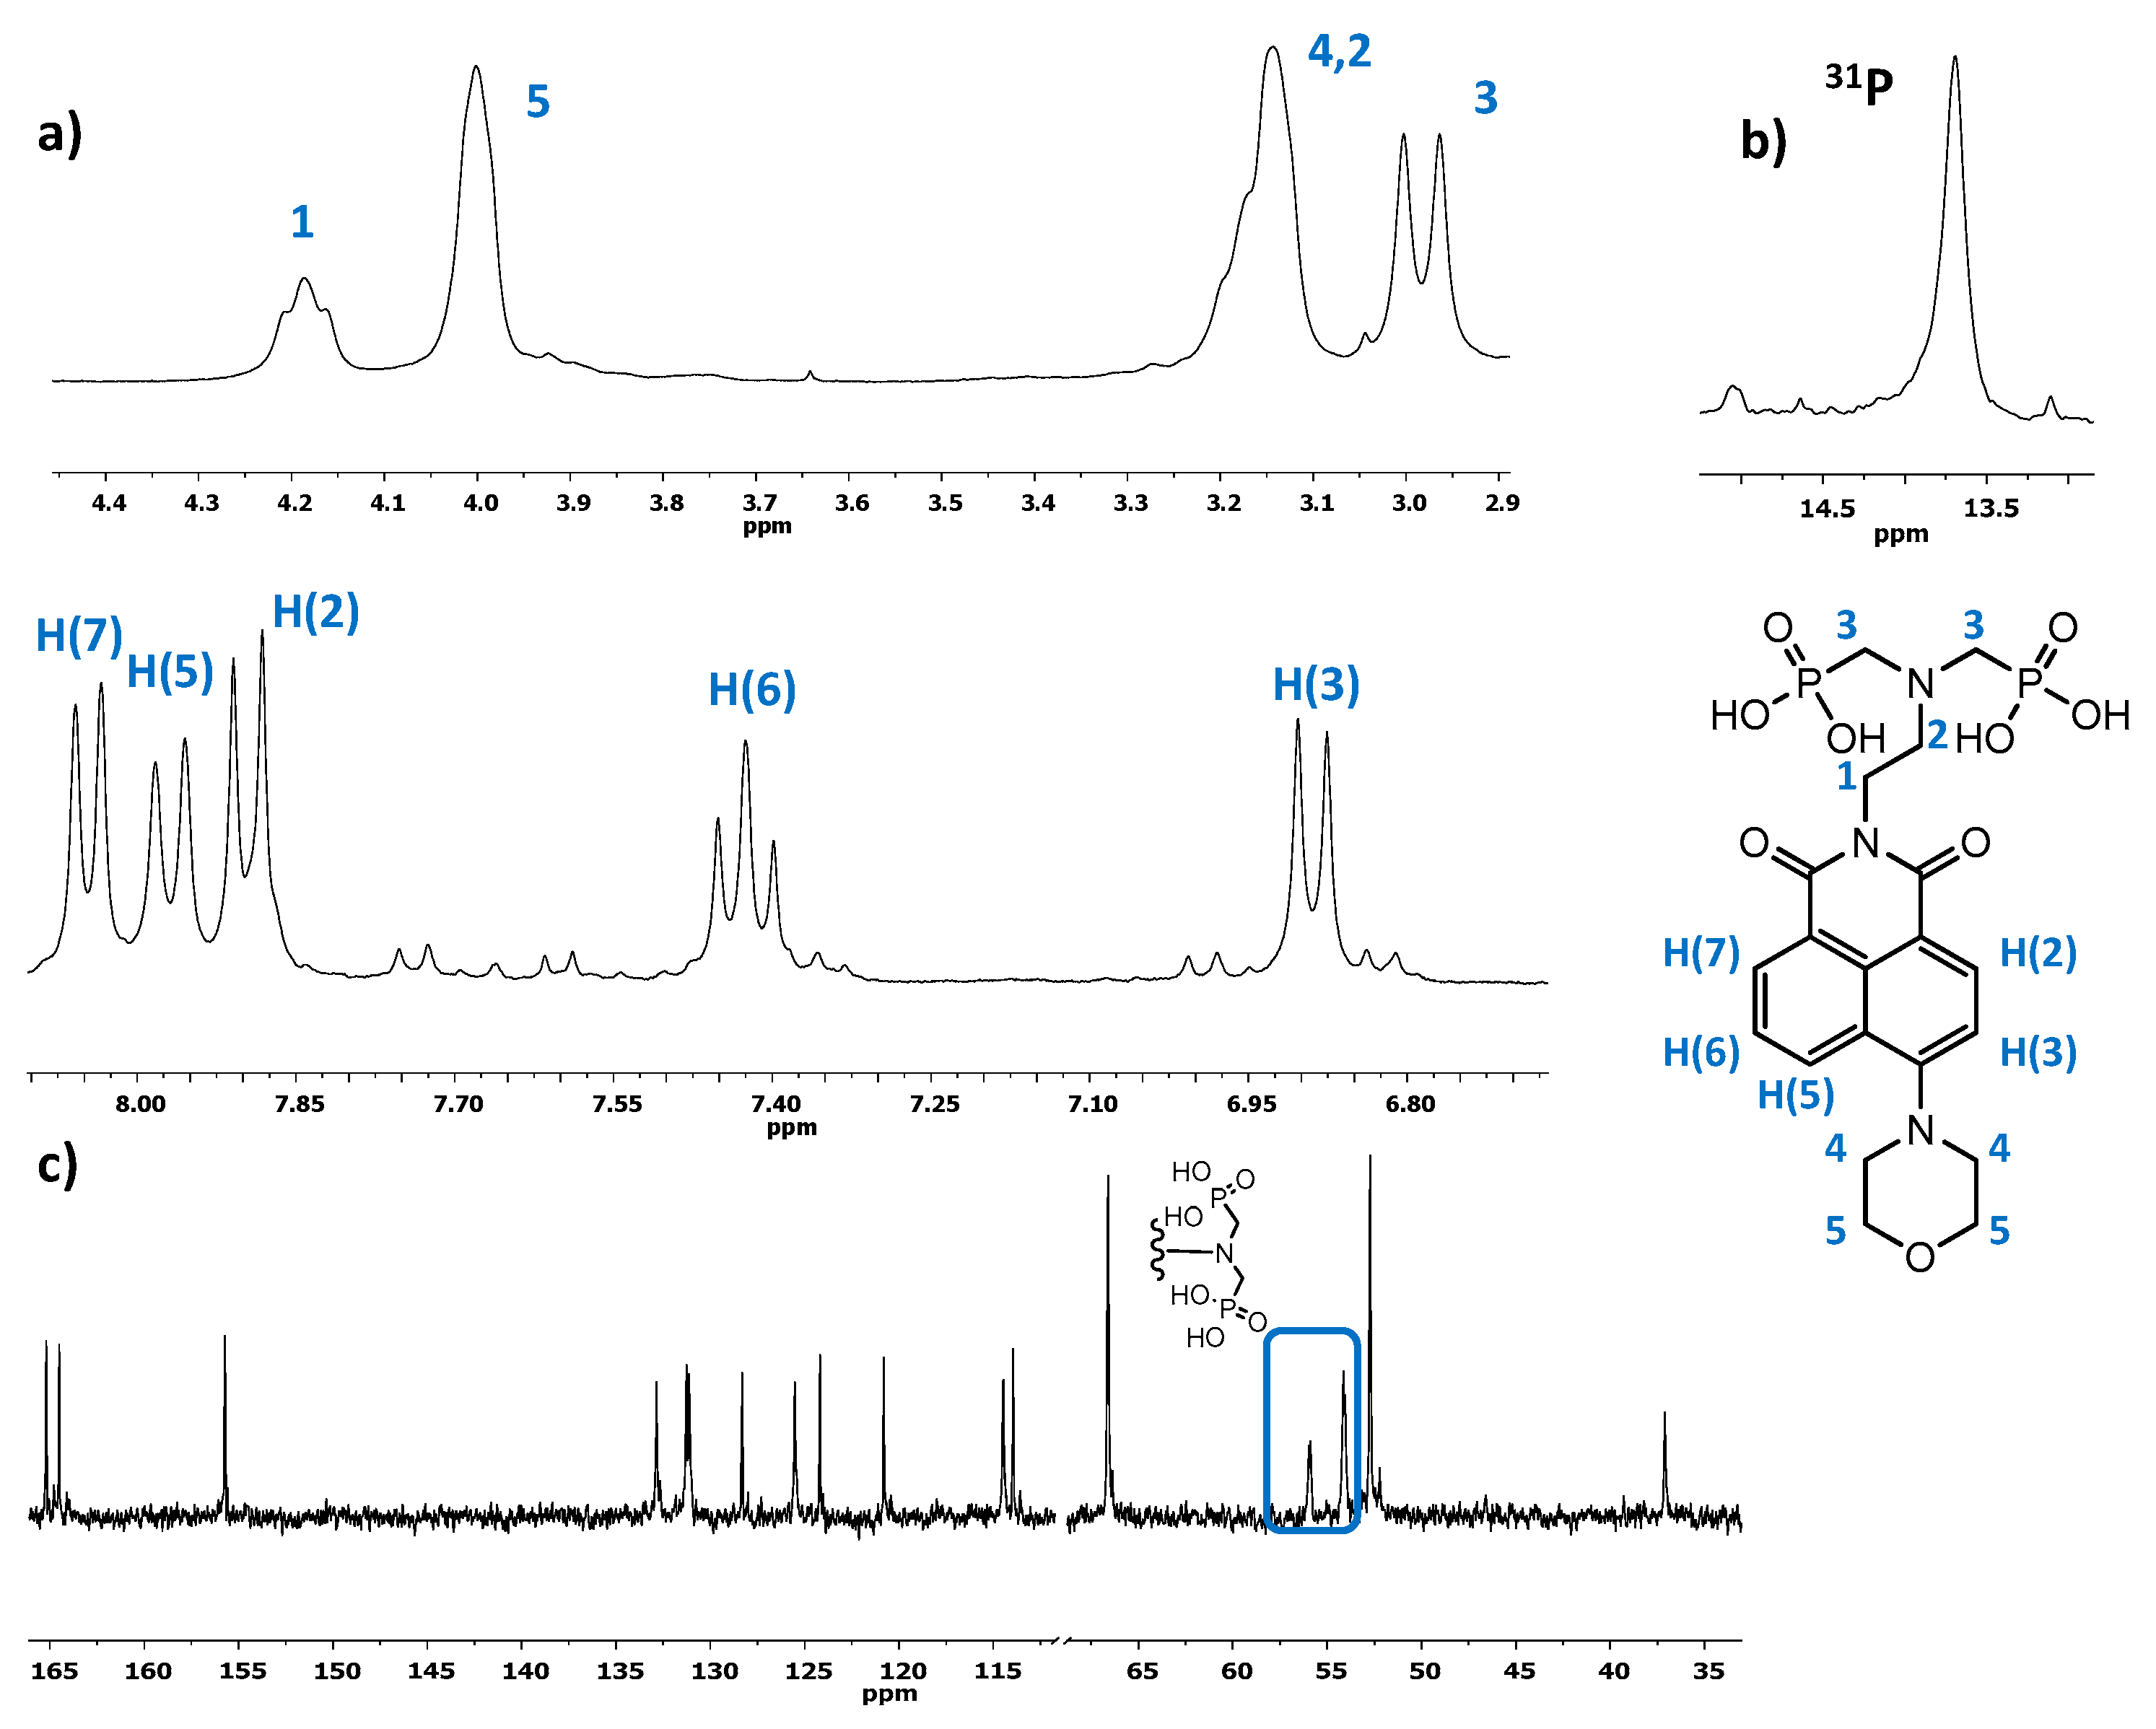
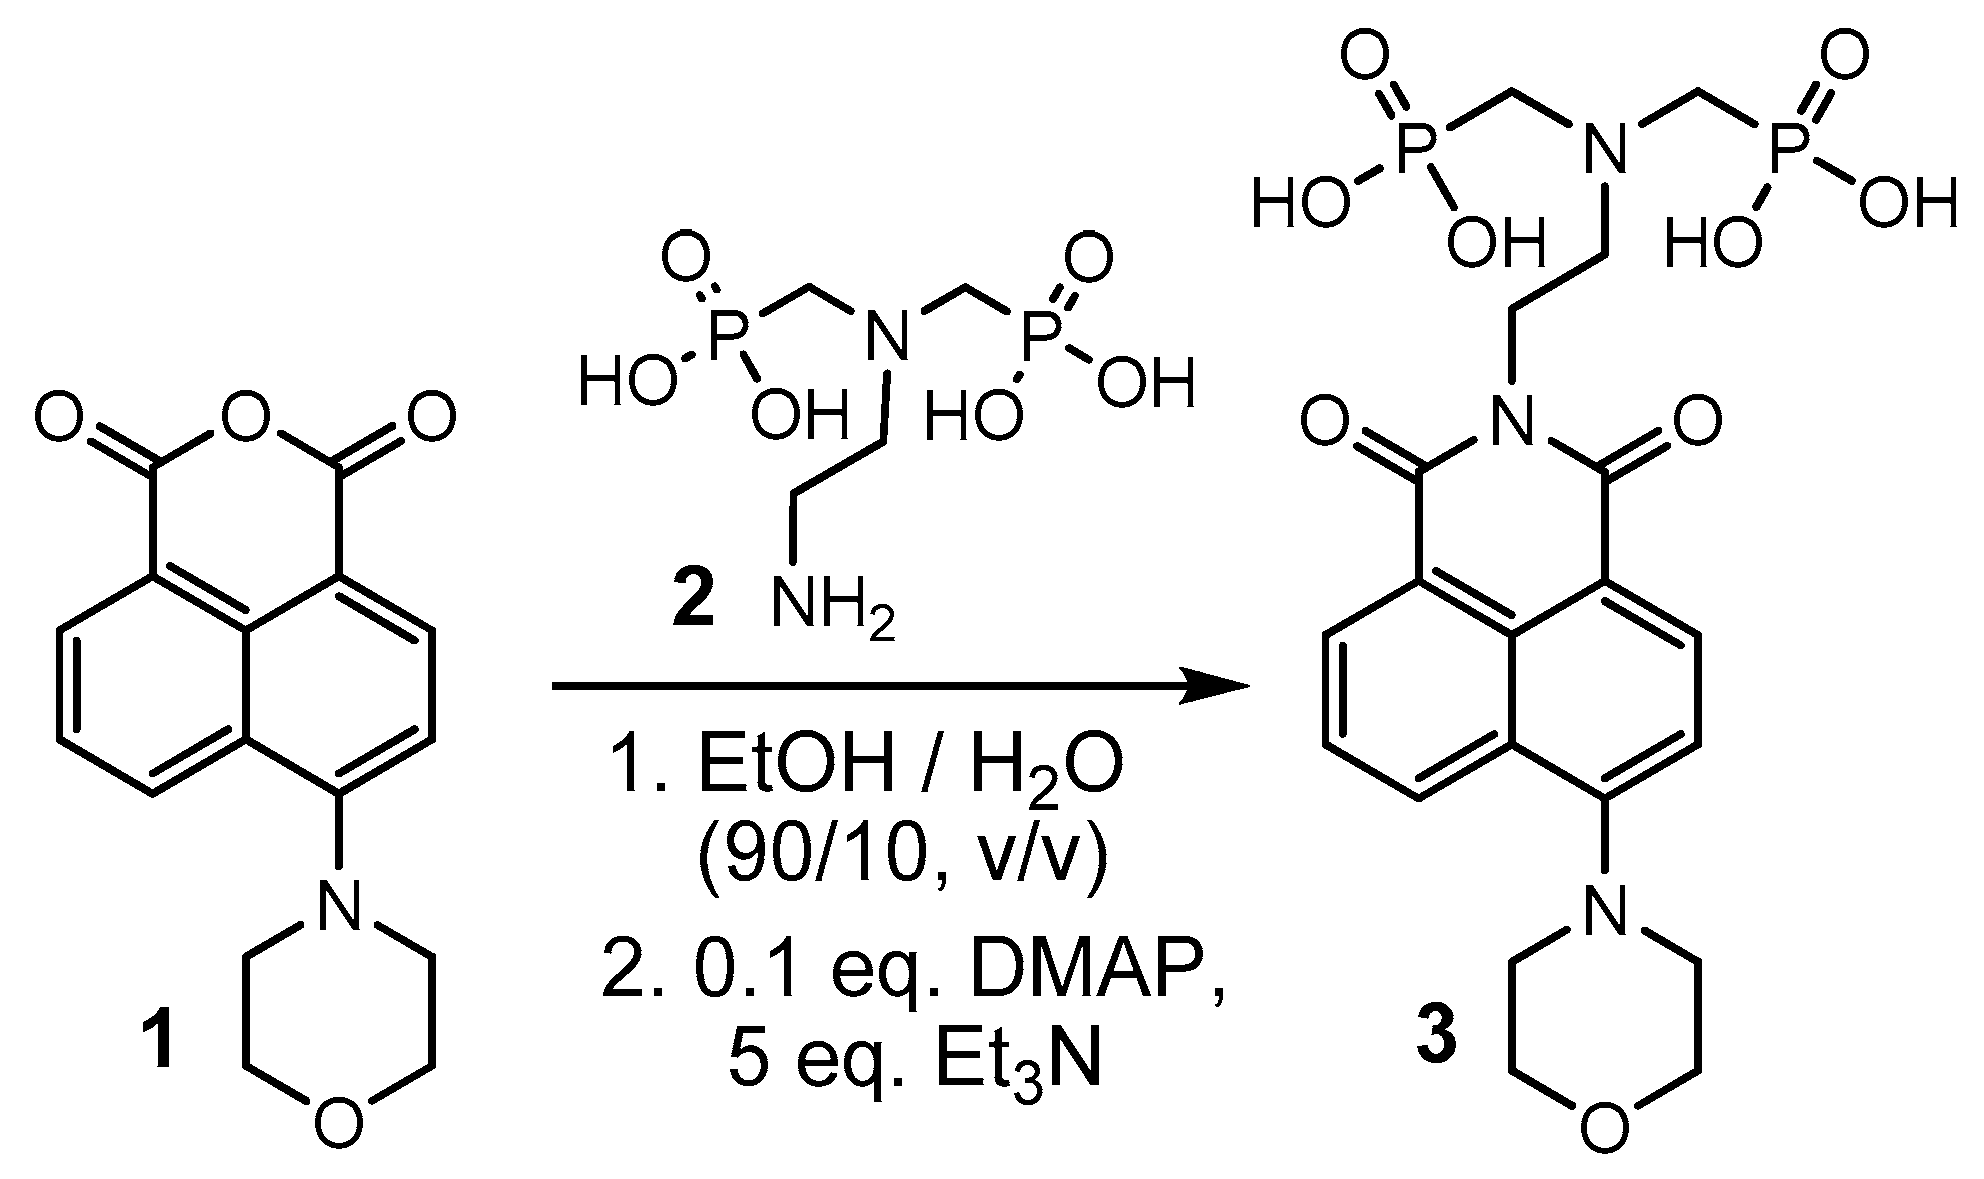
2.1. Synthesis of ADMP-F
2.2. ADMP-F Fluorescence Studies
2.3. Scale Inhibition Tests
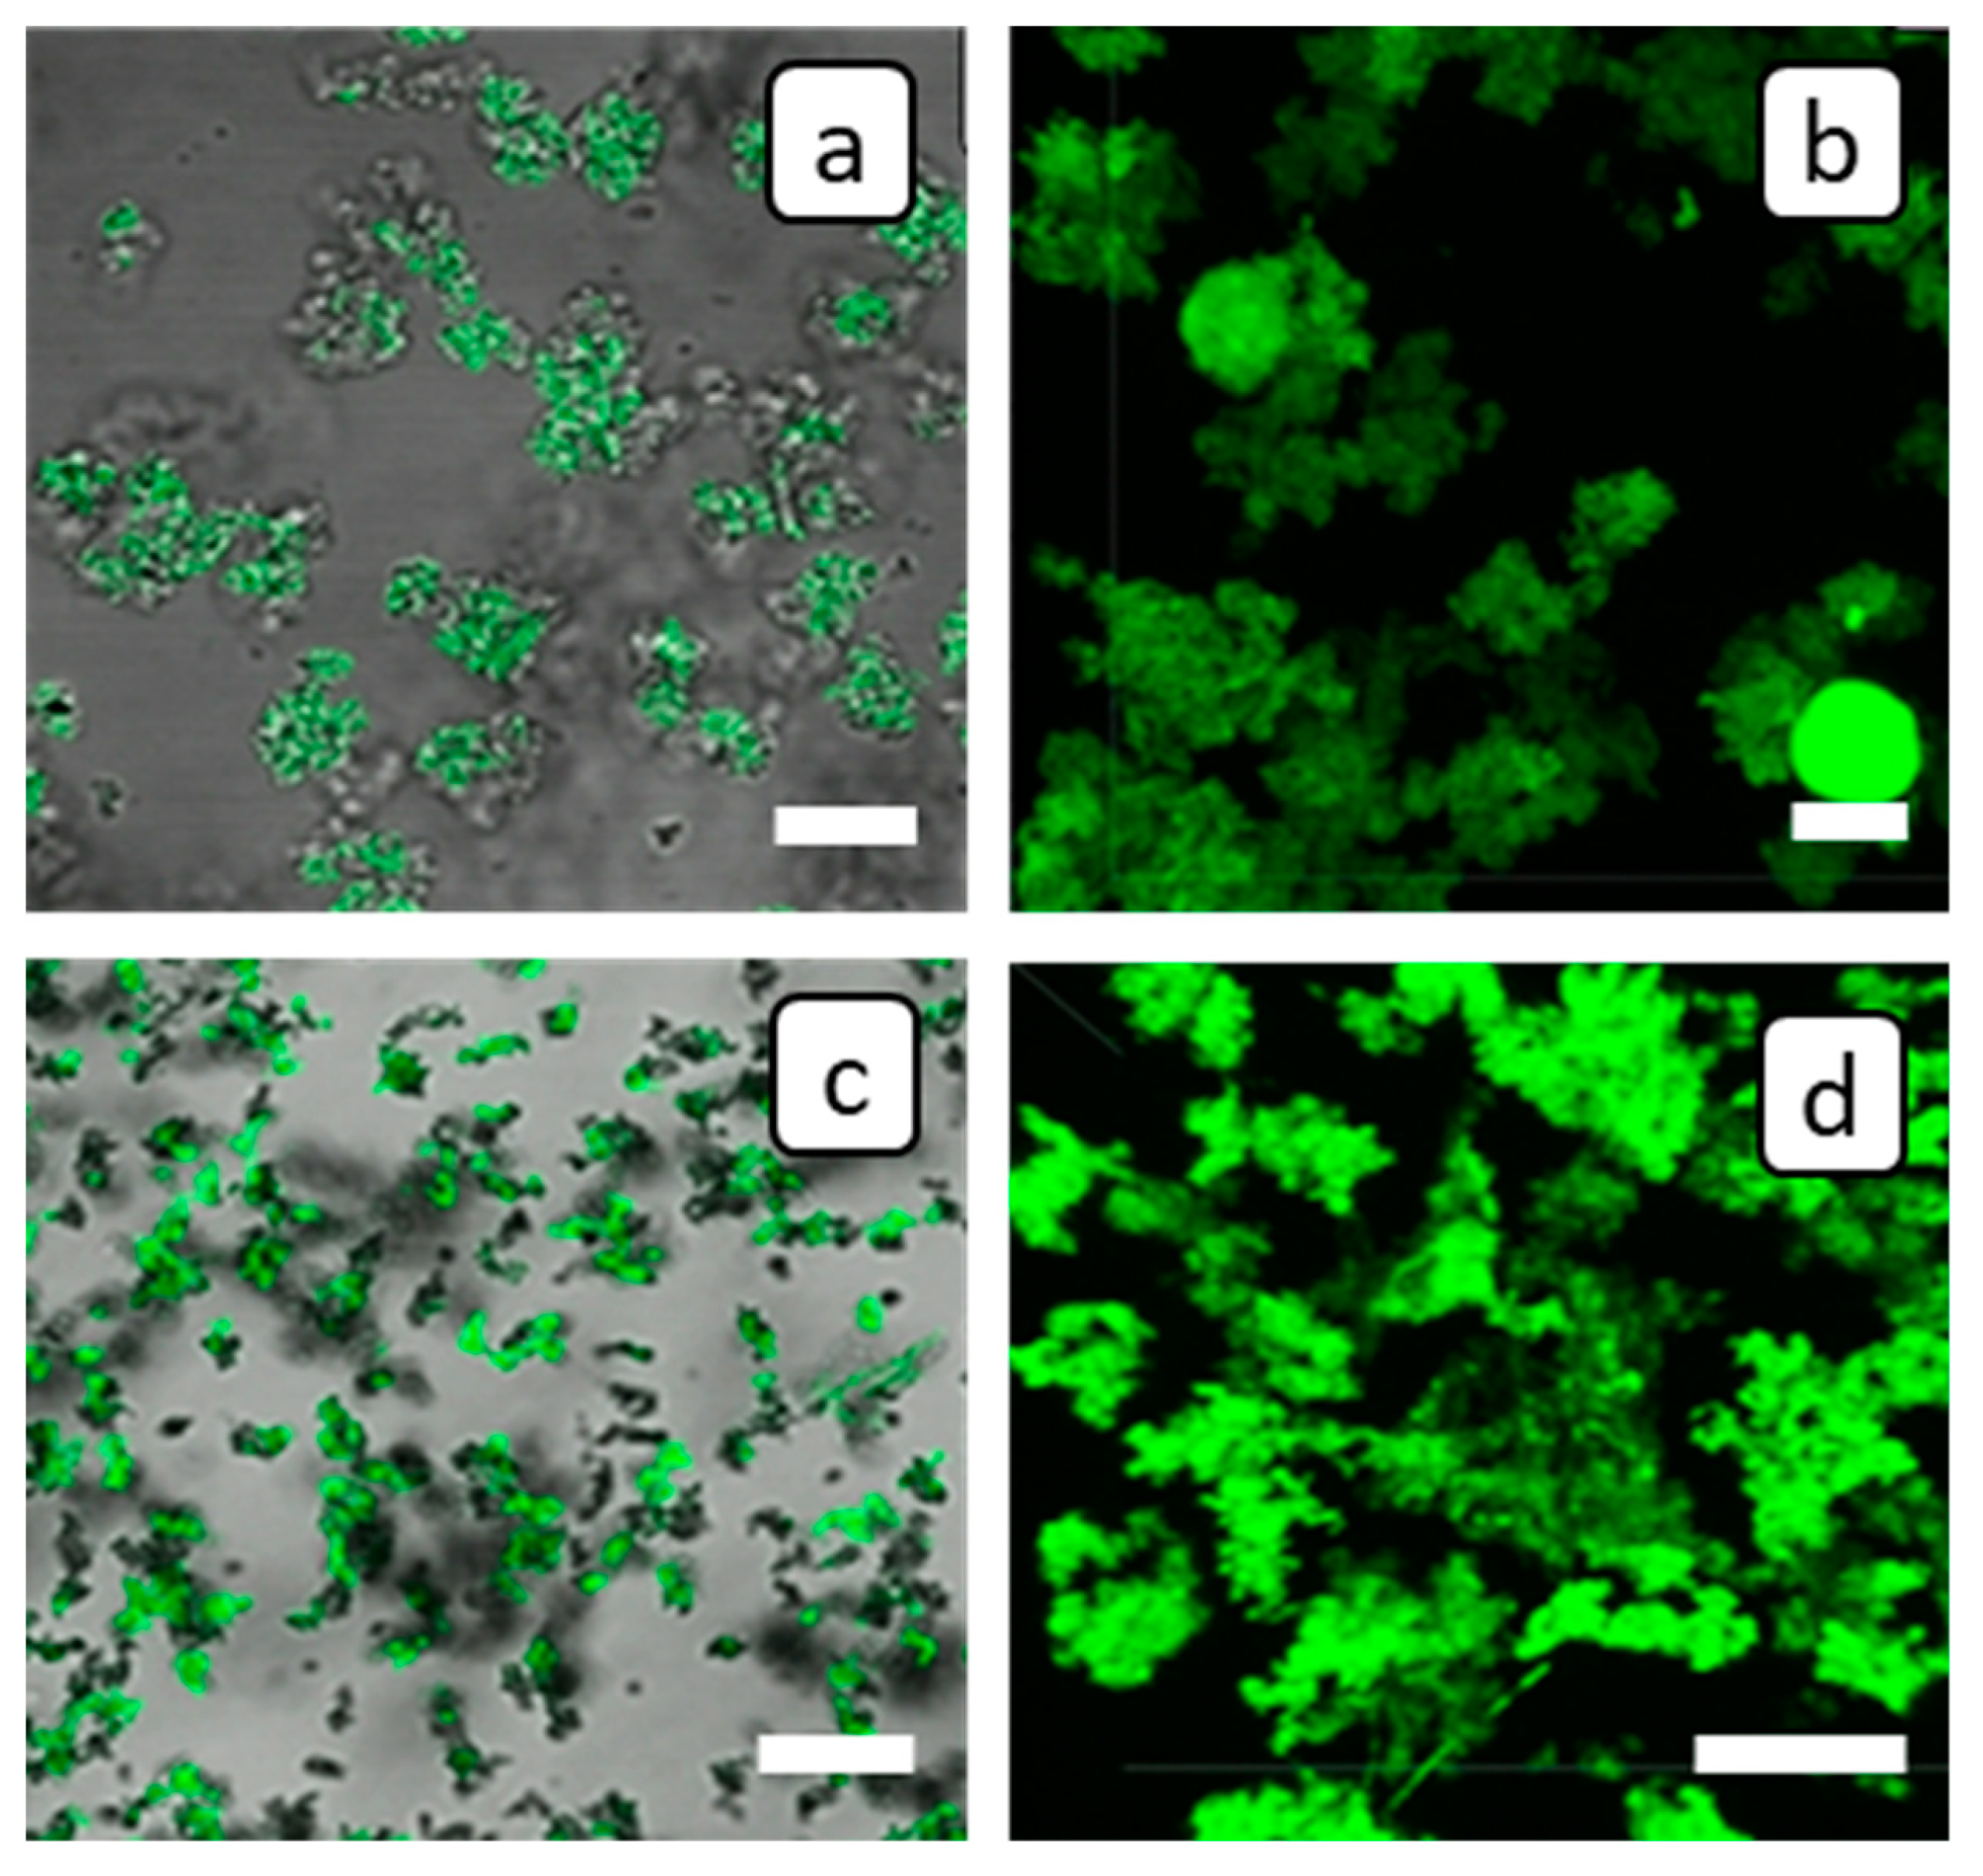
2.3.1. Calcium Carbonate Deposition Test
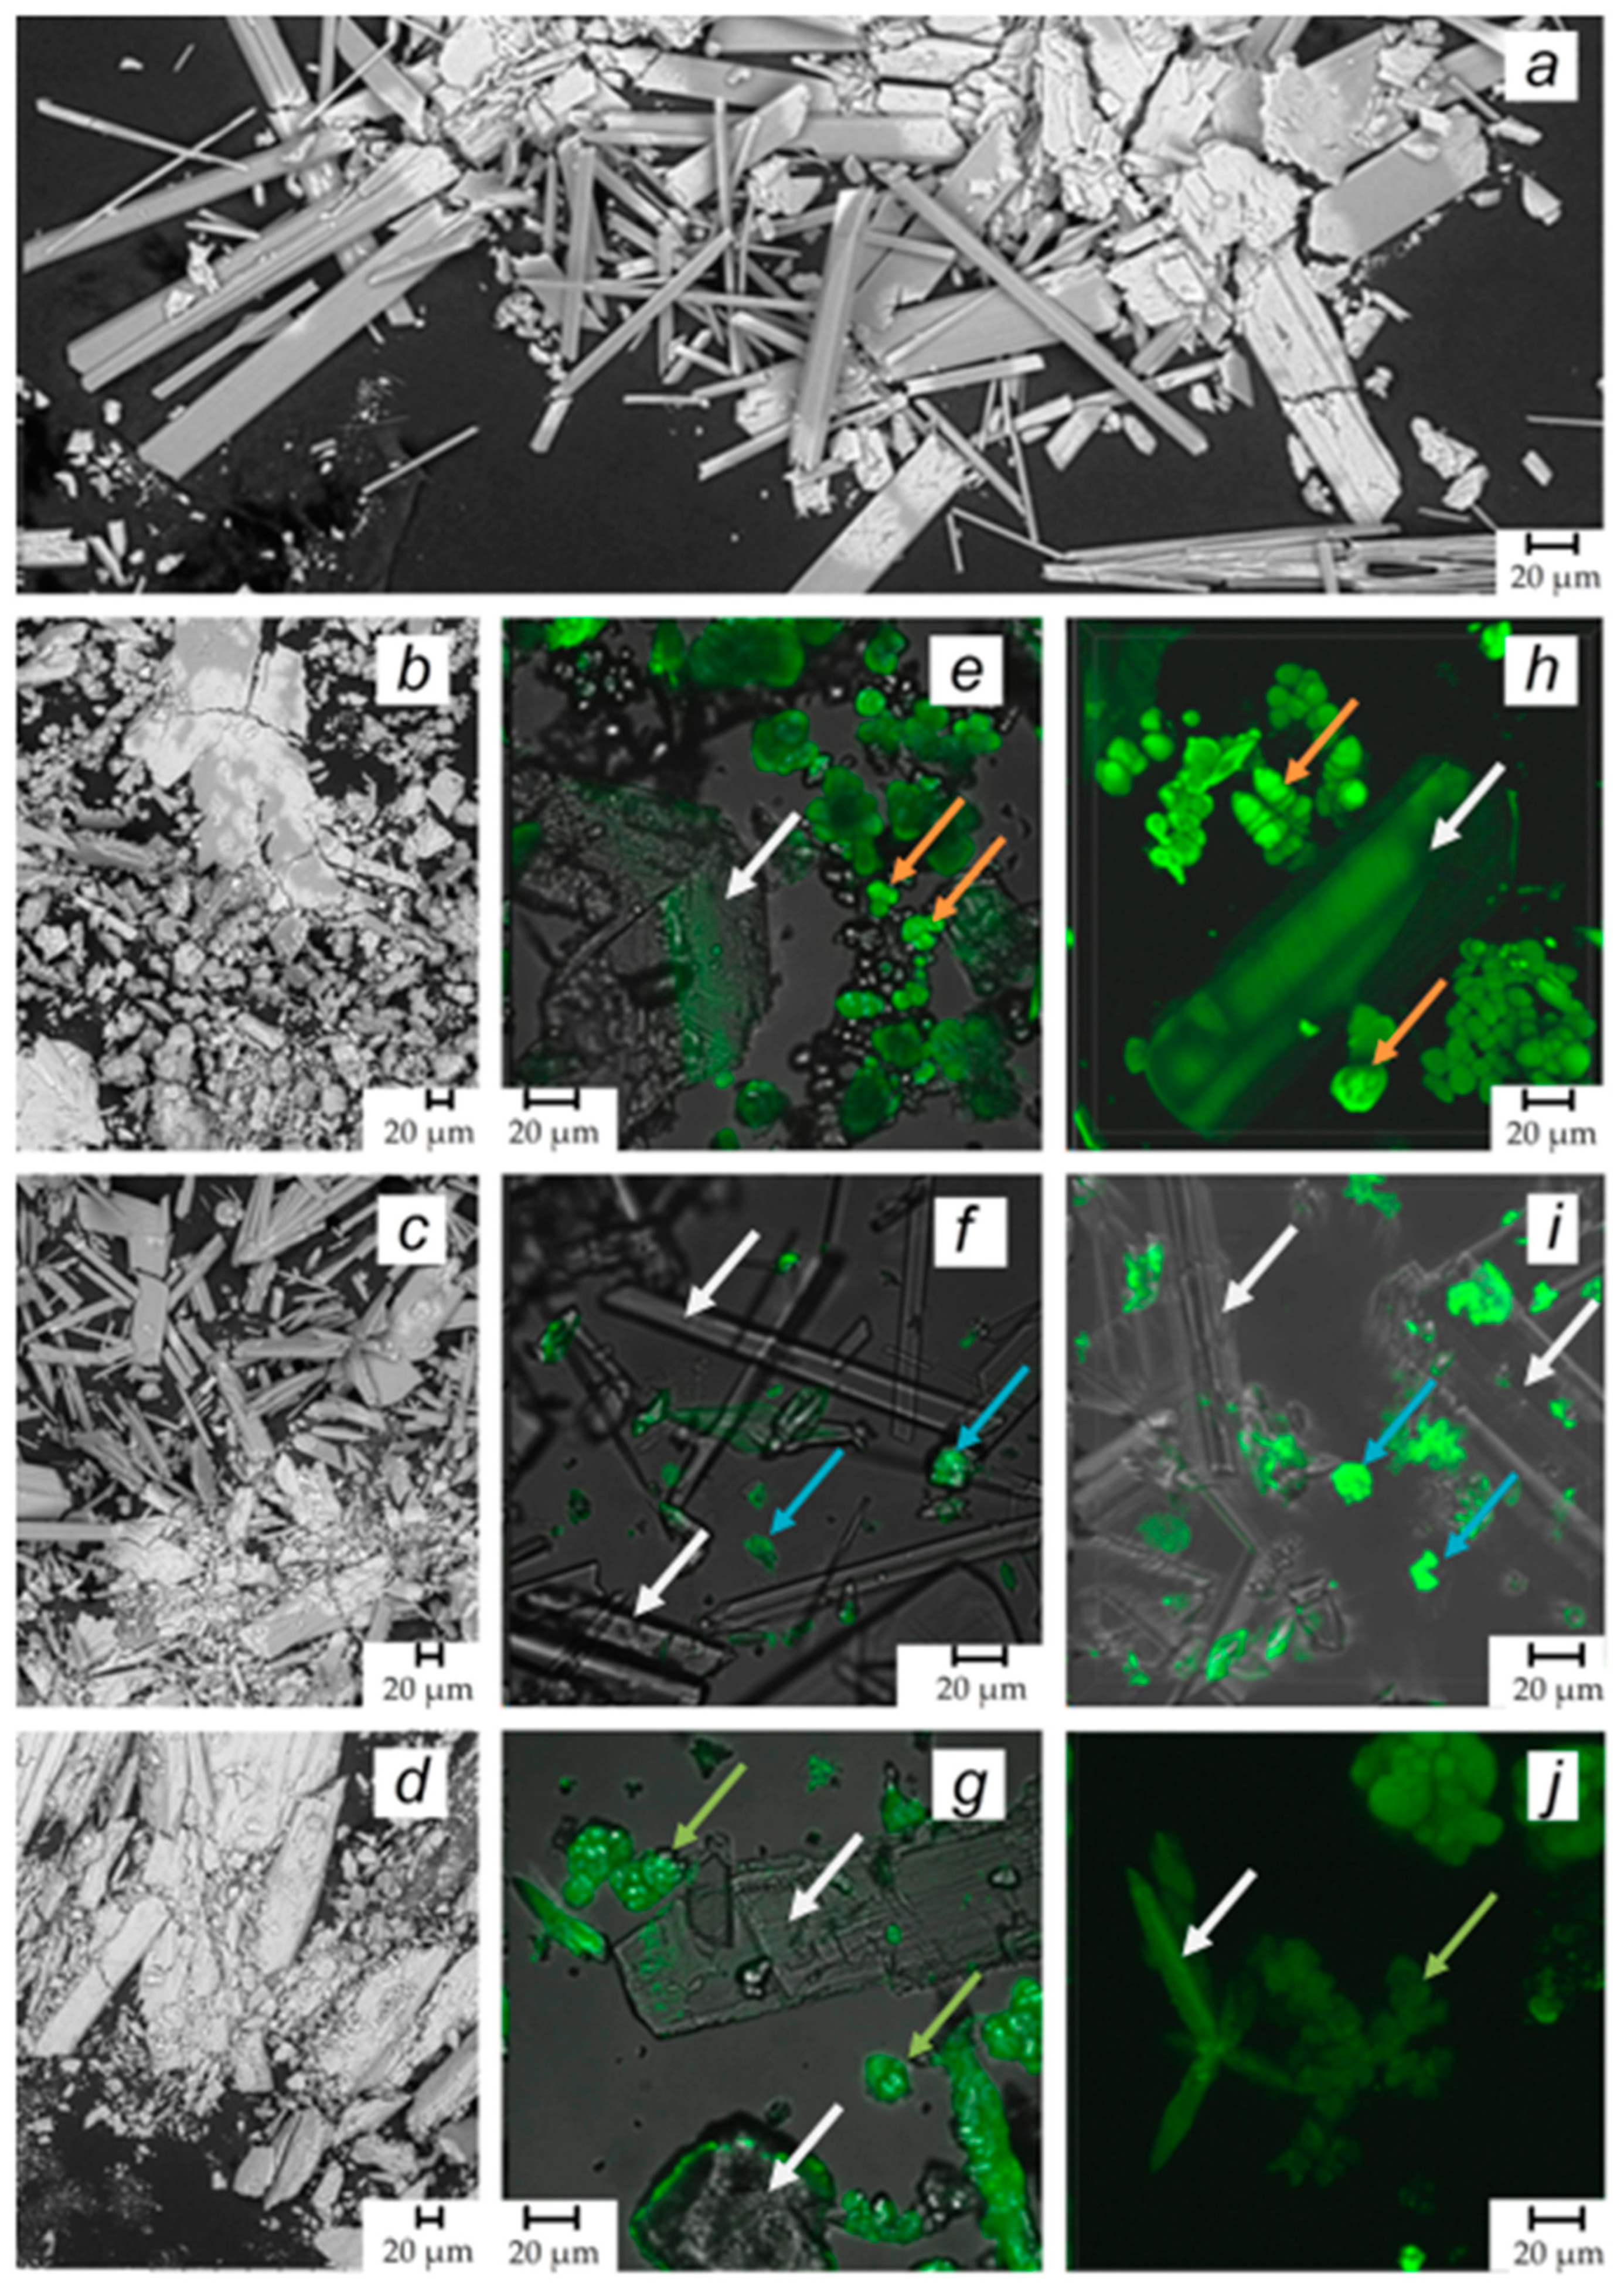
2.3.2. Calcium Sulfate Deposition Test
3. Discussion
- (i).
- The novel fluorescent antiscalant ADMP-F demonstrates excellent visualization capability and good inhibition activity against both CaCO3 and CaSO4·2H2O scales formed under conditions of slow supersaturation. Thus, ADMP-F may become a promising tracer of non-fluorescent organophosphonate scale inhibitors, such as ATMP or HEMPA, in various water treatment applications and a powerful tool for studying the mechanisms of scale inhibition phenomena.
- (ii).
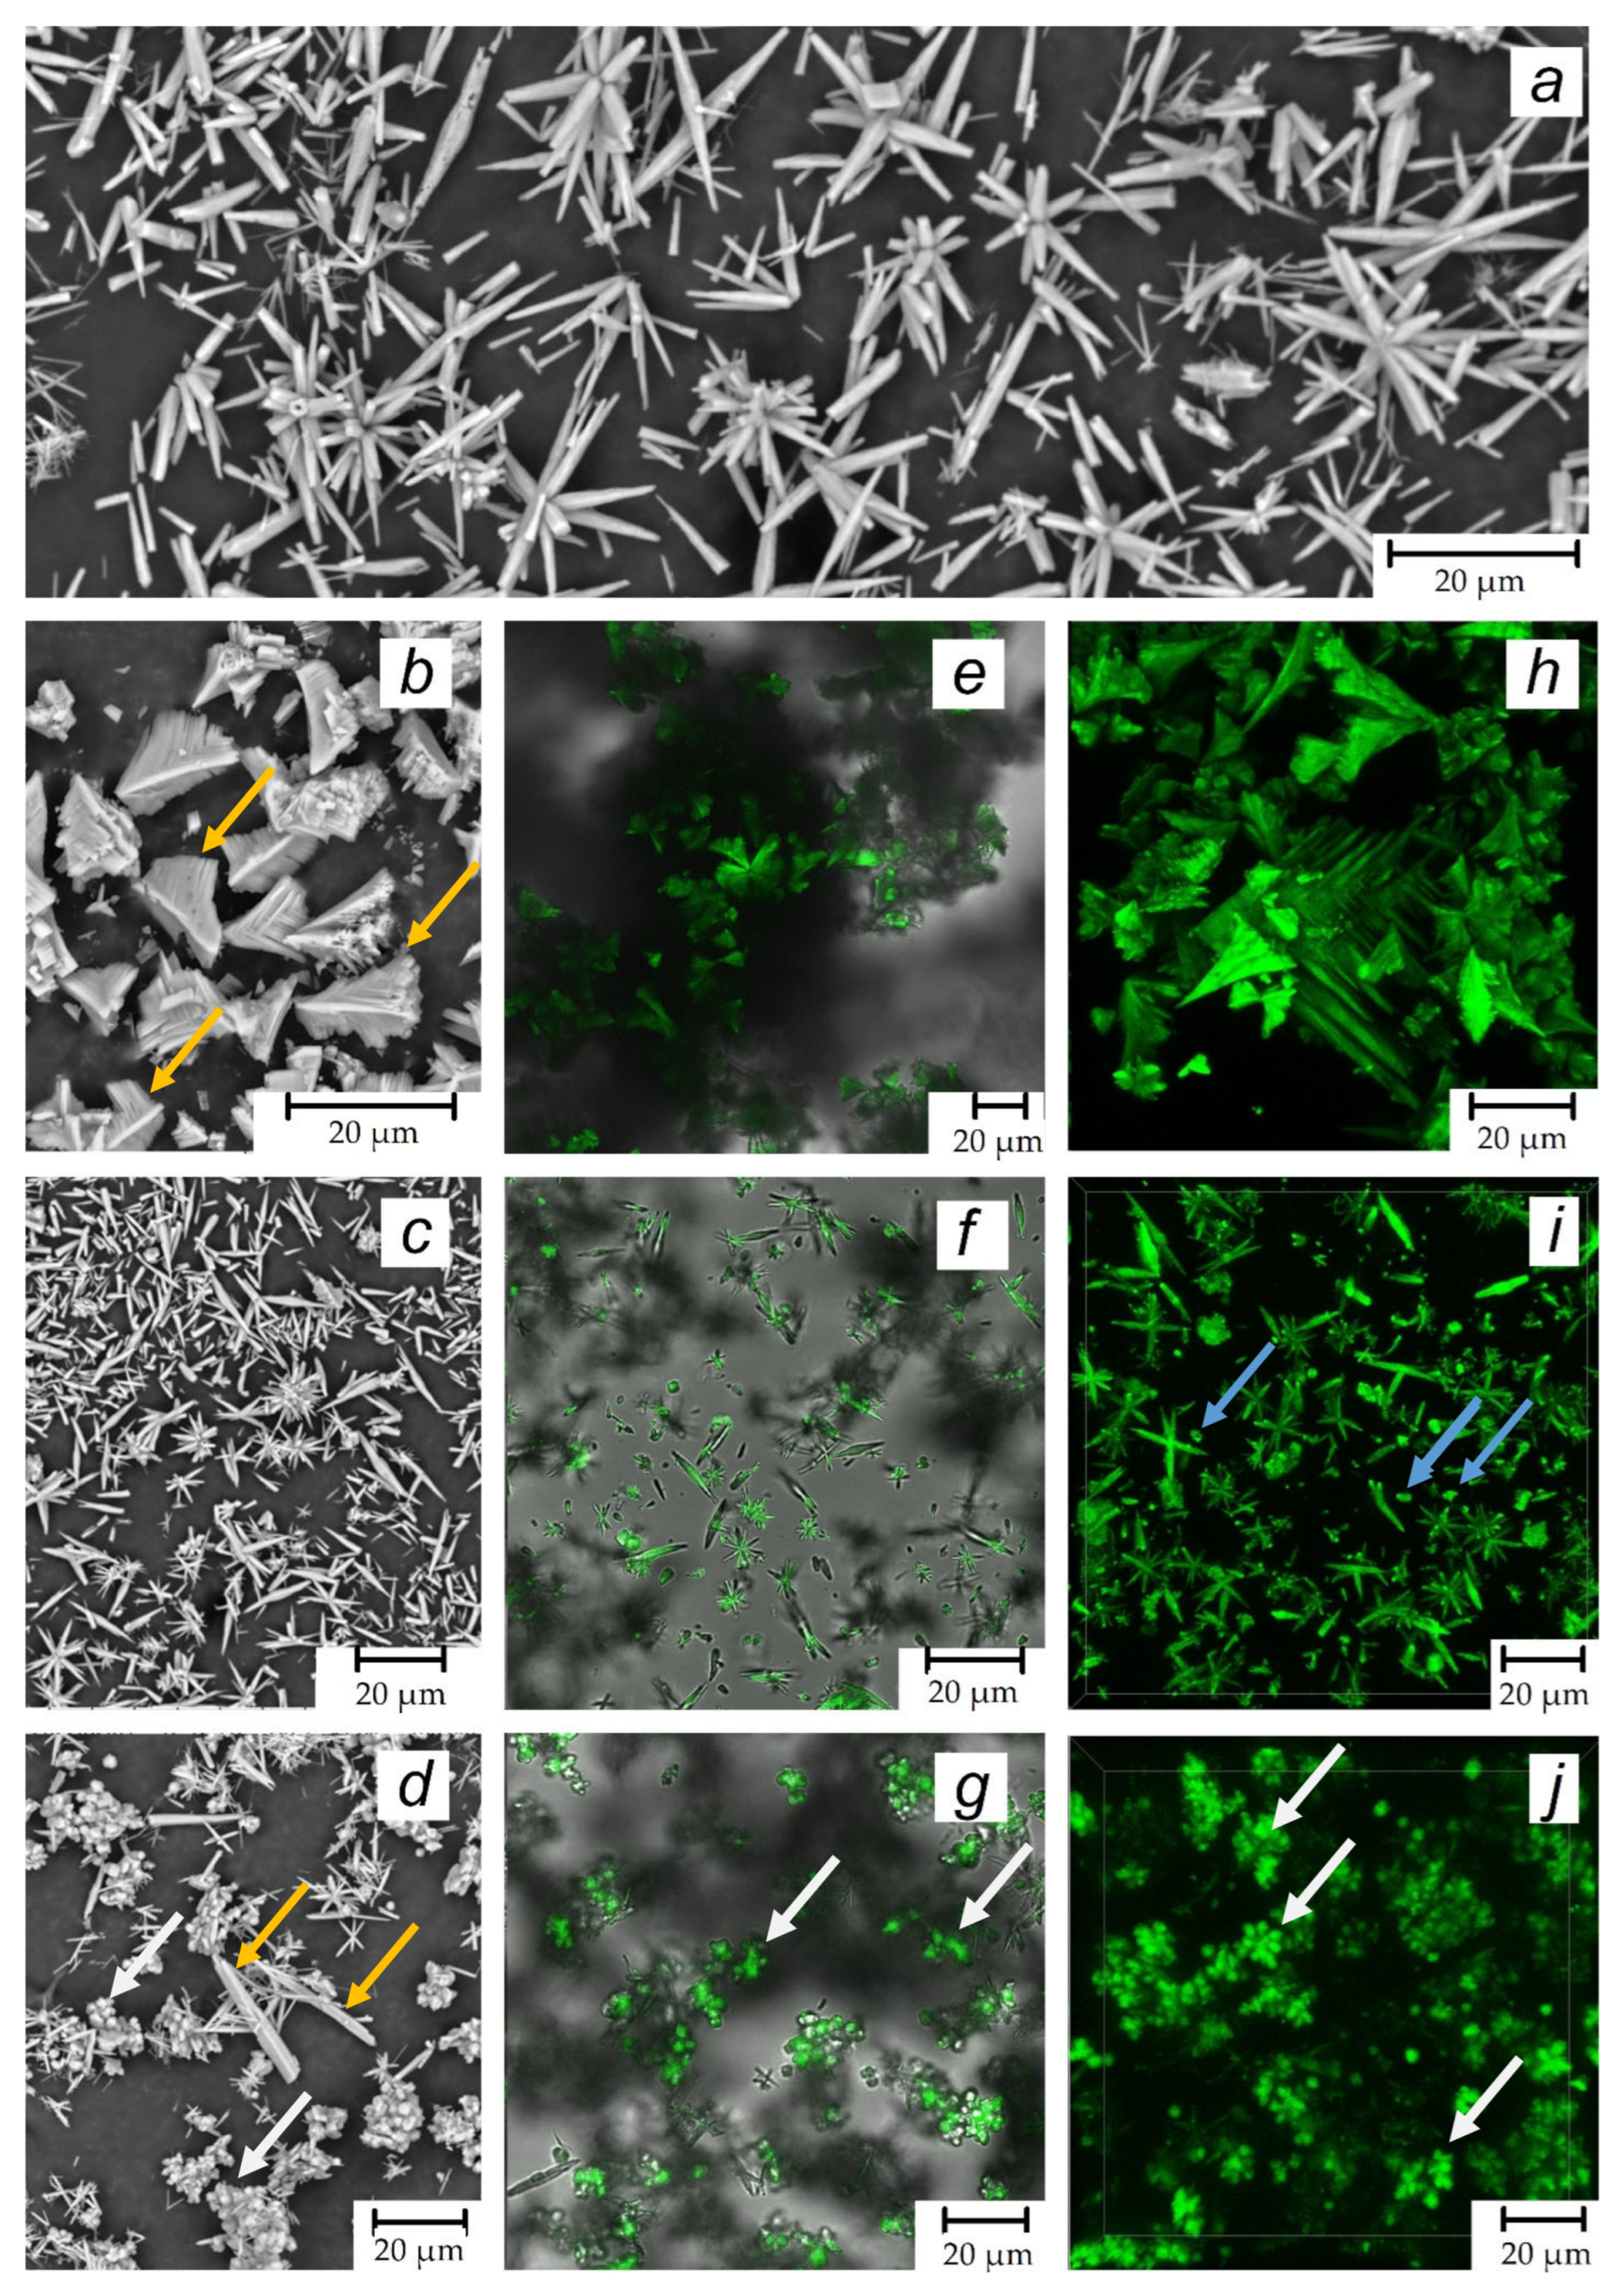
- The visualization of three fluorescent-tagged antiscalants of different natures during calcium carbonate and gypsum scale formation provided a unique opportunity to gain insight into inhibition mechanisms. Contrary to popular belief, there is no evidence to suggest that antiscalants are specifically located at kink, step, or on selected edge sites of growing calcium carbonate and gypsum crystals. Furthermore, there was no direct correlation detected between the effectiveness of the antiscalant and its ability to be adsorbed on the crystal surface, as is expected within the framework of conventional scale inhibition mechanisms. A paradoxical effect, which was first reported for HEDP-F in 2019, for gypsum crystallization at ambient temperature was reproduced again, but for evaporation plant conditions: the antiscalant does not interact with the scale but still provides inhibition.
- (iii).
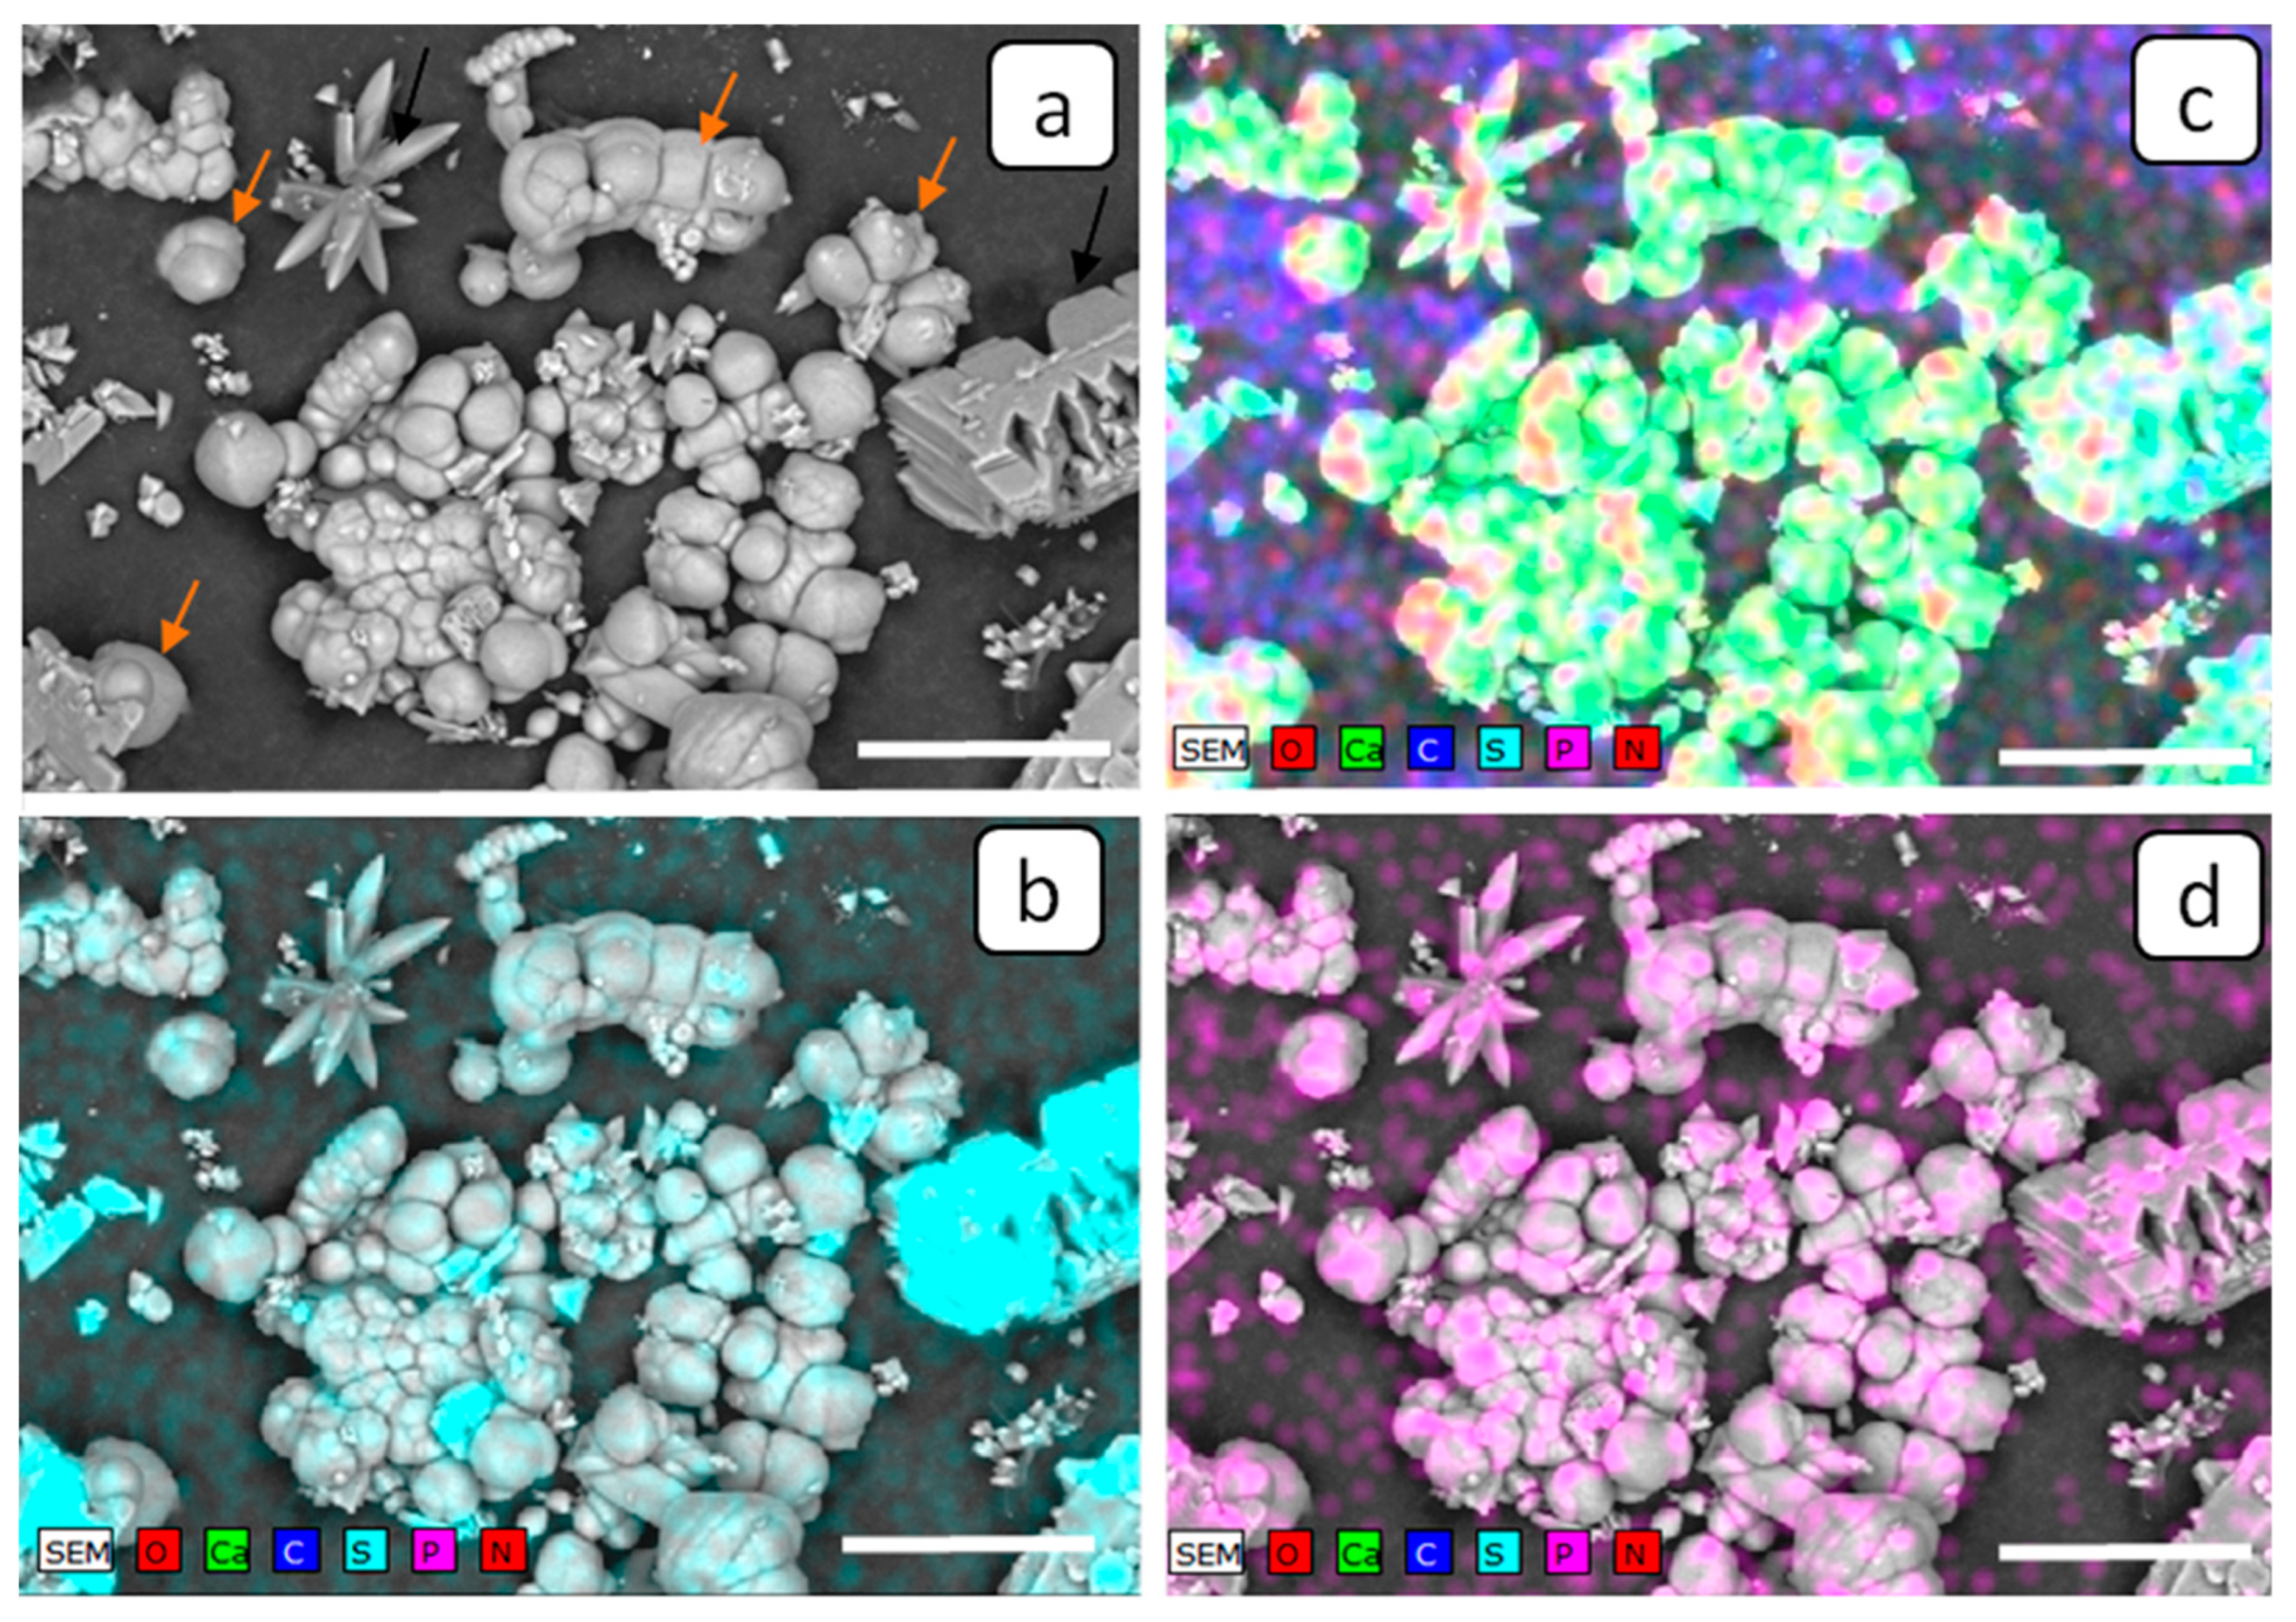
- Phosphorus-based antiscalants have been found to form their own phases with calcium ions. Most of these inhibitors have been shown to accumulate in such species but not on the surface of scale crystals. Despite this, scale inhibition will still take place, but the degree of success depends on how the antiscalant is injected. If the scale inhibitor is injected primarily into the sodium sulfate or sodium carbonate solution, it is expected to be more effective than if it is injected primarily into the calcium chloride solution. Therefore, this effect has to be taken into account in antiscalant screening procedures. In any case, it should become a standard practice to specify the method of antiscalant injection in any publication on the evaluation of the efficacy of scale inhibitors.
- (iv).
- This present study demonstrates that antiscalants of different natures reveal different behaviors and different locations on the deposit surfaces. Nevertheless, a universal explanation encompassing all these cases is possible if bulk heteronucleation is assumed. It takes place on natural solid nanoimpurities, which are inevitably present in any aqueous solution. An antiscalant blocks the surface of these nanoimpurities, thus hindering the nucleation step by reducing the number of potential nucleation centers.
- (v).
- A comparison of the efficacy of antiscalants, estimated within the framework of different static tests, based on different ways of achieving supersaturation has shown that for particular cases of calcium carbonate scum formation and gypsum deposition within the evaporation process, the same ranking of antiscalants is obtained as in the internationally recognized static NACE test, although the mechanisms of scale formations in the latter case are different. However, the validity of dynamic tests for the same processes seems unclear and requires further study.
4. Materials and Methods
Author Contributions
Funding
Institutional Review Board Statement
Informed Consent Statement
Data Availability Statement
Acknowledgments
Conflicts of Interest
Abbreviations
| ATMP | Aminotris(methylenephosphonic acid) |
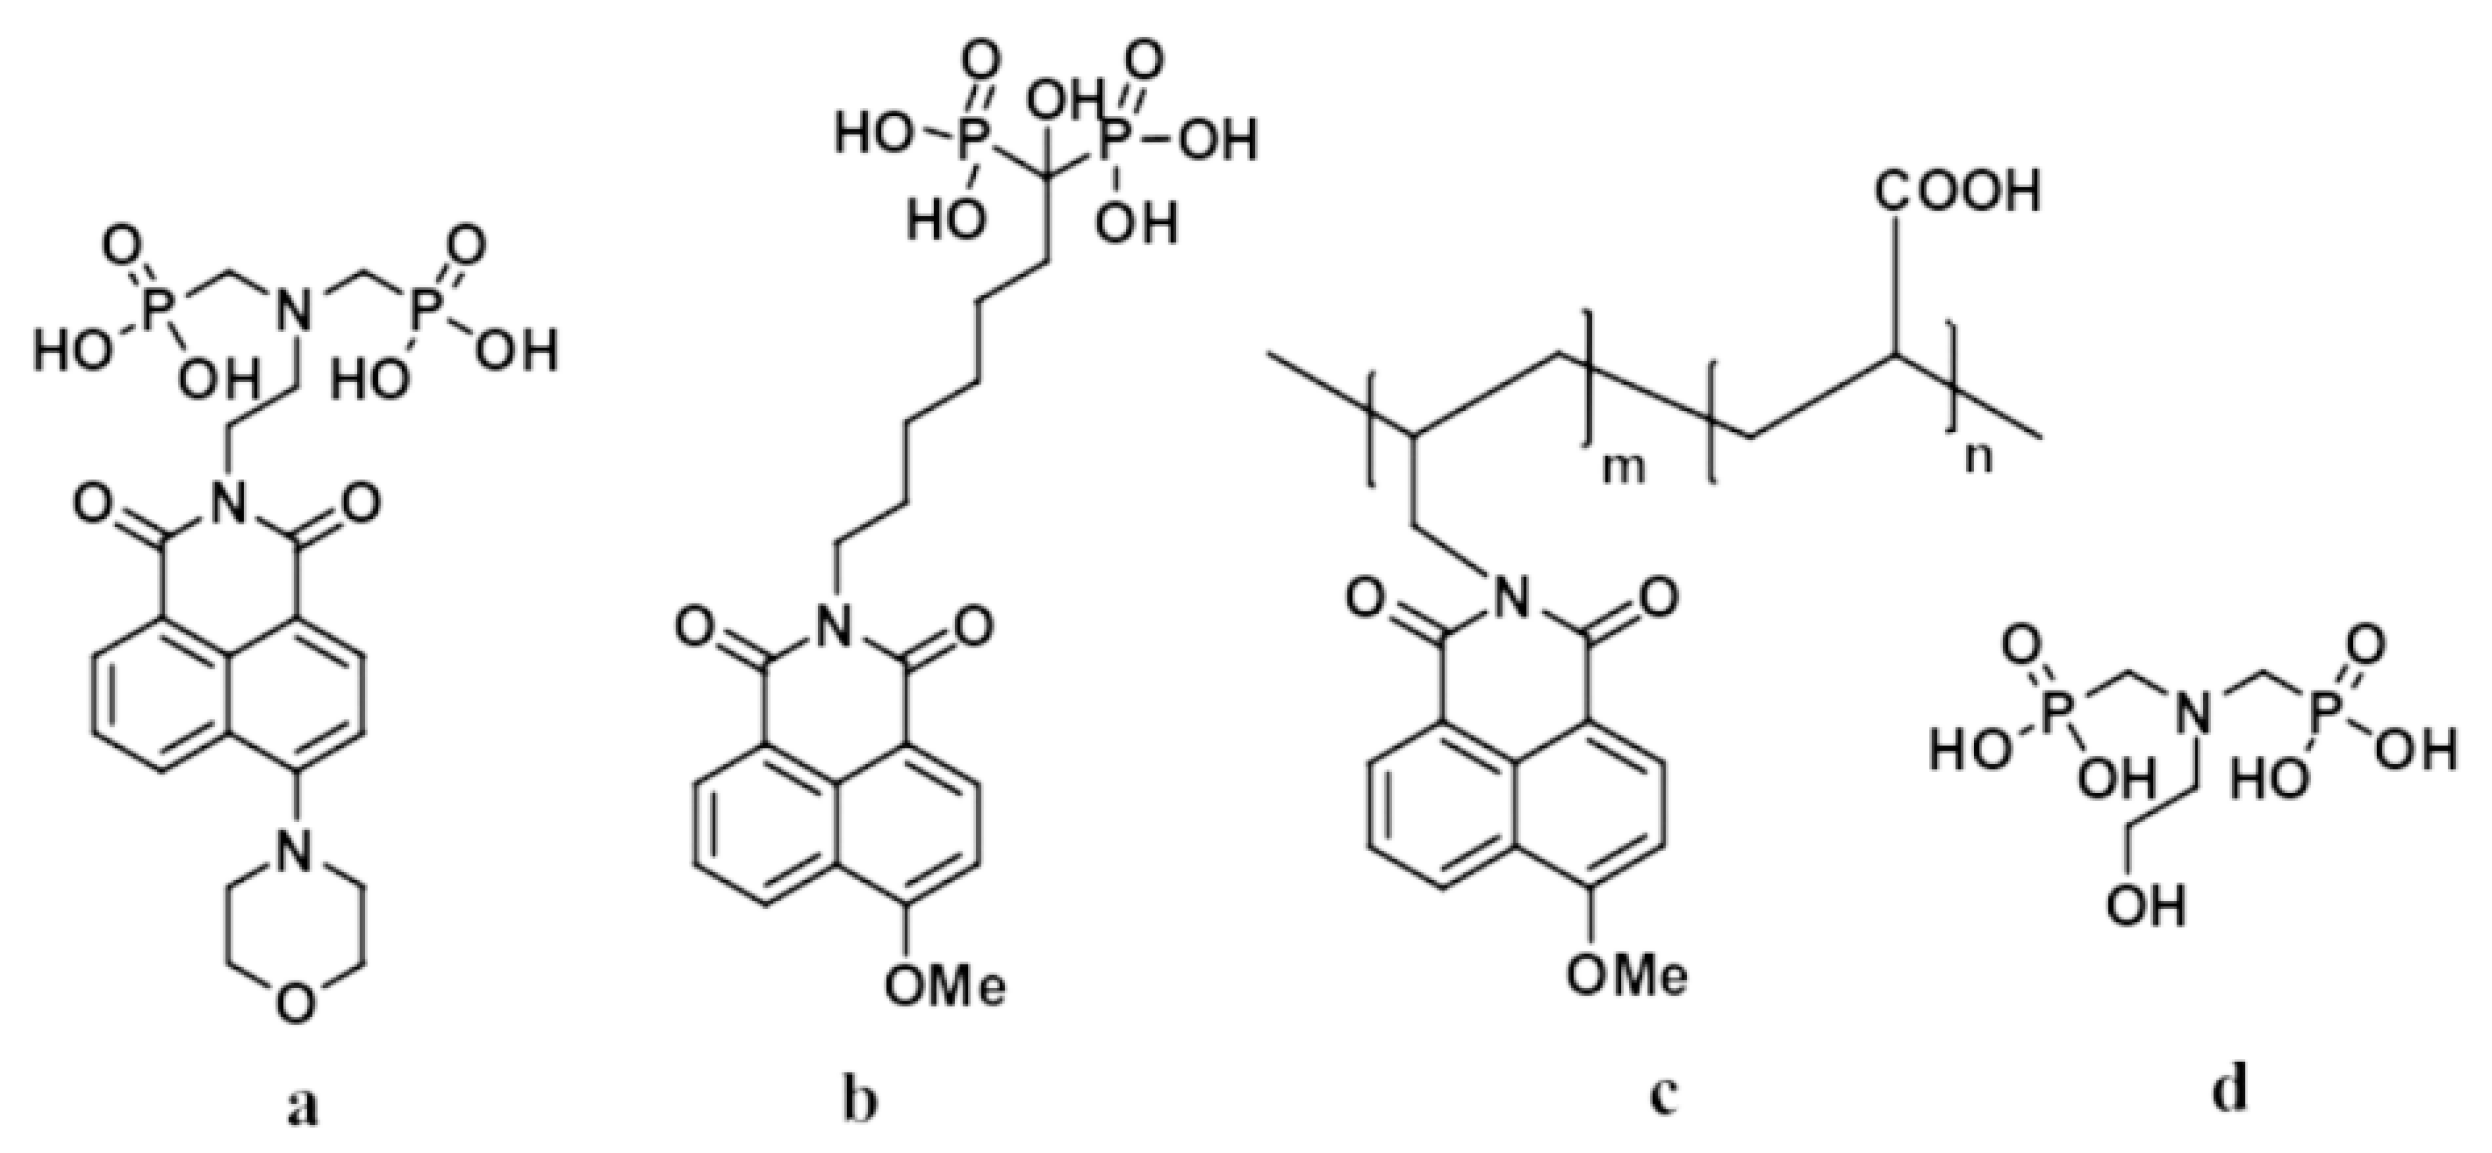
| ADMP-F | 2-(6-Morpholino-1,3-dioxo-1H-benzo[de]isoquinolin 2(3H)yl)ethylazanediyl)bis(methylenephosphonic acid) |
| Ca-ADMP-F | Calcium salt of ADMP-F |
| PAA | Polyacrylate |
| PAA-F1 | Polyacrylate with an implemented 6-methoxy-1,3-dioxo-1H-benzo[de]isoquinolin-2(3H)-yl fluorescent fragment |
| HEDP | 1-Hydoxyethylydene-1,1-bisphosphonic acid, |
| HEDP-F | 1-Hydroxy-7-(6-methoxy-1,3-dioxo-1H-benzo[de]isoquinolin-2(3H)-yl)heptane-1,1-diyldi(phosphonic acid) |
| Ca-HEDP-F | Calcium salt of HEDP-F |
| HEMPA | Hydroxyethylamino-di(methylene phosphonic acid) |
| Aminat-K | Industrial antiscalant with ATMP as an active substance |
| SEM | Scanning electron microscopy |
| EDS | Energy-dispersive X-ray spectroscopy |
References
- Chen, T.; Wang, Q. Chapter 36—Mineral Scale Deposits—Analysis and Interpretation. In Water-Formed Deposits; Amjad, Z., Demadis, K.D., Eds.; Elsevier: Amsterdam, The Netherlands, 2022; pp. 783–794. ISBN 978-0-12-822896-8. [Google Scholar]
- Matin, A.; Rahman, F.; Shafi, H.Z.; Zubair, S.M. Scaling of Reverse Osmosis Membranes Used in Water Desalination: Phenomena, Impact, and Control; Future Directions. Desalination 2019, 455, 135–157. [Google Scholar] [CrossRef]
- Barber, M. Chapter 14—Recent Developments in Oilfield Scale Control. In Water-Formed Deposits; Amjad, Z., Demadis, K.D., Eds.; Elsevier: Amsterdam, The Netherlands, 2022; pp. 295–306. ISBN 978-0-12-822896-8. [Google Scholar]
- Hoang, T.A. Chapter 2—Mechanisms of Scale Formation and Inhibition. In Water-Formed Deposits; Amjad, Z., Demadis, K.D., Eds.; Elsevier: Amsterdam, The Netherlands, 2022; pp. 13–47. ISBN 978-0-12-822896-8. [Google Scholar]
- Cho, Y.I.; Kim, H.-S. Chapter 8—Nonchemical Methods to Control Scale and Deposit Formation. In Water-Formed Deposits; Amjad, Z., Demadis, K.D., Eds.; Elsevier: Amsterdam, The Netherlands, 2022; pp. 167–193. ISBN 978-0-12-822896-8. [Google Scholar]
- Mady, M.F. Chapter 16—Oilfield Scale Inhibitors: Synthetic and Performance Aspects. In Water-Formed Deposits; Amjad, Z., Demadis, K.D., Eds.; Elsevier: Amsterdam, The Netherlands, 2022; pp. 325–352. ISBN 978-0-12-822896-8. [Google Scholar]
- Amjad, Z.; Fellows, C.M. Chapter 18—Polymers for Industrial Water Systems: Synthesis, Characterization, and Applications. In Water-Formed Deposits; Amjad, Z., Demadis, K.D., Eds.; Elsevier: Amsterdam, The Netherlands, 2022; pp. 369–396. ISBN 978-0-12-822896-8. [Google Scholar]
- Shemer, H.; Hasson, D.; Semiat, R. Review of the State of the Art of Antiscalant Selection. In Mineral Scales in Biological and Industrial Systems; CRC Press: New York, NY, USA, 2013; pp. 233–244. ISBN 978-0-429-09528-3. [Google Scholar]
- Oshchepkov, M.S.; Popov, K.I. Chapter 35—Mechanisms of Scale Inhibition Derived from a Fluorescent-Tagged Antiscalant Visualization. In Water-Formed Deposits; Amjad, Z., Demadis, K.D., Eds.; Elsevier: Amsterdam, The Netherlands, 2022; pp. 765–782. ISBN 978-0-12-822896-8. [Google Scholar]
- Cheng, Z.; Qin, Q.; Jia, H.; Li, J.; Yan, F.; Meng, X.; Wang, J. Scale Evaluation and Antiscalant Testing Based on Fluorescent Probe Technology in RO Process. J. Membr. Sci. 2021, 636, 119598. [Google Scholar] [CrossRef]
- Oshchepkov, M.S.; Tkachenko, S.V.; Popov, K.I. Chapter 31—Synthesis, Properties, and Applications of Novel Fluorescent-Tagged Scale Inhibitors in Water Treatment. In Water-Formed Deposits; Amjad, Z., Demadis, K.D., Eds.; Elsevier: Amsterdam, The Netherlands, 2022; pp. 675–695. ISBN 978-0-12-822896-8. [Google Scholar]
- Zeiher, K.; Ho, B.; Williams, K.D. A Fluorescent Technology to Ensure RO Antiscalant Performance. Ultrapure Water 2003, 20, 36–43. [Google Scholar]
- Kang, Q.; Xu, M.; Li, Y.; Gao, C.; Cheng, Z.; Tao, J. An Ultra-High Sensitivity Fluorescence Sensor Based on Fluorescence Technology. Optik 2022, 265, 169579. [Google Scholar] [CrossRef]
- Zhang, Z.; Lu, M.; Liu, J.; Chen, H.; Chen, Q.; Wang, B. Fluorescent-Tagged Hyper-Branched Polyester for Inhibition of CaSO4 Scale and the Scale Inhibition Mechanism. Mater. Today Commun. 2020, 25, 101359. [Google Scholar] [CrossRef]
- Oshchepkov, M.; Kamagurov, S.; Tkachenko, S.; Ryabova, A.; Popov, K. Insight into the Mechanisms of Scale Inhibition: A Case Study of a Task-Specific Fluorescent-Tagged Scale Inhibitor Location on Gypsum Crystals. ChemNanoMat 2019, 5, 586–592. [Google Scholar] [CrossRef]
- Oshchepkov, M.; Golovesov, V.; Ryabova, A.; Tkachenko, S.; Redchuk, A.; Rönkkömäki, H.; Rudakova, G.; Pervov, A.; Popov, K. Visualization of a Novel Fluorescent-Tagged Bisphosphonate Behavior during Reverse Osmosis Desalination of Water with High Sulfate Content. Sep. Purif. Technol. 2021, 255, 117382. [Google Scholar] [CrossRef]
- Li, L.; Shao, S.; Li, D.; Yang, W.; Yin, X.; Zhang, Y.; Chen, Y.; Liu, Y. Environmental-Friendly Curcumin Based Fluorescent Polymer for Calcium Sulfate Scale Inhibition. Desalination 2022, 535, 115804. [Google Scholar] [CrossRef]
- Li, L.; Wang, Y.; Sun, Y.; Yang, W.; Yin, X.; Chen, Y.; Liu, Y. Novel and Green Hydroxyperylene Imide Based Fluorescent Polymer for Calcium Sulfate Scale Inhibition. J. Mol. Liq. 2021, 344, 117730. [Google Scholar] [CrossRef]
- Xue, M.; Zhang, C.; Liu, Q.; Yang, H.; Liu, G. Polyether Copolymers Containing Fluorescent Groups: A Green Inhibitor for Calcium Carbonate. Water Supply 2018, 19, 725–734. [Google Scholar] [CrossRef]
- Oshchepkov, M.; Solovieva, I.; Menkov, A.; Tkachenko, S.; Udovenko, V.; Popov, K. Continuous Flow Microfluidic Implementation of a Fluorescent Marker into a Polyacrylate Moiety. J. Flow. Chem. 2020, 10, 545–550. [Google Scholar] [CrossRef]
- Oshchepkov, M.; Golovesov, V.; Ryabova, A.; Frolova, S.; Tkachenko, S.; Kamagurov, S.; Rudakova, G.; Popov, K. Synthesis and Visualization of a Novel Fluorescent-Tagged Polymeric Antiscalant during Gypsum Crystallization in Combination with Bisphosphonate Fluorophore. Crystals 2020, 10, 992. [Google Scholar] [CrossRef]
- Zhang, S.; Jiang, X.; Cheng, S.; Fu, C.; Tian, Z.; Yang, Z.; Yang, W. Enhanced Scale Inhibition against Ca3(PO4)2 and Fe2O3 in Water Using Multi-Functional Fluorescently-Tagged Antibacterial Scale Inhibitors. Environ. Sci. Water Res. Technol. 2020, 6, 951–962. [Google Scholar] [CrossRef]
- Ao, Z.; YuMing, Z.; QingZhao, Y.; TianTian, W.; Jun, L.; Yiyi, C.; Jie, P.; ShuAng, L.; QiuLi, N.; MingJue, Z.; et al. Inhibition of Calcium Scales by a Fluorescent-Tagged and Polyether-Based Polycarboxylate Scale Inhibitor for Cooling Water Systems. Desalination Water Treat. 2017, 59, 114–122. [Google Scholar] [CrossRef]
- Popov, K.; Oshchepkov, M.; Kamagurov, S.; Tkachenko, S.; Dikareva, J.; Rudakova, G. Synthesis and Properties of Novel Fluorescent-Tagged Polyacrylate-Based Scale Inhibitors. J. Appl. Polym. Sci. 2017, 134, 45017. [Google Scholar] [CrossRef]
- Liu, G.; Xue, M.; Zhou, Y. Fluorescent-Tagged Block Copolymer as an Effective and Green Inhibitor for Calcium Sulfate Scales. Russ. J. Appl. Chem. 2016, 89, 1861–1868. [Google Scholar] [CrossRef]
- Shen, Z.; Zhi, X.; Zhang, P. Preparation of Fluorescent Polyaspartic Acid and Evaluation of Its Scale Inhibition for CaCO3 and CaSO4. Polym. Adv. Technol. 2017, 28, 367–372. [Google Scholar] [CrossRef]
- Feng, J.; Gao, L.; Wen, R.; Deng, Y.; Wu, X.; Deng, S. Fluorescent Polyaspartic Acid with an Enhanced Inhibition Performance against Calcium Phosphate. Desalination 2014, 345, 72–76. [Google Scholar] [CrossRef]
- Kamagurov, S.; Oshchepkov, M.; Nazarov, D.G.; Mancini, S.; Popov, K.; Tkachenko, S.; Rudakova, G. Performance of a Novel Fluorescent-Tagged Polyacrylate at a Cooling Tower Test Facility: A Bench-Scale and Industrial-Scale Evaluation. Int. J. Corros. Scale Inhib. 2018, 7, 418–426. [Google Scholar] [CrossRef]
- Zhang, S.; Ding, J.; Tian, D.; Chang, M.; Zhao, X.; Lu, M. Experimental and Theoretical Studies of Fluorescent-Tagged Scale Inhibitors for Calcium Scale Inhibition. J. Mol. Struct. 2023, 1272, 134157. [Google Scholar] [CrossRef]
- Oshchepkov, A.; Oshchepkov, M.; Kamagurov, S.; Redchuk, A.; Oshchepkova, M.; Popov, K.; Kataev, E. Fluorescence Detection of Phosphonates in Water by a Naphthalimide-Based Receptor and Its Derived Cryopolymers. New J. Chem. 2020, 44, 12113–12121. [Google Scholar] [CrossRef]
- TM0374-2007; Laboratory Screening Tests to Determine the Ability of Scale Inhibitors to Prevent the Precipitation of Calcium Sulfate and Calcium Carbonate from Solution (for Oil and Gas Production Systems); Item No. 21208. National Association of Corrosion Engineers: Houston, TX, USA, 2007.
- Jain, N.; Kaur, N. A Comprehensive Compendium of Literature of 1,8-Naphthalimide Based Chemosensors from 2017 to 2021. Coord. Chem. Rev. 2022, 459, 214454. [Google Scholar] [CrossRef]
- Rabizadeh, T. Investigating the potential of hydroxyethylamino-di(methylene phosphonic acid) in inhibiting gypsum crystallization. CrystEngComm 2023. [Google Scholar] [CrossRef]
- Crosby, G.A.; Demas, J.N. Measurement of Photoluminescence Quantum Yields. Review. J. Phys. Chem. 1971, 75, 991–1024. [Google Scholar] [CrossRef]
- Tang, Y.; Yang, W.; Yin, X.; Liu, Y.; Yin, P.; Wang, J. Investigation of CaCO3 Scale Inhibition by PAA, ATMP and PAPEMP. Desalination 2008, 228, 55–60. [Google Scholar] [CrossRef]
- Popov, K.; Rudakova, G.; Larchenko, V.; Tusheva, M.; Afanas’eva, E.; Kombarova, S.; Kamagurov, S.; Kovaleva, N. A Comparative Performance Ranking of Some Phosphonates and Environmentally Friendly Polymers on CaCO3 Scaling Inhibition by NACE Protocol. Desalination Water Treat. 2017, 69, 163–172. [Google Scholar] [CrossRef]
- Popov, K.; Rudakova, G.; Larchenko, V.; Tusheva, M.; Kamagurov, S.; Dikareva, J.; Kovaleva, N. A Comparative Performance Evaluation of Some Novel “Greeen” and Traditional Antiscalants in Calcium Sulfate Scaling. Adv. Mat. Sci. Eng. 2016, 2016, 7635329. [Google Scholar] [CrossRef]
- Gopi, S.P.; Subramanian, V.K. Polymorphism in CaCO3—Effect of Temperature under the Influence of EDTA (Di Sodium Salt). Desalination 2012, 297, 38–47. [Google Scholar] [CrossRef]
- Liu, D.; Dong, W.; Li, F.; Hui, F.; Lédion, J. Comparative Performance of Polyepoxysuccinic Acid and Polyaspartic Acid on Scaling Inhibition by Static and Rapid Controlled Precipitation Methods. Desalination 2012, 304, 1–10. [Google Scholar] [CrossRef]
- Liu, G.; Xue, M.; Huang, J.; Wang, H.; Zhou, Y.; Yao, Q.; Ling, L.; Cao, K.; Liu, Y.; Bu, Y.; et al. Preparation and Application of a Phosphorous Free and Nonnitrogen Scale Inhibitor in Industrial Cooling Water Systems. Front. Environ. Sci. Eng. 2015, 9, 545–553. [Google Scholar] [CrossRef]
- Wolf, G.; Königsberger, E.; Schmidt, H.G.; Königsberger, L.-C.; Gamsjäger, H. Thermodynamic Aspects of the Vaterite-Calcite Phase Transition. J. Therm. Anal. Calorim. 2000, 60, 463–472. [Google Scholar] [CrossRef]
- Marshall, W.L.; Slusher, R. Thermodynamics of Calcium Sulfate Dihydrate in Aqueous Sodium Chloride Solutions, 0–110°. J. Phys. Chem. 1966, 70, 4015–4027. [Google Scholar] [CrossRef]
- Mullin, J.W. Crystallization; Elsevier: Amsterdam, The Netherlands, 2001; ISBN 978-0-08-053011-6. [Google Scholar]
- Kashchiev, D.; van Rosmalen, G.M. Review: Nucleation in Solutions Revisited. Cryst. Res. Technol. 2003, 38, 555–574. [Google Scholar] [CrossRef]
- Van Driessche, A.E.S.; Stawski, T.M.; Kellermeier, M. Calcium Sulfate Precipitation Pathways in Natural and Engineered Environments. Chem. Geol. 2019, 530, 119274. [Google Scholar] [CrossRef]
- Stawski, T.M.; van Driessche, A.E.S.; Ossorio, M.; Diego Rodriguez-Blanco, J.; Besselink, R.; Benning, L.G. Formation of Calcium Sulfate through the Aggregation of Sub-3 Nanometre Primary Species. Nat. Commun. 2016, 7, 11177. [Google Scholar] [CrossRef] [Green Version]
- Popov, K.; Boglovskiy, A.; Guseva, O.; Larchenko, V.; Rudakova, G. A Comparative Study of Phosphonate and Phosphorus-Free Antiscalant Efficiency by Static and Dynamic Methods.Do We Have Reliable Tools for an Adequate Reagent Selection? Recent Adv. Petrochem. Sci. 2017, 1, 17–19. [Google Scholar]


| Antiscalant | λmax, nm | λmaxfl, nm | Φfl, % | Ref. |
|---|---|---|---|---|
| ADMP-F | 401 | 545 | 13 | Present work |
| HEDP-F | 375 | 460 | 86 | [15] |
| PAA-F1 | 375 | 465 | 69 | [24] |
| Compound | CaCO3 Scaling | CaSO4 Scaling | ||||
|---|---|---|---|---|---|---|
| Inhibition, % | pH 1 | Present Work | NACE | |||
| Inhibition, % | pH 1 | Inhibition, % | pH 1 | |||
| Blank | 0 | 8.2 | 0 | 8.0 | 0 | 6 to 7 |
| ADMP-F | 15 ± 1 | 8.3 | 73 ± 2 | 8.2 | - | 6 to 7 |
| HEDP-F | 1.0 ± 0.5 | 8.5 | 16 ± 1 | 8.1 | 78 2 [15] | 6 to 7 |
| PAA-F1 | 26 ± 2 | 8.0 | 99 ± 2 | 8.1 | 73 3 [24]; 92 4 [24] | 6 to 7 |
| Aminat-K | 40 ± 5 | 8.4 | 99 ± 1 | 8.4 | 100 5 [37] | 6 to 7 |
| Sample | Antiscalant Concentration, mg·dm−3 | Solid Phase Composition 1, % w/w | Ref. | ||
|---|---|---|---|---|---|
| Calcite | Aragonite | Vaterite | |||
| Blank | 0 | 32 | 68 | - | Present work |
| 0 | 82 | 18 | - | NACE test, [36] | |
| PAA | 10 | 40 | 60 | - | NACE test, [36] |
| 5 | 13 | 77 | 10 | ||
| PAA-F1 | 10 | 50 | - | 50 | Present work |
| HEDP | 5 | 82 | 18 | - | NACE test, [36] |
| HEDP-F | 10 | 25 | 75 | - | Present work |
| ATMP | 5 | 18 | 82 | - | NACE test, [36] |
| 1 | 100 | - | - | ||
| ADMP-F | 10 | 100 | - | - | Present work |
Disclaimer/Publisher’s Note: The statements, opinions and data contained in all publications are solely those of the individual author(s) and contributor(s) and not of MDPI and/or the editor(s). MDPI and/or the editor(s) disclaim responsibility for any injury to people or property resulting from any ideas, methods, instructions or products referred to in the content. |
© 2023 by the authors. Licensee MDPI, Basel, Switzerland. This article is an open access article distributed under the terms and conditions of the Creative Commons Attribution (CC BY) license (https://creativecommons.org/licenses/by/4.0/).
Share and Cite
Tkachenko, S.; Trukhina, M.; Ryabova, A.; Oshchepkov, M.; Kamagurov, S.; Popov, K. Fluorescent-Tagged Antiscalants—The New Materials for Scale Inhibition Mechanism Studies, Antiscalant Traceability and Antiscaling Efficacy Optimization during CaCO3 and CaSO4·2H2O Scale Formation. Int. J. Mol. Sci. 2023, 24, 3087. https://doi.org/10.3390/ijms24043087
Tkachenko S, Trukhina M, Ryabova A, Oshchepkov M, Kamagurov S, Popov K. Fluorescent-Tagged Antiscalants—The New Materials for Scale Inhibition Mechanism Studies, Antiscalant Traceability and Antiscaling Efficacy Optimization during CaCO3 and CaSO4·2H2O Scale Formation. International Journal of Molecular Sciences. 2023; 24(4):3087. https://doi.org/10.3390/ijms24043087
Chicago/Turabian StyleTkachenko, Sergey, Maria Trukhina, Anastasia Ryabova, Maxim Oshchepkov, Semen Kamagurov, and Konstantin Popov. 2023. "Fluorescent-Tagged Antiscalants—The New Materials for Scale Inhibition Mechanism Studies, Antiscalant Traceability and Antiscaling Efficacy Optimization during CaCO3 and CaSO4·2H2O Scale Formation" International Journal of Molecular Sciences 24, no. 4: 3087. https://doi.org/10.3390/ijms24043087