Article

Hydroxylated Coumarin-Based Thiosemicarbazones as Dual Antityrosinase and Antioxidant Agents

1
Department of Chemical and Geological Sciences, University of Cagliari, S.P. 8 km 0.700, 09042 Cagliari, Italy
2
Department of Life and Environmental Sciences, University of Cagliari, S.P. 8 km 0.700, 09042 Cagliari, Italy
*
Authors to whom correspondence should be addressed.
These authors contributed equally to this work.
Int. J. Mol. Sci. 2023, 24(2), 1678; https://doi.org/10.3390/ijms24021678
Submission received: 14 December 2022 / Revised: 10 January 2023 / Accepted: 12 January 2023 / Published: 14 January 2023
(This article belongs to the Special Issue The Role of Tyrosinase in Human Health and Disease)

Abstract

:
The design of novel antityrosinase agents appears extremely important in medical and industrial sectors because an irregular production of melanin is related to the insurgence of several skin-related disorders (e.g., melanoma) and the browning process of fruits and vegetables. Because melanogenesis also involves a nonenzymatic oxidative process, developing dual antioxidant and antityrosinase agents is advantageous. In this work, we evaluated the antioxidant and tyrosinase inhibition ability of two new bishydroxylated and two new monohydroxylated derivatives of (1E)-2-(1-(2-oxo-2H-chromen-3-yl)ethylidene)hydrazine-1-carbothioamide (T1) using different experimental and computational approaches. The study was also carried out on another monohydroxylated derivative of T1 for comparison. Interestingly, these molecules have more potent tyrosinase-inhibitory properties than the reference compound, kojic acid. Moreover, the antioxidant activity appears to be influenced according to the number and substitution pattern of the hydroxyl groups. The safety of the compounds without (T1), with one (T3), and with two (T6) hydroxyl groups, has also been assessed by studying their cytotoxicity on melanocytes. These results indicate that (1E)-2-(1-(2-oxo-2H-chromen-3-yl)ethylidene)hydrazine-1-carbothioamide and its hydroxylated derivatives are promising molecules for further drug development studies.

1. Introduction

Melanin, the pigment mainly responsible for skin colouration, is a heterogenous biopolymer produced in melanocytes through a well-known process called melanogenesis. Tyrosinase (EC 1.14.18.1) is a key enzyme for melanin production due to its involvement in the rate-limiting step of melanogenesis. This enzyme catalyses the oxidation of phenols and diphenols thanks to the presence of a binuclear copper-based catalytic site where the metal ions are coordinated by six histidine residues. During melanogenesis, tyrosinase is involved in the biosynthesis of dopaquinone, which can take place directly from L-tyrosine through the monophenolase catalytic cycle or passing through the hydroxylation of the same substrate to obtain L-dihydroxyphenylalanine (L-DOPA) by means of the diphenolase cycle [1]. Even if several tyrosinases from microorganisms, plants, and animals have been sequenced, the complete characterisation concerns only a few of them. Tyrosinase structure is characterised by three domains called central, N-terminal, and C-terminal. The central domain is the most conserved domain and comprises the catalytic site.
The development of novel tyrosinase inhibitors is of great importance for both medical and technological applications. Indeed, an irregular expression of tyrosinase determines the accumulation of melanin, which is related to the insurgence of several skin pigmentation disorders, such as melasma, senile spots, freckles, and even malignant melanoma tumours [1,2]. Tyrosinase is also involved in the browning process of fruits and vegetables, and tyrosinase inhibitors could therefore find potential applications as food preservatives as well [3].
Many natural coumarins, such as umbelliferone (7-hydroxy-2-H-chromen-2-one), have proved to act as tyrosinase inhibitors [4]. Thanks to both their synthetic accessibility and higher versatility in terms of biological properties, which aretuneable according to the nature and position of the substituents in the coumarinic skeleton [5], many scientists have evaluated the antityrosinase activity of several coumarinic derivatives [1,6]. The insertion of hydroxyl groups in the structure of 3-aryl and heteroarylcoumarins led to novel antioxidant compounds with potent tyrosinase inhibitory properties [7,8,9]. Considering that melanogenesis also involves a nonenzymatic oxidative process, the development of novel compounds with dual antioxidant and tyrosinase inhibitory properties appears quite useful [10,11].
Many molecules bearing a thiosemicarbazone moiety proved to possess promising antityrosinase properties [12]. Based on that, we aimed to investigate the dual antioxidant and antityrosinase activity of a series of hydroxylated derivatives of the inhibitor (1E)-2-(1-(2-oxo-2H-chromen-3-yl)ethylidene)hydrazine-1-carbothioamide (T1–T6, Figure 1) [13] using different experimental and computational approaches. By combining experimental (protonation constants) and theoretical results (molecular descriptors), the drug-likeness of the studied compounds and their speciation in different biological compartments have been evaluated. The safety of the studied molecules has also been assessed by studying their cytotoxicity on melanocytes.

2. Results and Discussion

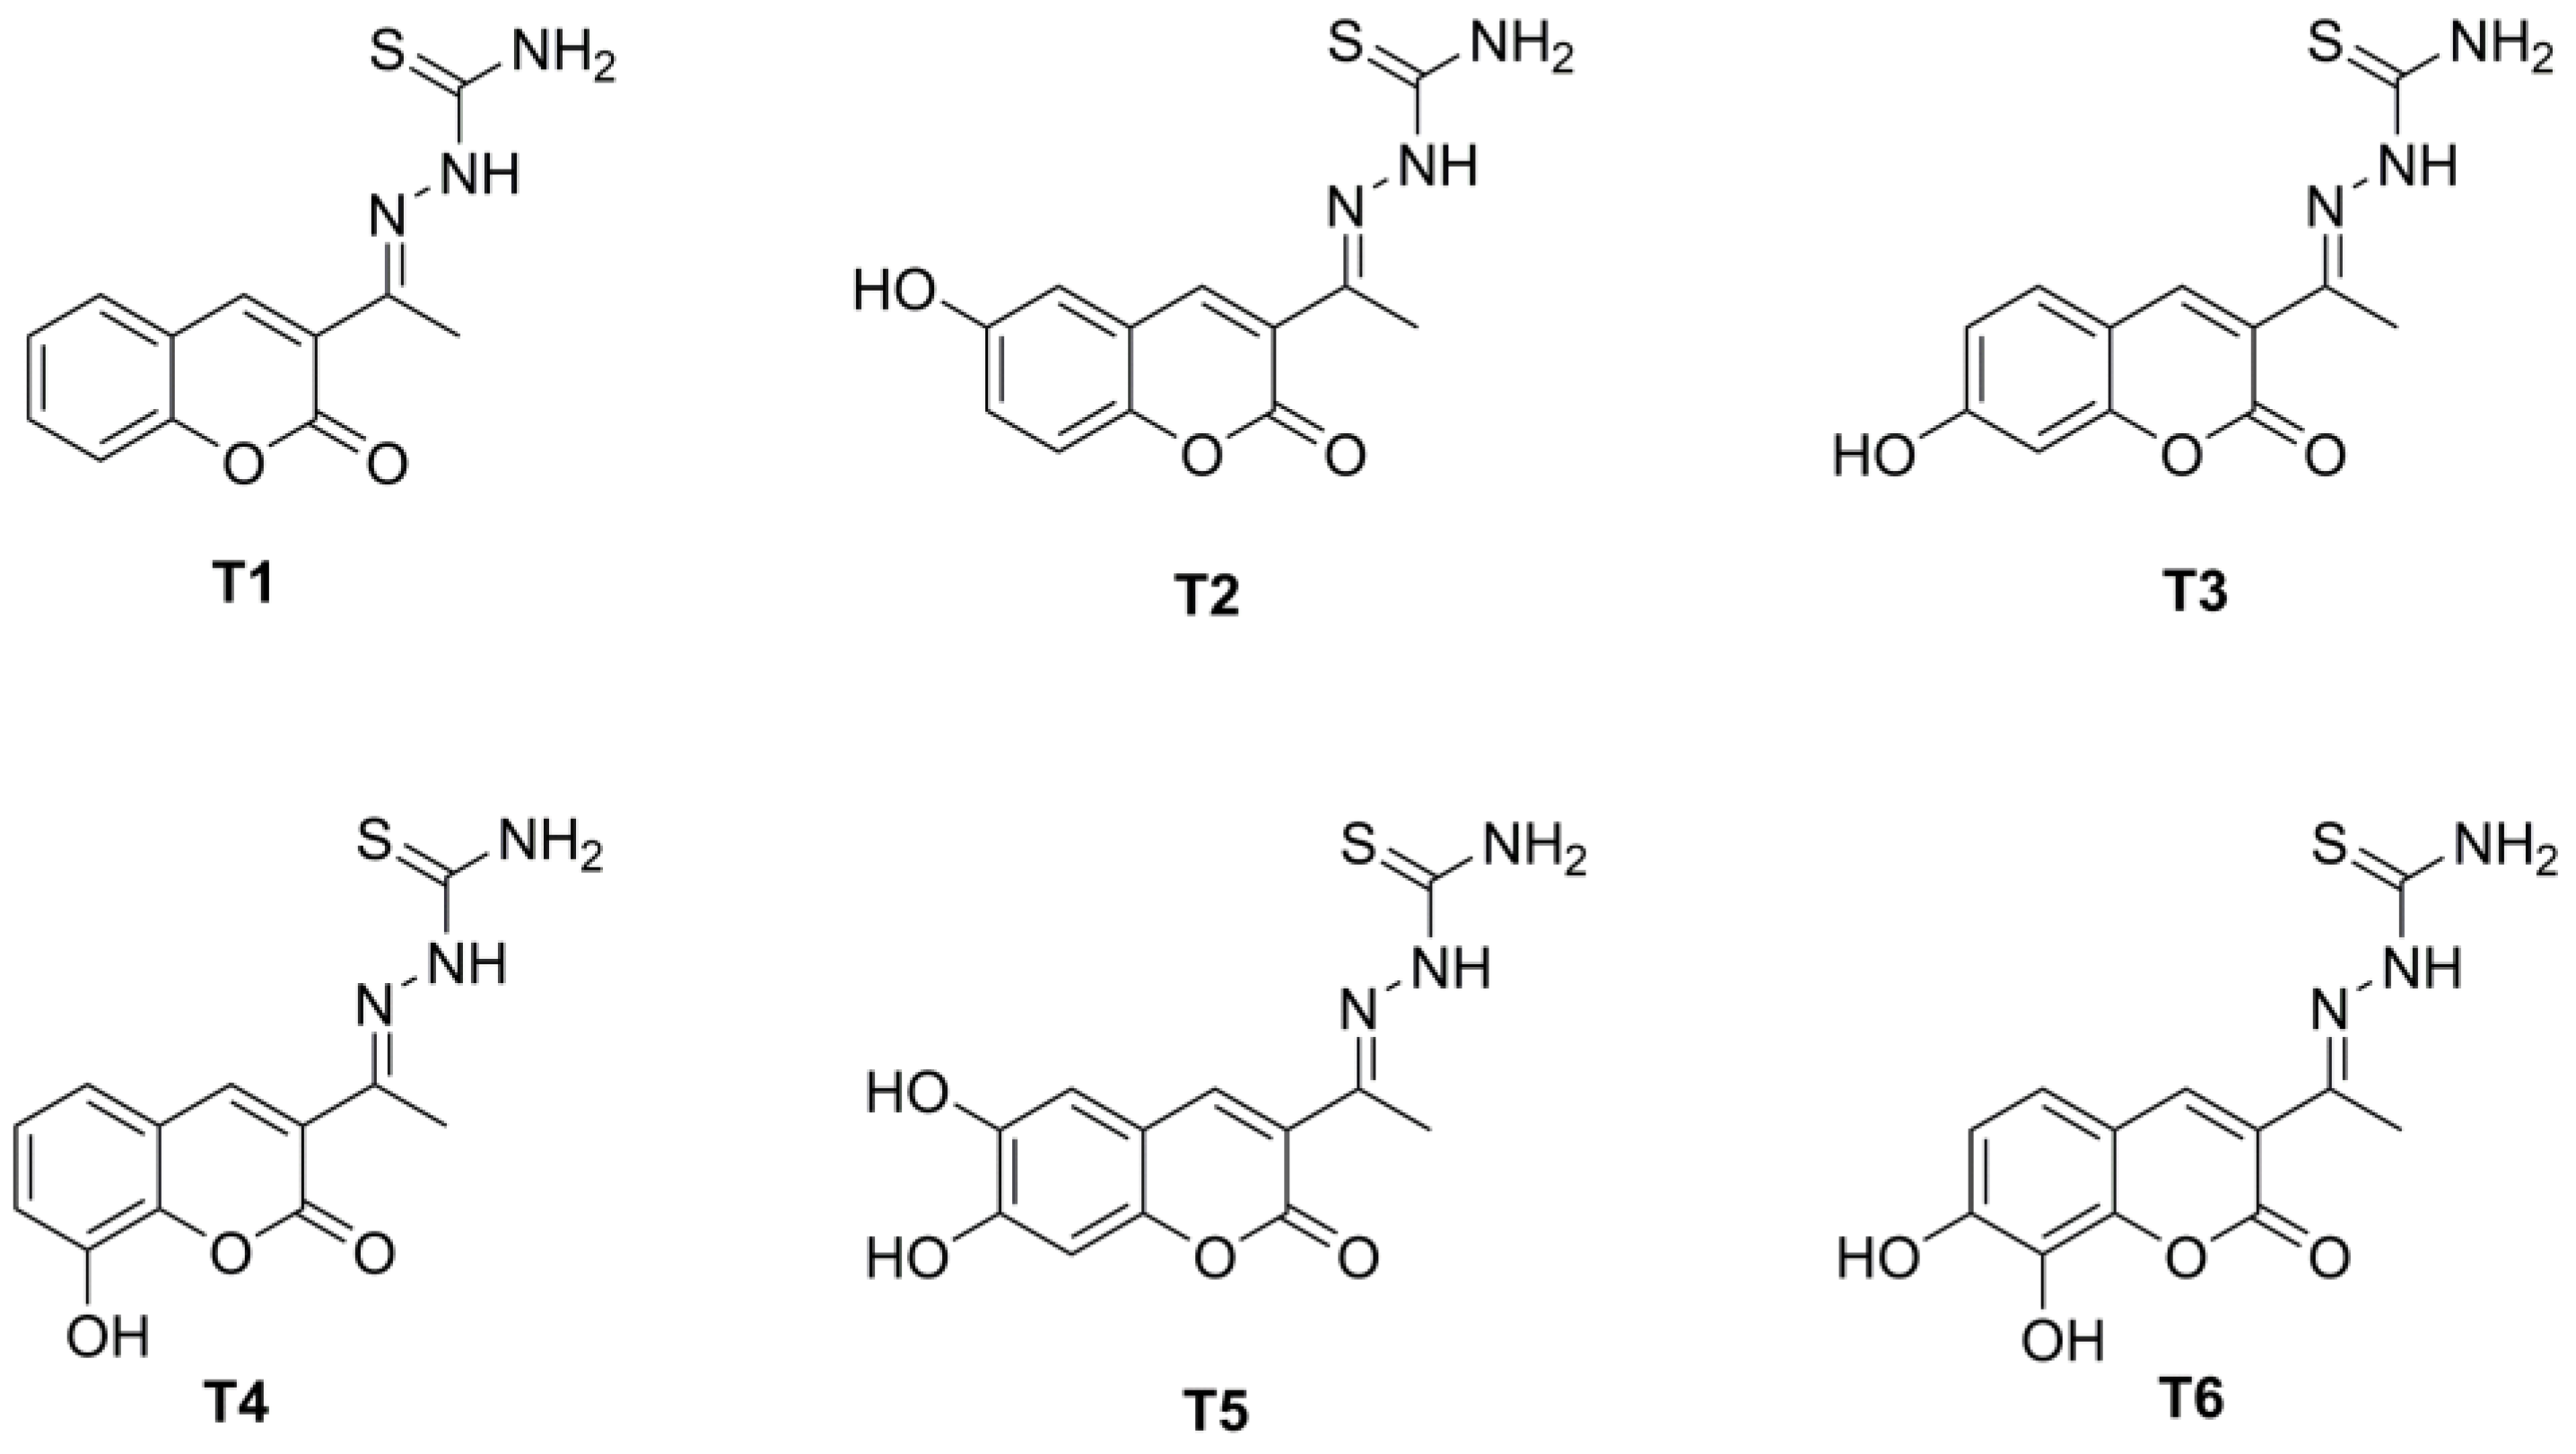
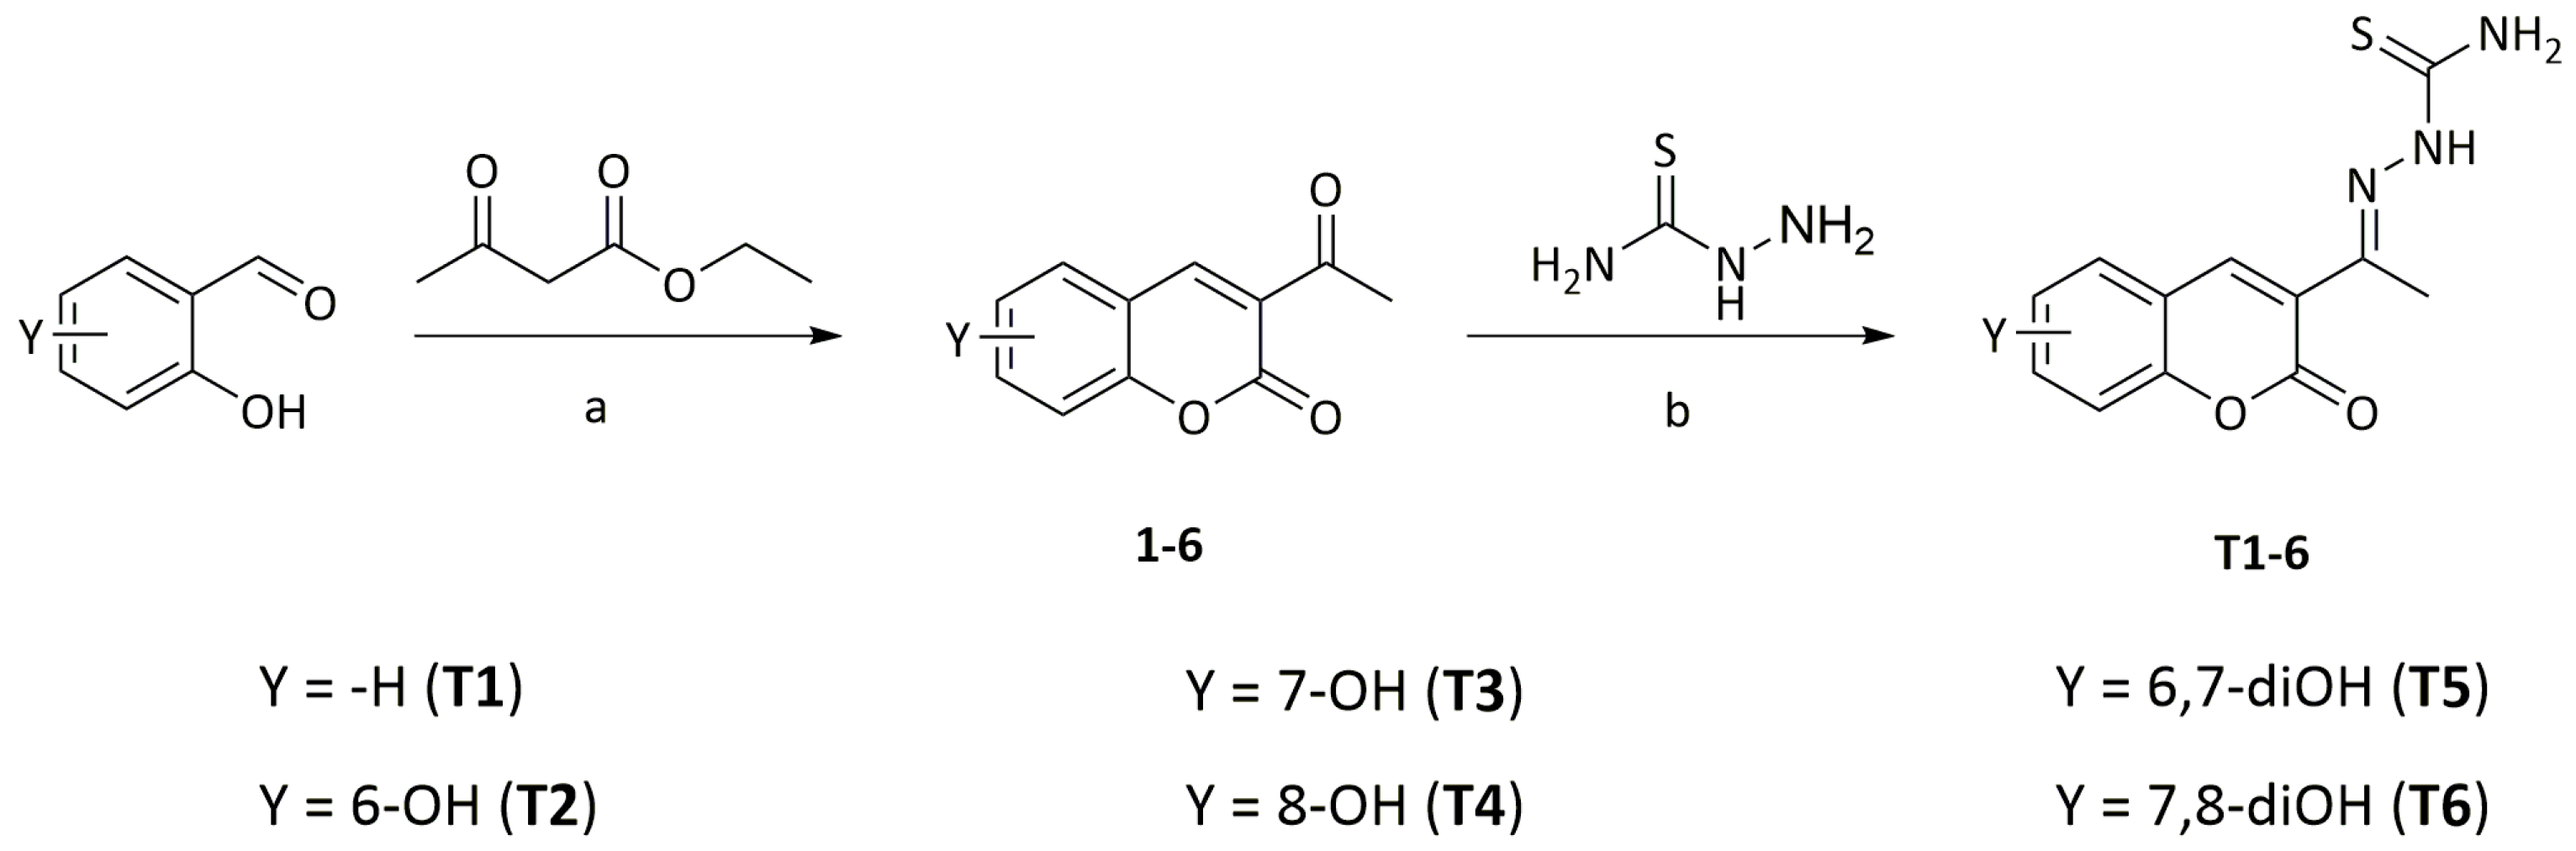
2.1. Synthesis and Chemical Characterization

The target compounds T1–6 were successfully obtained according to the two-step synthetic strategy outlined in Scheme 1. In brief, salicylaldehyde and its hydroxylated derivatives were subjected to Knoevenagel condensation in the presence of ethyl acetoacetate (as active methylene compound) and piperidine (as base) to afford the 3-acetylcoumarins 1–6. The former intermediates were easily converted in the corresponding thiosemicarbazones by reacting them with thiosemicarbazide in the presence of acetic acid as a catalyst. The yields of the T1–6 target compounds ranged from moderate to good. The structure and purity of both the intermediates and final compounds were confirmed with 1H NMR, elemental analysis, and MS data. The NMR spectra for 5 and T4–T6 are reported in the Supporting Figures S1–S9.

2.2. Antioxidant Assay

Radical scavenging activities were evaluated by using 1,1-diphenyl-2-picrylhydrazyl free radical (DPPH) and 2,2′-azinobis-(3-ethylbenzothiazoline-6-sulfonic acid (ABTS) radical scavenging assays [14,15,16].
The antioxidant activity of T1 and its hydroxylated derivatives T2–6 was evaluated via DPPH assay, which is based on the ability of the stable DPP· radical species to be converted in its diamagnetic form (DPPH) by accepting an H· from the tested compound. In ethanol, the DPP· radical shows an intense violet colouration (with a λmax at 517 nm), whereas the DPPH species is yellow-coloured in the same solvent. From the evaluation of the relative decrease in absorbance at different concentrations of each tested compound, the antioxidant activities were evaluated by reporting their EC50 values, as shown in Table 1.
In comparison with ascorbic acid (used as reference), compounds T1–3 were devoid of any radical scavenging capability, whereas in T4, where an –OH was present in the eighth position of the coumarinic scaffold, modest antioxidant activity was observed. On the contrary, compounds T5 and T6, both having a catechol-like motif, showed the most potent antioxidant properties. The different EC50 values achieved for these two compounds (7.1 and 17.9 µM) suggest that the relative position of the catecholic motif in the T1 structure plays an important role in defining the antioxidant activity of this panel of compounds (T5 and T6 were, in fact, 6,7 and 7,8 dihydroxylated, respectively).
The ABTS test confirmed the antioxidant capacity of T5 and T6 compounds with EC50 values lower than that of the reference compound (Trolox). The antioxidant activities, expressed as EC50 values, are shown in Table 1 for all of the compounds.

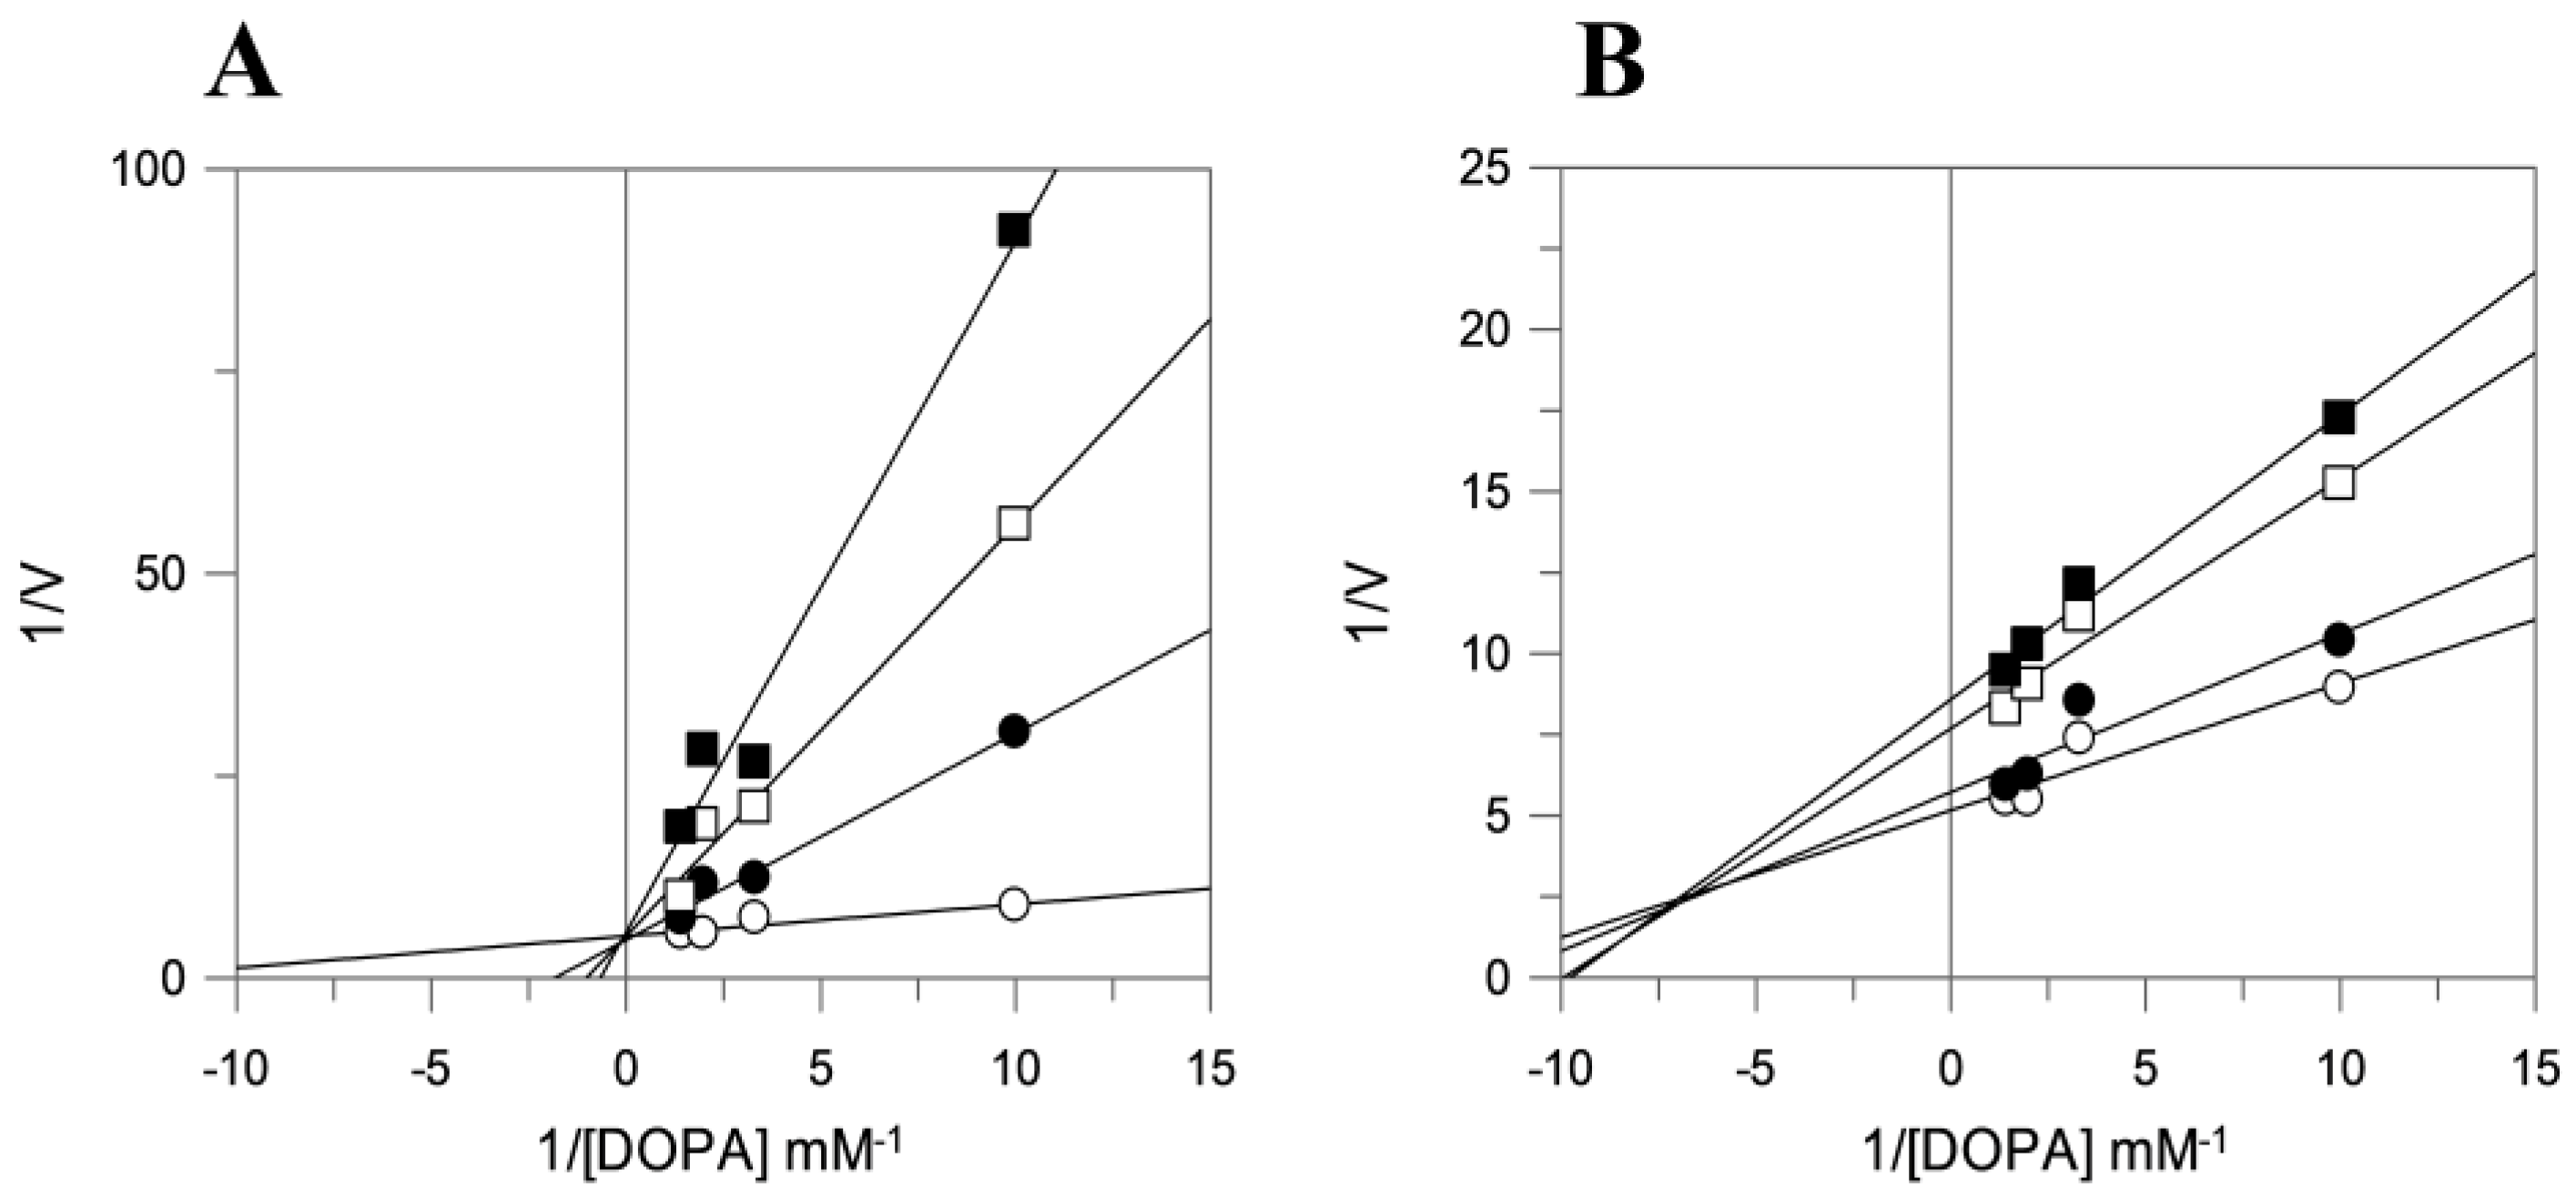
2.3. Tyrosinase Inhibition Assay

The antityrosinase activity of the studied compounds was preliminarily evaluated using mushroom tyrosinase as a protein model. Results from IC50 values (Table 2) show that all of the compounds (except T2) possessed higher tyrosinase inhibitory activity compared to the known tyrosinase inhibitor, kojic acid [9,17].
Kinetics parameters for compounds without hydroxyl (T1) and with two hydroxyl (T6) groups were determined. The Lineweaver–Burk plot for compound T1 shows that Vmax was the same regardless of the inhibitor concentration, whereas Km increased with the inhibitor concentrations (Figure 2A). Therefore, compound T1 exhibited competitive inhibition with a Ki of 0.85 μM.
When hydroxyl groups were present in the coumarin ring (positions 7 and 8), the inhibition potency was maintained, and it exhibited mixed-type inhibition (Figure 2B).
This behaviour shows that compound T6 can bind not only with the free enzyme but also with the enzyme–substrate complex, and that the related equilibrium constants are different. Accordingly, the inhibition constants for the inhibitor binding with free enzyme (Ki) and enzyme–substrate complex (Kis) resulted in 5.88 and 10.65 μM, respectively. The secondary plots to determine the inhibition constants are shown in Figure S10.

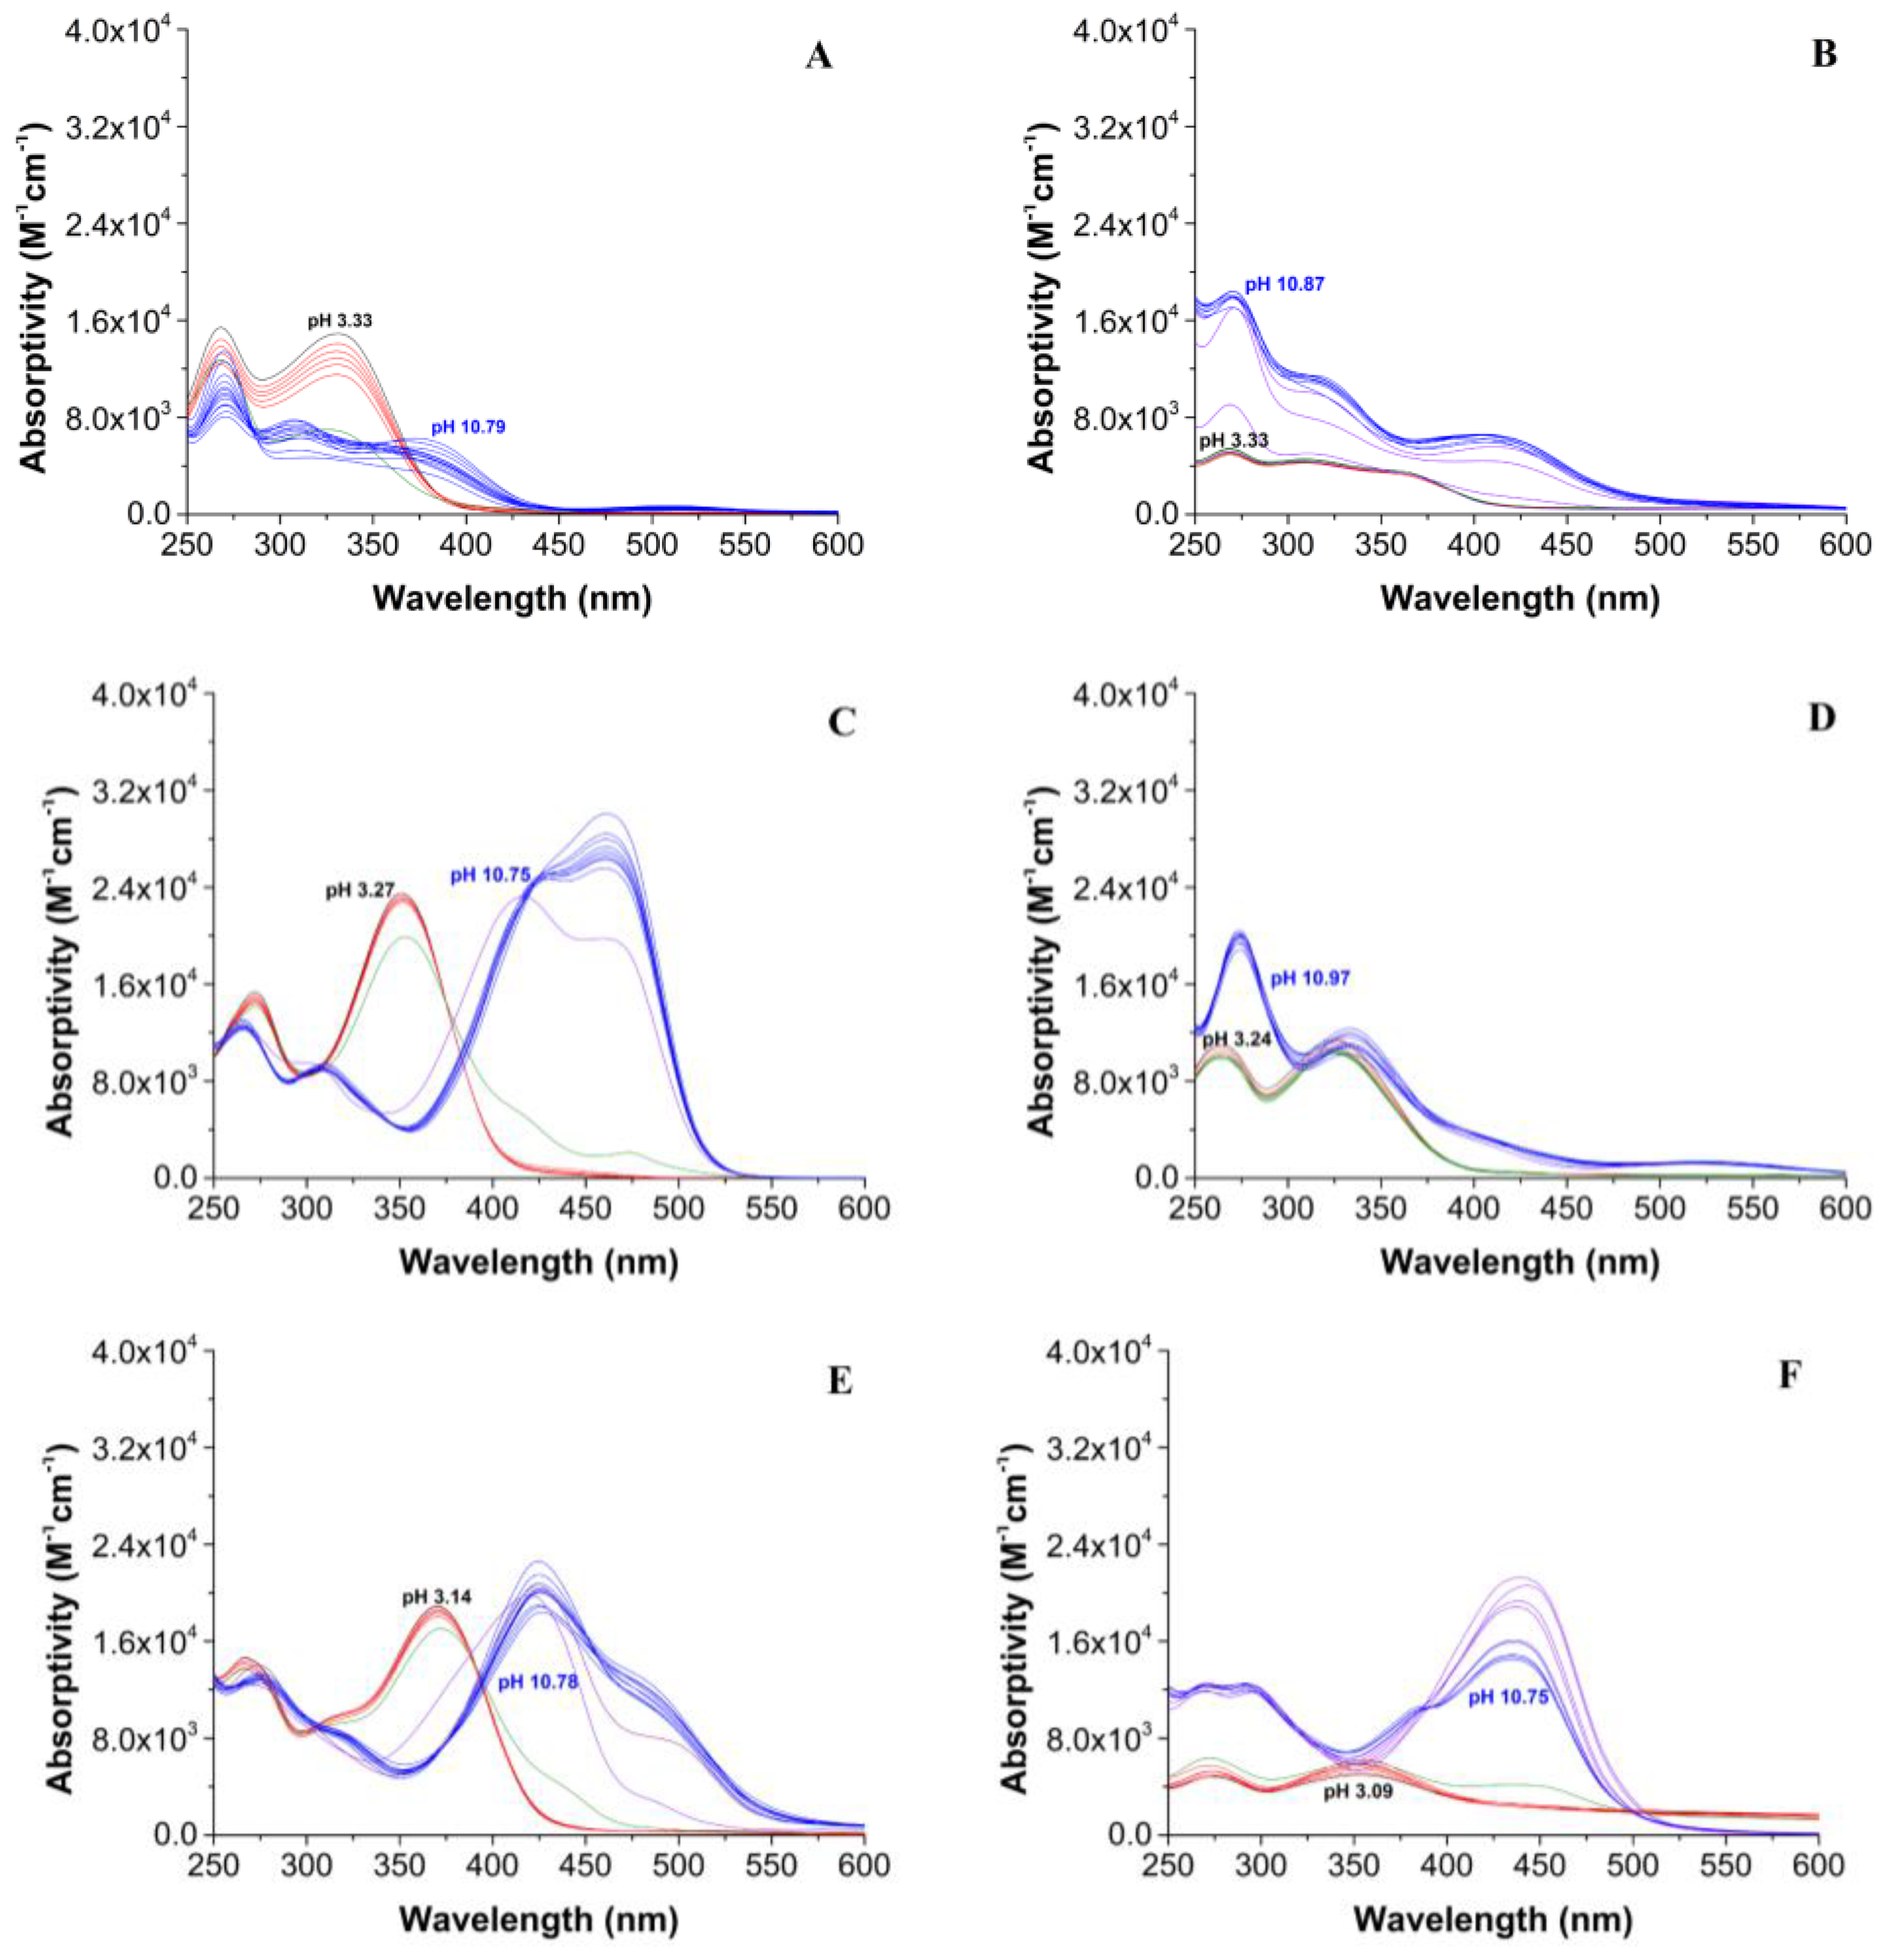
2.4. Drug-Likeness and Biospeciation Studies
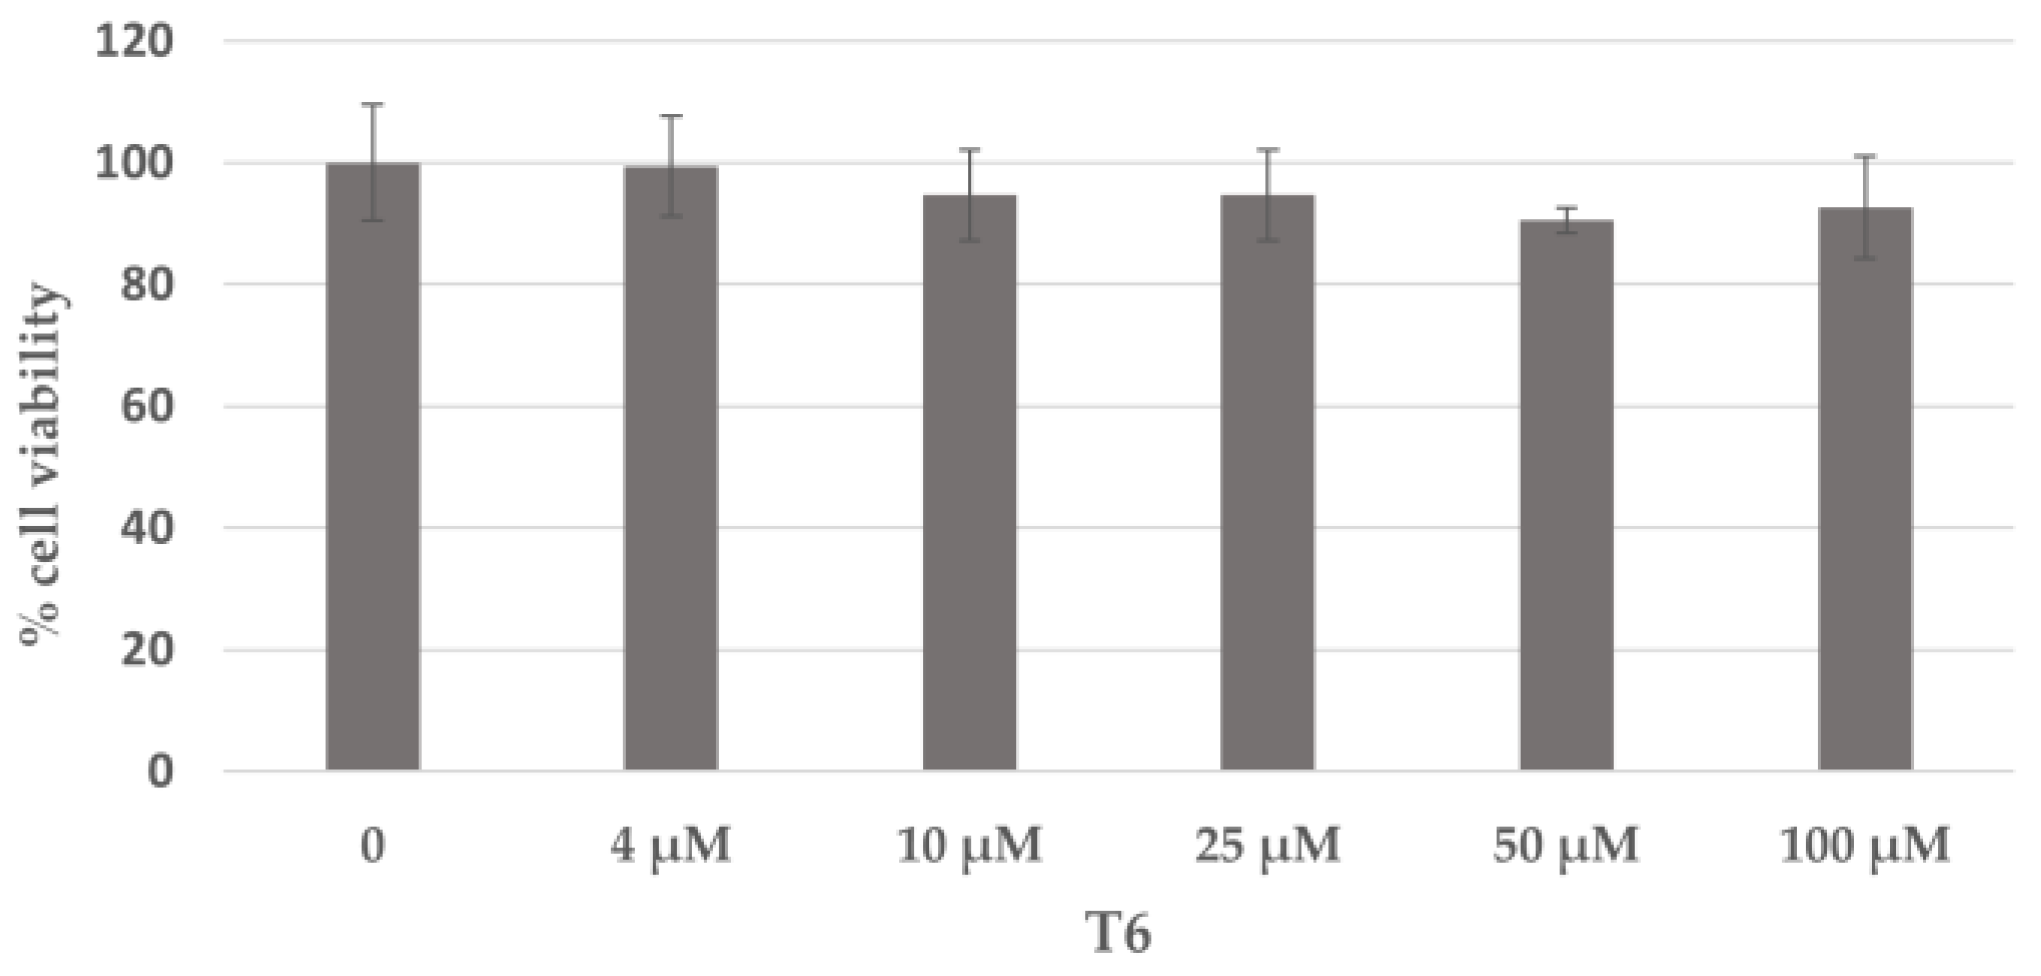
Preliminary evaluation of the drug-likeness of T1–6 has been carried out using different molecular descriptors, as shown in Table 3. All of the compounds adhered to Lipinski’s rule of five, which states that poor absorption or permeation is commonly experienced in the presence of more than five hydrogen bond donors, 10 hydrogen bond acceptors when the LogP is higher than 5, and the molecular weight (MW) is greater than 500 Dalton [18]. The drugs’ ability to permeate biological membranes could also be evaluated based on their Topological Polar Surfae Area (TPSA) values, which are defined as the sum of the surface occupied by polar functional groups [19]. The T1–6 compounds had TPSA values ranging from 80.62 (T1) to 121.08 Å2 (T5 and T6), which is indicative of good oral bioavailability because they were below the upper limit of 140 Å2. All of the studied compounds possessed TPSA values higher than 60 Å2, which is usually associated with compounds having a modest blood–brain barrier (BBB)-crossing ability [20].
When a molecule has ionisable groups (e.g., -RR’NH, -OH, -CO2H, etc.), both its physicochemical properties and bioavailability could be modified according to the pH of the solution. Moreover, the observed pharmacological activity may depend on the real present species, such as L or HnLn+. This aspect should be considered in the design and synthesis of novel bioactive molecules because they could exist in differently protonated and charged forms according to the pH of the biological fluid or loading compartment (stomach, intestine, blood, etc.) where the compound is located.
The biospeciation of the studied molecules, i.e., to define which species is present in a specific bioenvironment, could be achieved by combining the pH distribution curves obtained via solution equilibria studies with the acidity and basicity values of different biological fluids or compartments.
The pH distribution curves can be obtained with the knowledge of the protonation constants of the molecules. Solution equilibria studies allow us to determine the protonation constants of a compound bearing ionisable functional groups. The protonation constants of T1–6 have been determined by simultaneous potentiometric and spectrophotometric titrations (pH range: 3–11). Selected spectra, recorded during the titrations, are shown in Figure 3. More details are given in Supporting Figures S11–S14. Potentiometric and spectrophotometric results allowed us to calculate the cumulative protonation constants (Table 4) and to identify the pK values. Taking T1 and T5 as examples, the spectral variations observed during their titrations are reported in depth in Supporting Figures S11–S12. Eigenvalue analysis on the spectrophotometrical data gave four linearly independent absorbing species for T1 ( H 3 L 2 + , H 2 L + , H L , L - ), five for T2–4 ( H 4 L 2 + , H 3 L + , H 2 L ,   H L - , L 2 - ), and six for compounds T5 and T6 ( H 5 L 2 + , H 4 L + , H 3 L , H 2 L - , H L 2 - , L 3 - ). The simultaneous analysis of both potentiometric and spectrophotometrical data allowed us to obtain the cumulative protonation constants and their related pK values (Table 4). Absorptivity values, reported at maximum wavelengths, for all of the absorbing species are reported in Table S1, whereas their calculated pure spectra are shown in Figure S13.
Considering two different mediums, such as blood plasma and the gastrointestinal (GI) tract, we can observe that regarding the blood plasma at (pH 7.4), T1 is present in its neutral form (as HL), whereas the other compounds mainly exist in their monoanionic forms (HL for T2–4 and H2L for T5 and T6). The situation is more complicated in the GI tract because its local pH values vary among individuals, according to factors like food ingestion, age, presence of systemic diseases, and concomitant drug administration [21]. In the intestinal compartments, the pH fluctuates between 4.9 and 7.4 at the fasted state and 5.2–7.5 at the fed state [22]. In any case, the combined use of these average values and the experimental data at our disposal led to a preliminary evaluation of the region of the GI tract where these molecules are absorbed in their neutral forms via a passive diffusion mechanism. In the GI tract, compound T1 would be predominantly absorbed in the ileum region, where the pH fluctuates between six and eight, whereas the other molecules would be more absorbed in the duodenum (4–6 pH range). The same compounds could be absorbed in the stomach during the fed state.

2.5. Cell Viability

The cytotoxicity of compound T6 (Figure 4), which showed the strongest tyrosinase inhibition and good antioxidant activity, was measured to determine the safety of this molecule.
At 4 μM, the concentration in which the compound inhibited tyrosinase activity, no cytotoxic effect in B16F10 cells was observed. At the highest concentration tested, 100 μM, 25-fold higher than the IC50 values, the cell viability of the compound was still greater than 90%. The same protocol was applied for compounds without hydroxyl (T1) and with one hydroxyl (T3) groups, obtaining similar results (Figure S15).

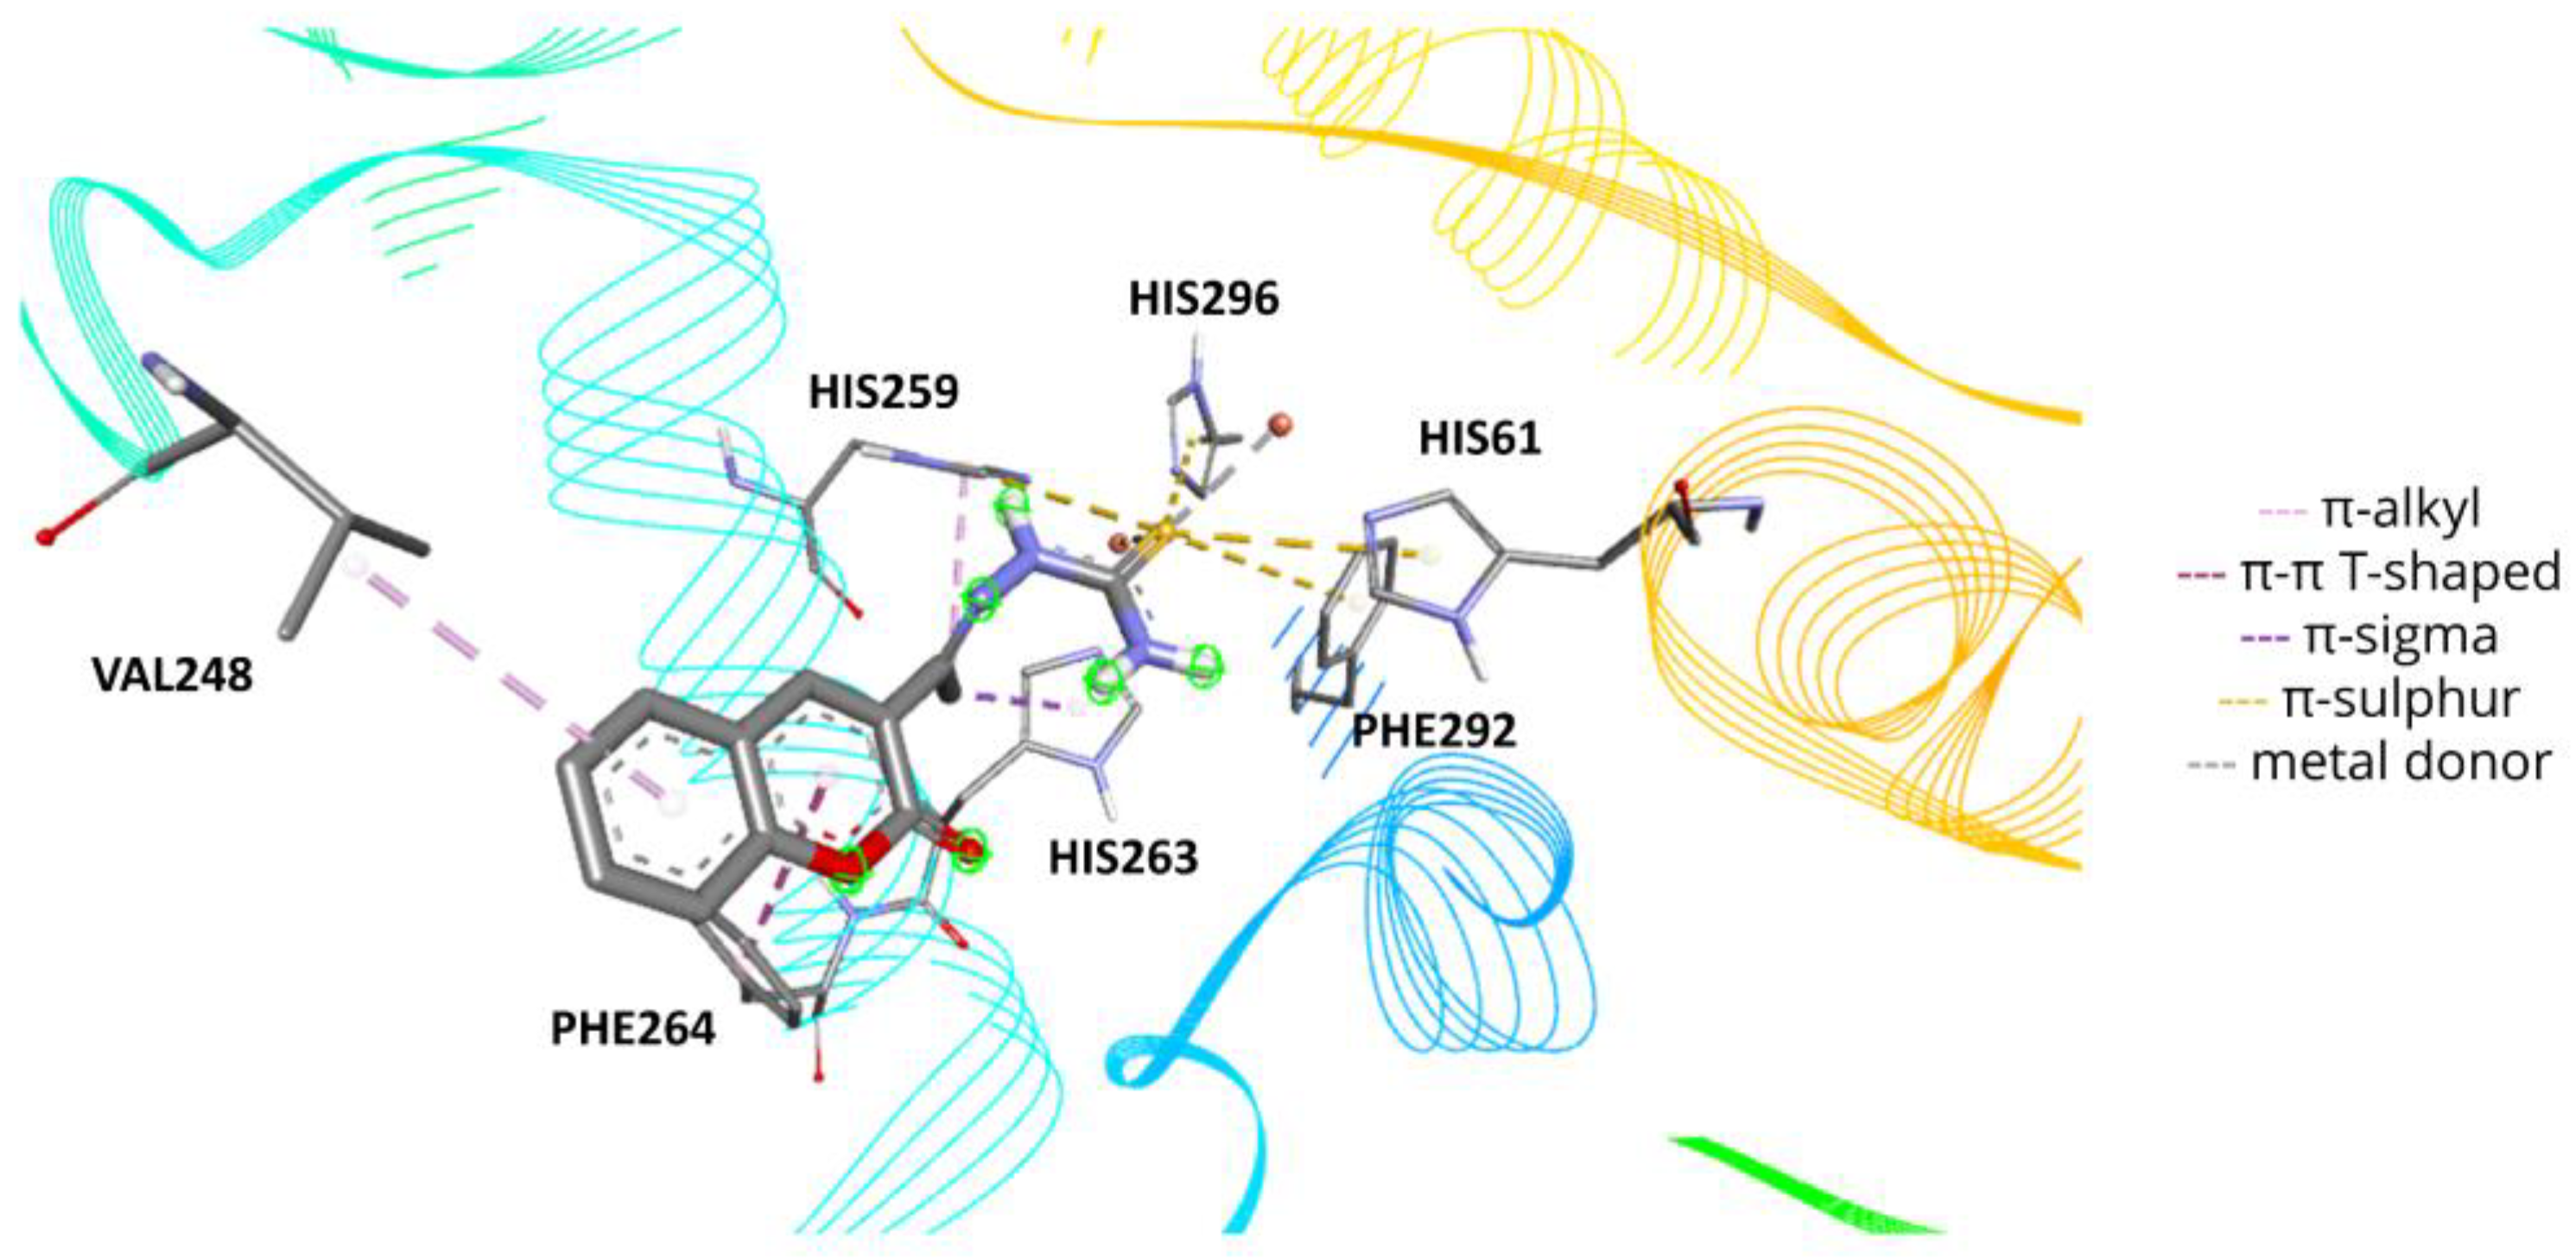
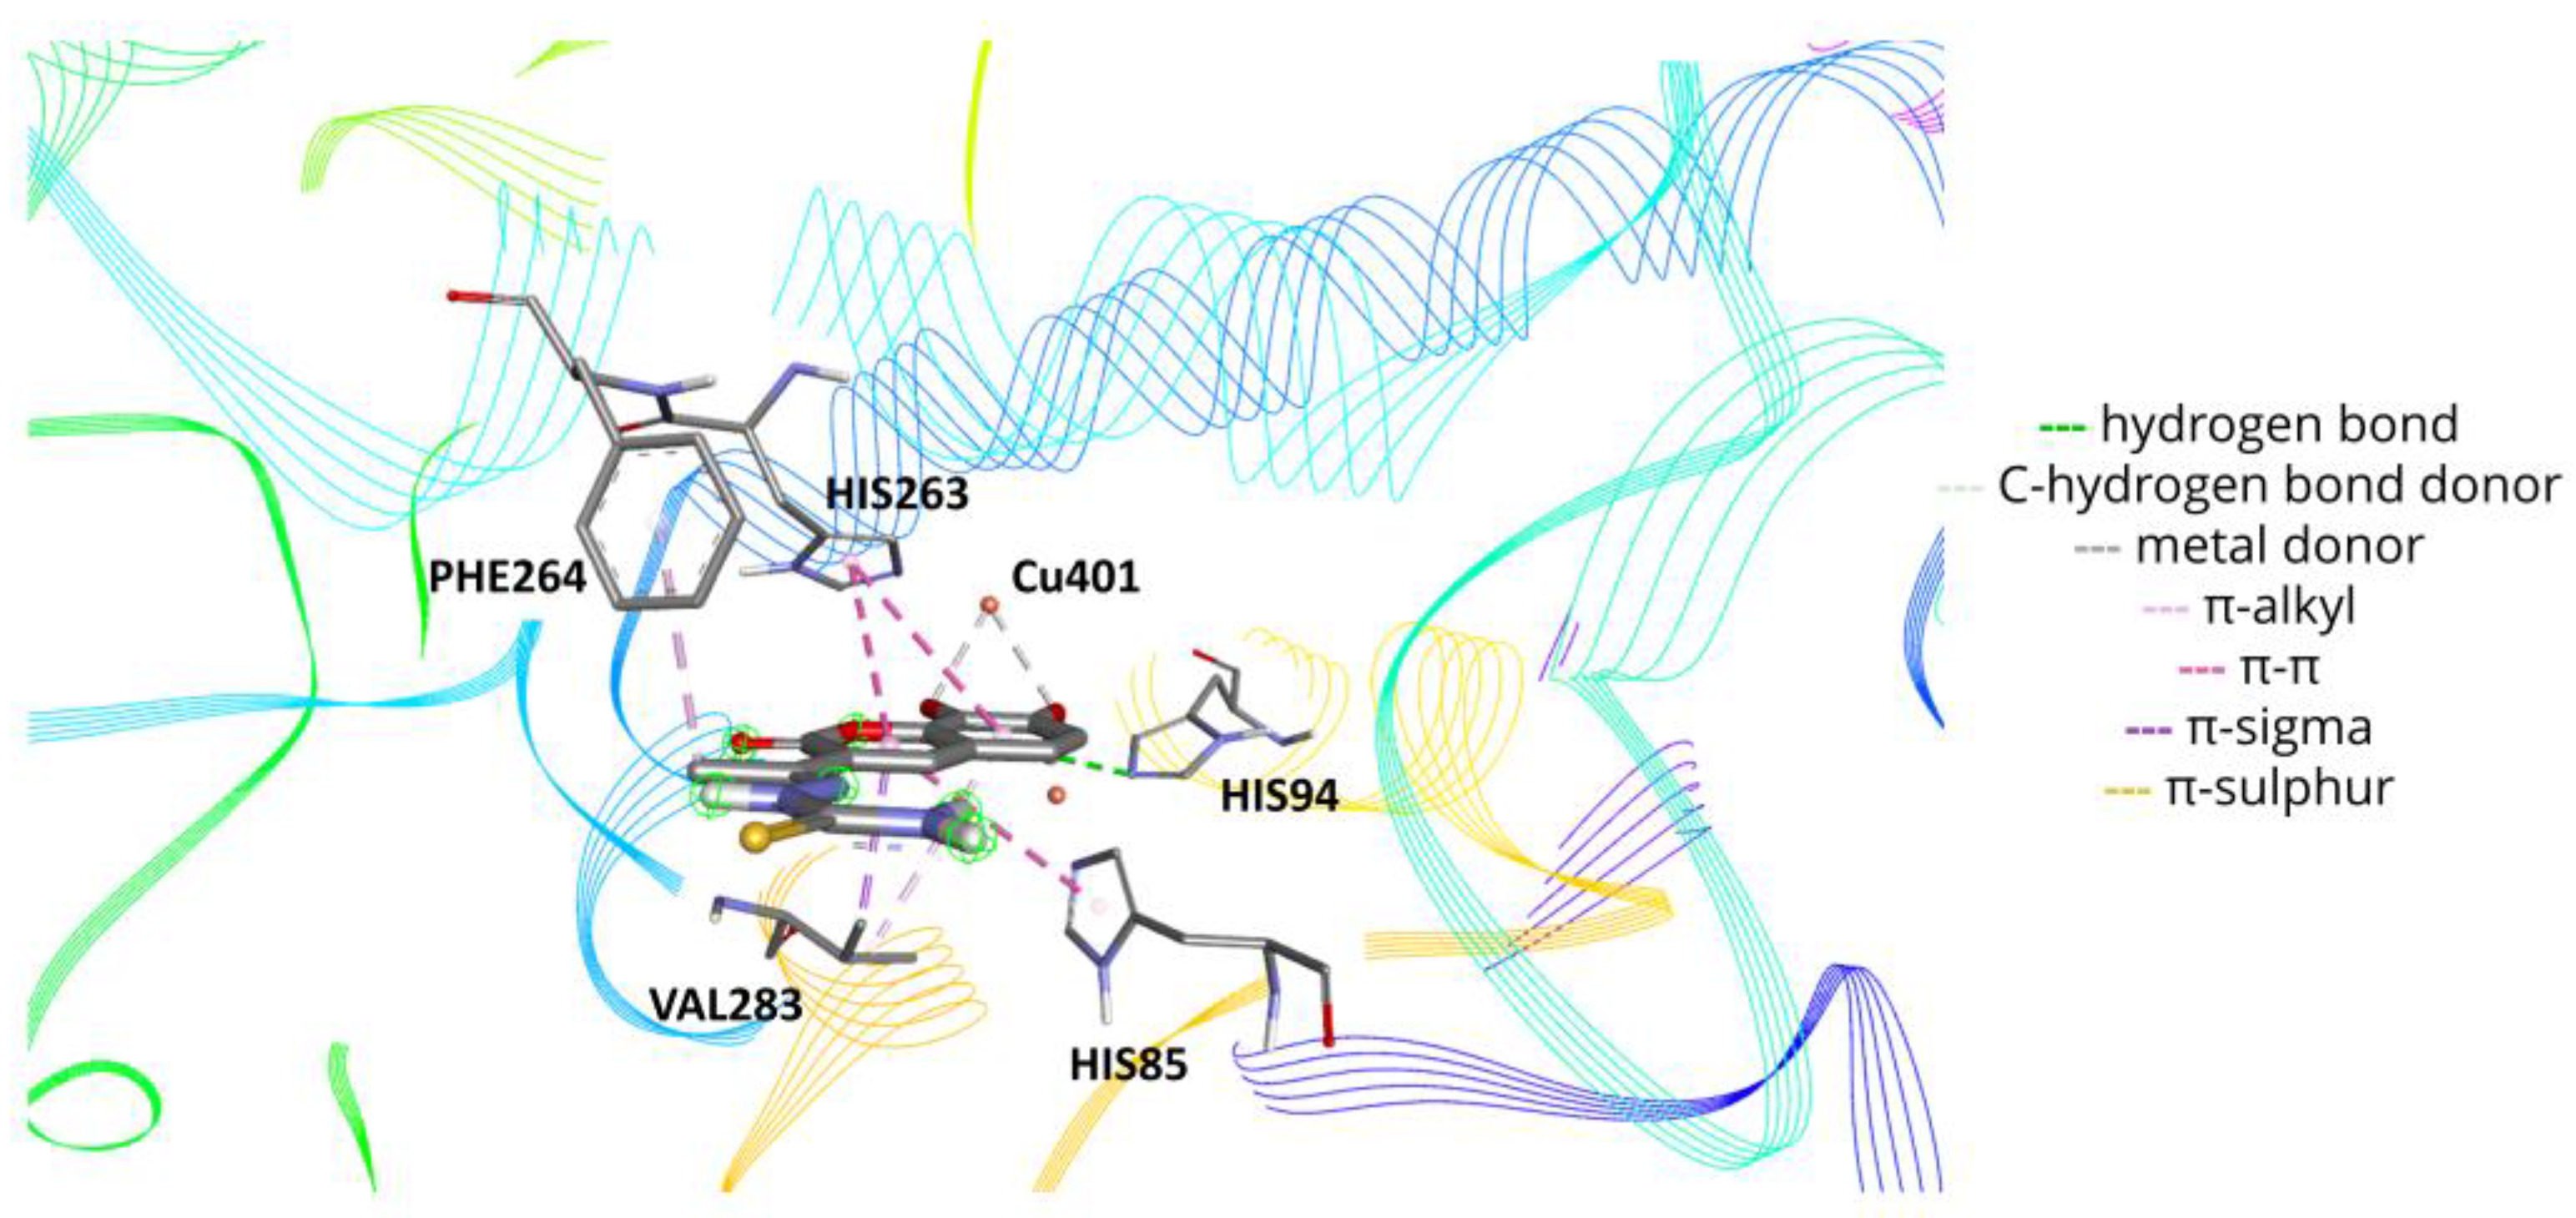
2.6. Molecular Docking

Input ligands structures.
Molecular docking simulations between mushroom tyrosinase (PDB: 2Y9X, A-chain) and the T1–6 molecules were performed considering the pH levels where the enzymatic inhibitory studies have been carried out (pH 6.8). As observed, at pH 6.8, compounds T1–4 existed in their neutral forms as H L for T1 and H 2 L for T2–4, whereas T5 and T6 were mainly present in their monoanionic form, H 2 L - . The structures of these species were simulated in water using the CPCM solvation model from DFT calculations. The results are shown in Figure S16. The structural metrics (bond lengths, angles, and dihedrals) of the DFT-optimized structure of T1 (as H L ) were consistent with the X-ray structure of the same compound [23] as evident from the superimposition of the structures, where the root-mean-square deviation (RMSD) was 0.12 Å (Figure S17). In Table S2, selected structural parameters for both calculated and crystallographic structures are reported. The structures of the monoanionic species H 2 L - for compounds T5 and T6 were assessed by determining the most plausible site of deprotonation through the calculation of the proton affinity (PA) values in the gas phase and water. The results, summarised in Table S3, indicate that compound T5 lost the acidic hydrogen from the hydroxyl group in the sixth position, whereas T6 released the proton from the -OH in the eighth one. This feature is related to the presence of a catechol-like motif in both molecules, which brings the formation of an intramolecular hydrogen bond between the phenate anion and the hydrogen of the neighbouring -OH groups (ortho effect) (Figure S16E,F).
Molecular docking protocol validation.
The docking protocol adopted has been validated by redocking the cognate OTR ligand in the receptor’s binding site. The molecular interactions between the docked pose of OTR and the surrounding residues of the receptor have been compared with those established by the crystallographic structure of the same ligand. The results are shown in Figure S18. The docked pose of OTR kept the π-π interactions with His263 and Val283, as observed in the crystallographic structure. On the contrary, the interaction between His259 and the X-ray structure of the ligand has been replaced by two new hydrogen bonds formed by the residues of His85 and Val283 with the docked OTR molecule. This difference could be attributed to two factors: (i) the resolution of the selected X-ray structure (2.78 Å); (ii) the fact that the scoring functions do not consider either entropy factors or solvation effects (simulations are performed in the gas phase) that might take place upon interaction between the receptor and the ligand. Assessment of the docking protocol performance is commonly performed by calculating the RMSD of the atomic positions of the docked pose with the X-ray structure of the same ligand. The results, reported in Figure S19, show an adequate overlapping (RMSD: 2.32 Å) between the predicted and experimental structures of the cognate OTR ligand.
Molecular docking simulation results.
The validated protocol has been applied for docking the studied thiosemicarbazones in the catalytic site (MTa) of mushroom tyrosinase. Taking compounds T1 and T6 as examples (Figure 5 and Figure 6), it is possible to observe how the presence of -OH substituents significantly alters their binding orientations in the receptor’s active site. In the case of T1 (docking score: 38.8535), the ligand was oriented with the thiosemicarbazone moiety towards the catalytic site, whereas the coumarinic ring was directed towards the enzyme surface. This molecule can coordinate both copper ions of the catalytic site using its thiocarbonyl group, thus suggesting the formation of a ternary complex with these metal cofactors as a potential mechanism of inhibition. The predicted pose was further stabilised by the presence of different intermolecular interactions with the surrounding receptor residues (e.g., π-π T-shaped with Phe264, π-alkyl with Val248, His259, π-sigma with His263, and π-Sulphur with His61, 259, and 296). In the case of compound T6 (docking score: 52.5943), the insertion of -OH groups in the coumarinic backbone resulted in a 180° twist of the predicted pose, with the hydroxyl groups oriented towards the enzyme’s catalytic site and the thiosemicarbazone pointing towards the enzyme’s surface. As observed for the other hydroxylated thiosemicarbazone derivatives, this conformation was stabilized by the presence of the π-alkyl and π-sigma interaction between the Val283 residue and the benzopyran-2-one ring of the ligands. In the specific case of T6, the docked pose was further stabilized by additional intermolecular interactions with the surrounding residues (e.g., H-bonds with His94, π-alkyl with Phe264, π-π stacked with His263, and π-π T-shaped with His85). This molecule can potentially coordinate the Cu401 ion through its oxygen atoms.
According to Lineweaver–Burk plots, compound T6 acts as a mixed-type inhibitor towards mushroom tyrosinase. Hassani et al. have shown by means of theoretical methods that the mixed inhibitors phthalic and cinnamic acids could exert their mode of action by interacting with two different allosteric sites (MTb for phthalic acid and MTc for cinnamic acid) in the complex between mushroom tyrosinase and tropolone [24]. Based on that, we evaluated the potential interaction of T6 at both allosteric sites by means of molecular docking. In Figure S20, the highest-ranking docking poses of T6 at both allosteric sites are summarized. A closer inspection of the intermolecular interactions reveals, for the docked pose of T6 in the MTb site, π-alkyl interactions with Pro366, Pro370, and Trp386 as well as π-π stacked interactions with His390 (Figure S21). Regarding the docked pose of T6 in the MTc site, the molecule was stabilized by π- π interactions with Trp358 and C-hydrogen bond donor with Thr308 (Figure S22). Considering the closeness of the docking score values obtained (43.4042 and 38.2733 for T6 when docked in MTb and MTc sites, respectively), it could be assumed that this mixed-type inhibitor might form ternary complexes with the enzyme and the substrate by binding at one of these allosteric sites.

3. Materials and Methods

3.1. Synthesis and Characterization Techniques

Ethyl acetoacetate, DPPH, ABTS, deuterated dimethyl sulfoxide, and salicylaldehyde and its hydroxylated derivatives were purchased from Alfa Aesar (Kandel, Germany). Absolute ethanol, piperidine, deuterated chloroform, thiosemicarbazide, and acetic acid were purchased from Merck (Milan, Italy). Reagents were used as received without further purification.
NMR spectra were acquired with a Bruker Advance III HD 600 spectrometer (Rheinstetten, Germany) at room temperature with tetramethylsilane (TMS) as the internal standard in DMSO-d6 or CDCl3. ESI mass spectra were recorded with a triple quadrupole QqQ Varian 310-MS mass spectrometer (Palo Alto, CA, USA) using previously optimized parameters [5]. High-resolution ESI mass spectra were acquired on a Thermofisher ORBITRAP-ELITE (Waltham, MA, USA). Melting points were measured on a Kofler Hot Stage (Rochford, UK) and are uncorrected.

3.2. General Procedure for the Synthesis of Substituted 3-Acetyl-2H-chromen-2-one Derivatives

Salycilaldehyde derivatives (7.24 mmol, 1.0 eq) and ethylacetoacetate (8.64 mmol, 1.2 eq) were dissolved in 2.6 mL of ethanol, and piperidine was then added (0.15 mmol, 0.02 eq). The reaction mixture was left under stirring at reflux for 5 h. For compounds 1–4 and 6, the reaction mixture was cooled to room temperature, affording a precipitate that was filtered and recrystallized from methanol. For compound 5, the reaction mixture was poured into cold water and treated with HCl 10% until an acidic pH level was reached. A dark brown solid was obtained after a few minutes of stirring. The solid was filtered, dried, repeatedly washed with Et2O, and used as such for the next step.
3-acetyl-2H-chromen-2-one (1). Light yellow solid. Yield 81%. Experimental results are in accordance with those reported in the literature [13]. Melting point: 178–180 °C. 1H-NMR (600 MHz, CDCl3, δ, ppm): 8.51 (d, J = 0.7 Hz, 1H), 7.69–7.63 (m, 2H), 7.40–7.32 (m, 2H), 2.73 (s, 3H). ESI-MS (calculated, found, m/z): 211.0, 211.0 [M+Na]+.
6-hydroxy-3-acetyl-2H-chromen-2-one (2). Yellow solid. Yield 63%. Experimental results are in accordance with those reported in the literature [25,26]. Melting point: 244–245 °C. 1H-NMR (600 MHz, DMSO d6, δ, ppm): 9.89 (s, 1H), 8.57–8.54 (m, 1H), 7.31 (d, J = 8.9 Hz, 1H), 7.24 (d, J = 2.9 Hz, 1H), 7.17 (dd, J = 8.9, 2.9 Hz, 1H), 2.58 (s, 3H). ESI-MS (calculated, found, m/z): 203.0, 203.0 [M-H].
7-hydroxy-3-acetyl-2H-chromen-2-one (3). Light brown solid. Yield 34%. Experimental results are in accordance with those reported in the literature [26,27]. Melting point: 243–244 °C. 1H-NMR (600 MHz, DMSO d6, δ, ppm): 11.10 (br. s, 1H), 8.59 (d, J = 0.7 Hz, 1H), 7.78 (d, J = 8.6 Hz, 1H), 6.85 (dd, J = 8.6, 2.3 Hz, 1H), 6.75 (dd, J = 2.3, 0.7 Hz, 1H), 2.55 (s, 3H). ESI-MS (calculated, found, m/z): 203.0, 203.1 [M-H].
8-hydroxy-3-acetyl-2H-chromen-2-one (4). Brown solid. Yield 57%. Experimental results are in accordance with those reported in the literature [26,28]. Melting point: 253–255 °C.1H-NMR (600 MHz, DMSO d6, δ, ppm): 10.35 (s, 1H), 8.59 (s, 1H), 7.36 (dd, J = 5.8, 3.4 Hz, 1H), 7.24–7.18 (m, 2H), 2.59 (s, 3H). ESI-MS (calculated, found, m/z): 205.0, 204.9 [M+H]+.
6,7-dihydroxy-3-acetyl-2H-chromen-2-one (5). Dark brown solid. Yield 61%. Melting point: 192–194 °C. 1H-NMR (600 MHz, DMSO d6, δ, ppm, Figure S1): 10.87 (br. s, 1H), 9.67 (br. s, 1H), 8.54 (s, 1H), 7.21 (s, 1H), 6.79 (s, 1H), 2.54 (s, 3H). ESI-MS (calculated, found, m/z): 219.0, 219.0 [M-H].
7,8-dihydroxy-3-acetyl-2H-chromen-2-one (6). Brown solid. Yield 25%. Experimental results are in accordance with those reported in the literature [26,29]. Melting point: 262–264 °C. 1H-NMR (600 MHz, DMSO d6, δ, ppm): 8.53 (s, 1H), 7.29 (d, J = 8.5 Hz, 1H), 6.85 (d, J = 8.5 Hz, 1H), 2.56 (s, 3H). ESI-MS (calculated, found, m/z): 219.0, 219.0 [M-H].

3.3. General Procedure for the Synthesis of Substituted (1E)-2-(1-(2-oxo-2H-chromen-3-yl)ethylidene)hydrazine-1-carbothioamide Compounds [13]

The proper 3-acetylcoumarin derivative (2.5 mmol, 1.0 eq) was dissolved in 10 mL of ethanol, and then thiosemicarbazide (2.5 mmol, 1.0 eq) and acetic acid (0.12 mL) were added. The reaction mixture was left under stirring at reflux for 6 h, and then it was cooled to room temperature, affording a precipitate that was filtered and recrystallized from ethanol.
(1E)-2-(1-(2-oxo-2H-chromen-3-yl)ethylidene)hydrazine-1-carbothioamide (T1). Yellow solid. Yield: 98%. Experimental data are consistent with those reported in the literature [13]. Melting point: 196–198 °C. 1H-NMR (600 MHz, DMSO d6, δ, ppm): 10.44 (s, 1H), 8.48 (s, 1H), 8.40 (s, 1H), 7.95 (s, 1H), 7.77 (dd, J = 7.7, 1.6 Hz, 1H), 7.65 (ddd, J = 8.7, 7.3, 1.6 Hz, 1H), 7.44 (d, J = 8.3 Hz, 1H), 7.40 (td, J = 7.5, 1.1 Hz, 1H), 2.26 (s, 3H). HR ESI-MS (calculated, found, m/z): 262.0650, 262.0646 [M+H]+. Elemental analysis exp(calc.) % C 55.24 (55.16), H 4.32 (4.24), N 16.11 (16.08), S 12.45 (12.27).
(1E)-2-(1-(6-hydroxy-2-oxo-2H-chromen-3-yl)ethylidene)hydrazine-1-carbothioamide (T2). Yellow solid. Yield: 82%. Melting point: 222–224 °C (with decomposition). 1H-NMR (600 MHz, DMSO d6, δ, ppm, Figure S2): 10.73 (s, 1H), 10.34 (s, 1H), 8.39 (s, 1H), 8.34 (s, 1H), 7.90 (s, 1H), 7.59 (d, J = 8.6 Hz, 1H), 6.84 (dd, J = 8.5, 2.3 Hz, 1H), 6.74 (d, J = 2.2 Hz, 1H), 2.24 (s, 3H). 13C-NMR (151 MHz, DMSO d6, δ, ppm, Figure S3): 179.55, 162.37, 159.99, 155.98, 147.05, 143.10, 131.06, 121.50, 114.15, 111.90, 102.23, 16.50. HR ESI-MS (calculated, found, m/z): 278.0599, 278.0591 [M+H]+. Elemental analysis exp(calc.) % C 51.78 (51.98), H 3.98 (4.00), N 15.18 (15.15), S 11.45 (11.56).
(1E)-2-(1-(7-hydroxy-2-oxo-2H-chromen-3-yl)ethylidene)hydrazine-1-carbothioamide (T3). Experimental data are consistent with those reported in the literature [30]. Yellow-brown earth was solid. Yield: 80%. Melting point: 222–224 °C (with decomposition). 1H-NMR (600 MHz, DMSO d6, δ, ppm): 10.40 (s, 1H), 9.80 (s, 1H), 8.37 (br. s, 1H), 8.36 (s, 1H), 7.95 (s, 1H), 7.27 (d, J = 8.0 Hz, 1H), 7.09–7.04 (m, 2H), 2.24 (s, 3H). 13C-NMR (151 MHz, DMSO d6, δ, ppm): 179.69, 159.84, 154.36, 147.27, 146.73, 142.41, 126.28, 120.98, 119.92, 117.33, 113.33, 16.56. HR ESI-MS (calculated, found, m/z): 278.0599, 278.0594 [M+H]+. Elemental analysis exp(calc.) % C 52.02 (51.98), H 4.06 (4.00), N 15.16 (15.15), S 11.45 (11.56).
(1E)-2-(1-(8-hydroxy-2-oxo-2H-chromen-3-yl)ethylidene)hydrazine-1-carbothioamide (T4). Light yellow solid. Yield: 93%. Melting point: 208–210 °C (with decomposition). 1H-NMR (600 MHz, DMSO d6, δ, ppm, Figure S4): 10.41 (s, 1H), 10.26 (s, 1H), 8.41 (s, 1H), 8.38 (s, 1H), 7.95 (d, J = 3.0 Hz, 1H), 7.19 (d, J = 4.4 Hz, 2H), 7.12 (t, J = 4.7 Hz, 1H), 2.26 (s, 3H). 13C-NMR (151 MHz, DMSO d6, δ, ppm, Figure S5): 179.71, 159.53, 146.64, 144.83, 142.90, 142.53, 126.12, 125.17, 120.35, 119.55, 119.12, 16.54. HR ESI-MS (calculated, found, m/z): 278.0599, 278.0595 [M+H]+. Elemental analysis exp(calc.) % C 51.92 (51.98), H 4.06 (4.00), N 15.12 (15.15), S 11.55 (11.56).
(1E)-2-(1-(6,7-dihydroxy-2-oxo-2H-chromen-3-yl)ethylidene)hydrazine-1-carbothioamide (T5). Dark brown solid. Yield: 44%. Melting point: 228–230 °C (with decomposition). 1H-NMR (600 MHz, DMSO d6, δ, ppm, Figure S6): 10.38 (s, 1H), 10.30 (s, 1H), 9.52 (s, 1H), 8.32 (s, 2H), 7.90 (s, 1H), 7.04 (s, 1H), 6.77 (s, 1H), 2.23 (s, 3H). 13C-NMR (151 MHz, DMSO d6, δ, ppm, Figure S7): 179.50, 160.29, 151.76, 149.28, 147.42, 143.68, 143.05, 121.51, 113.17, 111.42, 102.69, 15.92. HR ESI-MS (calculated, found, m/z): 294.0548, 294.0545 [M+H]+. Elemental analysis exp(calc.) % C 49.24 (49.14), H 3.82 (3.78), N 14.30 (14.33), S 10.89 (10.93).
(1E)-2-(1-(7,8-dihydroxy-2-oxo-2H-chromen-3-yl)ethylidene)hydrazine-1-carbothioamide (T6). Dark yellow solid. Yield: 45%. Melting point: 228–230 °C (with decomposition). 1H-NMR (600 MHz, DMSO d6, δ, ppm, Figure S8): 10.32 (s, 1H), 9.42 (br. s, 1H), 8.34 (s, 1H), 8.32 (s, 1H), 7.90 (s, 1H), 7.10 (d, J = 8.5 Hz, 1H), 6.85 (d, J = 8.5 Hz, 1H), 2.25 (s, 3H). 13C-NMR (151 MHz, DMSO d6, δ, ppm, Figure S9): 179.52, 159.98, 150.80, 147.28, 144.12, 143.69, 132.30, 121.27, 120.40, 113.50, 112.69, 16.58. HR ESI-MS (calculated, found, m/z): 294.0548, 294.0546 [M+H]+. Elemental analysis exp(calc.) % C 49.09 (49.14), H 3.77 (3.78), N 14.28 (14.33), S 10.90 (10.93).

3.4. Potentiometric and Spectrophotometric Titrations

Potentiometric titrations were performed in a thermostated vessel at 25 °C in 0.1 M ionic strength (NaCl) using a Mettler-Toledo Seven Compact pH/Ion-meter and equipped with a Mettler-Toledo InLab Micro Pro combined glass electrode with an integrated temperature probe. The glass electrode was calibrated daily and checked using the GLEE software package [31]. UV–visible (UV–Vis) measurements were carried out with an Agilent Cary 60 spectrophotometer using a 0.1 cm quartz cuvette. Protonation constants of the studied molecules were determined via spectrophotometric and potentiometric titrations. Solutions of ligands were prepared daily by dissolving a suitable amount of the compound in DMSO (concentration ≈ 12 mM) prior to the required dilution in 0.1 M NaCl (final DMSO content 1% V/V, concentration ≈ 1.2∙10−4 M). Four HCl equivalents for T1, five for T2–4, and six for T5–6 were added before titrating with an NaOH standard solution. Potentiometric and spectrophotometric data were simultaneously analysed using the Hyperquad 2006 software package [32]. Speciation diagrams were obtained using Hyss 2009 program [33] with the spectrophotometric data. The number of linearly independent absorbing species was found by applying the eigenvalue analysis to the absorbance data matrix.

3.5. DFT Calculations

DFT calculations were performed on an Intel i7-based system using the release 4.2.0 of the ORCA software package [34]. Input files for DFT calculations were prepared using Avogadro 1.2.0 [35]. Geometry optimisations were performed using the PBE0 functional [36] and def-2 TZVP basis set [37]. Geometry optimisations were performed starting from structural data when available. The nature of the minima obtained after each optimisation was verified by assessing the absence of negative calculated IR frequencies derived from the calculations of the Hessian matrix. DFT studies were performed both in the gas phase and in the presence of a solvent (water) using the conductor-like polarisable continuum model (CPCM) [38].
For compounds T5 and T6 ( H 3 L ), the structures of their monoanionic form have been evaluated by calculating the affinity towards their acidic hydrogens, expressed by the “proton affinity” (PA) thermochemical descriptor [16]:
PA = E H 2 L - + E H + - E H 3 L
where E H 2 L - is the formation enthalpy of the deprotonated species and E H + and E H 3 L are the formation enthalpies of the proton and the neutral molecules, respectively. Proton gas-phase enthalpy was taken from the literature as 1.481 kcal mol−1 [39], whereas proton water and ethanol enthalpy were calculated by assuming the solvation of a proton using the CPCM model as previously explained [16,40]

3.6. Drug-Likeness Descriptors

Molecular descriptors, such as TPSA (topological polar surface area), miLogP (calculated logarithm of the octanol: water partition coefficient), number of hydrogen bond donors and acceptors, number of rotatable bonds, molecular weight, molecular volume, and number of violations of Lipinski’s rule, were calculated using the Molinspiration property engine (v2021.10) (Molinspiration Cheminformatics Free Web Services, https://www.molinspiration.com (accessed on 9 January 2023), Slovensky Grob, Slovakia, n.d.)

3.7. Antioxidant Assays

Radical scavenging activities were measured with DPPH and ABTS radical scavenging assays [14,15,16]. For both methods, results are reported as the concentration of antioxidant required to quench 50% of the original absorbance (half maximal effective concentration, EC50). In brief, for the DPPH antioxidant assay procedure, each test compound was dissolved in DMSO at 1.0 mM concentration and then diluted with absolute ethanol in the 500–2.0 µM concentration range. A solution of the DPPH radical (0.1 mM, absolute ethanol) was freshly prepared, stored in the dark, and used within a few hours. Each test solution (1500 µL) was vigorously mixed to an equal volume of DPPH inside a cuvette, and the molecular absorbance at 517 nm was recorded for 30 min. Each test was evaluated in three independent experiments. Ascorbic acid was used as the reference compound. For the ABTS method, based on the capacity of an antioxidant to scavenge the free ABTS+ generated in the aqueous phase by reacting with a strong oxidizing, the free radical ABTS was produced by reacting 7 mM ABTS with 2.45 mM potassium persulfate in aqueous solution and kept in darkness at room temperature for 24 h before use. Samples of each compound (10 µL) were added to 990 µL of ABTS, and the reduction of the blue-green radical ABTS by hydrogen-donating antioxidants was evaluated by measuring the absorbance at 734 nm after 1 min incubation. The 6-hydroxy-2,5,7,8-tetramethylchromane-2-carboxylic acid (Trolox) was used as the antioxidant standard.

3.8. Tyrosinase Inhibition Assay

The inhibition of mushroom tyrosinase was evaluated as previously described [41] with slight modifications. A mixture containing 50 mM phosphoric acid buffer solution (pH 6.8), a solution of mushroom tyrosinase (72 U/mL final concentration; Sigma Chemical Co., Milan, Italy), and DMSO with or without the sample were incubated at 37 °C for 10 min. Then, L-DOPA solution (0.5 mM final) was added, and the reaction was monitored following the molecular absorbance at 492 nm that resulted from the formation of the dopachrome product. Measurements were performed using a FLUOstar OPTIMA (BMG Labtech, Offenburg, Germany). The IC50 value, i.e., concentration giving 50% inhibition of tyrosinase activity, was determined by analysing the dose-response curves. Kojic acid was used as a reference tyrosinase inhibitor. The inhibition mode was analysed using the Lineweaver–Burk plots.

3.9. Cell Viability Assay

The cellular cytotoxicity of compound T6 was investigated using a 3-(4,5-dimethylthiazol-2-yl)-2,5-diphenil-tetrazolium bromide (MTT) assay. Murine melanoma B16F10 cells were seeded in 96-well plates at a density of 5 × 10³ cells/well and cultured in Dulbecco’s Modified Eagle Medium (DMEM) with 10% fetal bovine serum at 37 °C in a humidified atmosphere with 5% CO2. The B16F10 cell line was exposed for 48 h to compound T6 at concentrations ranging from 4 to 100 μM. After incubation, culture supernatants were removed and exchanged with a medium containing 0.5 mg/mL MTT. Then, after 3 h of incubation at 37 °C, the cells were lysed with 100 μL of DMSO. The absorbance was determined at 560 nm using a microplate reader (Multiskan FC-Thermo Scientific Inc. Waltham, MA, USA).

3.10. Molecular Docking

Molecular docking simulations were performed using the CCDC GOLD software (v2022.1.0, Cambridge, UK) [42]. DFT-optimized structures of the ligands were exported as “*.mol2” files for molecular docking simulations. The crystal structure of the complex between mushroom tyrosinase (from Agaricus bisporus) and the inhibitor tropolone (OTR) was retrieved from the Protein Data Bank (PDB code: 2Y9X) [43]. The A-chain was used as a receptor for docking studies. The receptor was prepared using the GOLD setup wizard; specifically, the native OTR ligand was extracted from the receptor, the water molecules were removed, and the polar hydrogens were added throughout the enzyme structure. A binding cavity centred at the OTR coordinates that included all residues within 15 Å was chosen for docking simulations in the catalytic site of mushroom tyrosinase (MTa). Each ligand was submitted to 100 genetic algorithm runs using the Chemscore function, followed by rescoring using the ChemPLP function. The “Fitness & Search” options were kept as default. The search efficiency was set to maximum (200%) to comprehensively evaluate the docking conformational space. Validation of the docking protocol has been performed by redocking the cognate OTR ligand into its binding site and calculating theRMSD of the atomic position between the docked and crystallographic poses. For mixed-type inhibitors, molecular docking simulations were also extended to the allosteric sites MTb and MTc, keeping the cognate ligand OTR in the catalytic MTa site as previously done by Hassani et al. [24]. Regarding the MTb site, docking simulations were performed at coordinates x = 11.64, y = −28.74, and z = −31.95. In the case of the allosteric MTc site, a cavity centred at coordinates x = 3.20, y = −10.74, and z = −37.73 was chosen. Molecular interactions and docked poses were evaluated using CCDC Hermes (v2022.1.0, Cambridge, UK) [43] and BIOVIA Discovery Studio Viewer 2019 (Dassault Systèmes BIOVIA, Discovery Studio Viewer, V19, San Diego: Dassault Systèmes, 2019, n.d.)

3.11. Statistical Analyses

The evaluation of statistically significant differences was performed by calculating a one-way ANOVA followed by execution of the Bonferroni Multiple Comparisons Test, both using the Graph Pad INSTAT software v8.0 (GraphPad Software, San Diego, CA, USA).

4. Conclusions

The results reported in this study show how the insertion of hydroxyl groups in the structure of the coumarin-based thiosemicarbazone T1 allowed us to obtain a panel of novel compounds with potent antityrosinase activity and tuneable antioxidant properties.
The most promising compound of the series (T6) is a mixed-type inhibitor towards tyrosinase, as seen on Lineweaver–Burk plots, with antityrosinase activity higher than that of kojic acid. The safety of T6 has been proved from in vitro studies on B16F10 cells, where the studied molecule is not cytotoxic even at a higher concentration (25-fold) than its IC50 (4.1 μM). Based on molecular docking, this mixed-type inhibitor might target both catalytic (MTa) and allosteric (MTb and MTc) binding sites. Notably, these simulations were performed considering the protonated main species of the ligands really present at the pH experimental conditions chosen for tyrosinase inhibition assay. Thanks to the presence of a catechol-like motif, T6 showed more potent antioxidant properties than natural ascorbic acid and trolox antioxidants.
Thanks to the multidisciplinary approach proposed here, these encouraging results could be useful in designing novel coumarin-based molecules of biological relevance.

Supplementary Materials

The following supporting information can be downloaded at: https://www.mdpi.com/article/10.3390/ijms24021678/s1.

Author Contributions

Conceptualization: S.M., M.G.C., B.E., A.F. and T.P.; methodology: S.M., M.G.C., B.E., A.F., F.P. and T.P.; investigation: S.M., M.G.C., B.E. and E.C.; formal analysis: S.M., M.G.C., B.E., A.F. and F.P.; validation: S.M., M.G.C. and B.E.; visualization: S.M.; writing—original draft: S.M.; writing—review and editing: S.M., T.P. and A.F.; resources: T.P., E.C. and A.F.; supervision: S.M., M.G.C., B.E., A.F. and T.P. All authors have read and agreed to the published version of the manuscript.

Funding

This research received no external funding.

Institutional Review Board Statement

Not applicable.

Informed Consent Statement

Not applicable.

Data Availability Statement

Data are present within the article.

Acknowledgments

S.M. thanks MIUR for his PhD fellowship (XXXIV cycle). The authors thank the CeSAR (Centro Servizi Ricerca d’Ateneo) core facility of the University of Cagliari for the high-resolution mass spectrometry experiments performed with Orbitrap Elite, Thermo Fisher Scientific. We acknowledge the CeSAR core facility of the University of Cagliari and Sandrina Lampis for assistance with the generation of NMR data.

Conflicts of Interest

The authors declare no conflict of interest.

References

  1. Li, J.; Feng, L.; Liu, L.; Wang, F.; Ouyang, L.; Zhang, L.; Hu, X.; Wang, G. Recent Advances in the Design and Discovery of Synthetic Tyrosinase Inhibitors. Eur. J. Med. Chem. 2021, 224, 113744. [Google Scholar] [CrossRef] [PubMed]
  2. Solano, F.; Briganti, S.; Picardo, M.; Ghanem, G. Hypopigmenting Agents: An Updated Review on Biological, Chemical and Clinical Aspects. Pigment Cell Res. 2006, 19, 550–571. [Google Scholar] [CrossRef] [PubMed]
  3. Loizzo, M.R.; Tundis, R.; Menichini, F. Natural and Synthetic Tyrosinase Inhibitors as Antibrowning Agents: An Update. Compr. Rev. Food Sci. Food Saf. 2012, 11, 378–398. [Google Scholar] [CrossRef]
  4. Masamoto, Y.; Murata, Y.; Baba, K.; Shimoishi, Y.; Tada, M.; Takahata, K. Inhibitory Effects of Esculetin on Melanin Biosynthesis. Biol. Pharm. Bull. 2004, 27, 422–425. [Google Scholar] [CrossRef] [PubMed] [Green Version]
  5. Pivetta, T.; Masuri, S.; Cabiddu, M.G.; Caltagirone, C.; Pintus, A.; Massa, M.; Isaia, F.; Cadoni, E. A Novel Ratiometric and Turn-on Fluorescent Coumarin-Based Probe for Fe(Iii). New J. Chem. 2019, 43, 12032–12041. [Google Scholar] [CrossRef]
  6. Zolghadri, S.; Bahrami, A.; Hassan Khan, M.T.; Munoz-Munoz, J.; Garcia-Molina, F.; Garcia-Canovas, F.; Saboury, A.A. A Comprehensive Review on Tyrosinase Inhibitors. J. Enzyme Inhib. Med. Chem. 2019, 34, 279–309. [Google Scholar] [CrossRef] [Green Version]
  7. Matos, M.J.; Santana, L.; Uriarte, E.; Delogu, G.; Corda, M.; Fadda, M.B.; Era, B.; Fais, A. New Halogenated Phenylcoumarins as Tyrosinase Inhibitors. Bioorganic Med. Chem. Lett. 2011, 21, 3342–3345. [Google Scholar] [CrossRef]
  8. Matos, M.J.; Varela, C.; Vilar, S.; Hripcsak, G.; Borges, F.; Santana, L.; Uriarte, E.; Fais, A.; Di Petrillo, A.; Pintus, F.; et al. Design and Discovery of Tyrosinase Inhibitors Based on a Coumarin Scaffold. RSC Adv. 2015, 5, 94227–94235. [Google Scholar] [CrossRef]
  9. Pintus, F.; Matos, M.J.; Vilar, S.; Hripcsak, G.; Varela, C.; Uriarte, E.; Santana, L.; Borges, F.; Medda, R.; Di Petrillo, A.; et al. New Insights into Highly Potent Tyrosinase Inhibitors Based on 3-Heteroarylcoumarins: Anti-Melanogenesis and Antioxidant Activities, and Computational Molecular Modeling Studies. Bioorganic Med. Chem. 2017, 25, 1687–1695. [Google Scholar] [CrossRef]
  10. Denat, L.; Kadekaro, A.L.; Marrot, L.; Leachman, S.A.; Abdel-Malek, Z.A. Melanocytes as Instigators and Victims of Oxidative Stress. J. Investig. Dermatol. 2014, 134, 1512–1518. [Google Scholar] [CrossRef]
  11. Lu, T.M.; Ko, H.H.; Ng, L.T.; Hsieh, Y.P. Free-Radical-Scavenging, Antityrosinase, and Cellular Melanogenesis Inhibitory Activities of Synthetic Isoflavones. Chem. Biodivers. 2015, 12, 963–979. [Google Scholar] [CrossRef] [PubMed]
  12. Hałdys, K.; Latajka, R. Thiosemicarbazones with Tyrosinase Inhibitory Activity. Medchemcomm 2019, 10, 378–389. [Google Scholar] [CrossRef] [PubMed]
  13. Liu, J.; Wu, F.; Chen, L.; Zhao, L.; Zhao, Z.; Wang, M.; Lei, S. Biological Evaluation of Coumarin Derivatives as Mushroom Tyrosinase Inhibitors. Food Chem. 2012, 135, 2872–2878. [Google Scholar] [CrossRef] [PubMed]
  14. Floris, S.; Fais, A.; Rosa, A.; Piras, A.; Marzouki, H.; Medda, R.; González-Paramás, A.M.; Kumar, A.; Santos-Buelga, C.; Era, B. Phytochemical Composition and the Cholinesterase and Xanthine Oxidase Inhibitory Properties of Seed Extracts from the Washingtonia Filifera Palm Fruit. RSC Adv. 2019, 9, 21278–21287. [Google Scholar] [CrossRef] [PubMed] [Green Version]
  15. Masuri, S.; Cadoni, E.; Cabiddu, M.G.; Isaia, F.; Demuru, M.G.; Morán, L.; Morán, L.; Bucek, D.; Vanhara, P.; Vanhara, P.; et al. The First Copper(Ii) Complex with 1, 10-Phenanthroline and Salubrinal with Interesting Biochemical Properties. Metallomics 2020, 12, 891–901. [Google Scholar] [CrossRef] [PubMed]
  16. Masuri, S.; Cabiddu, M.G.; Cadoni, E.; Pivetta, T. Hydroxylated 3-(Pyridin-2-Yl) Coumarins as Radical Scavengers with Potent Lipoxygenase Inhibitor Activity. New J. Chem. 2021, 45, 10749–10760. [Google Scholar] [CrossRef]
  17. Nurchi, V.M.; Crisponi, G.; Lachowicz, J.I.; Murgia, S.; Pivetta, T.; Remelli, M.; Rescigno, A.; Niclós-Gutíerrez, J.; González-Pérez, J.M.; Domínguez-Martín, A.; et al. Iron(III) and Aluminum(III) Complexes with Hydroxypyrone Ligands Aimed to Design Kojic Acid Derivatives with New Perspectives. J. Inorg. Biochem. 2010, 104, 560–569. [Google Scholar] [CrossRef]
  18. Lipinski, C.A.; Lombardo, F.; Dominy, B.W.; Feeney, P.J. Experimental and Computational Approaches to Estimate Solubility and Permeability in Drug Discovery and Development Settings. Adv. Drug Deliv. Rev. 2012, 64, 4–17. [Google Scholar] [CrossRef]
  19. Ertl, P.; Rohde, B.; Selzer, P. Fast Calculation of Molecular Polar Surface Area as a Sum of Fragment-Based Contributions and Its Application to the Prediction of Drug Transport Properties. J. Med. Chem. 2000, 43, 3714–3717. [Google Scholar] [CrossRef]
  20. Pajouhesh, H.; Lenz, G.R. Medicinal Chemical Properties of Successful Central Nervous System Drugs. NeuroRX 2005, 2, 541–553. [Google Scholar] [CrossRef]
  21. Zhou, R.; Moench, P.; Heran, C.; Lu, X.; Mathias, N.; Faria, T.N.; Wall, D.A.; Hussain, M.A.; Smith, R.L.; Sun, D. PH-Dependent Dissolution in Vitro and Absorption in Vivo of Weakly Basic Drugs: Development of a Canine Model. Pharm. Res. 2005, 22, 188–192. [Google Scholar] [CrossRef] [PubMed]
  22. Dressman, J.B.; Amidon, G.L.; Reppas, C.; Shah, V.P. Dissolution Testing as a Prognostic Tool for Oral Drug. Pharm. Res. 1998, 15, 11–23. [Google Scholar] [CrossRef] [PubMed] [Green Version]
  23. Ranade, D.S.; Bapat, A.M.; Ramteke, S.N.; Joshi, B.N.; Roussel, P.; Tomas, A.; Deschamps, P.; Kulkarni, P.P. Thiosemicarbazone Modification of 3-Acetyl Coumarin Inhibits Aβ Peptide Aggregation and Protect against Aβ-Induced Cytotoxicity. Eur. J. Med. Chem. 2016, 121, 803–809. [Google Scholar] [CrossRef]
  24. Hassani, S.; Haghbeen, K.; Fazli, M. Non-Specific Binding Sites Help to Explain Mixed Inhibition in Mushroom Tyrosinase Activities. Eur. J. Med. Chem. 2016, 122, 138–148. [Google Scholar] [CrossRef] [PubMed]
  25. Martínez-Martínez, F.J.; Razo-Hernández, R.S.; Peraza-Campos, A.L.; Villanueva-García, M.; Sumaya-Martínez, M.T.; Cano, D.J.; Gómez-Sandoval, Z. Synthesis and in Vitro Antioxidant Activity Evaluation of 3-Carboxycoumarin Derivatives and Qsar Study of Their Dpph Radical Scavenging Activity. Molecules 2012, 17, 14882–14898. [Google Scholar] [CrossRef] [PubMed]
  26. Barrientos, C.; Navarrete-Encina, P.; Squella, J.A. Electrochemistry and Reactivity Against Superoxide Anion Radicals of Hydroxycoumarins and Its Derivatives. J. Electrochem. Soc. 2020, 167, 165502. [Google Scholar] [CrossRef]
  27. Starčević, Š.; Brožič, P.; Turk, S.; Cesar, J.; Lanišnik Rižner, T.; Gobec, S. Synthesis and Biological Evaluation of (6-and 7-Phenyl) Coumarin Derivatives as Selective Nonsteroidal Inhibitors of 17β-Hydroxysteroid Dehydrogenase Type 1. J. Med. Chem. 2011, 54, 248–261. [Google Scholar] [CrossRef]
  28. Liu, X.H.; Fan, J.C.; Liu, Y.; Shang, Z.C. L-Proline as an Efficient and Reusable Promoter for the Synthesis of Coumarins in Ionic Liquid. J. Zhejiang Univ. Sci. B 2008, 9, 990–995. [Google Scholar] [CrossRef] [Green Version]
  29. Wang, P.; Xia, Y.L.; Zou, L.W.; Qian, X.K.; Dou, T.Y.; Jin, Q.; Li, S.Y.; Yu, Y.; Wang, D.D.; Luo, Q.; et al. An Optimized Two-Photon Fluorescent Probe for Biological Sensing and Imaging of Catechol-O-Methyltransferase. Chem. A Eur. J. 2017, 23, 10800–10807. [Google Scholar] [CrossRef]
  30. Kalaiarasi, G.; Mohamed Subarkhan, M.; Fathima Safwana, C.K.; Sruthi, S.; Sathiya Kamatchi, T.; Keerthana, B.; Ashok Kumar, S.L. New Organoruthenium(II) Complexes Containing N, X-Donor (X = O, S) Heterocyclic Chelators: Synthesis, Spectral Characterization, in Vitro Cytotoxicity and Apoptosis Investigation. Inorganica Chim. Acta 2022, 535, 120863. [Google Scholar] [CrossRef]
  31. Gans, P.; O’Sullivan, B. GLEE, a New Computer Program for Glass Electrode Calibration. Talanta 2000, 51, 33–37. [Google Scholar] [CrossRef] [PubMed]
  32. Gans, P.; Sabatini, A.; Vacca, A. Investigation of Equilibria in Solution. Determination of Equilibrium Constants with the HYPERQUAD Suite of Programs. Talanta 1996, 43, 1739–1753. [Google Scholar] [CrossRef] [PubMed]
  33. Alderighi, L.; Gans, P.; Ienco, A.; Peters, D.; Sabatini, A.; Vacca, A. Hyperquad Simulation and Speciation (HySS): A Utility Program for the Investigation of Equilibria Involving Soluble and Partially Soluble Species. Coord. Chem. Rev. 1999, 184, 311–318. [Google Scholar] [CrossRef]
  34. Neese, F. The ORCA Program System. Wiley Interdiscip. Rev. Comput. Mol. Sci. 2012, 2, 73–78. [Google Scholar] [CrossRef]
  35. Hanwell, M.D.; Curtis, D.E.; Lonie, D.C.; Vandermeersch, T.; Zurek, E.; Hutchison, G.R. Avogadro: An Advanced Semantic Chemical Editor, Visualization, and Analysis Platform. J. Cheminform. 2012, 4, 17. [Google Scholar] [CrossRef] [Green Version]
  36. Adamo, C.; Barone, V. Toward Reliable Density Functional Methods without Adjustable Parameters: The PBE0 Model. J. Chem. Phys. 1999, 110, 6158–6170. [Google Scholar] [CrossRef]
  37. Weigend, F.; Ahlrichs, R. Balanced Basis Sets of Split Valence, Triple Zeta Valence and Quadruple Zeta Valence Quality for H to Rn: Design and Assessment of Accuracy. Phys. Chem. Chem. Phys. 2005, 7, 3297–3305. [Google Scholar] [CrossRef]
  38. Barone, V.; Cossi, M. Conductor Solvent Model. J. Phys. Chem. A 1998, 102, 1995–2001. [Google Scholar] [CrossRef]
  39. Bartmess, J.E. Thermodynamics of the Electron and the Proton. J. Phys. Chem. 1994, 98, 6420–6424. [Google Scholar] [CrossRef]
  40. Marković, Z.; Tošović, J.; Milenković, D.; Marković, S. Revisiting the Solvation Enthalpies and Free Energies of the Proton and Electron in Various Solvents. Comput. Theor. Chem. 2016, 1077, 11–17. [Google Scholar] [CrossRef]
  41. Era, B.; Floris, S.; Sogos, V.; Porcedda, C.; Piras, A.; Medda, R.; Fais, A.; Pintus, F. Anti-Aging Potential of Extracts from Washingtonia Filifera Seeds. Plants 2021, 10, 151. [Google Scholar] [CrossRef] [PubMed]
  42. Jones, G.; Willett, P.; Glen, R.C.; Leach, A.R.; Taylor, R. Development and Validation of a Genetic Algorithm for Flexible Docking. J. Mol. Bio. 1997, 267, 727–748. [Google Scholar] [CrossRef] [PubMed] [Green Version]
  43. Ismaya, W.T.; Rozeboom, H.J.; Weijn, A.; Mes, J.J.; Fusetti, F.; Wichers, H.J.; Dijkstra, B.W. Crystal Structure of Agaricus Bisporus Mushroom Tyrosinase: Identity of the Tetramer Subunits and Interaction with Tropolone. Biochemistry 2011, 50, 5477–5486. [Google Scholar] [CrossRef] [PubMed]
Figure 1. Structures and acronyms of the studied compounds.
Ijms 24 01678 g001
Scheme 1. Reaction scheme and structures of the synthesized compounds. Reaction conditions were: (a) piperidine; EtOH; reflux; 5 h. (b) Acetic acid; EtOH; reflux; 5 h.
Ijms 24 01678 sch001
Figure 2. Lineweaver−Burk plots for inhibition of compound T1 (A) and T6 (B) on mushroom tyrosinase for catalysis of L-DOPA. Inhibitor concentrations were 0 (○), 1 µM (●), 5 µM (□), and 7 µM (■).
Ijms 24 01678 g002
Figure 3. Selected spectra, reported as molar absorptivity, were collected during the potentiometric and spectrophotometric titrations of T1–6 (AF) (25 °C, NaCl 0.1 M).
Ijms 24 01678 g003
Figure 4. The effect of compound T6 on B16F10 cells at different concentrations (4–100 μM). Data are expressed as a percentage of the control. Data are presented as the mean ± the SD from three experiments.
Ijms 24 01678 g004
Figure 5. Docked pose of T1 in the catalytic MTa site and intermolecular interactions with the surrounding residues of mushroom tyrosinase.
Ijms 24 01678 g005
Figure 6. Docked pose of T6 in the catalytic MTa site and intermolecular interactions with the surrounding residues of mushroom tyrosinase.
Ijms 24 01678 g006
Table 1. EC50 values for the studied compounds determined from the antioxidant assays. Ascorbic acid and Trolox were used as reference compounds.
DPPHABTS
CompoundEC50 (µM)EC50 (µM)
T1>250 a72 ± 6 a
T2>250 a25.7 ± 0.4 b
T3>250 a36 ± 1 c
T428 ± 2 b21.8 ± 0.8 b
T57.1 ± 0.3 c9 ± 1 d
T617.9 ± 0.4 d8.8 ± 0.4 d
Ascorbic Acid18.6 ± 0.6 d-
Trolox-13 ± 1 d
Each EC50 value is expressed as mean ± the standard error of the mean (SEM) of three independent experiments. Different letters within the same column denote statistically significant differences between compounds (p < 0.05).
Table 2. IC50 values for the studied compounds determined from the tyrosinase assay. Kojic acid was used as the reference compound.
CompoundIC50 (µM)
T14 ± 2 a
T214 ± 7 b
T35 ± 2 a,c
T45.7 ± 0.8 a
T56 ± 2 a
T64.1 ± 0.7 a
Kojic acid18 ± 1 b
The data are expressed as mean ± the standard deviation (SD) of three independent experiments. Means followed by distinct letters in the same column were found to be significantly different (p < 0.05).
Table 3. Calculated molecular descriptors for the studied compounds.
T1T2T3T4T5T6
miLogP a1.801.301.301.530.811.04
TPSA (Å2) b80.62100.85100.85100.85121.08121.08
n-atoms c181919192020
MW (Da)261.31277.31277.31277.31293.30293.30
n-ON d566677
n-OHNH e344455
n-violations f000000
n-rotb g333333
Volume (Å3) h219.96227.98227.98227.98236.00236.00
a Calculated logarithm of the partition coefficient between n-octanol and water (milogP); b topological polar surface area (TPSA); c number of atoms in the molecule (n-atoms); d number of hydrogen bond acceptors (n-ON); e number of hydrogen bond donors (n-OHNH); f number of violations of Lipinski’s rule of five; g number of rotatable bonds (n-rotb); h molecular volume.
Table 4. Protonation constants of T1–6 (25 °C, NaCl 0.1 M). The standard deviation to the last significant figure is reported in parentheses.
CompoundEquilibriumLogβpK
T1 L - + H + H L 8.46 (9)8.5
L - + 2 H + H 2 L + 13.47 (9)5.0
L - + 3 H + H 3 L 2 + 17.45 (8)4.0
T2 L 2 - + H + H L - 10.20 (8)10.2
L 2 - + 2 H + H 2 L 17.24 (6)6.8
L 2 - + 3 H + H 3 L + 22.4 (1)5.4
L 2 - + 4 H + H 4 L 2 + 26.7 (1)4.3
T3 L 2 - + H + H L - 10.5 (1)10.5
L 2 - + 2 H + H 2 L 17.6 (1)7.1
L 2 - + 3 H + H 3 L + 23.26 (7)5.7
L 2 - + 4 H + H 4 L 2 + 26.7 (1)3.4
T4 L 2 - + H + H L - 10.4 (1)10.4
L 2 - + 2 H + H 2 L 17.26 (1)6.9
L 2 - + 3 H + H 3 L + 22.94 (5)5.7
L 2 - + 4 H + H 4 L 2 + 26.5 (2)3.6
T5 L 3 - + H + H L 2 - 10.7 (1)10.7
L 3 - + 2 H + H 2 L - 18.46 (9)7.8
L 3 - + 3 H + H 3 L 24.76 (7)6.3
L 3 - + 4 H + H 4 L + 29.50 (6)4.7
L 3 - + 4 H + H 4 L 2 + 33.2 (1)3.7
T6 L 3 - + H + H L 2 - 10.5 (2)10.5
L 3 - + 2 H + H 2 L - 19.3 (1)8.8
L 3 - + 3 H + H 3 L 25.1 (1)5.8
L 3 - + 4 H + H 4 L + 29.5 (1)4.4
L 3 - + 4 H + H 4 L 2 + 33.0 (1)3.5
Disclaimer/Publisher’s Note: The statements, opinions and data contained in all publications are solely those of the individual author(s) and contributor(s) and not of MDPI and/or the editor(s). MDPI and/or the editor(s) disclaim responsibility for any injury to people or property resulting from any ideas, methods, instructions or products referred to in the content.

