Article

Evolutionary Analysis of StSnRK2 Family Genes and Their Overexpression in Transgenic Tobacco Improve Drought Tolerance

1
State Key Laboratory of Aridland Crop Science, Gansu Agricultural University, Lanzhou 730070, China
2
College of Life Science, Sichuan Agricultural University, Ya’an 625014, China
3
College of Agronomy, Gansu Agricultural University, Lanzhou 730070, China
4
College of Horticulture, Gansu Agricultural University, Lanzhou 730070, China
*
Author to whom correspondence should be addressed.
Int. J. Mol. Sci. 2023, 24(2), 1000; https://doi.org/10.3390/ijms24021000
Submission received: 4 December 2022 / Revised: 31 December 2022 / Accepted: 3 January 2023 / Published: 5 January 2023
(This article belongs to the Special Issue Drought Stress Tolerance in Plants in 2022)

Abstract

:
Sucrose non-ferment 1-related protein kinase 2 (SnRK2) is a highly conserved protein kinase in plants that plays an important role in regulating plant response to drought stress. Although it has been reported in some plants, the evolutionary relationship of potato SnRK2s and their function in drought resistance have not been systematically analyzed. In this study, molecular characteristic analysis showed that 8 StSnRK2s were distributed on six chromosomes, coding proteins were divided into three subgroups, and StSnRK2s clustered in the same subgroup had similar conserved motifs and domains. In addition, StSnRK2 has a wide range of replication events in some species, making it closer to dicots in the process of evolution. In addition, the average nonsynonymous substitution rate/synonymous substitution rate (Ka/Ks) value of SnRK2s in monocots was higher than that of dicots. The codon usage index showed that SnRK2s prefer to use cytosine 3 (C3s), guanine 3 (G3s) and GC content (GC3s) in monocots, whereas thymine 3 (T3s) and adenine 3 (A3s) are preferred in dicots. Furthermore, stress response analysis showed that the expression of StSnRK2s under different degrees of drought stress significantly correlated with one or more stress-related physiological indices, such as proline and malondialdehyde (MDA) content, superoxide dismutase (SOD) and catalase (CAT) activity, ion leakage (IL) etc. The drought resistance of StSnRK2 transgenic plants was determined to occur in the order of StSnRK2.1/2.8 > StSnRK2.2/2.5 > StSnRK2.4/2.6 > StSnRK2.3 > StSnRK2.7, was attributed to not only lower IL but also higher proline, soluble sugar contents and stress-related genes in transgenic plants compared to wild type (WT). In conclusion, this study provides useful insights into the evolution and function of StSnRK2s and lays a foundation for further study on the molecular mechanism of StSnRK2s regulating potato drought resistance.

1. Introduction

As sessile organisms, plants are often subjected to various adverse environmental factors, such as drought, salinity, low temperature, high temperature, etc. [1]. Among them, drought is the main environmental factor that restricts plant growth and development and causes serious reductions in the yield of all kinds of crops all over the world, even resulting in no harvest in some areas [2]. Cultivating drought-tolerant varieties by manipulating drought-tolerant genes is a potential and attractive measure to address these challenges [3,4]. In this regard, in-depth mining of key genes that play important roles in regulating plant drought resistance and clarification of the molecular mechanisms of their response and adaptation to drought stress are of great significance to alleviate the effects of drought stress on crop yield [5,6].
As an important phytohormone, abscisic acid (ABA) plays an important role in plant response to drought stress [7,8]. There are three core components in the plant ABA signaling pathway: ABA receptors pyrabactin resistance 1/PYR1-like/regulatory components of ABA receptors (PYR/PYL/RCARs), type 2C protein phosphatase (PP2C) and sucrose non-fermenting 1-related protein kinases 2 (SnRK2s), which together form a double-negative regulation system, i.e., PYL-PP2C-SnRK2, to regulate ABA signal transduction [9]. When plants are subjected to drought stress, ABA accumulation increases rapidly. Then, ABA is perceived and bound by its receptors, PYL, and releases SnRK2 by inhibiting the activity of PP2C. Activated SnRK2 kinase can phosphorylate and activate downstream transcription factors (TFs) such as ABA-responsive element-binding protein (AREB)/ABRE binding factors (ABFs) and ultimately improves plant drought resistance [10,11]. In this complex process, SnRK2 plays a pivotal role in transmitting the ABA signal and activating downstream protein expression [12]. Phylogenetic analysis showed that SnRK2 family members can be divided into three subgroups. Group I kinases cannot be activated by ABA, group II kinases can be activated or weakly activated by ABA (depending on the plant species) and group III kinases can be strongly activated by ABA. To date, SnRK2 genes have been isolated and identified in several species, such as 10 genes in Arabidopsis [13], 10 genes in rice [14], 14 genes in maize [15], 22 genes in soybean [16], 22 genes in tobacco [17], 8 genes in camellia [18], 20 genes in cotton [19], 9 genes in pepper [20], 14 genes in grape [21] and 8 genes in mung bean [22].
In recent years, with the gradual resolution of the ABA signaling pathway, remarkable progress has been made with respect to the role of SnRK2 proteins in regulating plant drought resistance. In Poncirus trifoliata, ABA-dependent kinase SnRK2.4 was reported to enhance the expression of the ADC gene by phosphorylating ABF2 protein, which makes transgenic plants accumulate putrescine, resulting in stronger drought resistance [23]. Arabidopsis thaliana SnRK2.4 promoted the expression of DREB2A, DREB2B and RD29A genes through interaction with MYB21 and ultimately improved plant tolerance to drought stress [24]. SnRK2.6 induced stomatal closure by phosphorylating ubiquitin E3 ligase RZFP34/CHYR1, thus enhancing the drought resistance of transgenic plants [25]. SAPK9/SnRK9 has been reported to directly phosphorylate MADS23 in an ABA-dependent manner; this activated MADS23 then directly regulates the high expression of its target genes, NCED2, NCED3, NCED4, and P5CR, thus increasing ABA and proline accumulation and ultimately improving the drought tolerance of transgenic rice [26]. In Triticum aestivum, SnRK2.8 enhances the drought resistance of transgenic plants by activating ABA-dependent pathway genes (RD20A and RD29B) and ABA-independent pathway genes (CBF1, CBF2 and CBF3) [27]. In Morus alba, SnRK2.1/2.4 forms a ternary complex with Gγ1/Gγ2 and PP2Cs, which enhances the adaptability of plants to drought stress by enhancing ABA signaling [28]. These studies indicate that SnRK2 kinase plays a critical role in supporting plant resist drought stress; there are some differences in signaling pathways, but its effects mainly occur through phosphorylation modification to regulate downstream gene expression and protein activity. Therefore, it is highly important and urgent to deeply explore the involvement of SnRK2 kinase in drought resistance and to clarify its molecular mechanism for enhancing plant resistance and improving crop yield under drought stress.
Potato (Solanum tuberosum L.) is indispensable to global food security and is the fourth largest staple crop in China [29]; this crop is mainly planted in the northwest of China [30]. Owing to the natural conditions of water shortage in northwest China, potatoes often suffer from drought stress, which seriously affects the local and even national commercial yield of potatoes [31]. Consequently, research on drought resistance genes and functional identification of potato has become a hot spot in recent years. For instance, the overexpression of StGA2ox1 [32], StDRO1 [33], StPIP1 [34], StRFP2 [35], StMAPK11 [36] and StProDH1 [37] genes has effectively improved the adaptability of transgenic plants to drought stress. However, few studies have been conducted on the function of core genes of the ABA signaling pathway in potato response to drought stress. In our previous study, a total of eight StSnRK2 genes (StSnRK2.1-2.8) were isolated, and the subcellular localization of StSnRK2 proteins was analyzed [38]. On this basis, in this study, we further investigated the gene structures and chromosomal distribution of StSnRK2s, the conserved motif and evolutionary relationship of coding proteins, selection pressure and codon usage bias using TBtools and related software. In addition, the expression profiles of StSnRK2s under ABA and drought stress were detected by qPCR. Finally, the function of StSnRK2 genes in response to drought stress was verified by stable transformation of tobacco. The results of this study provide useful information, contributing to the understanding of the function of StSnRK2 genes, which are valuable candidates for genetic improvement of drought resistance in potato.

2. Results

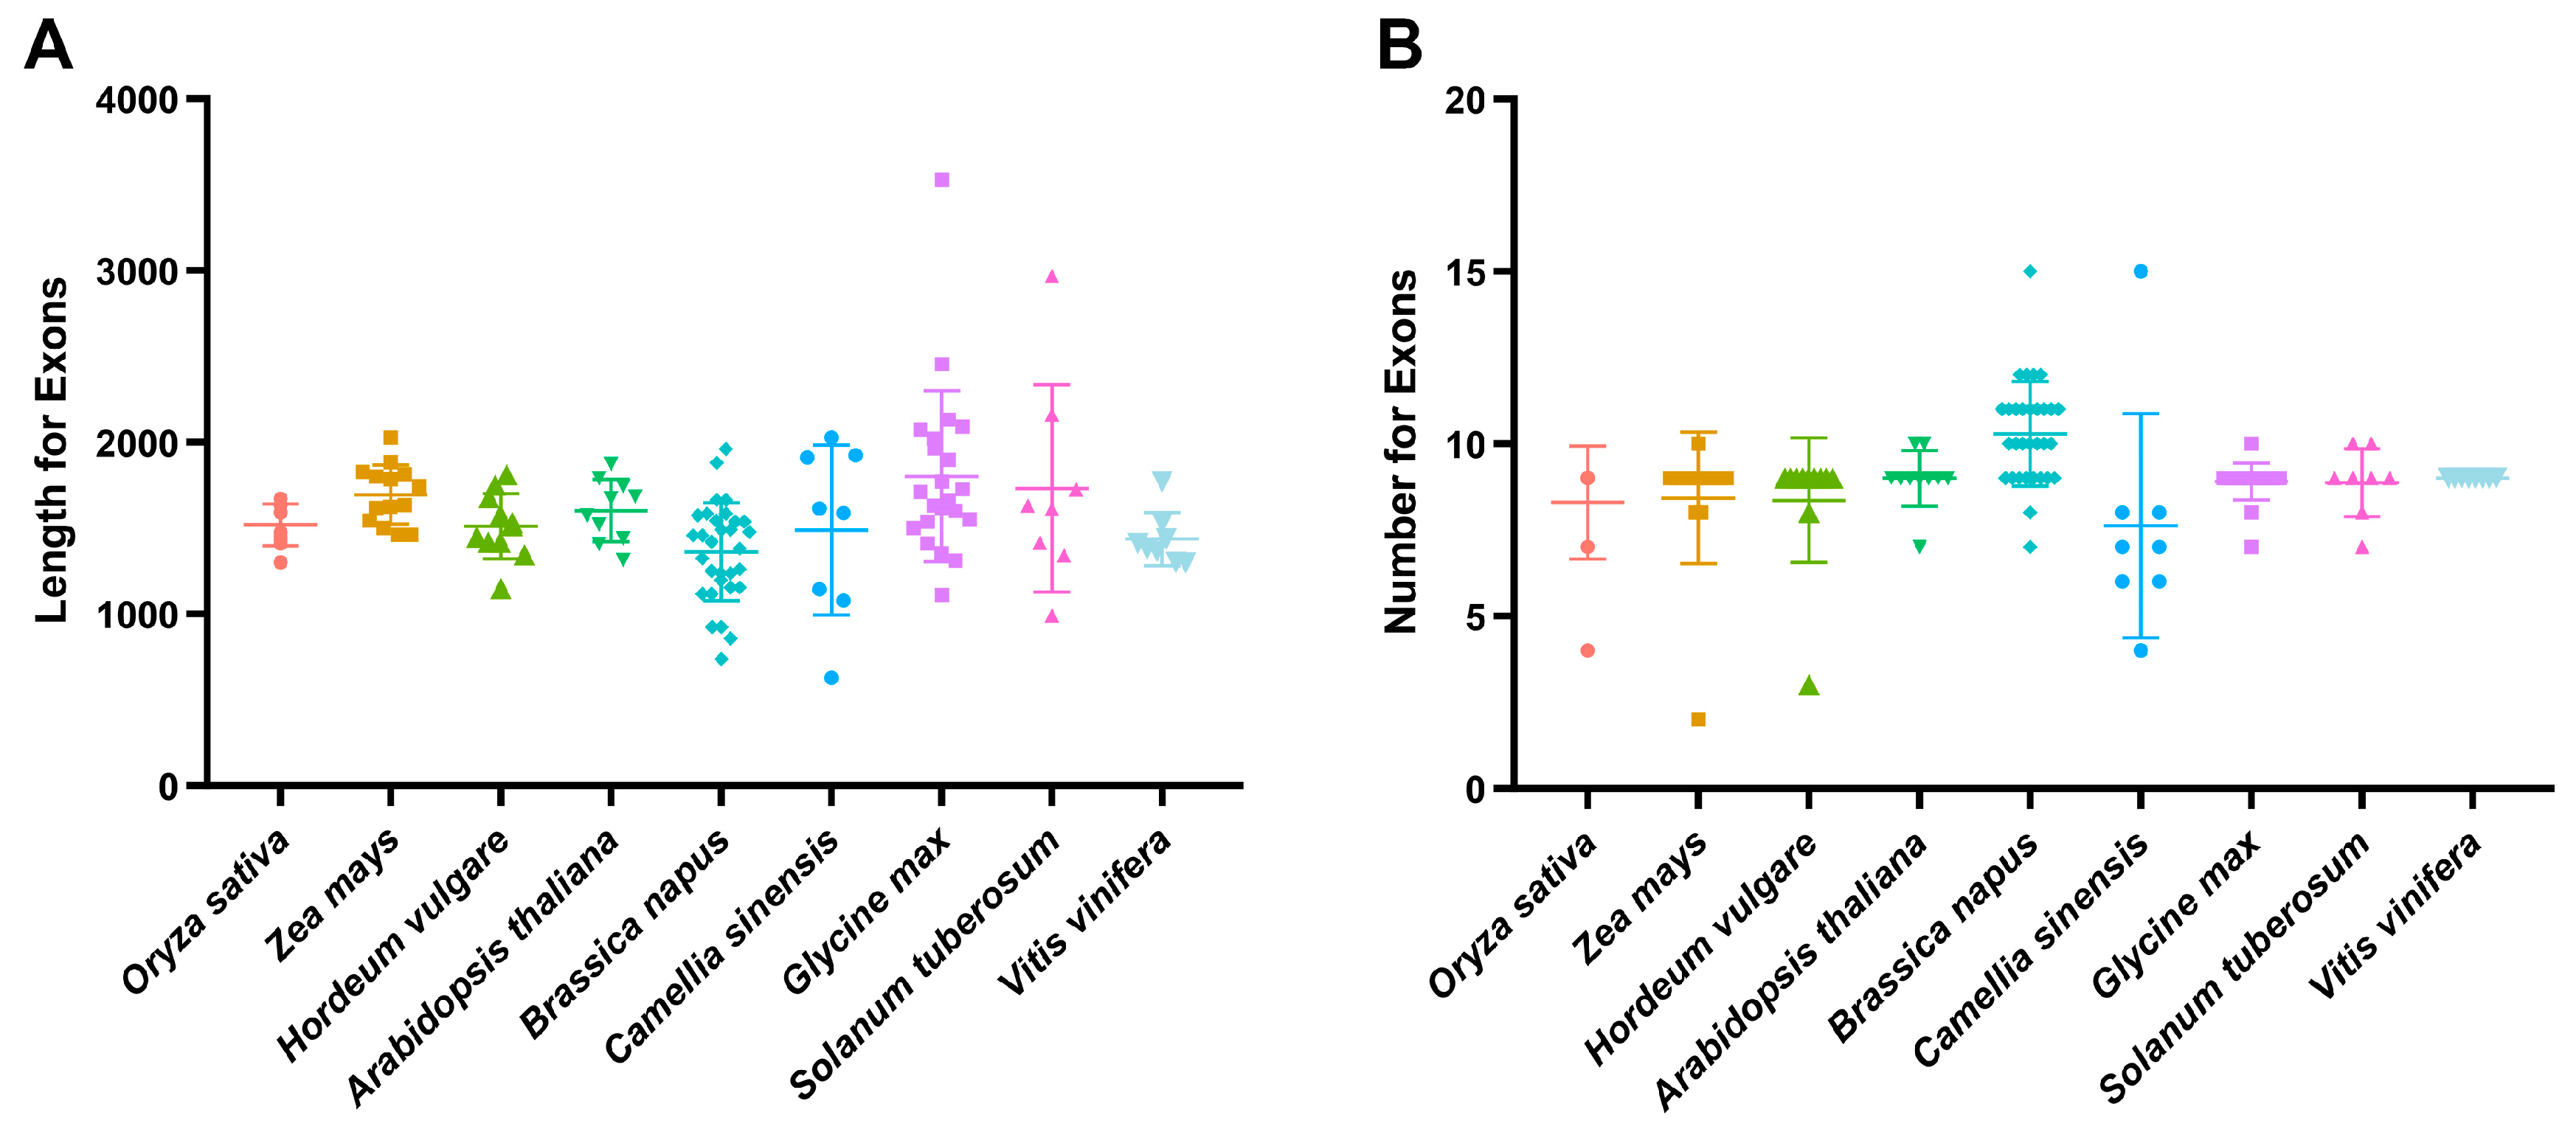
2.1. Gene Structure, Motif Composition and Chromosomal Distribution of StSnRK2 Genes

We first explored the characteristic regions of StSnRK2 proteins, and Arabidopsis SnRK2 genes were selected as a reference. Ten conserved motifs were identified through the MEME website and visualized in TBtools (Figure S1A,B). The length of these motifs ranges between 11 (motifs 7 and 9) and 50 (motifs 1, 2, 3 and 4) amino acids. The number of motifs in StSnRK2 proteins varies from 3 to 9. The motifs of StSnRK2s are highly conserved, and motifs 1–7 exist in almost all StSnRK2s, excluding StSnRK2.8. With the exception of StSnRK2.8, all other proteins contain at least seven motifs. However, there are some variations between different groups. For example, motif 9 exists only in group I, and motif 8 is unique to group I, except AtSnRK2.9, suggesting that these motifs may play an important role in the gene function of different subfamilies.
We also clarified the structural composition of SnRK2 genes. The results show that all the coding sequences of SnRK2 genes were destroyed by introns, with the number of introns ranging from 6 to 9, demonstrating some differences in degree among the 8 StSnRK2 genes and 10 AtSnRK2 genes (Figure S1A,C). The genes with the largest number of introns are StSnRK2.2, AtSnRK2.2 and AtSnRK2.6. Interestingly, there are fewer differences in exon/intron structure between different subfamilies of StSnRK2s, which may indicate that there is no significant difference in the gene structure of StSnRK2s in the process of evolution.
Furthermore, the gene structure of SnRK2 family genes in potato and eight selected species were analyzed. The cDNA length of 122 SnRK2 genes varies from 627 (CsSnRK2.18) to 3528 (GmSnRK2.7) bp. The variations among Brassica napus, Camellia sinensis, Glycine max, and Solanum tuberosum cDNA length is significant, whereas other species are relatively concentrated (Figure 1A). Moreover, the predicted exon structure shows that 59.8% of SnRK2 genes harbor nine exons. Notably, Vitis vinifera SnRK2 genes have nine exons, indicating a highly conserved gene family. The exon number of SnRK2 in Camellia sinensis varies greatly, ranging from 4 to 15 (Figure 1B).
A chromosomal distribution map of StSnRK2 genes was generated. A total of eight StSnRK2 genes were found to be unevenly distributed on 6 of 12 potato chromosomes (Figure S2). Among of them, Chr1 (StSnRK2.3 and StSnRK2.4) and Chr4 (StSnRK2.1 and StSnRK2.5) contain two StSnRK2 genes each, and the rest of the chromosomes contain one StSnRK2 gene each. Interestingly, the distribution of StSnRK2 genes on the chromosomes is mostly concentrated at the two ends of the chromosomes, and very few StSnRK2 genes are distributed in the middle position.

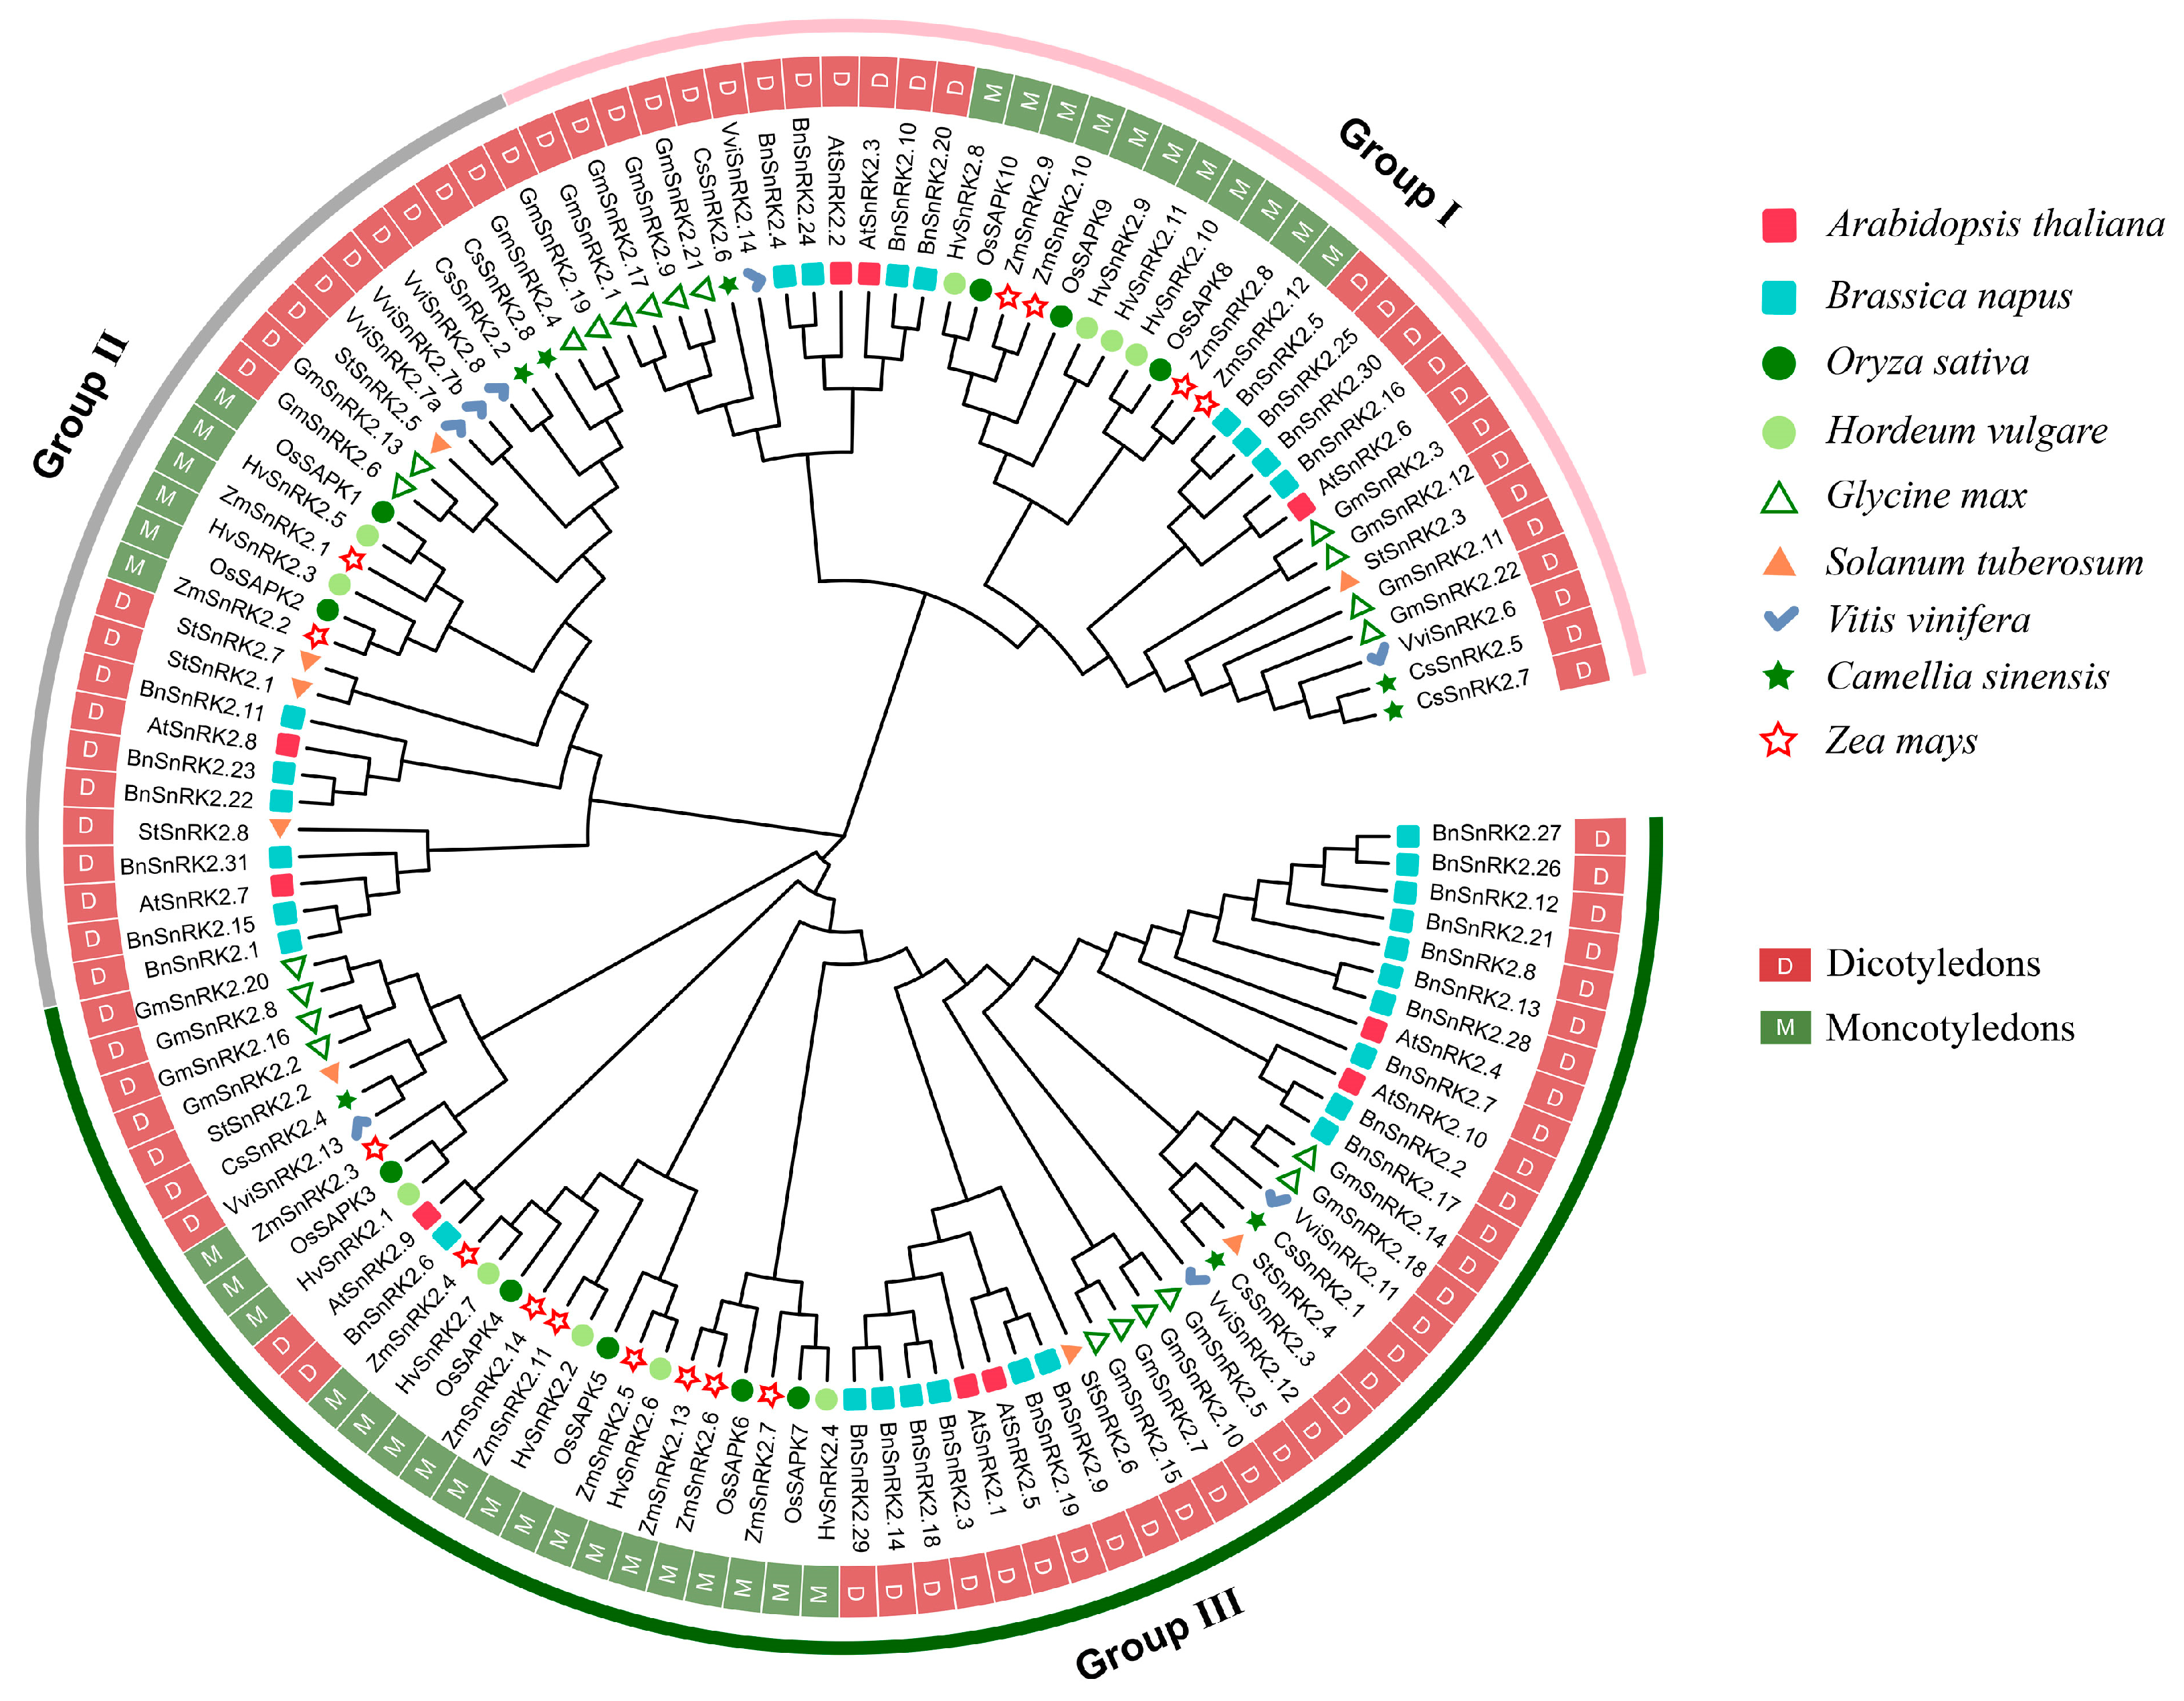
2.2. Phylogenetic Analysis Divides StSnRK2s into Three Subgroups

In addition to StSnRK2 proteins, 114 SnRK2 protein sequences from eight species (three monocotyledons and five dicotyledons) were used to construct a phylogenetic tree, together with StSnRK2s. The tree shows that the SnRK2 proteins can be divided into three subgroups, namely group I–group III, containing 36, 27 and 59 SnRK2 proteins, respectively (Figure 2). Only 1 StSnRK2 (2.3) is classified into group I, with four StSnRK2s (2.1, 2.5, 2.7 and 2.8) classified into group II and three StSnRK2s (2.2, 2.4 and 2.6) classified into group III. Interestingly, phylogenetic tree analysis revealed that 122 SnRK2 proteins can be clearly divided into four monocotyledon and five dicotyledon subgroups. Group I and group II comprise two monocotyledon subgroups each. Group III comprises one monocotyledon subgroup.

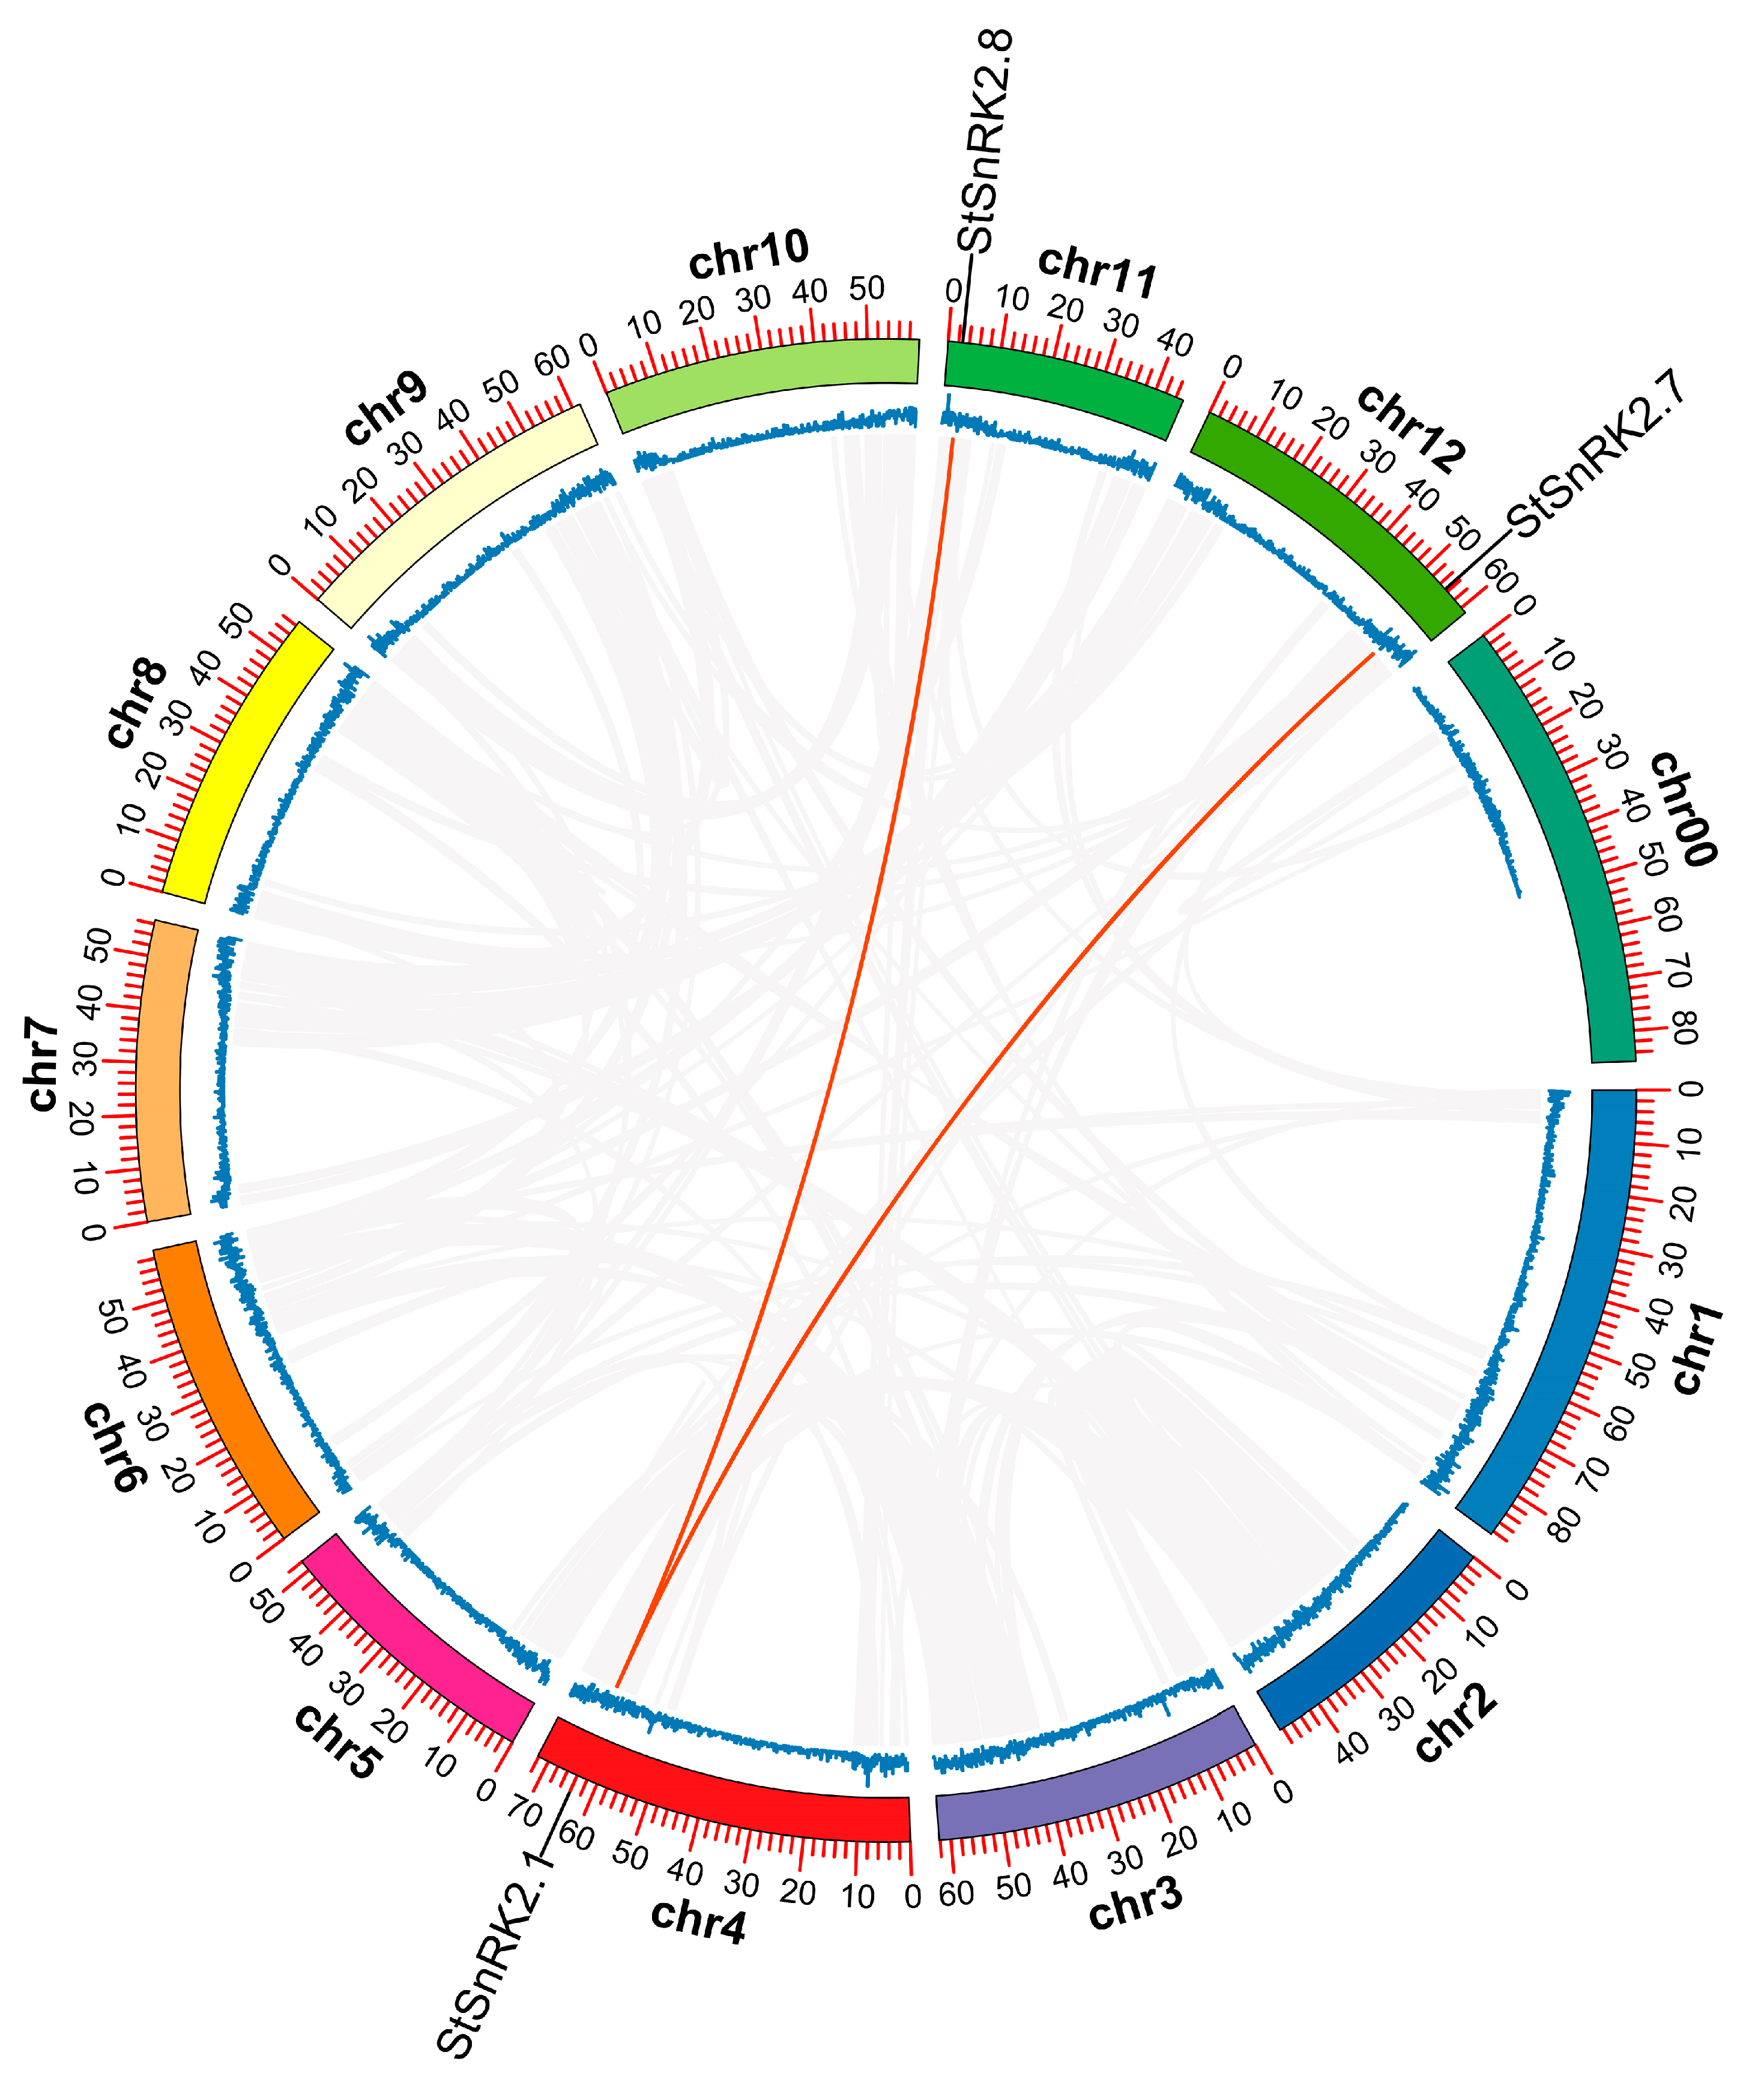
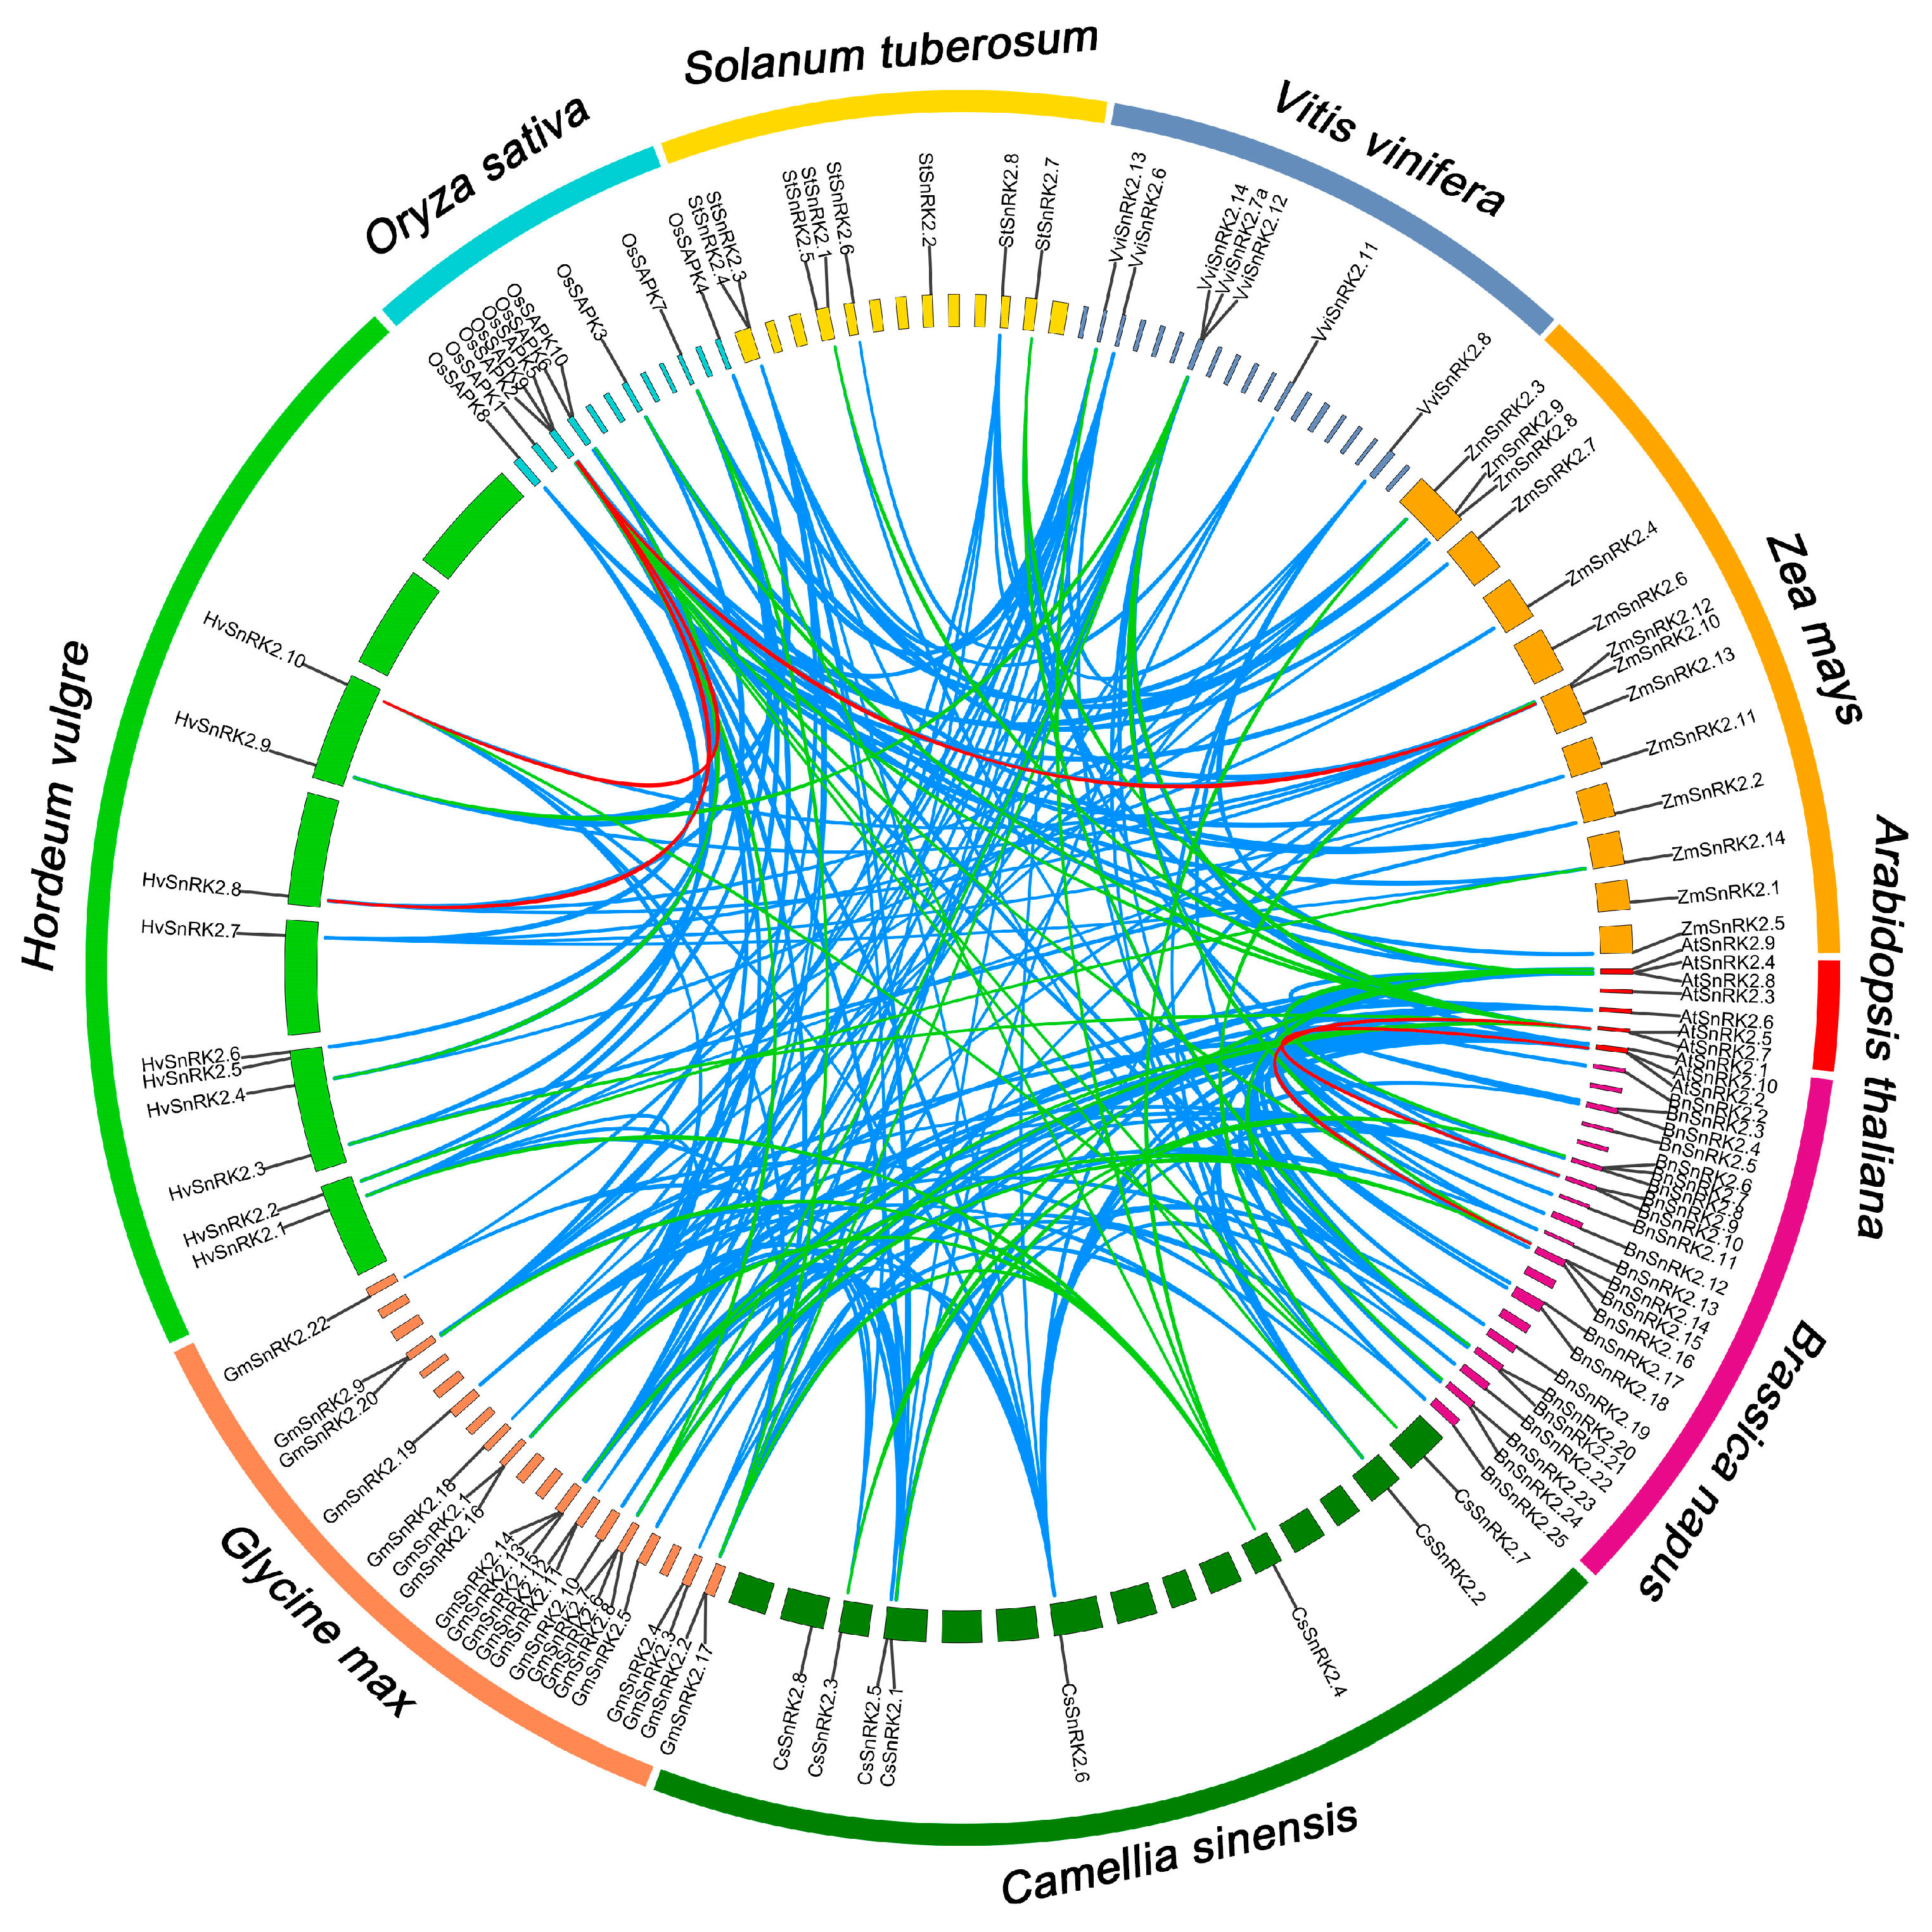
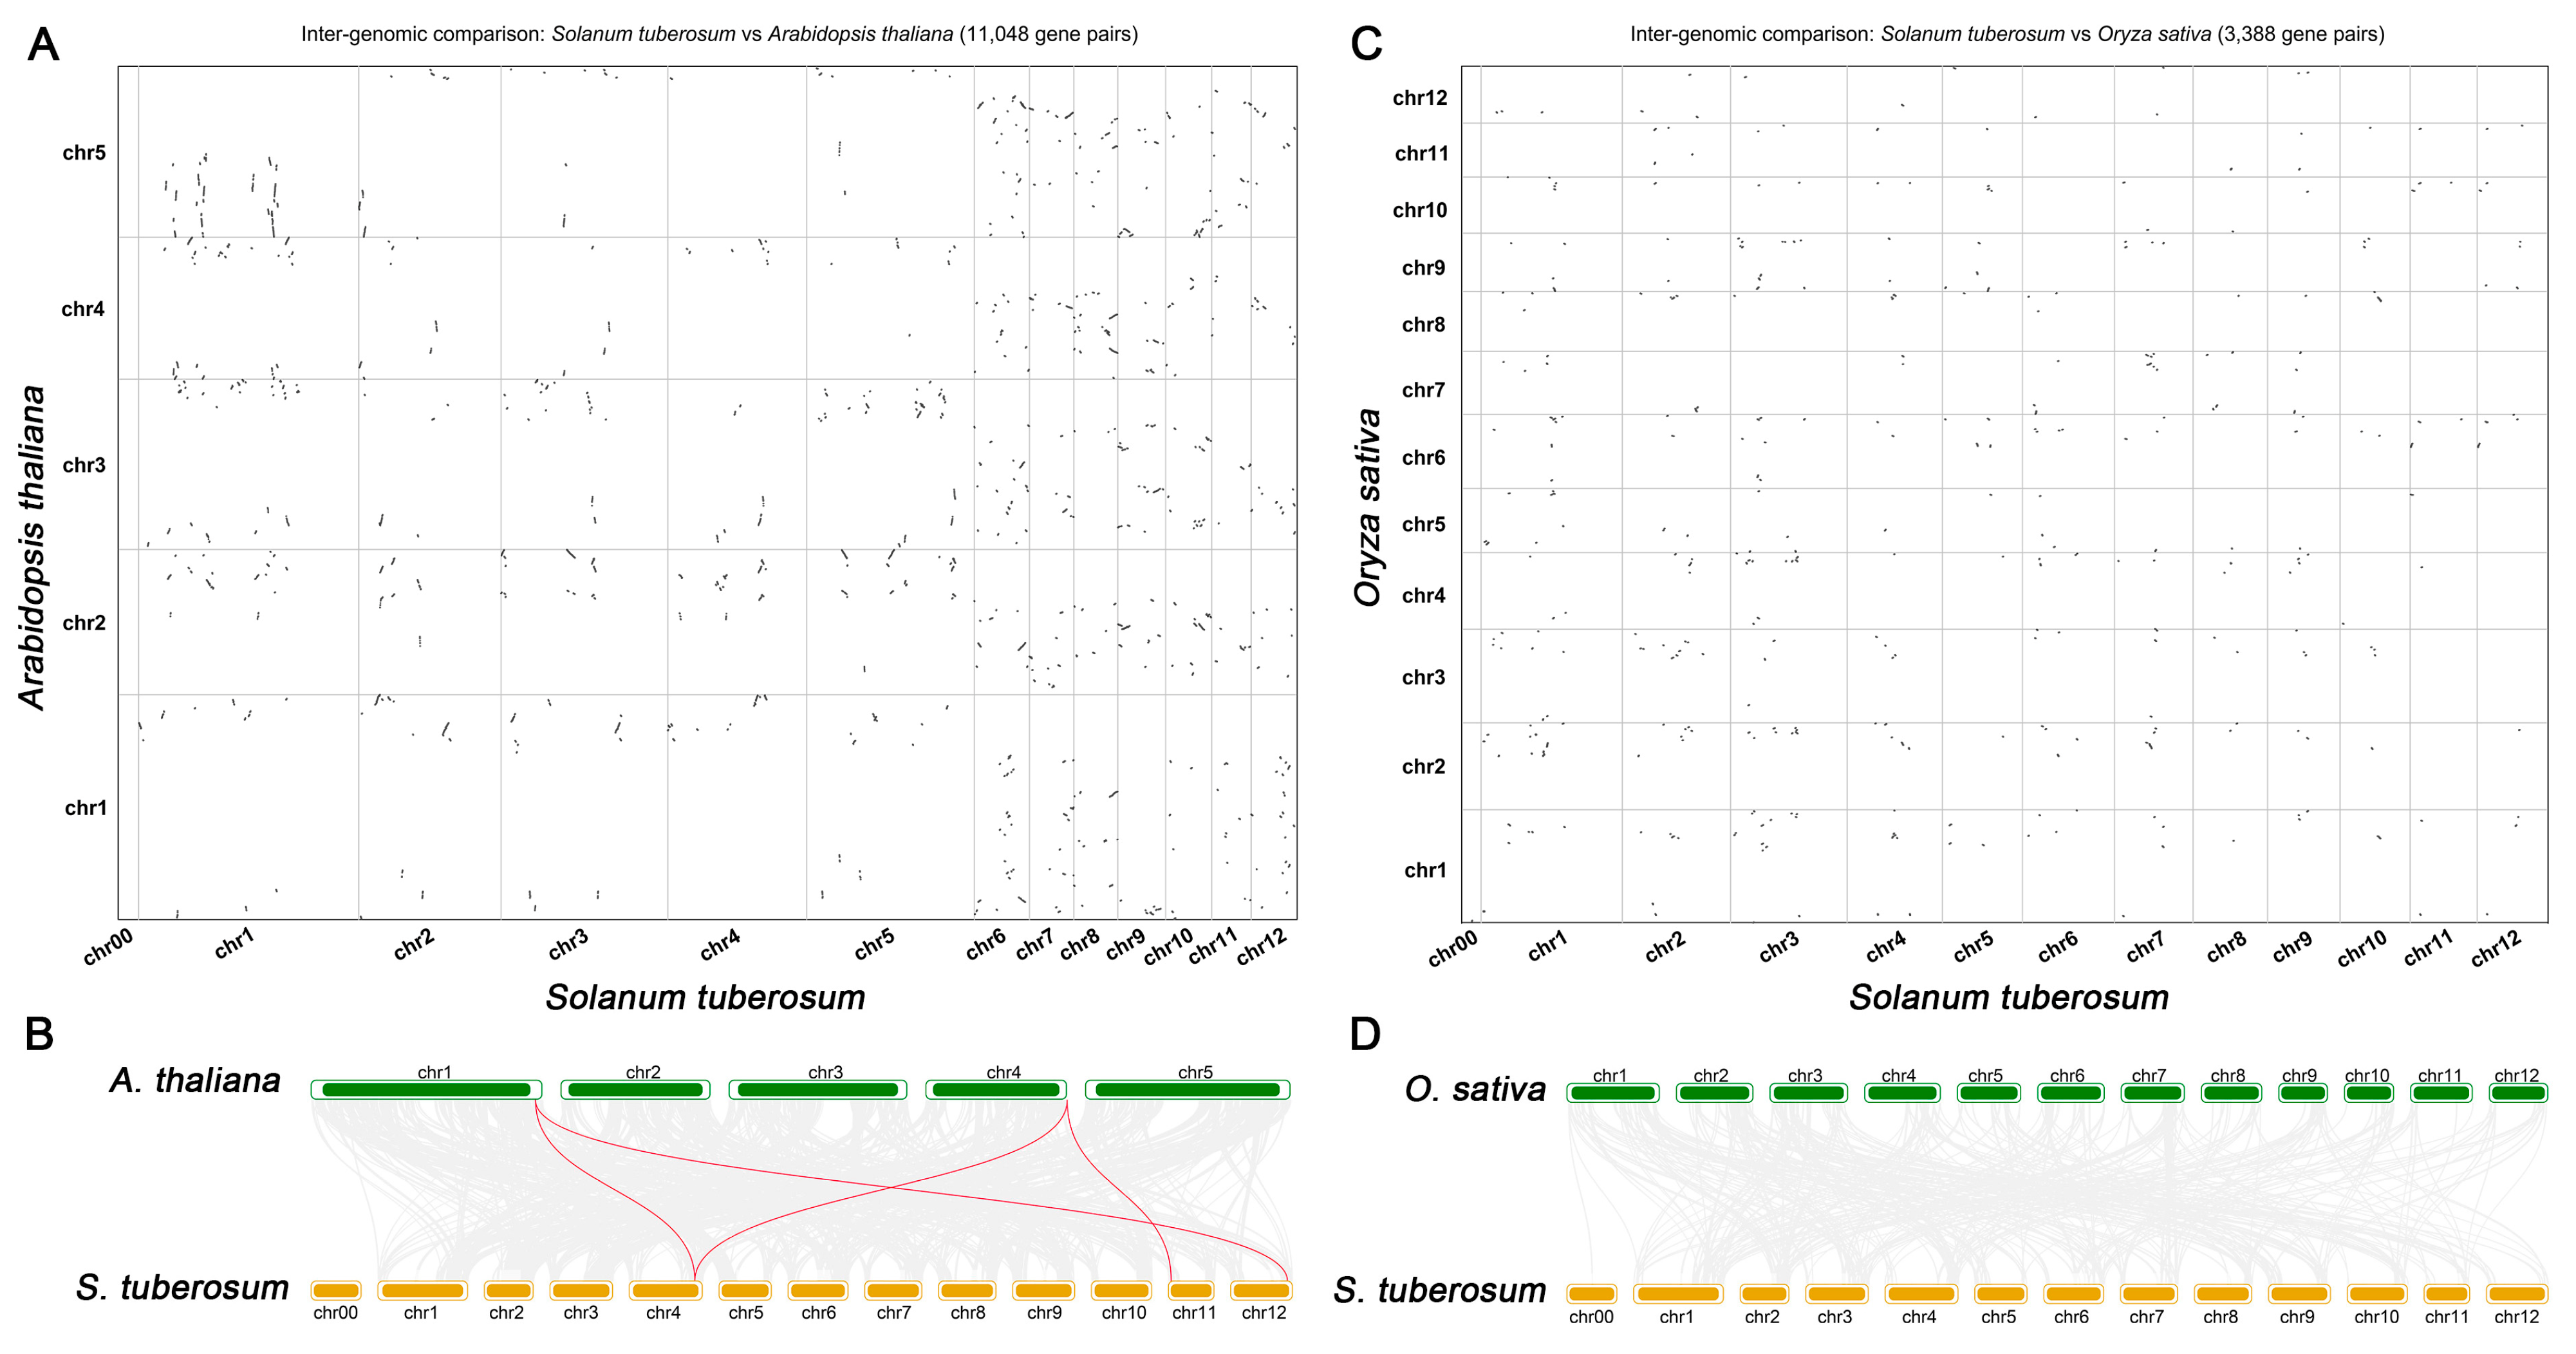
2.3. Synteny Analysis of StSnRK2 Genes

Gene duplication plays an important role in the occurrence of new functions and the expansion of gene families. Therefore, we further analyzed the duplication events of the StSnRK2 genes, including tandem and segmental duplication events. A chromosomal region in which two or more genes occur within 200 Kb is defined as a tandem duplication event [39]. The results show that the duplicate gene of StSnRK2 was not detected in potato. However, two pairs of segmental duplication genes were detected between three chromosomes: Chr4 (StSnRK2.1)/Chr11 (StSnRK2.8) and Chr4 (StSnRK2.1)/Chr12 (StSnRK2.7) (Figure 3). In short, it is possible that some StSnRK2 genes arose through segmental duplication and that these segmental duplication events were the main drivers of StSnRK2 evolution.
In addition, analysis of gene duplication events showed that most SnRK2 genes exhibited obvious duplication among nine species. A total of 122 homologous SnRK2 genes were found in monocots and dicots. Among them, five pairs (AtSnRK2.2/BnSnRK2.9, AtSnRK2.5/BnSnRK2.15, HvSnRK2.10/OsSAPK5, HvSnRK2.8/OsSAPK9 and OsSAPK9/ZmSnRK2.10) showed more than 95% similarity. An additional 37 pairs of SnRK2 genes have a similarity of less than 75%, and 178 pairs have similarities between 75% and 95%. There were notable similarities between StSnRK2s and 23 SnRK2s that distinguished them from other species, including five in grapes, three in Arabidopsis, six in soybeans, six in camellias and four in rape (Figure 4). Interestingly, these genes that have a collinear relationship with StSnRK2 are all from dicotyledons. These results imply that SnRK2 genes have a wide range of duplication events in some species and that StSnRK2s are closer to dicotyledons during the process of evolution.
To further explore the evolutionary relationships of StSnRK2 genes, intergenomic comparison relationships maps between potato and two representative species (a dicot (Arabidopsis) and a monocot (rice)) were constructed. The results show that 11,048 homologous gene pairs were detected in potato and Arabidopsis, and the distribution shows a certain regularity. In Arabidopsis, most genes are located at the front or end of the chromosome, and few genes are located at the middle segment. In potato, homologous genes are uniformly distributed in chromosomes, except Chr00 (Figure 5A). Further analysis of the collinearity of SnRK2 genes in potato and Arabidopsis showed that there are five collinearity gene pairs (Figure 5B). Similarly, we also analyzed the collinear relationship between potato and rice. The results show that 3388 homologous gene pairs were detected, the distribution on their chromosomes exhibits no obvious regularity (Figure 5C) and there are no collinearity gene pairs (Figure 5D). These results suggest that potato may have a distant evolutionary relationship with monocots and a close evolutionary relationship with dicots.

2.4. Evolutionary Selection Pressure and Codon Usage Bias Analysis

In order to explore the evolutionary selection pressure of StSnRK2s between monocots and dicots, we calculated Ka, Ks and Ka/Ks among selected species on the basis of collinearity analysis. Ka and Ks are molecular evolution rates. In this study, Ka ranged from 0.05 to 0.25, and Ks ranged from 0.51 to 6.77. The Ks between Arabidopsis thaliana and Brassica napus was the smallest, and that between Vitis vinifera and Zea mays was the largest. Ka/Ks is important for assessing the selection pressure of species in evolution. The results show that all Ka/Ks values were less than 1. Therefore, the evolutionary selection pressure among the nine species exhibits a purifying selection relationship. However, the Ka/Ks among three monocots ranged from 0.08 to 0.10 (Table 1), whereas that in dicots ranged from 0.01 to 0.06 (Table 1). Moreover, the divergence time of the three monocots was similar, at 22 million years ago (Mya). However, there was a large variation among dicots, ranging from 74.70 Mya (Camellia sinensis and Hordeum vulgare) to 225.53 Mya (Vitis vinifera and Zea mays). The relative divergence time between potato and dicots is between 48.96 Mya and 81.79 Mya (Table 1). Thus, it can be concluded that the genetic relationship of the SnRK2 gene family is relatively close among the three monocots, with more distant relationships between monocots and dicots, followed by those between dicots and dicots.
Codon usage bias analysis can reveal the genetic evolution rules between species and gene families. To understand the regulatory mechanism of transcription and translation, we analyzed related parameters such as codon adaptation index (CAI), codon bias index (CBI), frequency of optimal codons (FOP) and effective number of codons (Nc). The codon usage parameters analysis of monocots and dicots showed that the average values of synonymous codon-corresponding base frequency (C3s, G3s and GC3s), CBI and Fop were significantly higher in monocots, whereas T3s, A3s and CAI were significantly higher in dicots. In addition, the CBI of Camellia sinensis was considerably lower among the dicots (Table 2). Moreover, correlation analysis of codon usage parameters showed that there were certain similarities between monocots and dicots; for example, C3s and GC3s positively correlated with CAI, CBI and Fop in dicots and monocots, whereas A3s negatively correlated with CAI, CBI and Fop in dicots and monocots. Although codon preferences of monocots and dicots were obviously similar, there were also some differences. For example, G3s, C3s and GC3s negatively correlated with Nc in monocots but positively correlated with Nc in dicots, whereas T3s and Nc correlated positively in monocots but negatively in dicots (Table 3 and Table 4).

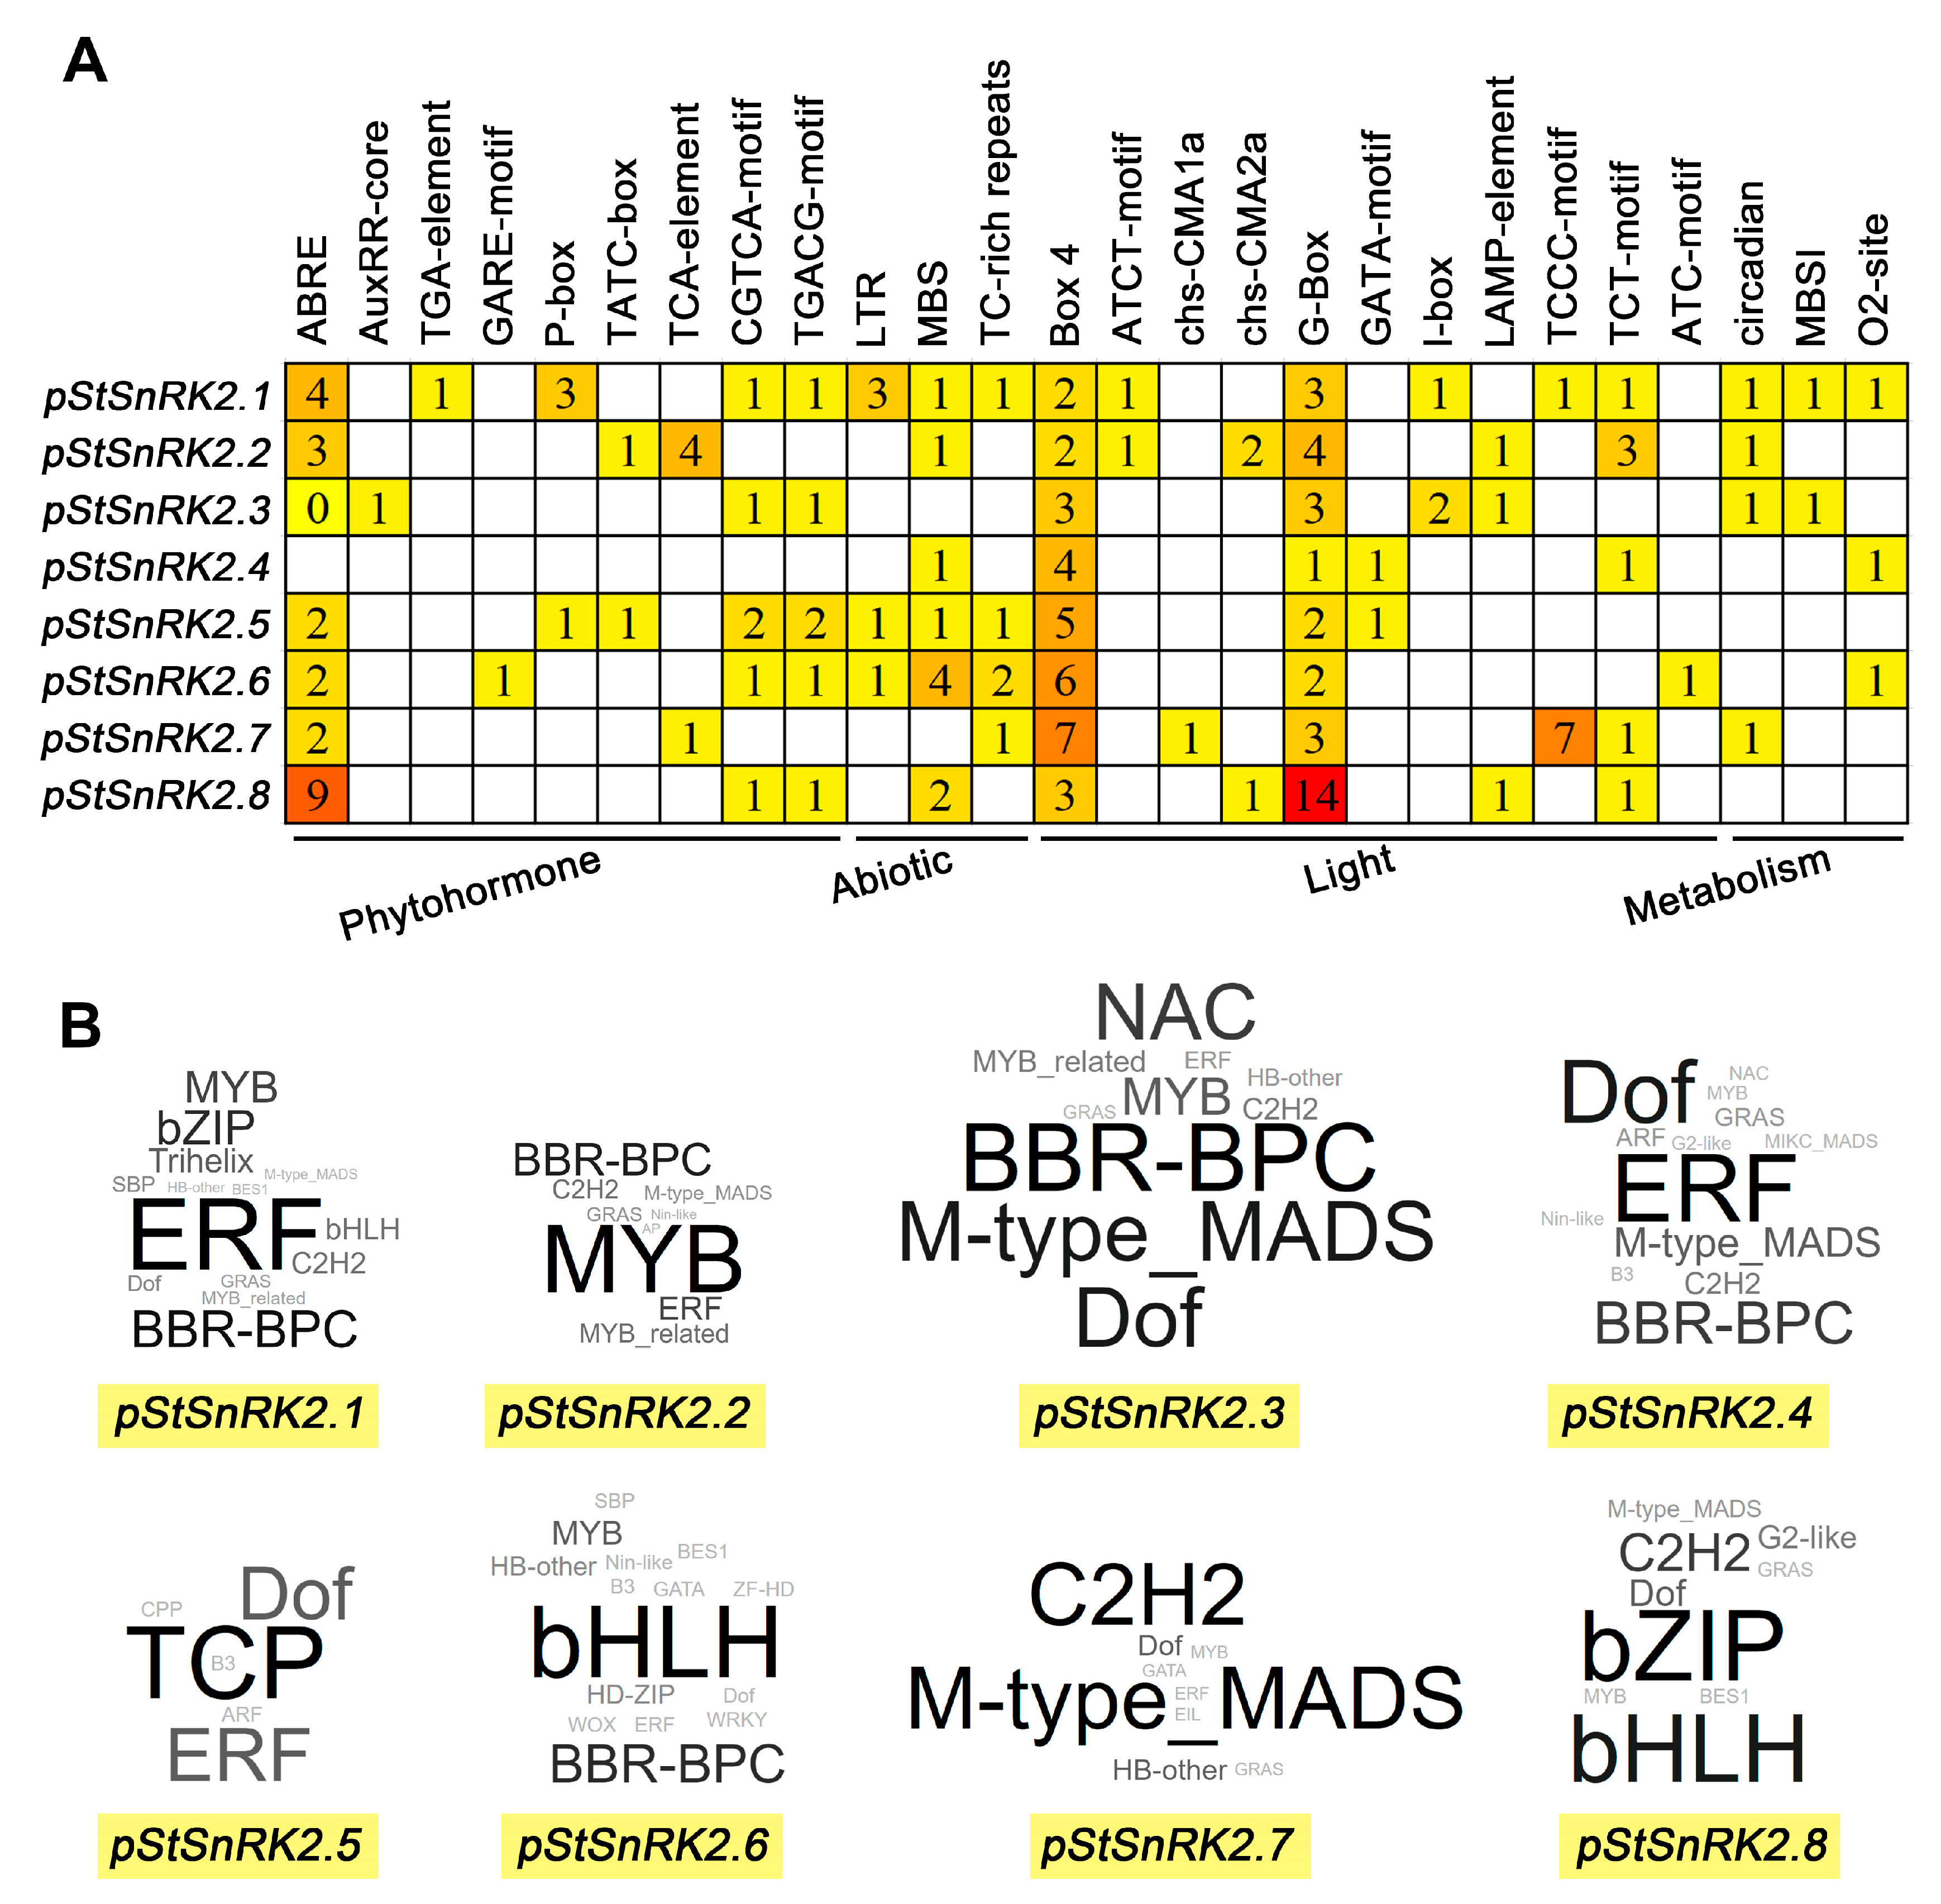
2.5. Prediction of Cis-Acting Elements and Binding Proteins of StSnRK2 Gene Promoters

Cis-acting elements play a crucial role in the transcription and expression of genes and can provide a variety of functions to regulate plant growth and its adaptation to the environment [40]. To further reveal the characteristics of StSnRK2s and predict the possible regulatory pathways involved, the types and numbers of elements in StSnRK2 promoter sequences were analyzed (Figure 6A). Here, we mainly focused on the environmental response elements. StSnRK2 promoters include hormone response elements (ABRE, TGACG motif, CGTGA motif, etc.), stress response elements (MBS, LTR, TC-rich repeats, etc.) metabolism-related response elements (MBSI and O2 site) and light response elements (G-box, Box 4, TCCC motif, etc.). Among them, the number of light response elements is the largest (94), followed by ABA response elements (ABRE, 22) and drought-inducible elements (MBS, 10), with the fewest auxin response elements (AuxRR-core and TGA element, 1) and gibberellin response elements (GARE motif, 1). The hormone response elements are the most widely distributed among the promoters of StGH3s; for example, ABRE element exists in all StSnRK2 gene promoters except StSnRK2.4. In addition, the promoter of the StSnRK2.1 gene contains the most elements (17), whereas the promoter of the StSnRK2.4 gene contains the fewest (6).
We also performed predictive analyses of proteins that may regulate the expression of StSnRK2s. The results show that 29 protein families were predicted to be involved in the regulation of StSnRK2 gene expression (Figure 6B). StSnRK2.6 promoter had the largest number of predicated protein types (15), whereas StSnRK2.5 had the fewest (6). Among them, Dof, ERF and MYB have the highest frequency and were predicted in seven StSnRK2 genes, followed by C2H2, GRAS and M-type_MADS in six StSnRK2 genes. In addition, ten proteins (Trihelix, AP2, MIKC_MADS, CPP, TCP, HD-ZIP, WOX, WRKY, ZF-HD and EIL) were predicted only once, indicating that these proteins may be specific regulators of some StSnRK2 genes. Interestingly, we found that the most frequent protein only in the prediction of StSnRK2.1 and StSnRK2.4 promoters was the same (ERF), whereas the most frequent proteins in the remaining StSnRK2s were different. These results indicate that the function and regulatory mechanism of StSnRK2 family genes may be different in potato response to stress; therefore, further studies are needed on the functions of this family of genes in stress response.

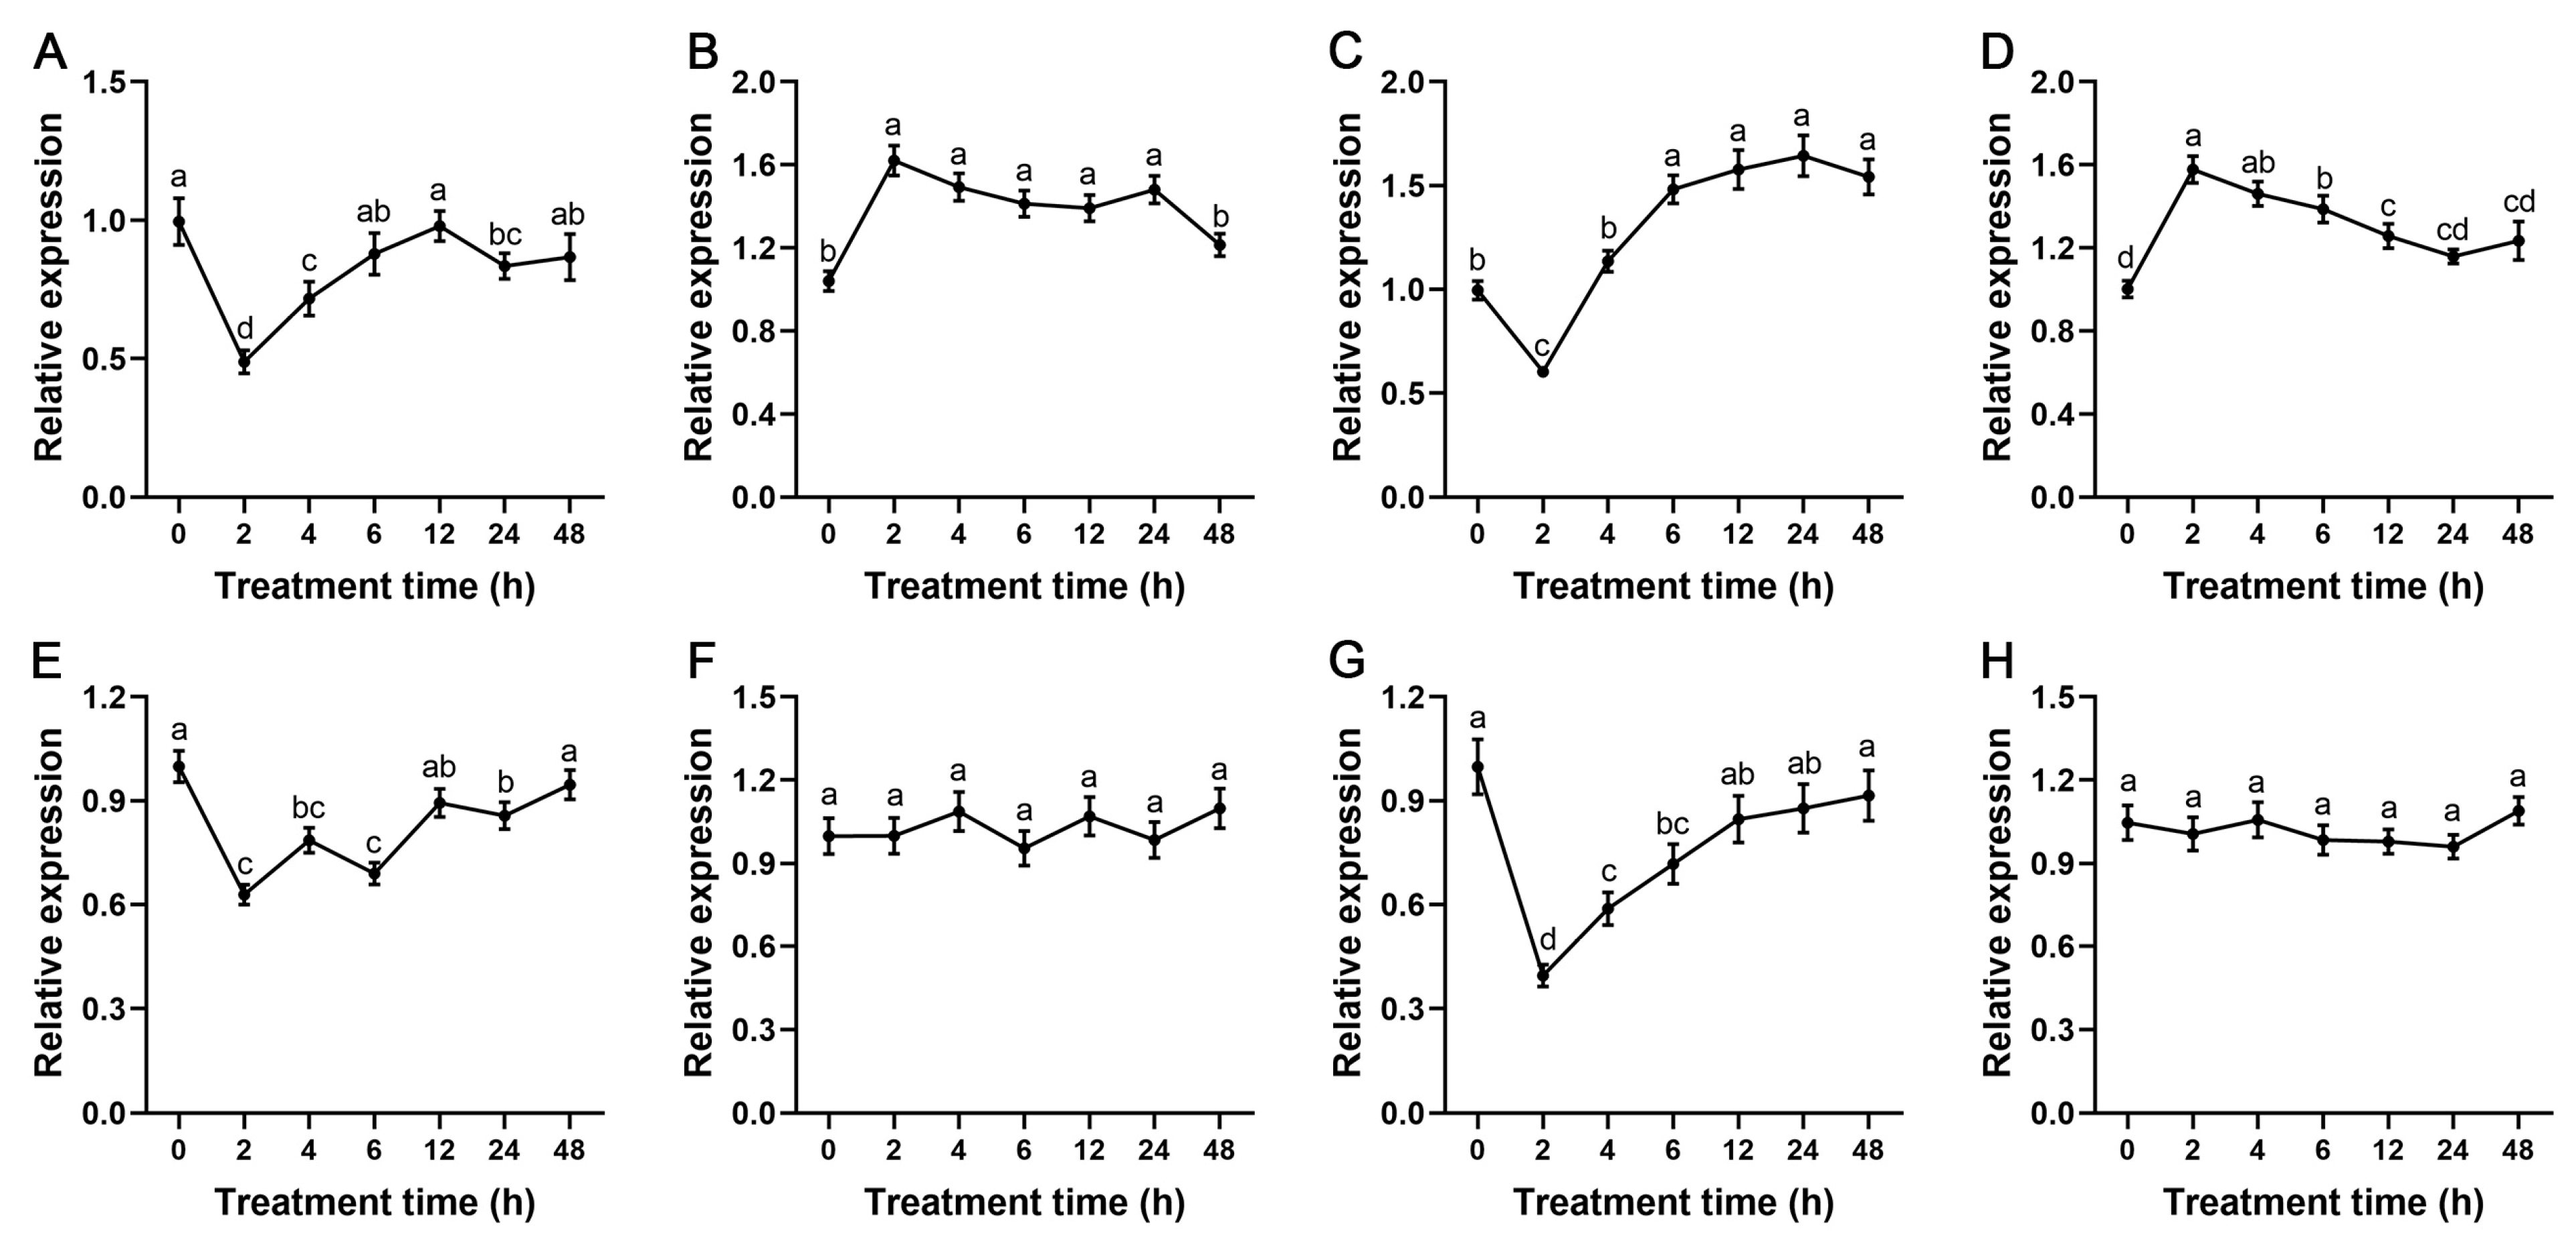
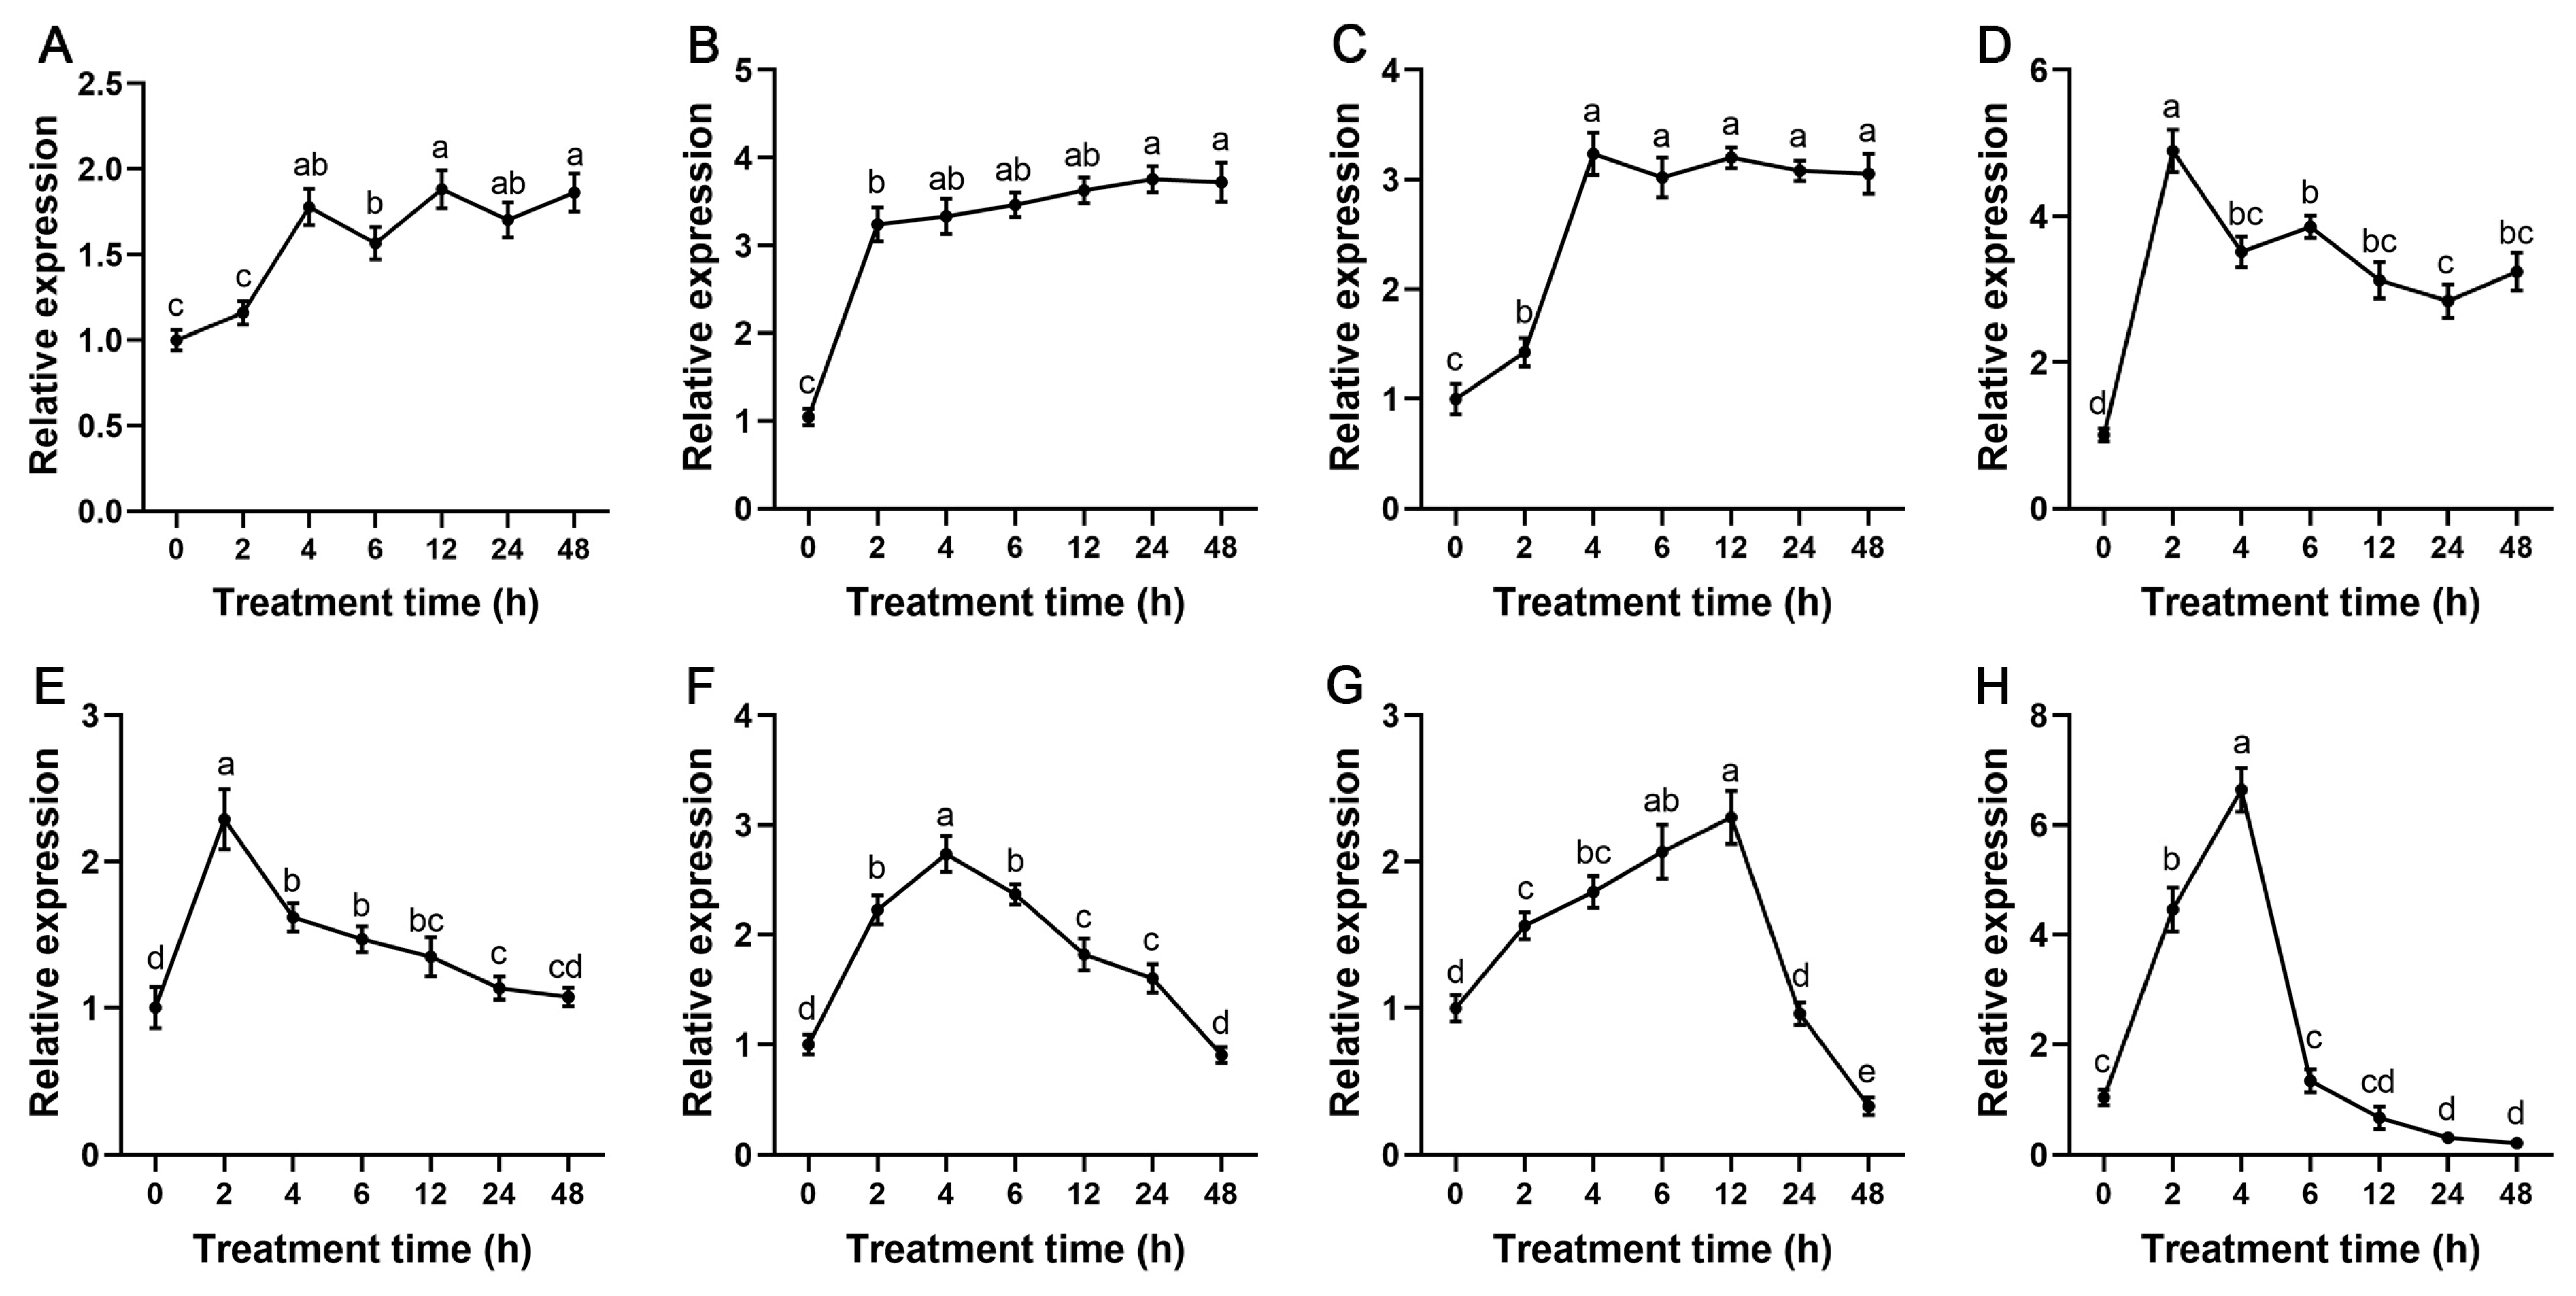
2.6. Expression Patterns of StSnRK2 Genes under ABA and Drought Treatments

Before studying the function of StSnRK2 genes, we first analyzed the expression patterns of eight StSnRK2 genes under ABA and drought stress. The qPCR results show that all the eight StSnRK2 genes responded to stress, but the response profiles were different. Under ABA treatment (Figure 7), the expression levels of StSnRK2.1, StSnRK2.3, StSnRK2.5 and StSnRK2.6 genes showed a similar trend, which decreased significantly after 2 h of treatment, then rose gradually after 4 h and reached the maximum at 48 h. StSnRK2.2 and StSnRK2.4 reached a peak at 2 h, which was about 1.6 times that of the control, then declined gradually after 4 h and almost recovered to the level before treatment after 48 h. although there were some fluctuations in StSnRK2.6 and StSnRK2.8 during the whole treatment process, they did not reach significant levels, possibly indicating that they have different signaling pathways.
Under drought treatment, the expression level of StSnRK2.1, StSnRK2.2 and StSnRK2.3 increased rapidly from 2 to 4 h of stress and was maintained at a relatively stable level until 48 h of treatment. The expression levels of StSnRK2.4 and StSnRK2.5 reached a peak at the 2 h time point, which is about 5 times as much as that of the control, then declined significantly. Expression levels of StSnRK2.6 and StSnRK2.7 decreased steadily with the extension of treatment time, and StSnRK2.7 declined significantly after 24 h and 48 h compared to the control. The expression of StSnRK2.8 was approximately seven times higher than that of the control after 4 h, then decreased gradually after 6 h and reached the minimum at 48 h (Figure 8).

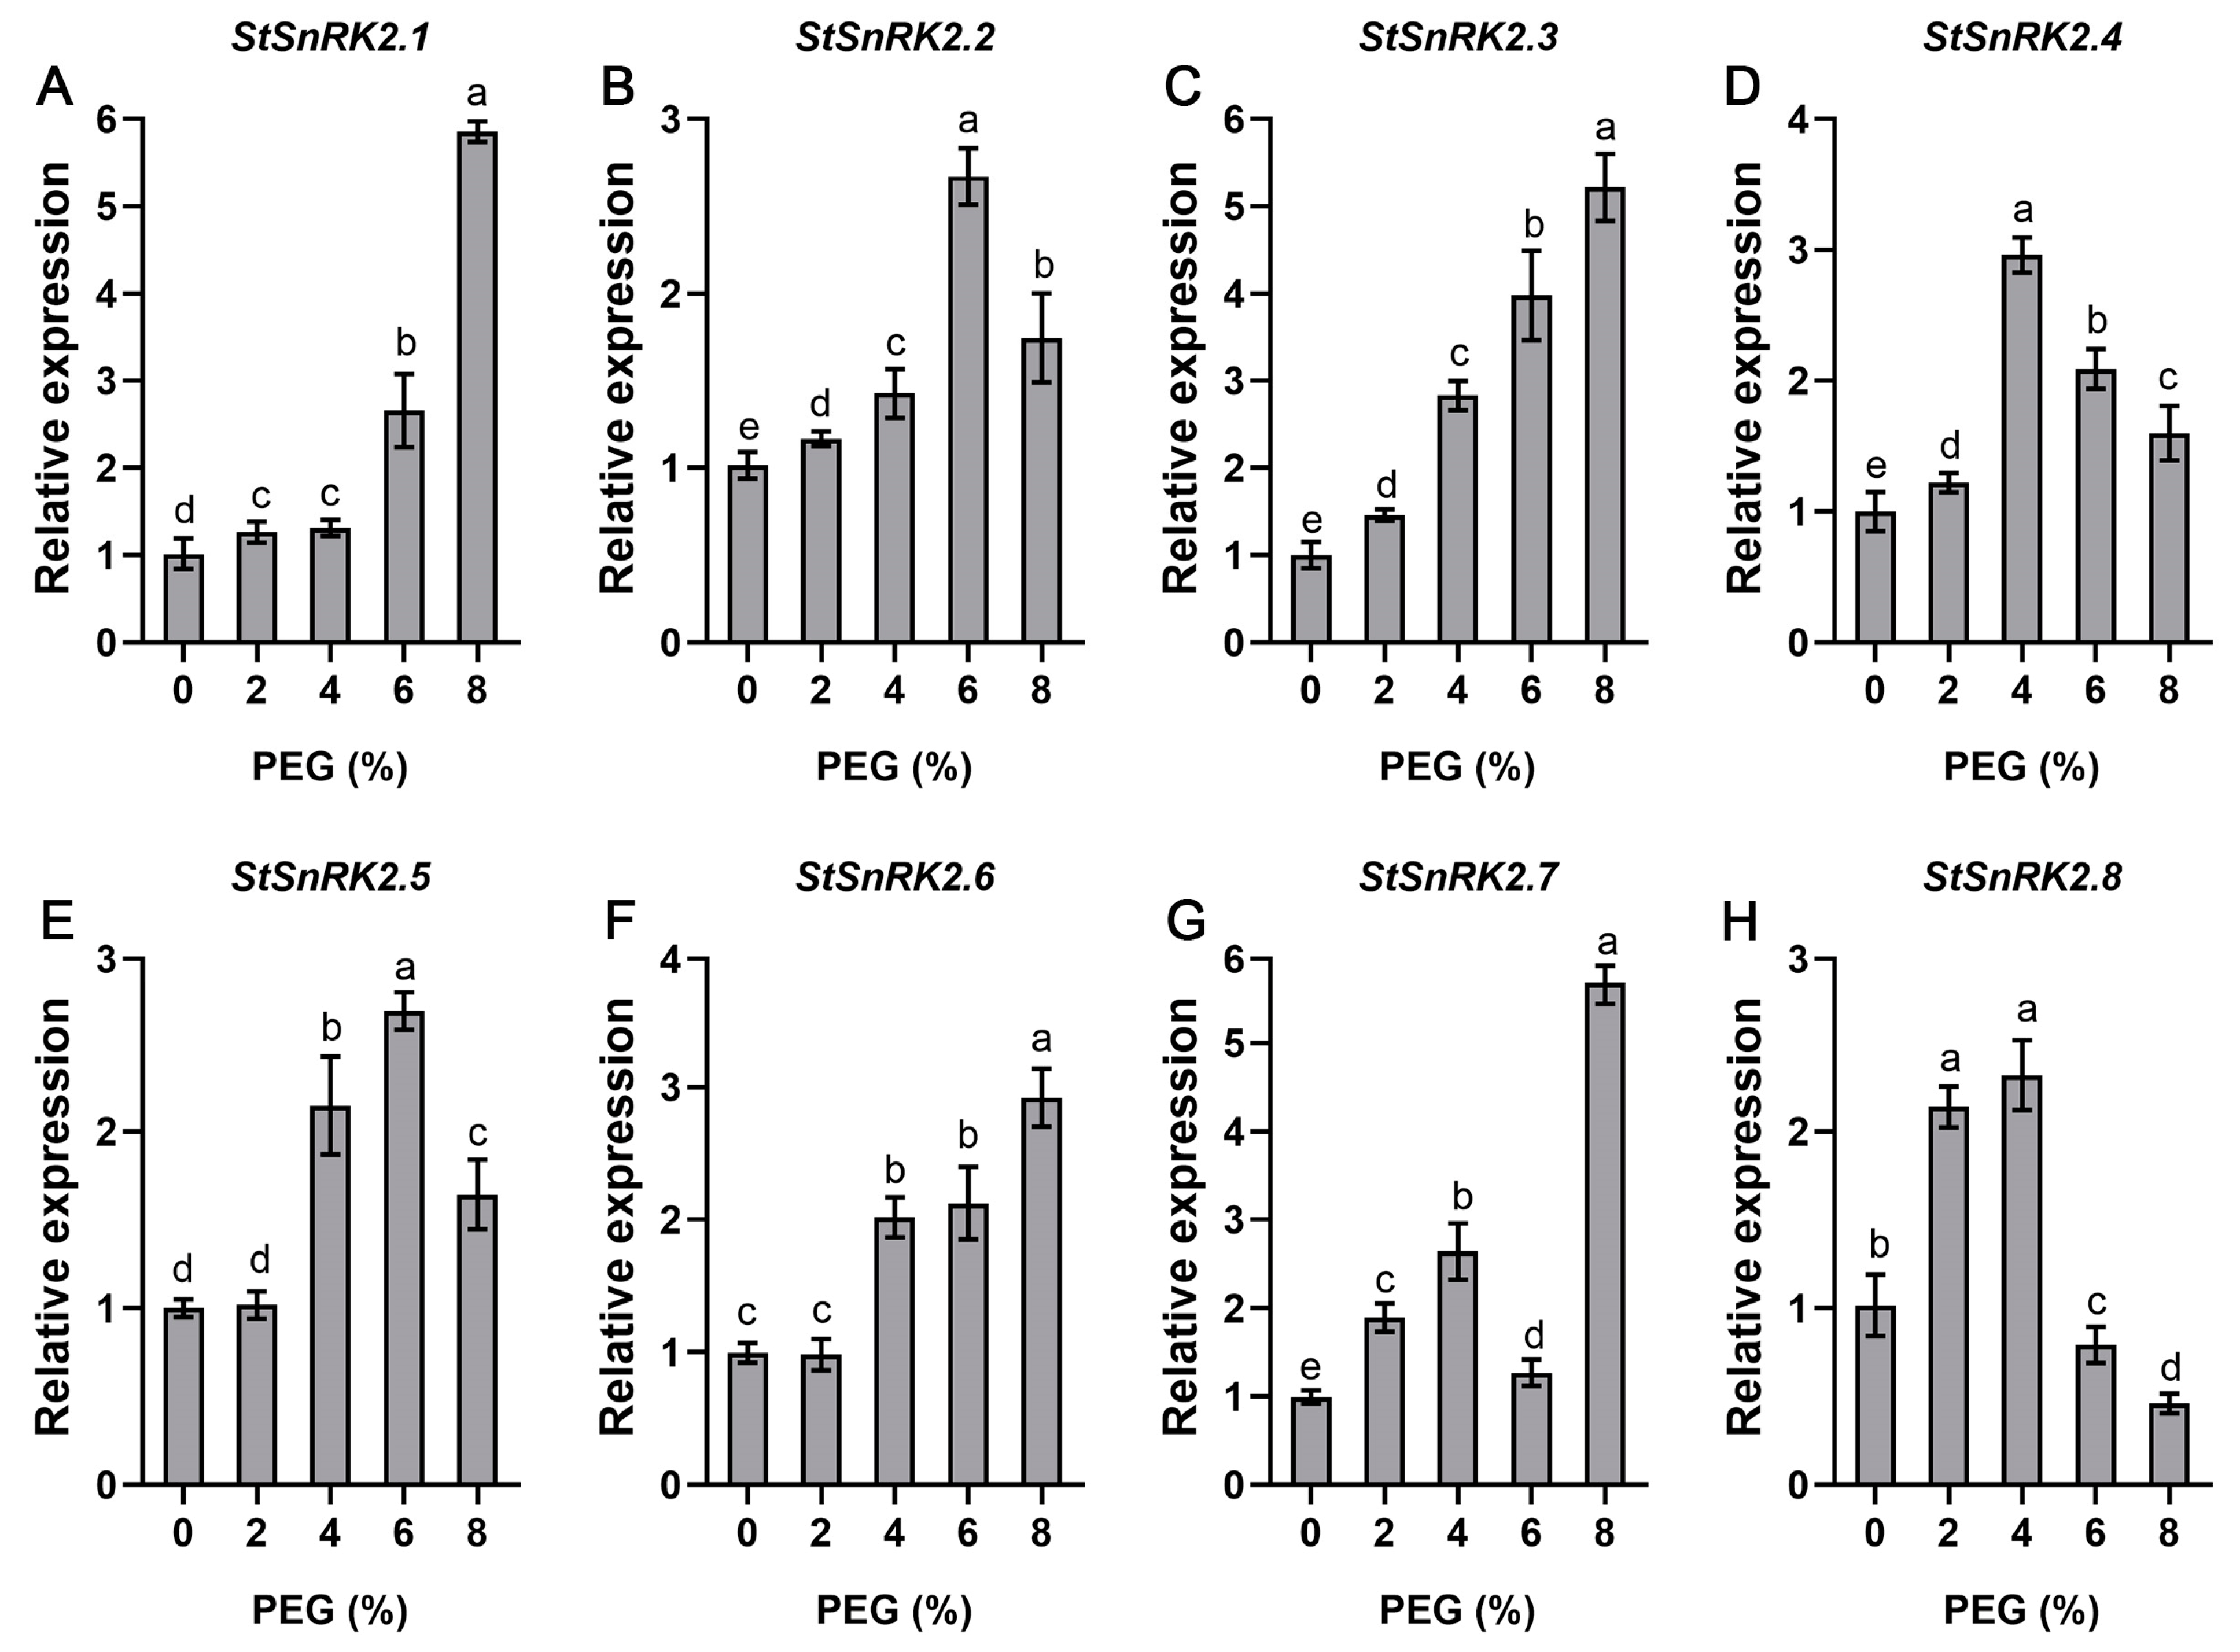
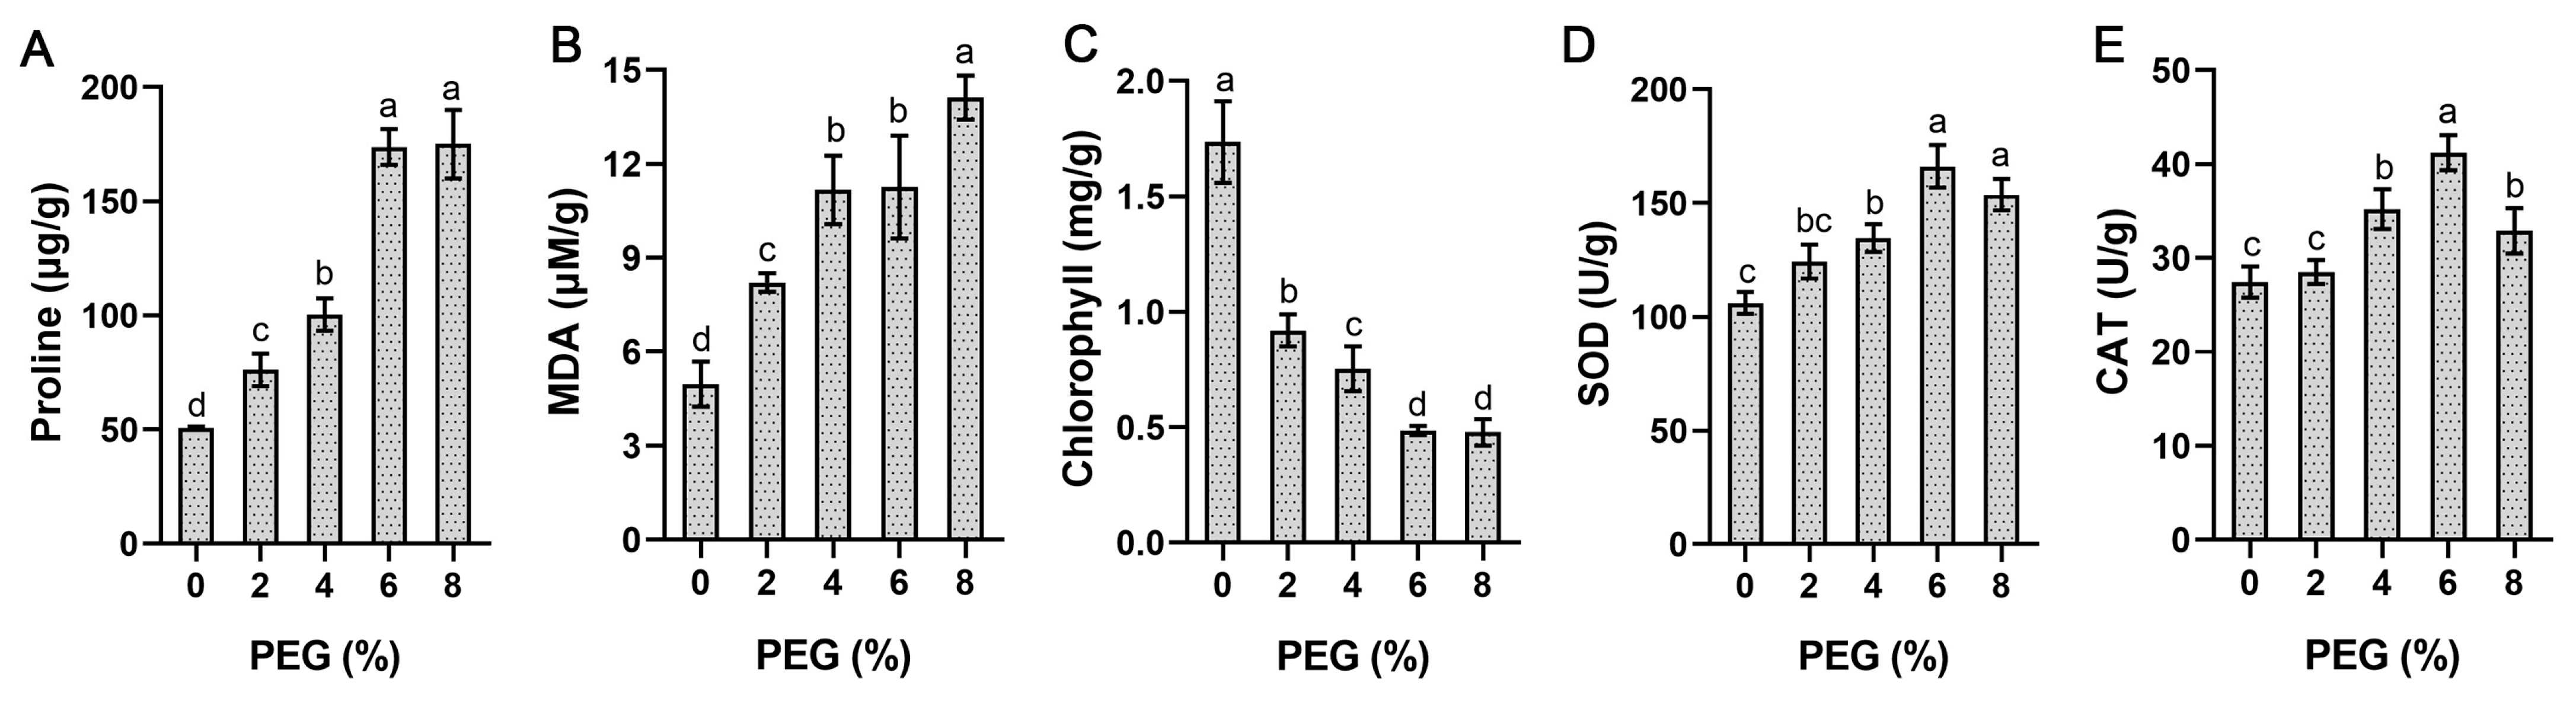
2.7. StSnRK2 Gene Expression and Physiological Changes under Different Degrees of Drought Stress

In order to fully understand the response of StSnRK2 genes to drought stress, potato plantlet stems with at least two leaves were treated with different concentrations of PEG, and StSnRK2 gene expression was detected 4 weeks later. The results show that all the genes responded to PEG, and the response levels of most genes increased significantly with increasing PEG concentrations (Figure 9). The expression of StSnRK2.1, StSnRK2.3 and StSnRK2.6 rose significantly with increased PEG concentration, and the highest expression was detected under 8% PEG stress: 5.8, 5.2 and 2.9 times higher than that of the control, respectively. The expression of StSnRK2.2 and StSnRK2.5 peaked at 6% concentration and decreased to a certain extent at 8%, suggesting that a high concentration of PEG may inhibit the expression of both genes. StSnRK2.4 and StSnRK2.8 expression increased when mild drought was applied and decreased under extreme drought conditions.
We also measured a number of stress-related physiological indices under the same conditions, including the content of proline, MDA and chlorophyll, as well as the activity of SOD and CAT enzymes. The results show that these physiological indices changed significantly with increased stress concentration (Figure 10). The accumulation of proline increased remarkably with increased PEG concentration, reaching a peak at 6% concentration, which was 3.4 times higher than that of the control. The change trend of MDA was similar to that of proline, but its content reached the maximum at 8% concentration. The chlorophyll content decreased drastically at 2% concentration, which was only 52% of the control, and reached a minimum value at 6% concentration. The activities of SOD and CAT first increased at and then decreased with an increase in PEG concentration and reached the maximum at 6% concentration.
Furthermore, the correlation between StSnRK2 gene expression and changes in physiological indices was analyzed. The results show that most StSnRK2 genes positively correlated with at least one physiological index (Table S1). In total, eight pairs of StSnRK2 genes and physiological indices correlated significantly, of which four pairs (StSnRK2.1 and proline, StSnRK2.1 and MDA, StSnRK2.1 and proline, and StSnRK2.4 and MDA) positively correlated at the p < 0.01 level and four pairs (StSnRK2.3 and SOD, StSnRK2.4 and CAT, StSnRK2.6 and proline, and StSnRK2.7 and proline) positively correlated at the p < 0.05 level. Interestingly, we found that all StSnRK2 genes negatively correlated with chlorophyll content, but there was no significant difference.

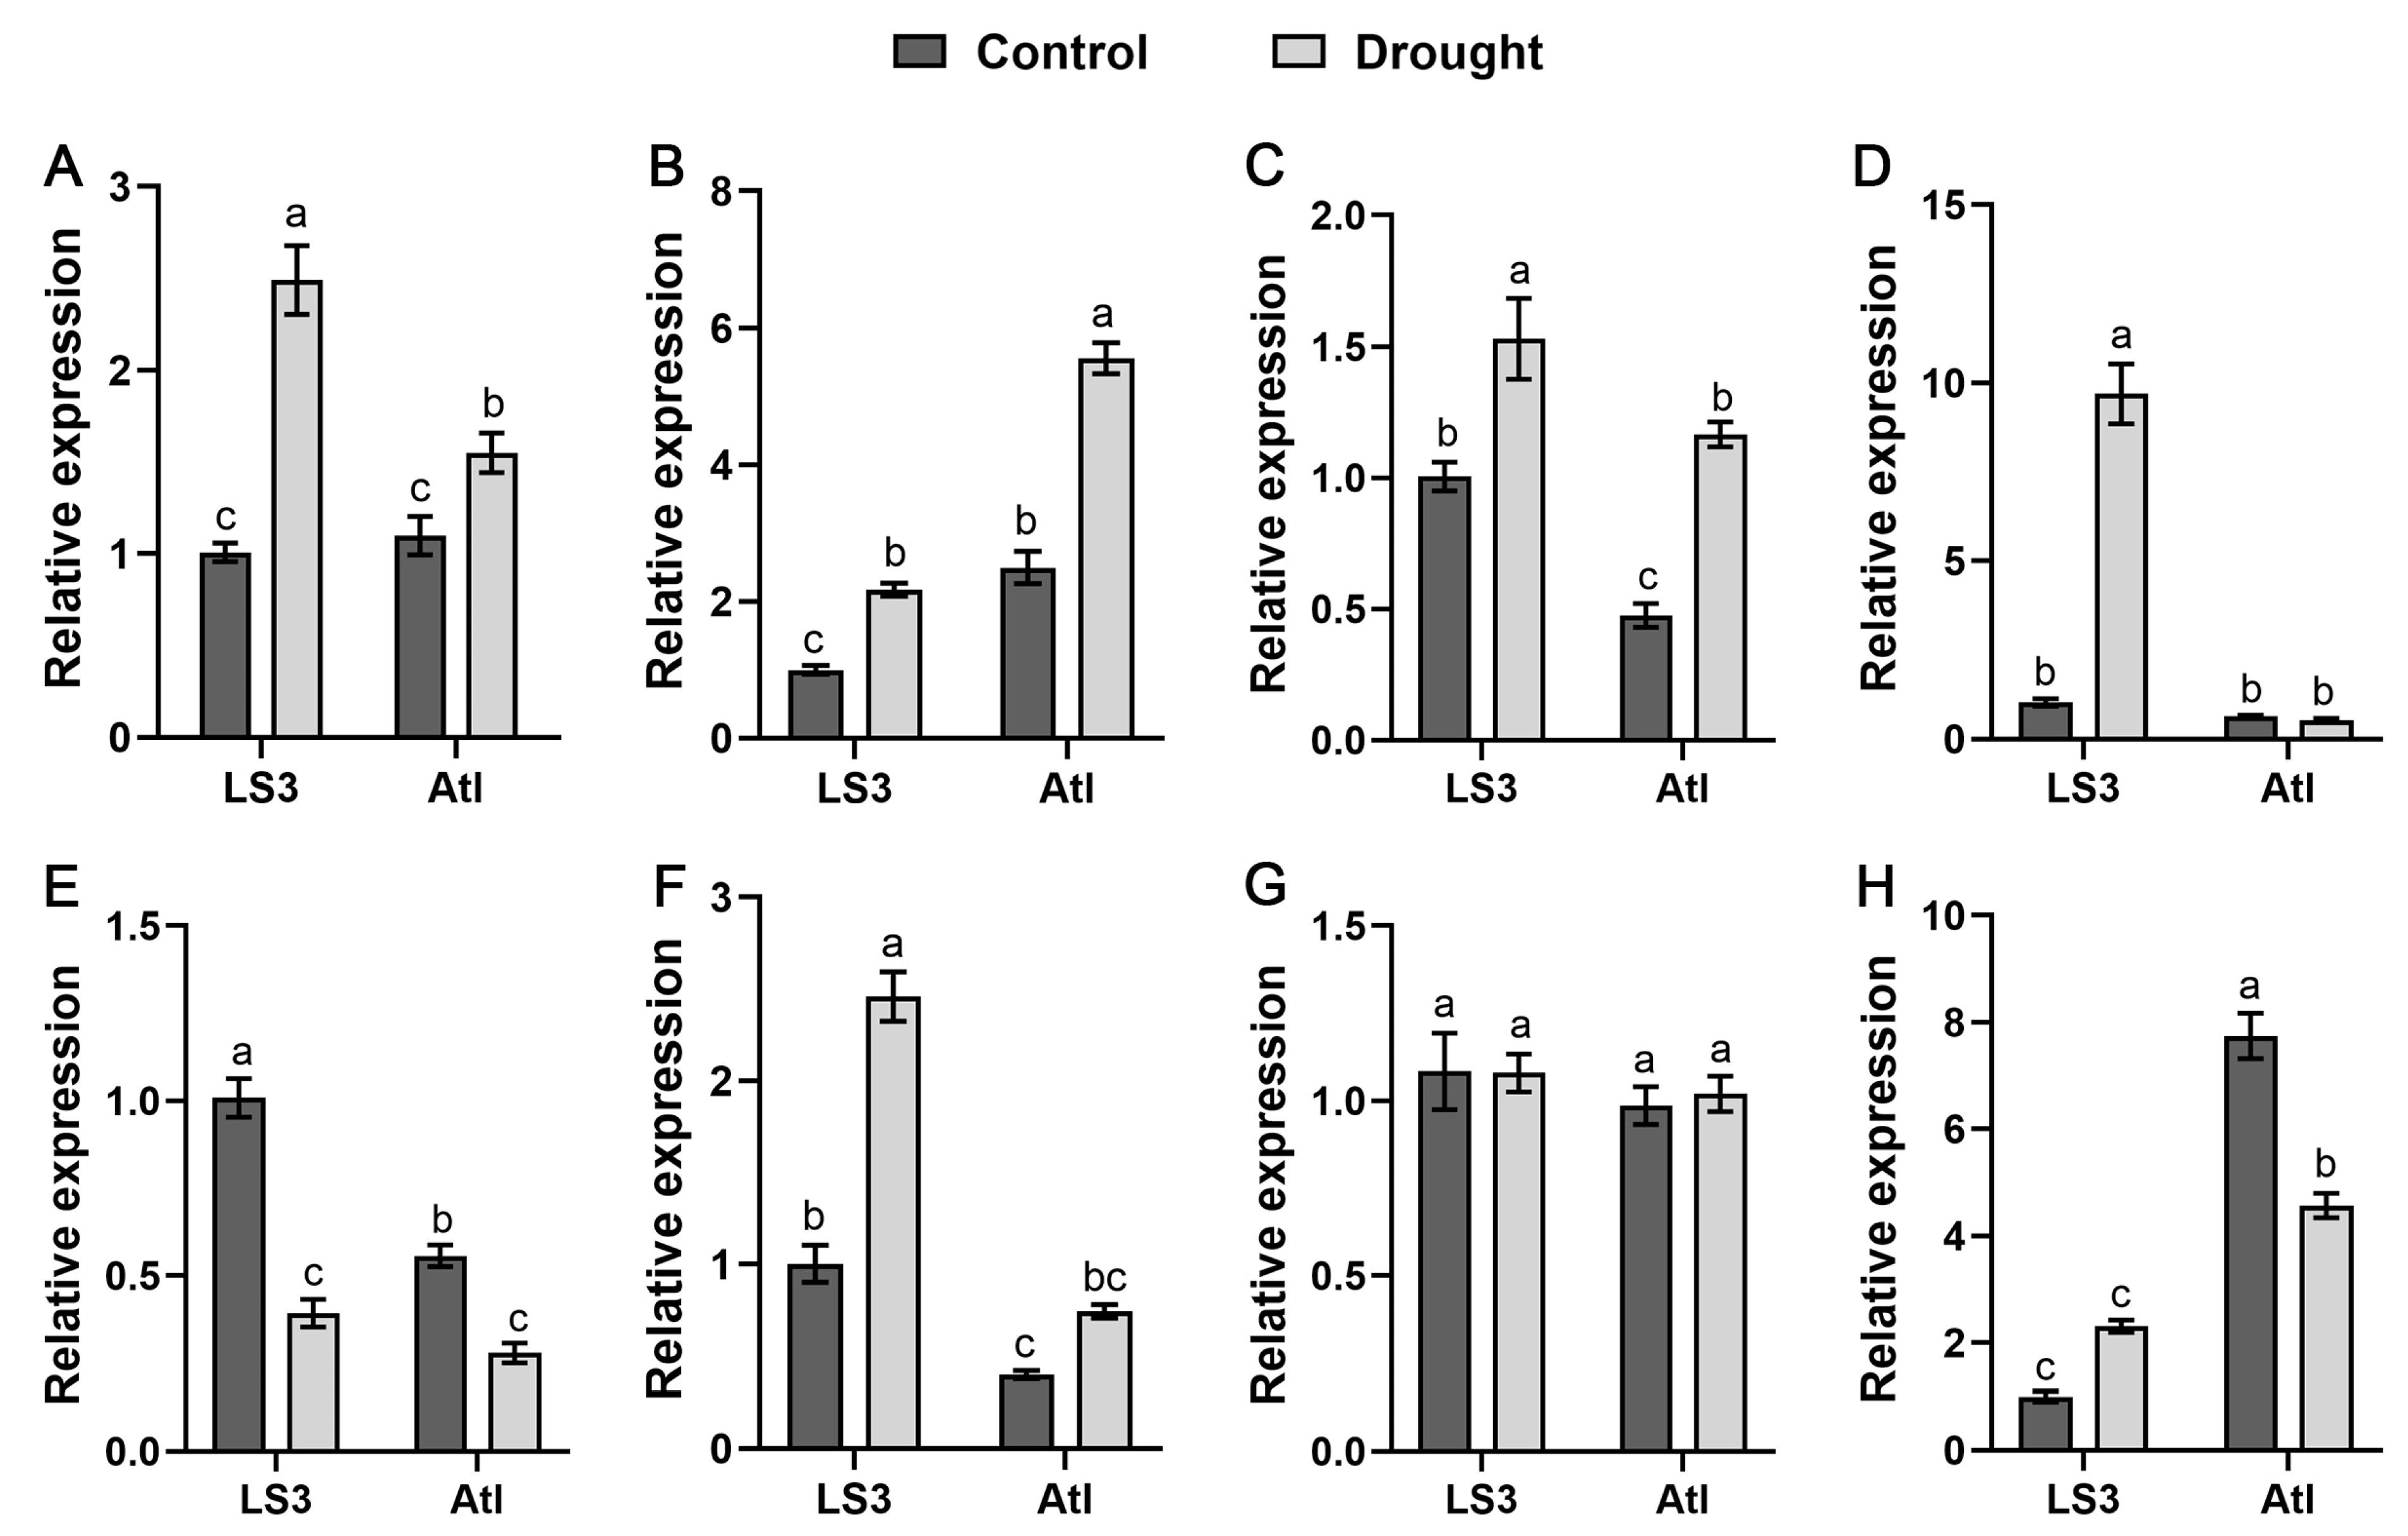
2.8. Response of StSnRK2 Genes to Drought Stress in Different Drought-Resistant Cultivars

In order to truly reflect the response of StSnRK2 genes to drought stress, we further analyzed the expression of StSnRK2 gene in two potatoes cultivars (‘LS3’, drought-tolerant; ‘Atl’, drought-sensitive) with different drought-resistance capacities under natural drought conditions. The results show that there were significant differences in the expression of eight StSnRK2 genes between the two cultivars (Figure 11). The expression of StSnRK2.1, StSnRK2.2, StSnRK2.3 and StSnRK2.6 in the two cultivars after stress was significantly higher than that of the control, but there were differences in gene expression. For example, the expression of StSnRK2.1 in ‘LS3’ was 2.5-fold higher than that of the control, whereas that in ‘Atl’ was 1.4-fold higher than that of the control. The expression of StSnRK2.2 and StSnRK2.6 in the two cultivars increased by about two times as much as that of the control. StSnRK2.4 in ‘LS3’ was 9.5-fold higher than that of the control, but there was no significant change in ‘Atl’. However, StSnRK2.5 showed a significant downward trend in both cultivars. In addition, there was no significant difference in StSnRK2.7 expression between ‘LS3’ and ‘Atl’ before and after stress, suggesting that StSnRK2.7 may not be directly related to drought resistance in potato.
We also measured a number of stress-related physiological indices under the same conditions (Figure S3). Proline content under normal conditions was higher in ‘LS3’ than ‘Atl’, with a similar trend observed under drought stress conditions. Proline accumulation in ‘LS3’ and ‘Atl’ was 58.5% and 46.4%, respectively, indicating that proline was more active in drought-resistant potato cultivars. Under drought stress, the antioxidant enzyme activity in both cultivars was higher compared to under unstressed treatment. The activity of SOD in ‘LS3’ and ‘Atl’ increased by 55.7% and 40.7%, respectively; CAT activity increased by 43.5% and 36.4%, respectively; and POD activity increased by 43.5% and 62.1%, respectively. Atl recorded higher MDA production under drought stress than ‘LS3’. These results suggest that SOD and CAT were more active in cultivars with strong drought resistance.
Furthermore, the correlation between StSnRK2 gene expression and changes in physiological indices was analyzed. The results show that most StSnRK2 genes were markedly associated with at least one physiological index (Table S2). In total, 21 pairs of StSnRK2 genes and physiological indices were significantly correlated, of which 18 pairs (StSnRK2.1 and proline/MDA/SOD/POD, StSnRK2.2 and MDA/IL/CAT, StSnRK2.3 and proline/MDA/SOD/POD, StSnRK2.4 and proline/SOD/POD, and StSnRK2.6 and proline/SOD/POD) recorded positive correlations and 3 pairs (StSnRK2.5 and MDA/IL and StSnRK2.2 and proline) were negatively correlated. Interestingly, we found that StSnRK2.7 has no obvious correlation with any of the analyzed physiological indices.

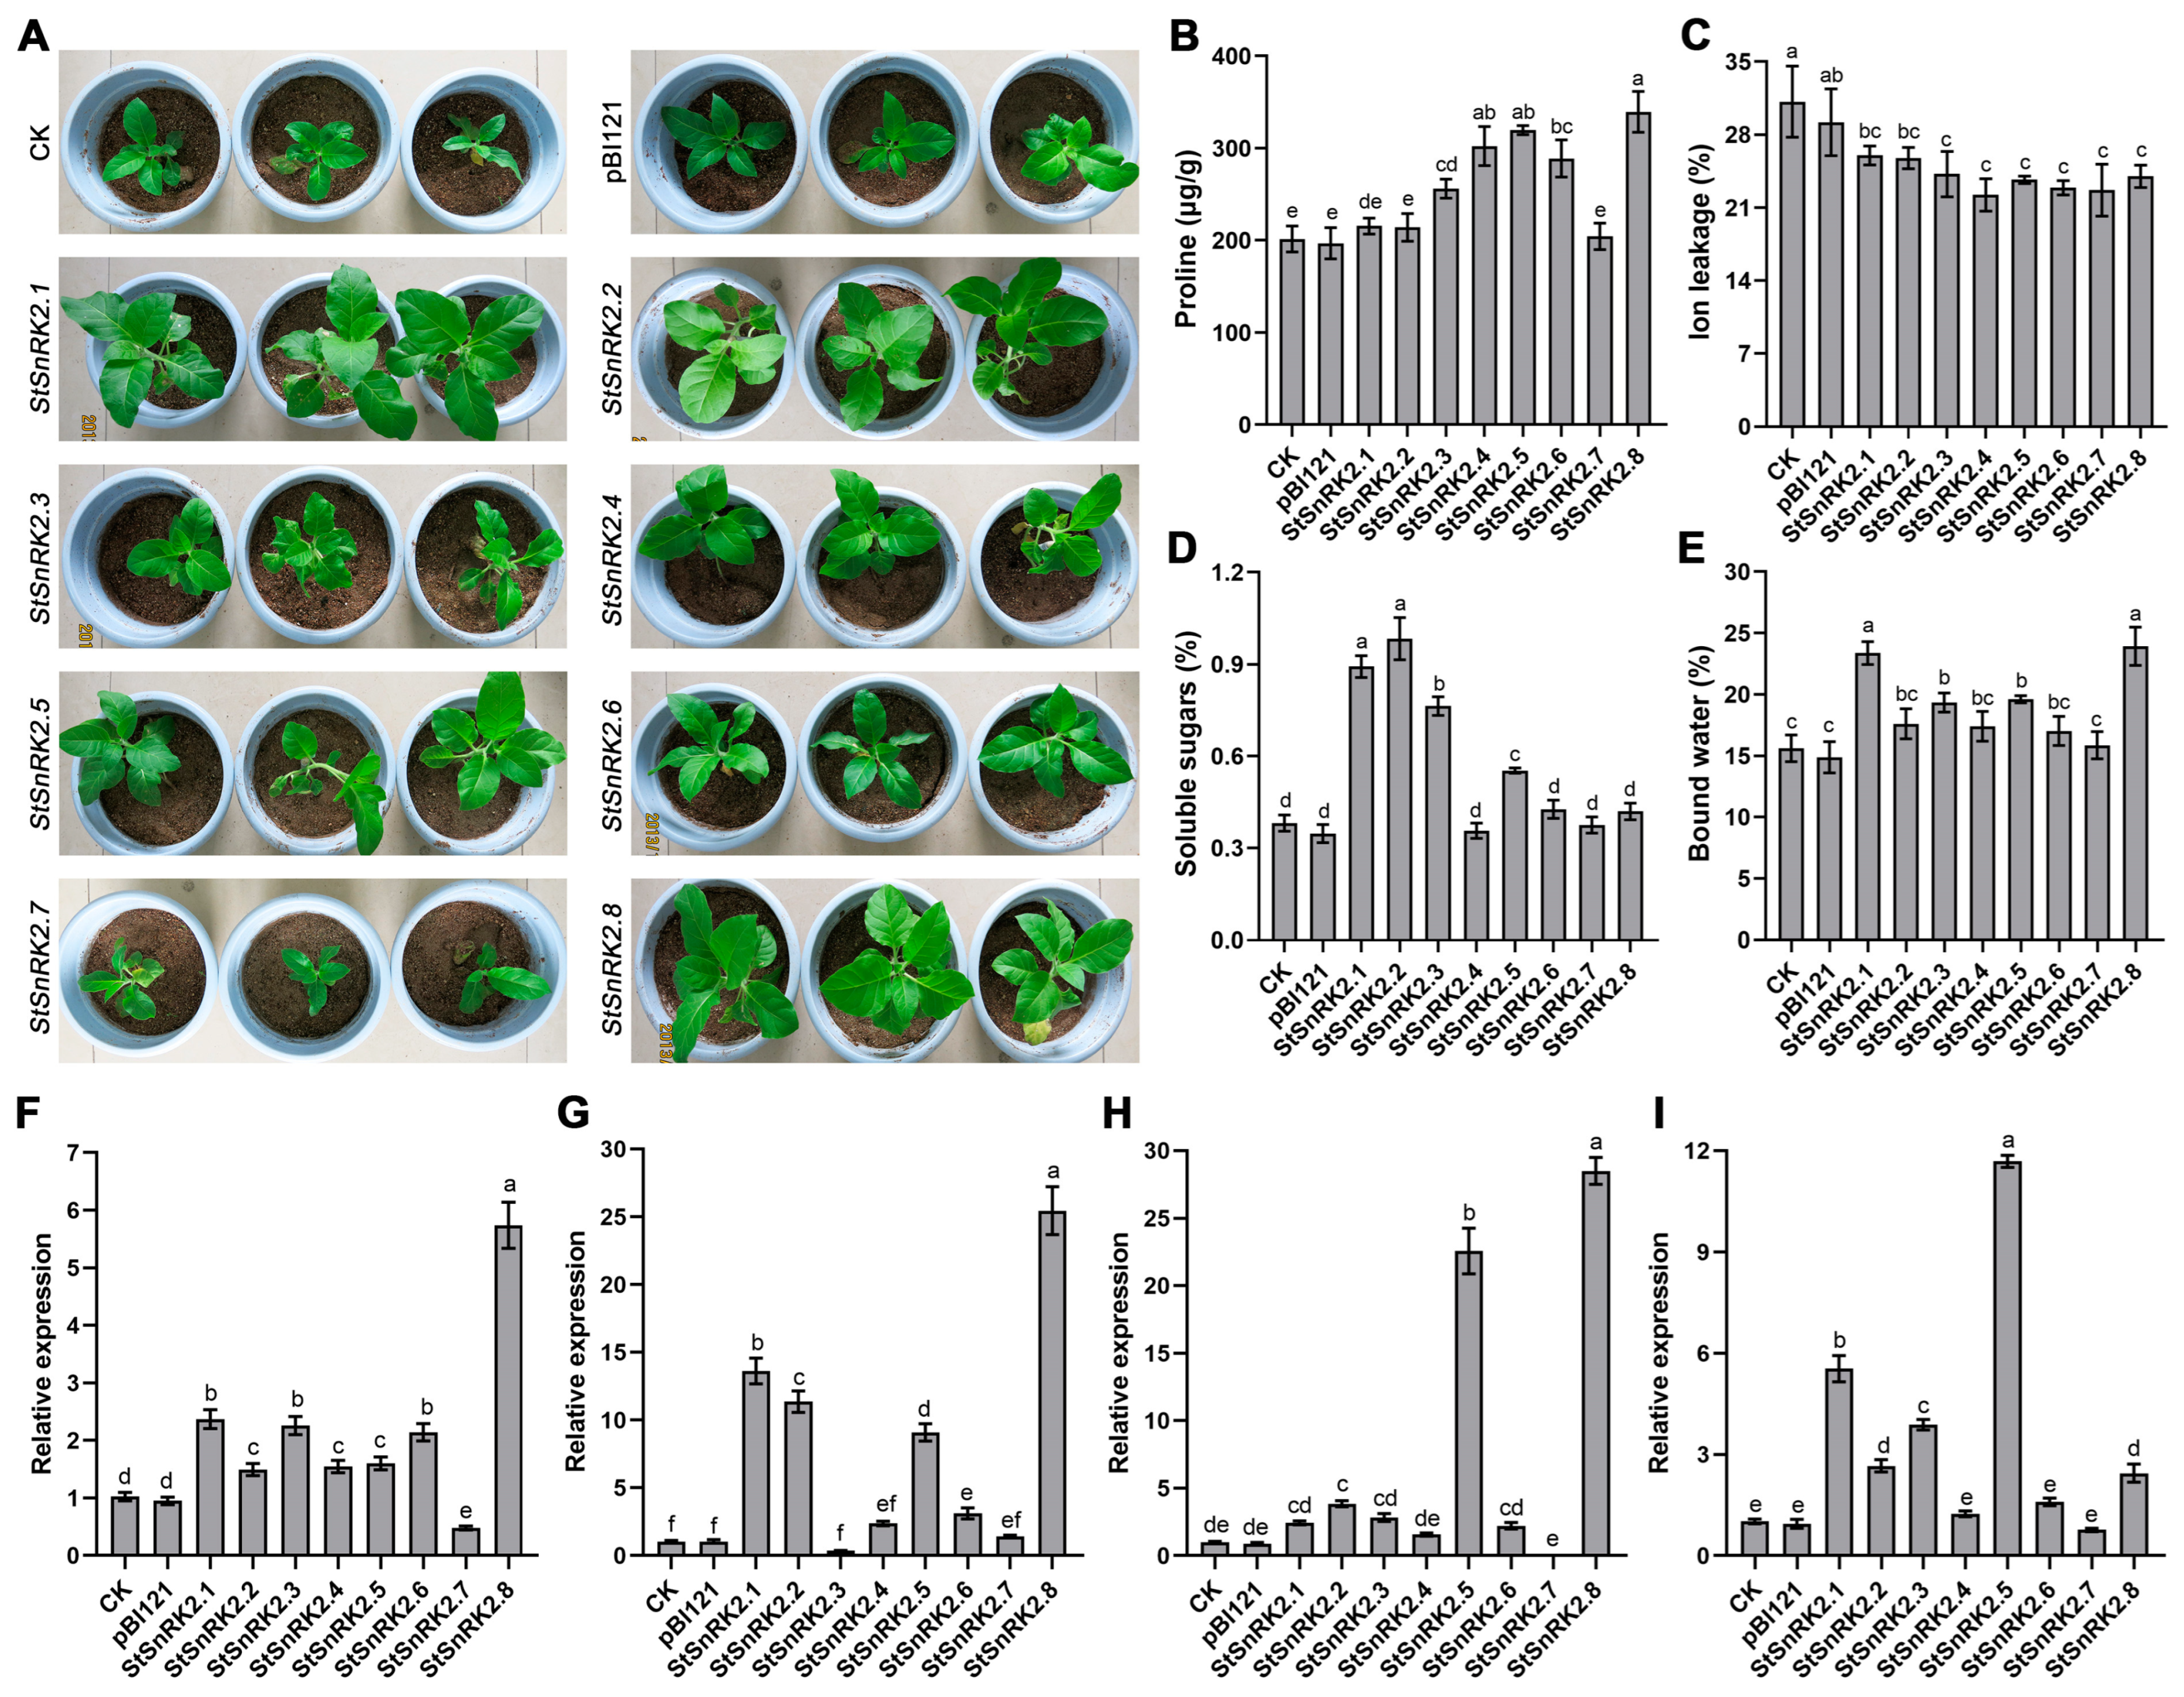
2.9. Effect of StSnRK2s on Drought Tolerance of Transgenic Tobacco

We further overexpressed StSnRK2 genes in tobacco to verify their biological function. First, obtained positive transgenic plants through Kana resistance screening and PCR identification (Figure S4). Then, the expression level of StSnRK2 genes in each line was analyzed, and lines with high expression of StSnRK2 genes were selected for subsequent experiments. Under normal conditions, there was no significant difference in growth phenotype between StSnRK2s transgenic plants and control plants (Figure S5). Then, 20-day-old plants were selected and exposed to drought stress. During the early stage of drought stress, the phenotypic difference among the different lines was not obvious, and the growth was basically the same. After two weeks of stress, there was a remarkably difference between the transgenic plants and the control plants. The growth of StSnRK2.7 transgenic plants and control plants became weaker after water restriction. Although their leaf number was similar to that of other transgenic plants, the leaves became smaller and stunted in growth. However, StSnRK2.1, StSnRK2.2, StSnRK2.5 and StSnRK2.8 transgenic plants had a good growth phenotype under drought stress, with hypertrophic leaves and little influence of water deficit, showing strong tolerance to drought stress. StSnRK2.4 and StSnRK2.6 transgenic plants also showed a certain tolerance to drought, although it was significantly weaker than that of the above four genes. StSnRK2.3 had little effect on the drought resistance of transgenic plants, and the growth phenotype of transgenic plants under drought stress was basically the same as that of the control plants. In general, overexpression of StSnRK2 genes affected the drought resistance of transgenic tobacco to varying degrees, and the drought resistance was ranked in the order of StSnRK2.1/2.8 > StSnRK2.2/2.5 > StSnRK2.4/2.6 > StSnRK2.3 > StSnRK2.7 (Figure 12A).

2.10. Physiological Characteristics of StSnRK2 Transgenic Plants under Drought Stress

To clarify the effect of StSnRK2s on physiological indices of transgenic plants after withholding water, we measured proline content, IL, soluble sugars and bound water. The results show that overexpression of StSnRK2.1, StSnRK2.2 and StSnRK2.7 genes had no effect on proline accumulation in transgenic plants (Figure 12B). However, the proline content of the other five transgenic plants was remarkably higher than that of the control plants, especially StSnRK2.4, StSnRK2.5 and StSnRK2.8, which increased by 51.7%, 60.4% and 70.4%, respectively. Ion leakage is usually used to evaluate damage to plant cells under stress. The results show that the IL of eight StSnRK2 transgenic plants under stress was significantly lower compared to than that of the control plants (Figure 12C), indicating that the StSnRK2s transgenic plant cells were less damaged under drought stress. In addition, we also detected soluble sugars and bound water. The overexpression of StSnRK2.1, StSnRK2.2, StSnRK2.3 and StSnRK2.5 significantly increased soluble sugar content in transgenic plants by 145.1%, 170.1%, 109.6% and 51.9%, respectively. However, the other four StSnRK2 genes did not affect the accumulation of soluble sugar in transgenic plants (Figure 12D). The content of bound water in plants is another positive indicator to evaluate plant stress resistance. The accumulation of bound water in StSnRK2.1 and StSnRK2.8 transgenic plant leaves was significantly higher than that in control plants under stress treatment, followed StSnRK2.3 and StSnRK2.5 transgenic plants; StSnRK2.2, StSnRK2.4 and StSnRK2.6 were slightly higher than the control plants, but the differences were not significant (Figure 12E).
To delve deeper into the molecular mechanism of StSnRK2s in drought stress, the expression levels of four genes were detected in the transgenic and control plants under drought conditions. Overexpression of StSnRK2s notably increased the expression level of NtCBL3 in transgenic plants, particularly in StSnRK2.8 overexpression lines, whereas StSnRK2.7 lines recorded the lowest expression (Figure 12F). Overexpression of StSnRK2.7 reduced the expression level of NtCBL3, which accounted for only 46.8% of the control plants. For NtERD10A gene, overexpression of StSnRK2.1, StSnRK2.2, StSnRK2.5 and StSnRK2.8 enhanced its expression by 13.1-, 10.9-, 8.7- and 24.5-fold, respectively relative to the expression in the control plants (Figure 12G). For the NtERD10B gene, the overexpression of StSnRK2.5 and StSnRK2.8 strikingly enhanced its expression level in transgenic plants by 23.8- and 30.1-fold, respectively, relative to the control plants (Figure 12H). The expression of NtERD10C in transgenic plants also markedly differed between transgenic plants and control plants. The expression level of NtERD10C in StSnRK2.1, StSnRK2.2, StSnRK2.3 and StSnRK2.5 transgenic plants was 5.7-, 2.7-, 3.9- and 11.9-fold of that in the control plants, respectively (Figure 12I). There was no clear difference in the expression of NtERD10C among other StSnRK2 transgenic plants.

3. Discussion

When exposed to harmful environments, plants can adapt to stress conditions through various morphological, physiological and molecular responses [41]. Stress-induced protein kinase phosphorylation plays a very important role in the process of plant sensing and response to such stress conditions. SnRK2s, a subfamily of Ser/Thr protein kinases, plays a key role in plant responses to stresses such as drought, high salt and low temperature [42]. As an important component in PYL-PP2C-SnRK2, the core module of the ABA signal pathway, SnRK2, regulates stomatal movement through phosphorylation of downstream proteins and ultimately affects plant stress resistance [43]. In our previous study, eight SnRK2 genes in potato were isolated and identified, and their basic gene structure and subcellular localization were analyzed [38]. However, the molecular characteristics, evolutionary relationship and biological function of StSnRK2 genes have not been studied to date. Here, we further studied the StSnRK2 genes according to the abovementioned aspects.
From the perspective of phylogenetic evolution, the analysis of the primary structure of protein provides important information for the evolutionary relationships among gene families. Previous studies have shown that the SnRK2s in most higher plants have nine exons, although some have one (ZmSnRK2.5) [15], two (SbSnRK2.8) [44], three (OsSAPK5) [14], five (AtSnRK2.8) [45] or seven (GmSnRK2.6) exons [16]. Generally, there are eight introns in plant SnRK2, indicating that these genes are highly conserved. In this study, the number of StSnRK2 gene introns was six (StSnRK2.6), seven (StSnRK2.8), eight (StSnRK2.1, 2.2, 2.5, 2.7) and nine (StSnRK2.3, 2.4), which is not extremely conservative. This finding suggests that SnRK2 members may experience uneven intron deletions in dicot and monocot plant lineages, leading to changes in the size and number of introns. The lengths of the second to eighth SnRK2s in maize and Arabidopsis were 75, 102, 54, 93, 93, 105 and 99 bp, respectively, with similar results in potato. StSnRK2.6 has six introns because it has an extended exon. These results indicate that SnRK2 genes evolved structural conservation among the same subgroups and diversity among different subgroups.
Gene duplication plays a key role in promoting biological evolution by creating original genetic materials that have been modified by natural selection pressure [46]. Original duplicate genes had a dual function, and the rejection of one of these two functions led to gene loss. When duplicate events occur, each gene acquires one of the functions and optimizes it separately so as to eliminate functional conflicts and ultimately ensure the stability of duplicate genes [47]. This indicates that SnRK2 gene duplication events represent an ancient system and that they have expanded with the amplification of genome-wide replication events in plants. In this study, by analyzing the synteny and collinearity of StSnRK2 genes, we identified two fragment replications but no tandem replication, which supports the view that a few potato genes were duplicated in the process of ancient polyploidization. Two pairs of SnRK2 genes (AtSnRK2.1/AtSnRK2.5 and AtSnRK2.2/AtSnRK2.3) in Arabidopsis were identified to have undergone segmental duplication. In rice, segmental duplication occurred in SAPK1/SAPK2 and SAPK4/SAPK5 [26]. Research has shown that potato, like Arabidopsis and rice, has experienced segmental duplication events [48]. The duplication of these fragments may greatly promote the expansion and evolution of StSnRK2s. Therefore, it is speculated that the existence of these genes in the potato genome may contribute to structural and functional innovation so that the potato can better adapt to adverse environments. New genes help existing genes adapt to new environmental conditions, and genomic tandem duplication events accelerate the evolution of new functions of replicated genes.
In order to evaluate the evolutionary relationship of StSnRK2 proteins between potato and other species, we constructed a tree based on the alignment of their full-length protein sequences. The SnRK2 family members in higher plants were previously divided into three groups [49]. However, there are very few species in which SnRK2 proteins are divided into four subgroups, such as MpSnRK2 [50] and OsSAPK2 [51]. Evolutionary studies based on the sequences of algae [52], moss, ferns and angiosperms (including Arabidopsis and rice) show that seed plants contain all groups of SnRK2; fern SnRK2 belongs to groups 4 and 3, bryophytes contain only group 3 members [53] and SnRK2 from algae is different from that in higher plants in sequence. These results indicate a possible evolutionary pattern of plant SnRK2s. Goup3 is an ancient form, group 4 appears before and after the emergence of pteridophytes, group 2 is closely related to group 4, and group 1 appears before angiosperms in its latest form. In this study, StSnRK2 proteins were divided into three subgroups, which means that potato SnRK2 may appear before fern SnRK2. Genomic comparison of SnRK2s showed potato had higher collinearity with soybean and tea than Arabidopsis and rice. Analysis of Ka/Ks between monocots and dicots is helpful to understand the evolutionary relationship between different species [54]. The Ka/Ks value has a closer evolutionary relationship among soybean, potato and rape. In addition, the occurrence probabilities of G3s, C3s and GC3s in monocotyledons are higher than those in T3s and A3s, but the results in dicotyledons are opposite.
Several studies have shown that the intensity of gene expression is usually related to differences in its promoter region. Cis elements in the promoter play a key role in gene response to environmental changes [55]. The analysis of promoter in this study showed that the StSnRK2 promoters contain various types of cis elements, such as ABRE, MBS, Box4, etc. Most StSnRK2 gene promoters contain at least such cis element, indicating that StSnRK2s can respond to multiple abiotic stresses. However, the gene response to stress does not always correspond to the type of response element in its promoter region. For example, ABRE is not present in the promoters of StSnRK2.4, although it was induced by ABA. No MBS element was found in StSnRK2.3 and StSnRK2.7 promoters, but these genes were induced by PEG. Therefore, the analysis of cis elements in the promoter region can provide important clues for the study of gene function, especially for gene expression patterns under different stresses. Similar results were found in maize [56], cotton [57] and wheat [58]. The prediction of upstream regulatory proteins of StSnRK2 genes also provides a certain reference for further clarification of their regulatory mechanism. These results indicate that StSnRK2s participates in different stress response signal pathways and that there may be other unknown stress-related cis elements and/or unknown mechanisms involved in the regulation of StSnRK2 genes.
Studies on the function of SAPKs/SnRK2 have shown that this gene family play an important regulatory role in plant responses to abiotic stress. For instance, overexpression of TaSnRK2.4 significantly increased the resistance of transgenic plants to salt, drought and freezing [59]; the overexpression of AtSnRK2.8 significantly improved drought resistance of plants [45]; overexpression of SAPK4 or SAPK6 increased salt tolerance of rice [60]; and the overexpression of ZmSnRK2.8 saved the drought-sensitive phenotype of the ost1 mutant and significantly improved the growth and development of Arabidopsis under stress conditions [15]. SAPK8, SAPK9 and SAPK10 are homologs of AtSnRK2.2, AtSnRK2.3 and AtSnRK2.6, respectively, belong to subgroup III of rice and are strongly activated by ABA. Overexpression of SAPK8, SAPK9 or SAPK10 in rice resulted in delayed seed germination and seedling growth [61]. In this study, the overexpression of eight StSnRK2 genes showed significant differences in the effects on drought resistance of transgenic plants. For example, the overexpression of StSnRK2.1 and StSnRK2.8 significantly enhanced the tolerance of transgenic plants to drought stress; StSnRK2.7 had little effect on the drought resistance of transgenic plants; and under StSnRK2.3, as the homologous gene of AtSnRK2.2/2.3/2.6, the change in drought resistance of transgenic plants was also weak. Moreover, determination of physiological indices showed that there were great differences in the effects of different StSnRK2 genes on the accumulation of downstream metabolites. According to the above results, StSnRK2 genes play an important role in plant responses to drought stress, and there may be great differences in their regulatory mechanisms. However, the present study only preliminarily verified the drought resistance of StSnRK2 genes in model plants; whether these genes may also have a regulatory function under other stress conditions, such as high salt, low temperature or high temperature, as well as the molecular mechanism of their role, remains unclear, which will be the focus of our next study.

4. Materials and Methods

4.1. Plant Materials

Potato cultivars ‘Atlantic’ and ‘Longshu No.3’ and tobacco ‘NT12’ were obtained from the College of Agronomy of Gansu Agricultural University. Potato test-tube seedlings were grown in an artificial growth room under conditions of a 16 h light/8 h dark photoperiod and 22 ± 2 °C, with 60% relative humidity. The tobacco plants were sown in a greenhouse at 25 ± 2 °C, with a 12 h light/12 h dark photoperiod and 60% relative humidity. The plant expression vector pBI121 and agrobacterium tumefaciens EHA105 were stored in our laboratory.

4.2. Exogenous ABA and Drought Treatments

After 20 days of planting, potato seedlings were sprayed with alcohol solution containing 50 μM of ABA, and only alcohol was used as a control treatment. For drought treatment, 20-day-old seedlings from untreated growth medium were extirpated, placed in liquid MS medium containing 5% polyethylene glycol (PEG) and harvested at different time points (0, 2, 4, 6, 12, 24 and 48 h) for gene expression analysis. Seedlings transferred to normal MS medium were used as a control. In addition, we examined the response of potato seedlings under long-term drought stress conditions. Healthy stems were excised and inserted in a test tube containing solid MS medium supplemented with PEG6000 (w/v) at different concentrations (0, 2, 4, 6 and 8%). Four weeks later, all samples were collected for gene expression analysis and physiological determination (proline, MDA, chlorophyll, SOD and CAT activity). Seedlings obtained from ‘Atlantic’ and ‘Longshu No.3’ tubers 5 days after germination were planted in 30 cm pots filled with peat soil and monitored under natural conditions. Regular watering was carried out until plants reached a maximum height of 15 cm. Unstressed plants were kept under normal irrigation at 100% field capacity, and watering was suspended for drought-stressed plants. Fifteen days later, the samples were collected for gene expression analysis and physiological determination (proline, MDA, ion leakage, POD, SOD and CAT activity). All the stress treatment experiments were repeated three times.

4.3. Tobacco Transformation

The full-length cDNA sequences of StSnRK2.1-2.8 were inserted into pBI121 driven by the CaMV 35S promoter by XbaI and SacI restriction sites and verified by restriction endonuclease digestion and sequencing. The recombinant vector pBI121-StSnRK2s and empty vector pBI121 were transformed into wild-type Nicotiana tabacum (NT12) by Agrobacterium tumefaciens strain EHA105. The tobacco leaves infected by agrobacterium EHA105 were transferred to induction medium (MS + 1.0 g/L 6-BA) and cocultured in the dark for 3 days. Then, the infected leaves were transferred to a plant incubator (12 h light/12 h dark photoperiod, 22 ± 2 °C and 60% relative humidity) for induction and differentiation of resistant buds (MS + 1.0 g/L 6-BA + 100 mg/L Kan + 500 mg/L Cef). The resistant buds were cut and transferred to elongation medium (MS + 0.1 g/L 6-BA + 100 mg/L Kan + 500 mg/L Cef) when the buds grew to approximately 1.5 cm. Then, the resistant buds were transferred to the rooting medium (1/2 MS + 1.0 mg/L NAA + 100 mg/L Kan + 500 mg/L Cef) to induce rooting when the buds grew independently and began to take root. Finally, the positive lines were selected and verified by PCR.

4.4. Drought Stress of Transgenic Tobacco

StSnRK2s transgenic tobacco, empty vector pBI121 transgenic tobacco and wild-type tobacco were cultured in a greenhouse under the following conditions: 12 h light/12 h dark photoperiod, 22 ± 2 °C and 60% relative humidity. After 20 days of growth, plants with uniform seedling performance were selected for drought treatment. For drought-stressed plants, watering was withheld for 2 weeks, whereas control plants were irrigated optimally. The morphological characteristics of each plant were observed during the stress period. In addition, 30-day-old transgenic tobacco and wild tobacco were treated with 20% PEG for 48 h, and the expression levels of drought-stress-related genes, free water and bound water, soluble sugar, relative electrical conductivity and proline content were determined. All the stress treatment experiments were repeated three times.

4.5. qRT-PCR

The expression patterns of StSnRK2 genes under different stress conditions were analyzed by qRT-PCR. The primers of StSnRK2s (Table S3) were designed using Primer6. The expression level of drought-related genes in transgenic tobacco was also analyzed (Table S4). Potato EF1α gene was used as the internal reference. The reaction system (10 μL) comprised 5 μL PrimeSTAR® Max DNA polymerase of, 1 μL of primers (10 mM) and 4 μL of ddH2O. The reaction conditions were as follows: 95 °C, 3 min; 95 °C, 5 s; 60 °C, 30 s; 45 cycles. The PCR results were calculated by the 2−ΔΔCT method.

4.6. Intro/Exon Structures, conserved Motifs/Domains and Chromosomal Distribution of Potato SnRK2 Genes

The conserved motifs and domains of SnRK2 proteins were analyzed with the MEME online program (https://meme.nbcr.net/meme/intro.html, accessed on 20 August 2020) and the NCBI Batch CD-search online website (https://www.ncbi.nlm.nih.gov/Structure/bwrpsb/bwrpsb.cgi, accessed on 25 August 2020), then visualized using TBtool. The exon/intron constituents and chromosome distribution of StSnRK2 members were also analyzed and visualized using TBtools.

4.7. Phylogenetic Analysis of Potato SnRK2 Proteins

The StSnRK2 protein sequences of Arabidopsis, oilseed rape, rice, soybeans, grapes, tea tree and maize were downloaded from the NCBI or EnsemalPlants database. Then, a phylogenetic tree of potato SnRK2 proteins with other SnRK2 proteins was constructed using MEGA7 software, and 1000 bootstrap tests were carried out. Finally, the phylogenetic tree of StSnRK2 proteins was modified through the EvolView online website (https://evolgenius.info//evolview-v2/#login, accessed on 15 January 2021).

4.8. Intraspecific/Interspecific Collinearity Analysis of Potato SnRK2 Genes

The reference genomic sequence and GFF annotation files of potato were self-aligned in TBtools to analyze the collinearity among StSnRK2 members. Moreover, the genomic sequence and GFF annotation files of Arabidopsis, soybean, tomato, tartary buckwheat, grape and sunflower were downloaded from the EnsemblPlants database (https://plants.ensembl.org/index.html, accessed on 17 January 2021) and aligned with the potato genome sequence by TBtools. The intraspecific and interspecific collinearity results of StSnRK2 genes were visualized by TBtools.

4.9. Selection Pressur, and Codon Usage Bias Analysis of Potato SnRK2 Genes

Based on the NG method, 122 SnRK2 genes of 9 species were employed to calculate the Ka, Ks and Ka/Ks, as well as average values of each species, to analyze the evolutional selection pressure. The divergence time was calculated as T = Ks/2r, where r was assumed to be 1.5 × 10⁻⁸ synonymous substitutions per site and per year for dicotyledonous plants. CodonW software was used to analyze the codon usage characteristics of the StSnRK2 gene family in monocots and dicots. The main parameters, including A3s, G3s, C3s, T3s, CAI, CBI, FOP, Nc and GC3s, were calculated by employing all CDS sequences. The correlation relationships of codon usage parameters were analyzed in monocots and dicots.

4.10. Cis-Element Analysis of Potato SnRK2 Genes

The promoter sequences 2000 bp upstream of the start codon of StSnRK2 genes were extracted by TBtools and submitted to the PlantCARE website (http://bioinformatics.psb.ugent.be/webtools/plantcare/html/, accessed on 20 March 2021) to predict the type and number of cis-acting elements in the promoter sequences. Finally, the results of cis-acting elements were visualized by TBtools. PlantRegMap online software (http://plantregmap.gao-lab.org/binding_site_prediction.php, accessed on 23 March 2021) was used to predicate the upstream regulatory proteins of StSnRK2 genes. A word cloud was generated with online software (https://kt.fkw.com/ciyun.html?isEditor=true#/, accessed on 25 March 2021).

4.11. Statistical Analysis

All experiments were performed for three independent biological repeats, and at least three technical repeats were set each time. Data were analyzed using the Student’s t test. A p value of <0.05 was considered significant.

5. Conclusions

In summary, the gene structure, phylogeny and evolution, chromosome location and interspecific/intraspecific collinearity of potato SnRK2 family genes were analyzed systematically for the first time in this study. The results show that eight StSnRK2 genes were distributed on six chromosomes, coding proteins were divided into three subgroups, and StSnRK2s clustered in the same subgroup had similar conserved motifs and domains. In addition, StSnRK2 has a wide range of replication events in some species, which is closer to dicots in the process of evolution. The results of selective pressure analysis show that the average Ka/Ks value of SnRK2s in monocots was higher than that of dicots. Further codon preference analysis showed that SnRK2s prefer to use C3s, G3s and GC3s in monocots, whereas T3s and A3s are preferred in dicots. Moreover, analysis of the response to drought stress showed that some StSnRK2 genes are significantly associated with drought stress. Finally, the functional verification results in tobacco show that the overexpression of StSnRK2 genes improved the drought resistance of transgenic tobacco to varying degrees; the order of strength was reported as StSnRK2.1/2.8 > StSnRK2.2/2.5 > StSnRK2.4/2.6 > StSnRK2.3 > StSnRK2.7. This study provides useful insights into the evolution and function of StSnRK2s and lays a foundation for further study on the molecular mechanism of StSnRK2s regulating potato drought resistance.

Supplementary Materials

The supporting information can be downloaded at: https://www.mdpi.com/article/10.3390/ijms24021000/s1.

Author Contributions

Conceptualization, P.Y. and J.B.; methodology, Z.B. and C.S.; software, L.S., C.Z., T.Q. and Y.L.; formal analysis, Y.W., J.M. and Z.L.; writing—original draft preparation, P.Y.; writing—review and editing, S.D., K.A., P.Y. and J.B. All authors have read and agreed to the published version of the manuscript.

Funding

This research was funded by the Research Program Sponsored by the State Key Laboratory of Aridland Crop Science of China (grant number GSCS-2022-02), the Scientific Research Startup Funds for Openly-recruited Doctors of Gansu Agricultural University (grant number GAU-KYQD-2021-11), the China Agriculture Potato Research System of MOF and MARA (grant number CARS-09-P10) and the Gansu Science and Technology fund (grant number 21JR7RA804).

Institutional Review Board Statement

Not applicable.

Informed Consent Statement

Not applicable.

Data Availability Statement

All data are available within the manuscript.

Acknowledgments

We thank Philip Kear, International Potato Center (CIP), CIP China Center for Asia Pacific (CCCAP), for his contribution to the language of this paper.

Conflicts of Interest

The authors declare no conflict of interest.

References

  1. Ma, Y.; Dias, M.C.; Freitas, H. Drought and salinity stress responses and microbe-induced tolerance in plants. Front. Plant Sci. 2020, 11, 591911. [Google Scholar] [CrossRef] [PubMed]
  2. Simelton, E.; Fraser, E.D.; Termansen, M.; Forster, P.M.; Dougill, A.J. Typologies of crop-drought vulnerability: An empirical analysis of the socio-economic factors that influence the sensitivity and resilience to drought of three major food crops in China (1961–2001). Environ. Sci. Policy 2009, 12, 438–452. [Google Scholar] [CrossRef]
  3. Chen, G.; Zhou, Y.; Kishchenko, O.; Stepanenko, A.; Jatayev, S.; Zhang, D.; Borisjuk, N. Gene editing to facilitate hybrid crop production. Biotechnol. Adv. 2021, 46, 107676. [Google Scholar] [CrossRef] [PubMed]
  4. Georges, F.; Ray, H. Genome editing of crops: A renewed opportunity for food security. Gm. Crops Food. 2017, 8, 1–12. [Google Scholar] [CrossRef] [PubMed] [Green Version]
  5. Lin, L.; Wu, J.; Jiang, M.; Wang, Y. Plant mitogen-activated protein kinase cascades in environmental stresses. Int. J. Mol. Sci. 2021, 22, 1543. [Google Scholar] [CrossRef] [PubMed]
  6. Oladosu, Y.; Rafii, M.Y.; Samuel, C.; Fatai, A.; Magaji, U.; Kareem, I.; Kamarudin, Z.S.; Muhammad, I.i.; Kolapo, K. Drought resistance in rice from conventional to molecular breeding: A review. Int. J. Mol. Sci. 2019, 20, 3519. [Google Scholar] [CrossRef] [Green Version]
  7. Hu, W.; Zhang, J.P.; Yan, K.; Zhou, Z.G.; Zhao, W.Q.; Zhang, X.D.; Pu, Y.H.; Yu, R.X. Beneficial effects of abscisic acid and melatonin in overcoming drought stress in cotton (Gossypium hirsutum L.). Physiol. Plantarum. 2021, 173, 2041–2054. [Google Scholar] [CrossRef]
  8. Sreenivasulu, N.; Harshavardhan, V.T.; Govind, G.; Seiler, C.; Kohli, A. Contrapuntal role of ABA: Does it mediate stress tolerance or plant growth retardation under long-term drought stress? Gene 2012, 506, 265–273. [Google Scholar] [CrossRef]
  9. Duarte, K.E.; Souza, W.R.; Santiago, T.R.; Sampaio, B.L.; Ribeiro, A.P.; Cotta, M.G.; Da, C.B.A.D.B.; Marraccini, P.R.R.; Kobayashi, A.K.; Molinari, H.B.C. Identification and characterization of core abscisic acid (ABA) signaling components and their gene expression profile in response to abiotic stresses in Setaria viridis. Sci. Rep. 2019, 9, 1–16. [Google Scholar] [CrossRef] [Green Version]
  10. Miyazono, K.I.; Miyakawa, T.; Sawano, Y.; Kubota, K.; Kang, H.J.; Asano, A.; Miyauchi, Y.; Takahashi, M.; Zhi, Y.; Fujita, Y. Structural basis of abscisic acid signalling. Nature 2009, 462, 609–614. [Google Scholar] [CrossRef]
  11. Park, S.Y.; Fung, P.; Nishimura, N.; Jensen, D.R.; Fujii, H.; Zhao, Y.; Lumba, S.; Santiago, J.; Rodrigues, A.; Chow, T.F.F. Abscisic acid inhibits type 2C protein phosphatases via the PYR/PYL family of START proteins. Science 2009, 324, 1068–1071. [Google Scholar] [CrossRef] [Green Version]
  12. Wang, Y.; Yan, H.; Qiu, Z.; Hu, B.; Zeng, B.; Zhong, C.; Fan, C. Comprehensive analysis of SnRK gene family and their responses to salt stress in Eucalyptus grandis. Int. J. Mol. Sci. 2019, 20, 2786. [Google Scholar] [CrossRef] [Green Version]
  13. Saha, J.; Chatterjee, C.; Sengupta, A.; Gupta, K.; Gupta, B. Genome-wide analysis and evolutionary study of sucrose non-fermenting 1-related protein kinase 2 (SnRK2) gene family members in Arabidopsis and Oryza. Comput. Biol. Chem. 2014, 49, 59–70. [Google Scholar] [CrossRef]
  14. Xu, M.R.; Huang, L.Y.; Zhang, F.; Zhu, L.H.; Zhou, Y.L.; Li, Z.K. Genome-wide phylogenetic analysis of stress-activated protein kinase genes in rice (OsSAPKs) and expression profiling in response to Xanthomonas oryzae pv. oryzicola infection. Plant Mol. Biol. Rep. 2013, 31, 877–885. [Google Scholar] [CrossRef]
  15. Long, T.; Xu, B.; Hu, Y.; Wang, Y.; Mao, C.; Wang, Y.; Zhang, J.; Liu, H.; Huang, H.; Liu, Y. Genome-wide identification of ZmSnRK2 genes and functional analysis of ZmSnRK2.10 in ABA signaling pathway in maize (Zea mays L.). BMC Plant Biol. 2021, 21, 1–17. [Google Scholar] [CrossRef]
  16. Zhao, W.; Cheng, Y.H.; Zhang, C.; Shen, X.J.; You, Q.B.; Guo, W.; Li, X.; Song, X.J.; Zhou, X.A.; Jiao, Y.Q. Genome-wide identification and characterization of the GmSnRK2 family in soybean. Int. J. Mol. Sci. 2017, 18, 1834. [Google Scholar] [CrossRef] [Green Version]
  17. Li, J.; Song, J.; Li, C.; Ma, J.; Liu, J.; Zhu, X.; Li, J.; He, F.; Yang, C. Genome-wide identification and expression profile analysis of the SnRK2 gene family in Nicotiana tabacum. Biochem. Genet. 2022, 60, 1–16. [Google Scholar] [CrossRef]
  18. Zhang, Y.H.; Wan, S.Q.; Wang, W.D.; Chen, J.F.; Huang, L.L.; Duan, M.S.; Yu, Y.B. Genome-wide identification and characterization of the CsSnRK2 family in Camellia sinensis. Plant Physiol. Bioch. 2018, 132, 287–296. [Google Scholar] [CrossRef]
  19. Liu, Z.; Ge, X.; Yang, Z.; Zhang, C.; Zhao, G.; Chen, E.; Liu, J.; Zhang, X.; Li, F. Genome-wide identification and characterization of SnRK2 gene family in cotton (Gossypium hirsutum L.). BMC Genet. 2017, 18, 1–14. [Google Scholar] [CrossRef] [Green Version]
  20. Wu, Z.; Cheng, J.; Hu, F.; Qin, C.; Xu, X.; Hu, K. The SnRK2 family in pepper (Capsicum annuum L.): Genome-wide identification and expression analyses during fruit development and under abiotic stress. Genes Genom. 2020, 42, 1117–1130. [Google Scholar] [CrossRef]
  21. Liu, J.Y.; Chen, N.N.; Cheng, Z.M.; Xiong, J.S. Genome-wide identification, annotation and expression profile analysis of SnRK2 gene family in grapevine. Aust. J. Grape Wine Res. 2016, 22, 478–488. [Google Scholar] [CrossRef]
  22. Fatima, A.; Khan, M.J.; Awan, H.M.; Akhtar, M.N.; Bibi, N.; Sughra, K.; Khan, M.R.; Ahmad, R.; Ibrahim, M.; Hussain, J. Genome-wide identification and expression analysis of SnRK2 gene family in mungbean (Vigna radiata) in response to drought stress. Crop Pasture Sci. 2020, 71, 469–476. [Google Scholar] [CrossRef]
  23. Song, J.; Sun, P.; Kong, W.; Xie, Z.; Li, C.; Liu, J.H. SnRK2.4-mediated phosphorylation of ABF2 regulates ARGININE DECARBOXYLASE expression and putrescine accumulation under drought stress. New Phytol. 2022, 23, 3053–3057. [Google Scholar]
  24. Zhang, X.; Wu, S.; Liu, S.; Takano, T. The Arabidopsis sucrose non-fermenting-1-related protein kinase AtSnRK2.4 interacts with a transcription factor, AtMYB21, that is involved in salt tolerance. Plant Sci. 2021, 303, 110685. [Google Scholar] [CrossRef] [PubMed]
  25. Ding, S.; Zhang, B.; Qin, F. Arabidopsis RZFP34/CHYR1, a ubiquitin E3 ligase, regulates stomatal movement and drought tolerance via SnRK2.6-mediated phosphorylation. Plant Cell. 2015, 27, 3228–3244. [Google Scholar] [CrossRef] [Green Version]
  26. Li, X.; Yu, B.; Wu, Q.; Min, Q.; Zeng, R.; Xie, Z.; Huang, J. OsMADS23 phosphorylated by SAPK9 confers drought and salt tolerance by regulating ABA biosynthesis in rice. PLoS Genet. 2021, 17, 1009699. [Google Scholar] [CrossRef]
  27. Zhang, H.; Mao, X.; Wang, C.; Jing, R. Overexpression of a common wheat gene TaSnRK2.8 enhances tolerance to drought, salt and low temperature in Arabidopsis. PLoS ONE 2010, 5, 16041. [Google Scholar] [CrossRef] [Green Version]
  28. Liu, C.; Hu, J.; Fan, W.; Zhu, P.; Cao, B.; Zheng, S.; Xia, Z.; Zhu, Y.; Zhao, A. Heterotrimeric G-protein γ subunits regulate ABA signaling in response to drought through interacting with PP2Cs and SnRK2s in mulberry (Morus alba L.). Plant Physiol. Bioch. 2021, 161, 210–221. [Google Scholar] [CrossRef]
  29. Qin, R.; Zhang, F.; Yu, C.; Zhang, Q.; Qi, J.; Li, F.M. Contributions made by rain-fed potato with mulching to food security in China. Eur. J. Agron. 2022, 133, 126435. [Google Scholar] [CrossRef]
  30. Zhang, H.; Fen, X.; Yu, W.; Hu, H.h.; Dai, X.F. Progress of potato staple food research and industry development in China. J. Integr. Agric. 2017, 16, 2924–2932. [Google Scholar] [CrossRef]
  31. Waterer, D.; Benning, N.T.; Wu, G.; Luo, X.; Liu, X.; Gusta, M.; McHughen, A.; Gusta, L.V. Evaluation of abiotic stress tolerance of genetically modified potatoes (Solanum tuberosum cv. Desiree). Mol. Breed. 2010, 25, 527–540. [Google Scholar] [CrossRef]
  32. Shi, J.; Wang, J.; Wang, N.; Zhou, H.; Xu, Q.; Yan, G. Overexpression of StGA2ox1 gene increases the tolerance to abiotic stress in transgenic potato (Solanum tuberosum L.) plants. Appl. Biochem. Biotech. 2019, 187, 1204–1219. [Google Scholar] [CrossRef]
  33. Sun, C.; Liang, W.; Yan, K.; Xu, D.; Qin, T.; Fiaz, S.; Kear, P.; Bi, Z.; Liu, Y.; Liu, Z. Expression of potato StDRO1 in Arabidopsis alters root architecture and drought tolerance. Front. Plant Sci. 2022, 13, 836063. [Google Scholar] [CrossRef]
  34. Wang, L.; Liu, Y.; Feng, S.; Yang, J.; Li, D.; Zhang, J. Roles of plasmalemma aquaporin gene StPIP1 in enhancing drought tolerance in potato. Front. Plant Sci. 2017, 8, 616. [Google Scholar] [CrossRef] [Green Version]
  35. Qi, X.; Tang, X.; Liu, W.; Fu, X.; Luo, H.; Ghimire, S.; Zhang, N.; Si, H. A potato RING-finger protein gene StRFP2 is involved in drought tolerance. Plant Physiol. Bioch. 2020, 146, 438–446. [Google Scholar] [CrossRef]
  36. Zhu, X.; Zhang, N.; Liu, X.; Li, S.; Yang, J.; Hong, X.; Wang, F.; Si, H. Mitogen-activated protein kinase 11 (MAPK11) maintains growth and photosynthesis of potato plant under drought condition. Plant Cell Rep. 2021, 40, 491–506. [Google Scholar] [CrossRef]
  37. Li, S.; Zhang, N.; Zhu, X.; Ma, R.; Yang, J.; Tang, X.; Si, H. Enhanced drought tolerance with artificial microRNA-mediated StProDH1 gene silencing in potato. Crop Sci. 2020, 60, 1462–1471. [Google Scholar] [CrossRef]
  38. Bai, J.; Mao, J.; Yang, H.; Khan, A.; Fan, A.; Liu, S.; Zhang, J.; Wang, D.; Gao, H.; Zhang, J. Sucrose non-ferment 1 related protein kinase 2 (SnRK2) genes could mediate the stress responses in potato (Solanum tuberosum L.). BMC Genet. 2017, 18, 1–15. [Google Scholar] [CrossRef] [Green Version]
  39. Holub, E.B. The arms race is ancient history in Arabidopsis, the wildflower. Nat. Rev. Genet. 2001, 2, 516–527. [Google Scholar] [CrossRef]
  40. Liu, L.; Xu, W.; Hu, X.; Liu, H.; Lin, Y. W-box and G-box elements play important roles in early senescence of rice flag leaf. Sci. Rep. 2016, 6, 1–9. [Google Scholar] [CrossRef] [Green Version]
  41. Seleiman, M.F.; Al-Suhaibani, N.; Ali, N.; Akmal, M.; Alotaibi, M.; Refay, Y.; Dindaroglu, T.; Abdul-Wajid, H.H.; Battaglia, M.L. Drought stress impacts on plants and different approaches to alleviate its adverse effects. Plants 2021, 10, 259. [Google Scholar] [CrossRef] [PubMed]
  42. Yang, G.; Yu, Z.; Gao, L.; Zheng, C. SnRK2s at the crossroads of growth and stress responses. Trends Plant Sci. 2019, 24, 672–676. [Google Scholar] [CrossRef] [PubMed]
  43. Weiner, J.J.; Peterson, F.C.; Volkman, B.F.; Cutler, S.R. Structural and functional insights into core ABA signaling. Curr. Opin. Plant Biol. 2010, 13, 495–502. [Google Scholar] [CrossRef] [PubMed] [Green Version]
  44. Li, L.B.; Zhang, Y.R.; Liu, K.C.; Ni, Z.F.; Fang, Z.J.; Sun, Q.X.; Gao, J.W. Identification and bioinformatics analysis of SnRK2 and CIPK family genes in sorghum. Agric. Sci. China 2010, 9, 19–30. [Google Scholar] [CrossRef]
  45. Wei, H.; Movahedi, A.; Xu, C.; Wang, P.; Sun, W.; Yin, T.; Zhuge, Q. Heterologous overexpression of the Arabidopsis SnRK2.8 gene enhances drought and salt tolerance in Populus × euramericana cv ‘Nanlin895’. Plant Biotechnol. Rep. 2019, 13, 245–261. [Google Scholar] [CrossRef]
  46. Holland, P.W. (Ed.) Gene duplication: Past, present and future. Semin. Cell Dev. Biol. 1999, 10, 541–547. [Google Scholar] [CrossRef]
  47. Copley, S.D. Evolution of new enzymes by gene duplication and divergence. FEBS J. 2020, 287, 1262–1283. [Google Scholar] [CrossRef] [Green Version]
  48. Yin, G.; Xu, H.; Xiao, S.; Qin, Y.; Li, Y.; Yan, Y.; Hu, Y. The large soybean (Glycine max) WRKY TF family expanded by segmental duplication events and subsequent divergent selection among subgroups. BMC Plant Biol. 2013, 13, 1–19. [Google Scholar] [CrossRef] [Green Version]
  49. Lin, Z.; Li, Y.; Zhang, Z.; Liu, X.; Hsu, C.C.; Du, Y.; Sang, T.; Zhu, C.; Wang, Y.; Satheesh, V. A RAF-SnRK2 kinase cascade mediates early osmotic stress signaling in higher plants. Nat. Commun. 2020, 11, 1–10. [Google Scholar] [CrossRef] [Green Version]
  50. Ye, Y.; Jia, X.; Xue, M.; Gao, Y.; Yue, H.; Ma, F.; Gong, X. MpSnRK2.10 confers salt stress tolerance in apple via the ABA signaling pathway. Sci. Hortic. 2022, 298, 110998. [Google Scholar] [CrossRef]
  51. Lou, D.; Wang, H.; Liang, G.; Yu, D. OsSAPK2 confers abscisic acid sensitivity and tolerance to drought stress in rice. Front. Plant Sci. 2017, 8, 993. [Google Scholar] [CrossRef]
  52. Shinozawa, A.; Otake, R.; Takezawa, D.; Umezawa, T.; Komatsu, K.; Tanaka, K.; Amagai, A.; Ishikawa, S.; Hara, Y.; Kamisugi, Y. SnRK2 protein kinases represent an ancient system in plants for adaptation to a terrestrial environment. Commun. Biol. 2019, 2, 1–13. [Google Scholar] [CrossRef] [Green Version]
  53. Toriyama, T.; Shinozawa, A.; Yasumura, Y.; Saruhashi, M.; Hiraide, M.; Ito, S.; Matsuura, H.; Kuwata, K.; Yoshida, M.; Baba, T. Sensor histidine kinases mediate ABA and osmostress signaling in the moss Physcomitrium patens. Curr. Biol. 2022, 32, 164–175. [Google Scholar] [CrossRef]
  54. Li, J.; Zhang, Z.; Vang, S.; Yu, J.; Wong, G.K.S.; Wang, J. Correlation between Ka/Ks and Ks is related to substitution model and evolutionary lineage. J. Mol. Evol. 2009, 68, 414–423. [Google Scholar] [CrossRef]
  55. Chen, L.Y.; Xin, Y.; Wai, C.M.; Liu, J.; Ming, R. The role of cis-elements in the evolution of crassulacean acid metabolism photosynthesis. Hortic Res. 2020, 7, 5. [Google Scholar] [CrossRef] [Green Version]
  56. Guan, L.M.; Zhao, J.; Scandalios, J.G. Cis-elements and trans-factors that regulate expression of the maize Cat1 antioxidant gene in response to ABA and osmotic stress: H2O2 is the likely intermediary signaling molecule for the response. Plant J. 2000, 22, 87–95. [Google Scholar] [CrossRef]
  57. Huang, J.; Chen, F.; Guo, Y.; Gan, X.; Yang, M.; Zeng, W.; Persson, S.; Li, J.; Xu, W. GhMYB7 promotes secondary wall cellulose deposition in cotton fibres by regulating GhCesA gene expression through three distinct cis-elements. New Phytol. 2021, 232, 1718–1737. [Google Scholar] [CrossRef]
  58. Yang, F.; Dong, F.S.; Hu, F.H.; Liu, Y.W.; Chai, J.F.; Zhao, H.; Lv, M.Y.; Zhou, S. Genome-wide identification and expression analysis of the calmodulin-binding transcription activator (CAMTA) gene family in wheat (Triticum aestivum L.). BMC Genet. 2020, 21, 1–10. [Google Scholar] [CrossRef]
  59. Miao, L.L.; Li, Y.Y.; Zhang, H.J.; Zhang, H.J.; Liu, X.L.; Wang, J.Y.; Chang, X.P.; Mao, X.G.; Jing, R.L. TaSnRK2.4 is a vital regulator in control of thousand-kernel weight and response to abiotic stress in wheat. J. Integr. Agric. 2021, 20, 46–54. [Google Scholar] [CrossRef]
  60. Kim, H.; Hwang, H.; Hong, J.W.; Lee, Y.N.; Ahn, I.P.; Yoon, I.S.; Yoo, S.D.; Lee, S.; Lee, S.C.; Kim, B.G. A rice orthologue of the ABA receptor, OsPYL/RCAR5, is a positive regulator of the ABA signal transduction pathway in seed germination and early seedling growth. J. Exp. Bot. 2012, 63, 1013–1024. [Google Scholar] [CrossRef] [Green Version]
  61. Liu, X.; Li, Z.; Hou, Y.; Wang, Y.; Wang, H.; Tong, X.; Ao, H.; Zhang, J. Protein interactomic analysis of SAPKs and ABA-inducible bZIPs revealed key roles of SAPK10 in rice flowering. Int. J. Mol. Sci. 2019, 20, 1427. [Google Scholar] [CrossRef] [PubMed]
Figure 1. Comparative analysis of exons and introns between monocotyledons and dicotyledons. (A) Exon length of SnRK2 genes in nine species. (B) Exon number of SnRK2 genes in nine species.
Ijms 24 01000 g001
Figure 2. Unrooted phylogenetic tree representing the relationships among 8 StSnRK2 proteins from Solanum tuberosum and 114 SnRK2 proteins from three monocots and five dicots. The phylogenetic trees were constructed using the neighbor-joining (NJ) method in MEGA7.0, and the default parameter value was set to 1000.
Ijms 24 01000 g002
Figure 3. The relationship between chromosomes of StSnRK2 from potato was determined using multiple collinear scanning toolkits (MCScanX) was visualized using TBtools v1.098669. Gray lines represent the collinear blocks within the potato genome, whereas the red lines highlight the syntenic SnRK2 gene pairs. The height and position of the blue wave peak represent the number and distribution of genes on each chromosome, respectively.
Ijms 24 01000 g003
Figure 4. Synteny analysis among 122 SnRK2 genes. The synteny relationship between each pair of SnRK2 genes was detected using linear regression. Lines of different colors represent the similarity of sequences: red, > 95%; 75% = blue ≤ 95%; green, < 75%.
Ijms 24 01000 g004
Figure 5. Analysis of synteny relationships. (A,C) Dot plots representations of the intergenomic comparison relationships between potato and other species. The dots represent synteny genes, and the abscissa and ordinate represent the number of chromosomes of different species. (B,D) Synteny analysis between potato and other species of the SnRK2 gene family. Two species (Arabidopsis and rice) were compared with potato SnRK2 genes. Gray lines represent the collinear blocks within the genomes, whereas the red lines highlight the syntenic SnRK2 gene pairs.
Ijms 24 01000 g005
Figure 6. Predictive analysis of StSnRK2 gene promoter sequences. (A) The types and numbers of cis elements of StSnRK2 gene promoter sequences were analyzed by PlantCARE software. (B) Prediction of upstream regulatory proteins of the StSnRK2 gene. Different words represent different protein families. The word size represents the predicted frequency of the family of proteins.
Ijms 24 01000 g006
Figure 7. The relative expression level of StSnRK2 genes under 50 µM ABA stress treatments. Data represent the means ± SD of three replicates, and different letters indicate significant differences at p < 0.05. (AH) StSnRK2.1StSnRK2.8, respectively.
Ijms 24 01000 g007
Figure 8. Relative expression level of StSnRK2 genes under 5% PEG stress treatments. Data represent the means ± SD of three replicates, and different letters indicate significant differences at p < 0.05. (AH) StSnRK2.1–StSnRK2.8, respectively.
Ijms 24 01000 g008
Figure 9. Relative expression level of StSnRK2 genes under different concentrations of PEG stress treatments. Data represent the means ± SD of three replicates, and different letters indicate significant differences at p < 0.05. (AH) StSnRK2.1StSnRK2.8, respectively.
Ijms 24 01000 g009
Figure 10. Determination of stress-related physiological indices under different concentrations of PEG stress treatments. Data represent the means ± SD of three replicates, and different letters indicate significant differences at p < 0.05. (AE) Proline content, MDA content, chlorophyll content, SOD activity and CAT activity, respectively.
Ijms 24 01000 g010
Figure 11. Relative expression level of StSnRK2 genes in different drought-resistant potato cultivars (‘LS3’, drought-tolerant; ‘Atl’, drought-sensitive) under water deficit conditions. Data represent the means ± SD of three replicates, and different letters indicate significant differences at p < 0.05. (AH) StSnRK2.1–StSnRK2.8, respectively.
Ijms 24 01000 g011
Figure 12. Functional identification of StSnRK2 genes in transgenic tobacco. (A) Growth phenotypes of StSnRK2 transgenic plants and control plants under drought stress. (BE) Determination of proline content, ion leakage, soluble sugar and bound water content in transgenic plants and control plants under drought stress. (FI) The expression levels of NtCBL3, NtERD10A, NtERD10B and NtERD10C genes in transgenic plants and wild-type plants under drought stress. Different letters indicate significant difference at p < 0.05.
Ijms 24 01000 g012
Table 1. Evolutional selection pressure between monocots and monocots, monocots and dicots and dicots and dicots.
PatternSpecies 1Species 2Nonsynonymous Substitution Rate (Ka)Synonymous Substitution Rate (Ks)Selection Strength (Ka/Ks)Evolution RelationshipDivergence Time (Mya)
Monocots and monocotsOryza sativaZea mays0.05260.66230.0798Purifying selection22.0782
Hordeum vulgareZea mays0.06700.66020.1006Purifying selection22.0071
Hordeum vulgareOryza sativa0.06870.66010.0988Purifying selection22.0039
Monocots and dicotsCamellia sinensisOryza sativa0.10862.74960.0396Purifying selection91.6526
Camellia sinensisHordeum vulgare0.10962.24130.0489Purifying selection74.7091
Camellia sinensisZea mays0.14683.19250.0481Purifying selection106.4167
Glycine maxOryza sativa0.17833.03970.0588Purifying selection101.3221
Glycine maxHordeum vulgare0.13922.75270.0505Purifying selection91.7571
Glycine maxZea mays0.14192.34200.0607Purifying selection78.0659
Vitis viniferaHordeum vulgare0.15932.55840.0622Purifying selection85.2823
Vitis viniferaZea mays0.12926.76590.0190Purifying selection225.5309
Dicots and dicotsArabidopsis thalianaBrassica napus0.05020.50860.0992Purifying selection16.9549
Arabidopsis thalianaGlycine max0.11211.92770.0646Purifying selection64.2576
Arabidopsis thalianaVitis vinifera0.12681.34270.0944Purifying selection44.7592
Arabidopsis thalianaSolanum tuberosum0.12681.72120.1455Purifying selection57.3766
Arabidopsis thalianaCamellia sinensis0.11602.54580.0492Purifying selection84.8618
Brassica napusGlycine max0.11911.76330.0682Purifying selection58.7779
Brassica napusCamellia sinensis0.16941.48680.1192Purifying selection49.5612
Brassica napusSolanum tuberosum0.18242.45390.0750Purifying selection81.7989
Brassica napusVitis vinifera0.13461.99960.0674Purifying selection66.6560
Camellia sinensisGlycine max0.10281.43460.0762Purifying selection47.8206
Camellia sinensisSolanum tuberosum0.08852.08270.0428Purifying selection69.4264
Camellia sinensisVitis vinifera0.08851.02030.0979Purifying selection34.0108
Glycine maxSolanum tuberosum0.12541.61820.0885Purifying selection53.9403
Glycine maxVitis vinifera0.08931.27010.0722Purifying selection42.3375
Solanum tuberosumVitis vinifera0.13271.46900.0981Purifying selection48.9677
Table 2. Analysis of the codon usage index in nine species.
SpeciesT3sC3sA3sG3sGC3sCAICBIFOPNc
Arabidopsis thaliana0.373 ± 0.0960.245 ± 0.0280.359 ± 0.0430.301 ± 0.0710.416 ± 0.0680.177 ± 0.041−0.069 ± 0.0590.374 ± 0.03852.902 ± 3.802
Brassica napus0.407 ± 0.0370.277 ± 0.0280.317 ± 0.0430.297 ± 0.0360.429 ± 0.0400.223 ± 0.021−0.006 ± 0.0500.418 ± 0.03053.141 ± 2.886
Camellia sinensis0.395 ± 0.0320.256 ± 0.0390.350 ± 0.0480.288 ± 0.0330.409 ± 0.0500.196 ± 0.016−0.070 ± 0.0690.377 ± 0.03955.359 ± 2.575
Glycine max0.434 ± 0.0250.220 ± 0.0230.341 ± 0.0390.304 ± 0.0360.386 ± 0.0320.187 ± 0.016−0.116 ± 0.0400.351 ± 0.02552.645 ± 2.653
Hordeum vulgare0.229 ± 0.0760.292 ± 0.0690.284 ± 0.0540.367 ± 0.0670.556 ± 0.0810.142 ± 0.042−0.063 ± 0.0510.384 ± 0.02954.339 ± 4.296
Oryza sativa0.276 ± 0.0660.303 ± 0.0920.317 ± 0.1000.316 ± 0.0970.502 ± 0.1210.168 ± 0.056−0.011 ± 0.0860.406 ± 0.05153.879 ± 2.220
Solanum tuberosum0.382 ± 0.0360.247 ± 0.0190.415 ± 0.0400.241 ± 0.0770.372 ± 0.0450.172 ± 0.020−0.106 ± 0.0310.362 ± 0.01851.548 ± 1.442
Vitis vinifera0.398 ± 0.0280.231 ± 0.0260.348 ± 0.0310.320 ± 0.0400.408 ± 0.0430.176 ± 0.018−0.137 ± 0.0630.338 ± 0.03855.103 ± 3.300
Zea mays0.318 ± 0.0850.297 ± 0.1080.354 ± 0.1150.277 ± 0.1280.452 ± 0.1620.178 ± 0.043−0.042 ± 0.0820.393 ± 0.04652.848 ± 5.337
Table 3. Correlation analysis of codon usage indices in monocots.
T3sC3sA3sG3sGC3s
CAI0.2666 *0.4727 *−0.5666 *0.20970.3364 *
CBI−0.14420.6568 *−0.4286 *0.20970.5018 *
FOP−0.05980.6568 *−0.3592 *0.05430.4095 *
Nc−0.4185 *0.4242 *−0.3592 *0.0543 *0.4840 *
* indicate significant difference at p < 0.05.
Table 4. Correlation analysis of codon usage indices in dicots.
T3sC3sA3sG3sGC3s
CAI−0.01190.8613 *−0.5995 *0.4265 *0.4933 *
CBI−0.4263 *0.8336 *−0.7127 *0.5654 *0.6814 *
FOP−0.4431 *0.8667 *−0.7600 *0.6128 *0.6814 *
Nc0.5374 *−0.3702 *0.32750.6128 *0.6814 *
* indicate significant difference at p < 0.05.
Disclaimer/Publisher’s Note: The statements, opinions and data contained in all publications are solely those of the individual author(s) and contributor(s) and not of MDPI and/or the editor(s). MDPI and/or the editor(s) disclaim responsibility for any injury to people or property resulting from any ideas, methods, instructions or products referred to in the content.

