
Modeling of the Progressive Degradation of the Nigrostriatal Dopaminergic System in Mice to Study the Mechanisms of Neurodegeneration and Neuroplasticity in Parkinson’s Disease

Abstract
:1. Introduction
2. Results
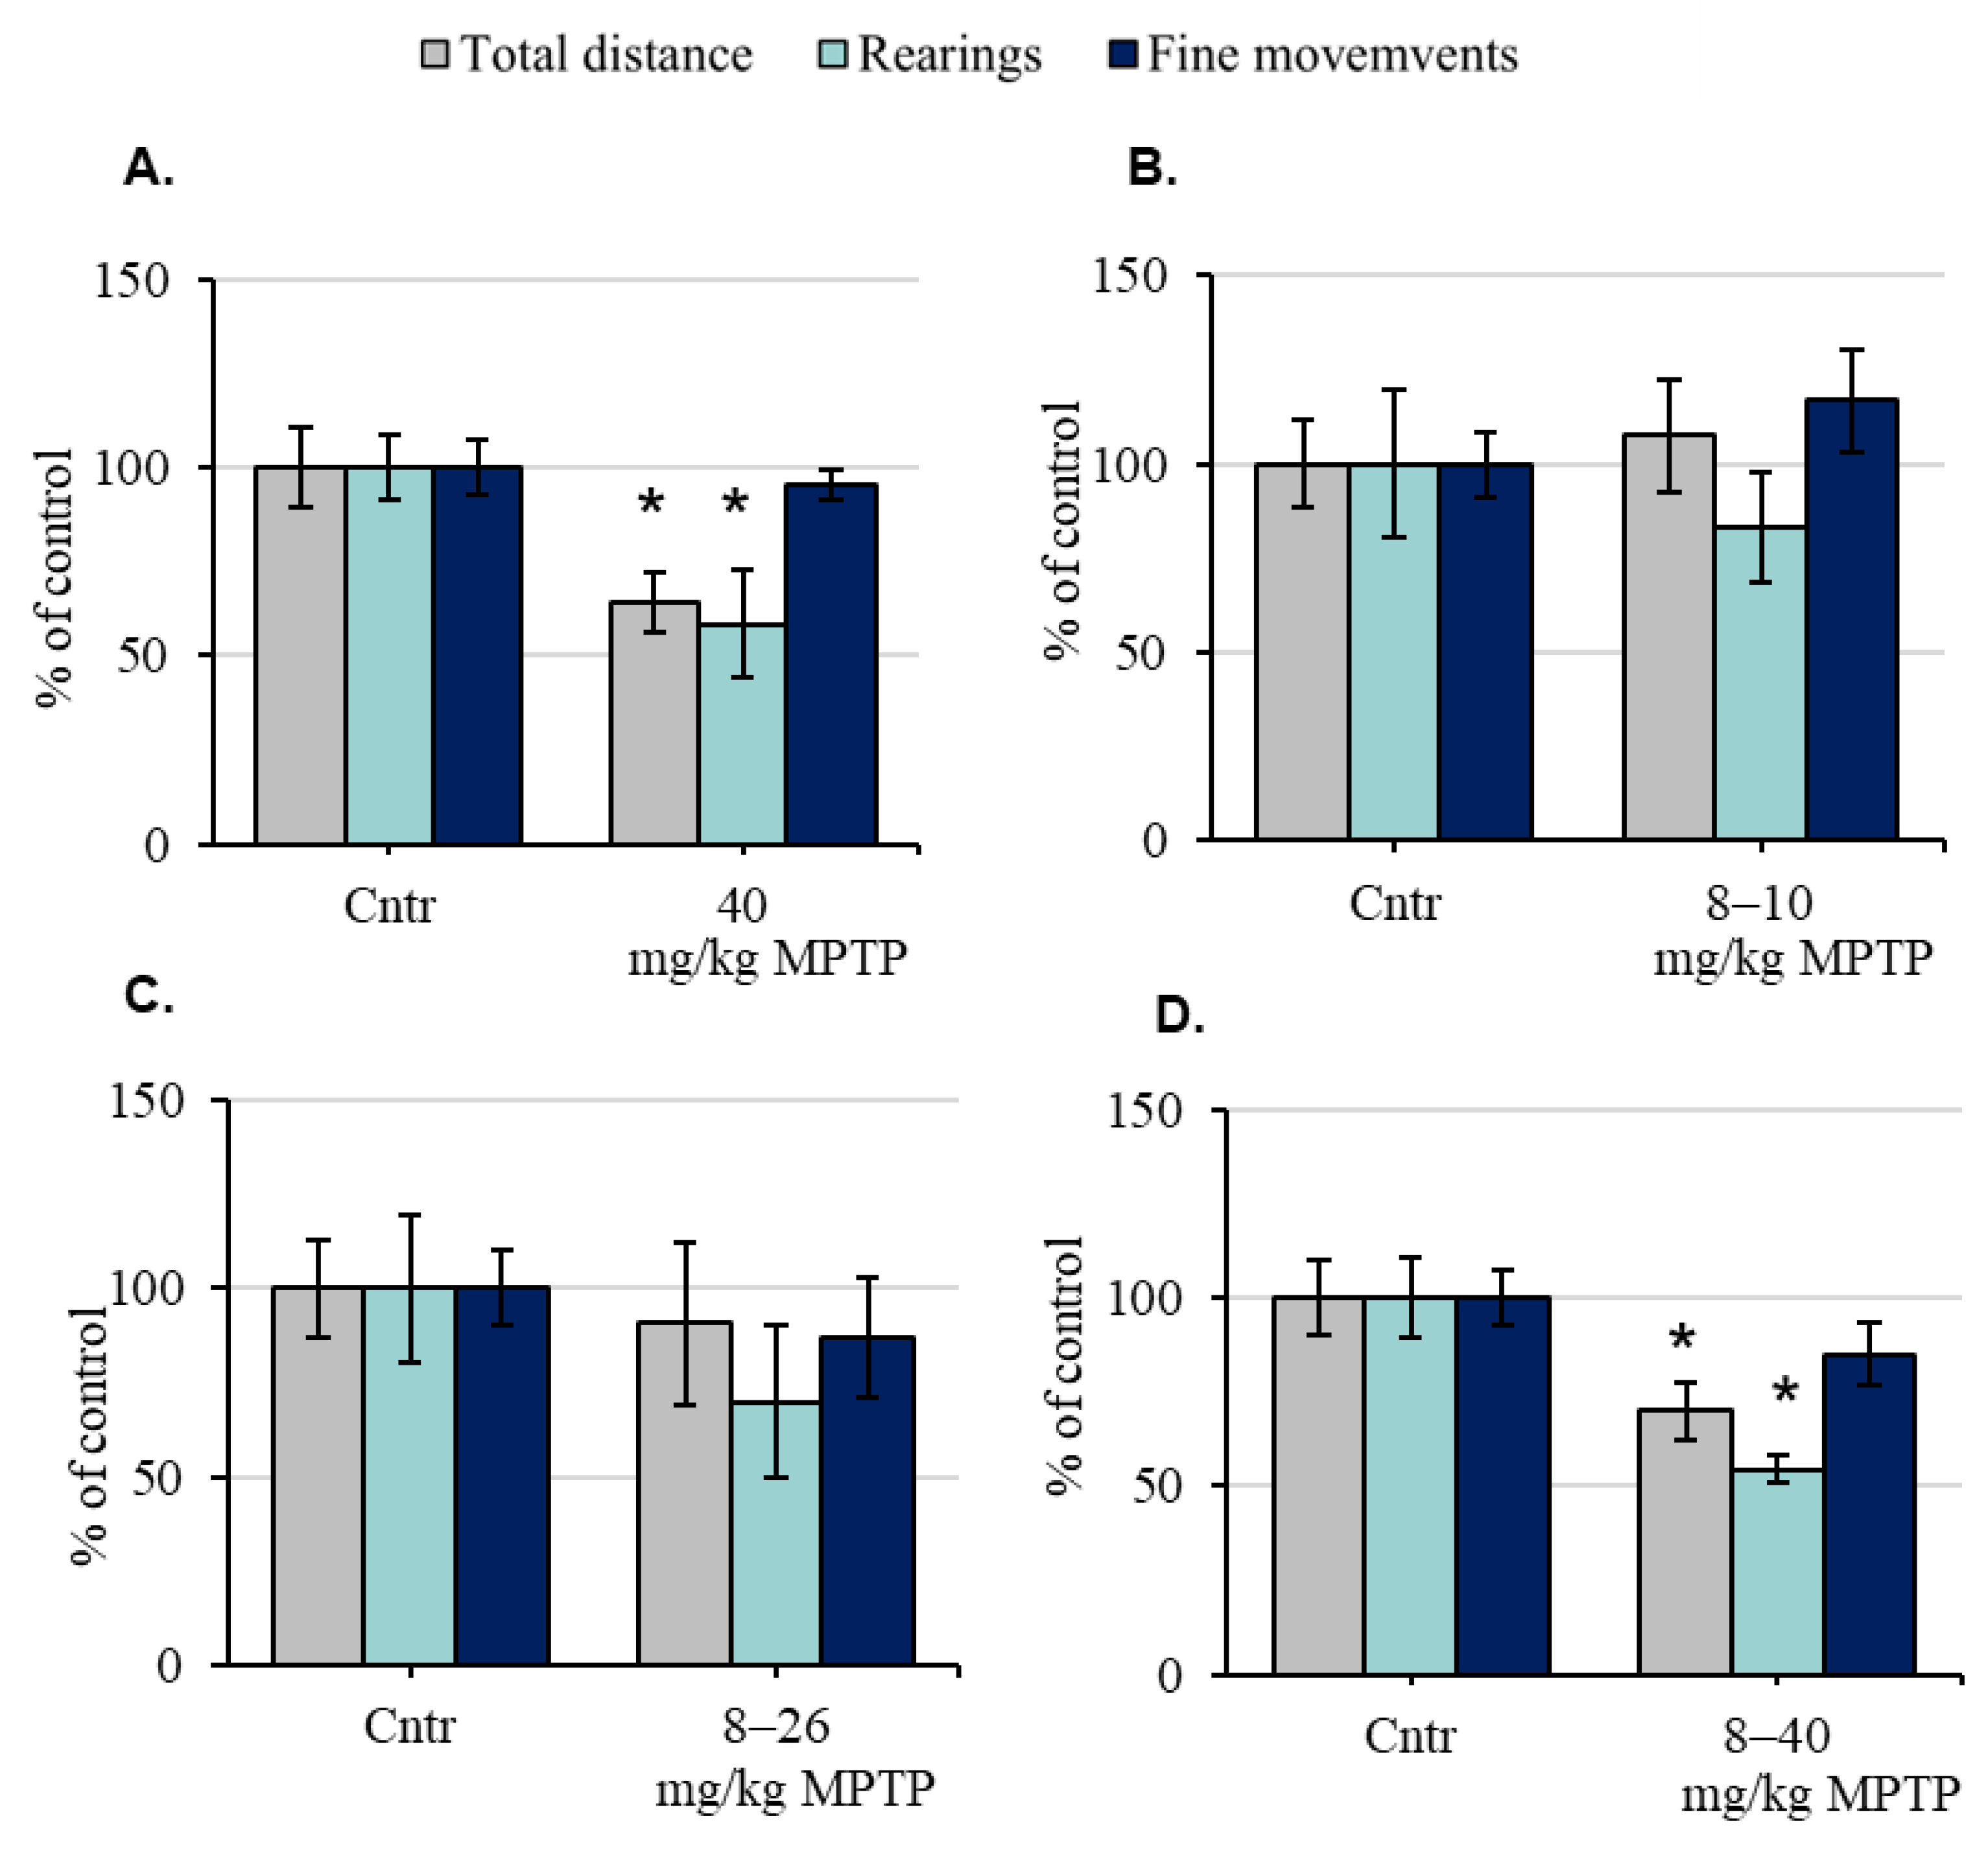
2.1. The Motor Behavior of Mice before and after the Administration of 1-Methyl-4-phenyl-1,2,3,6-tetrahydropyridine
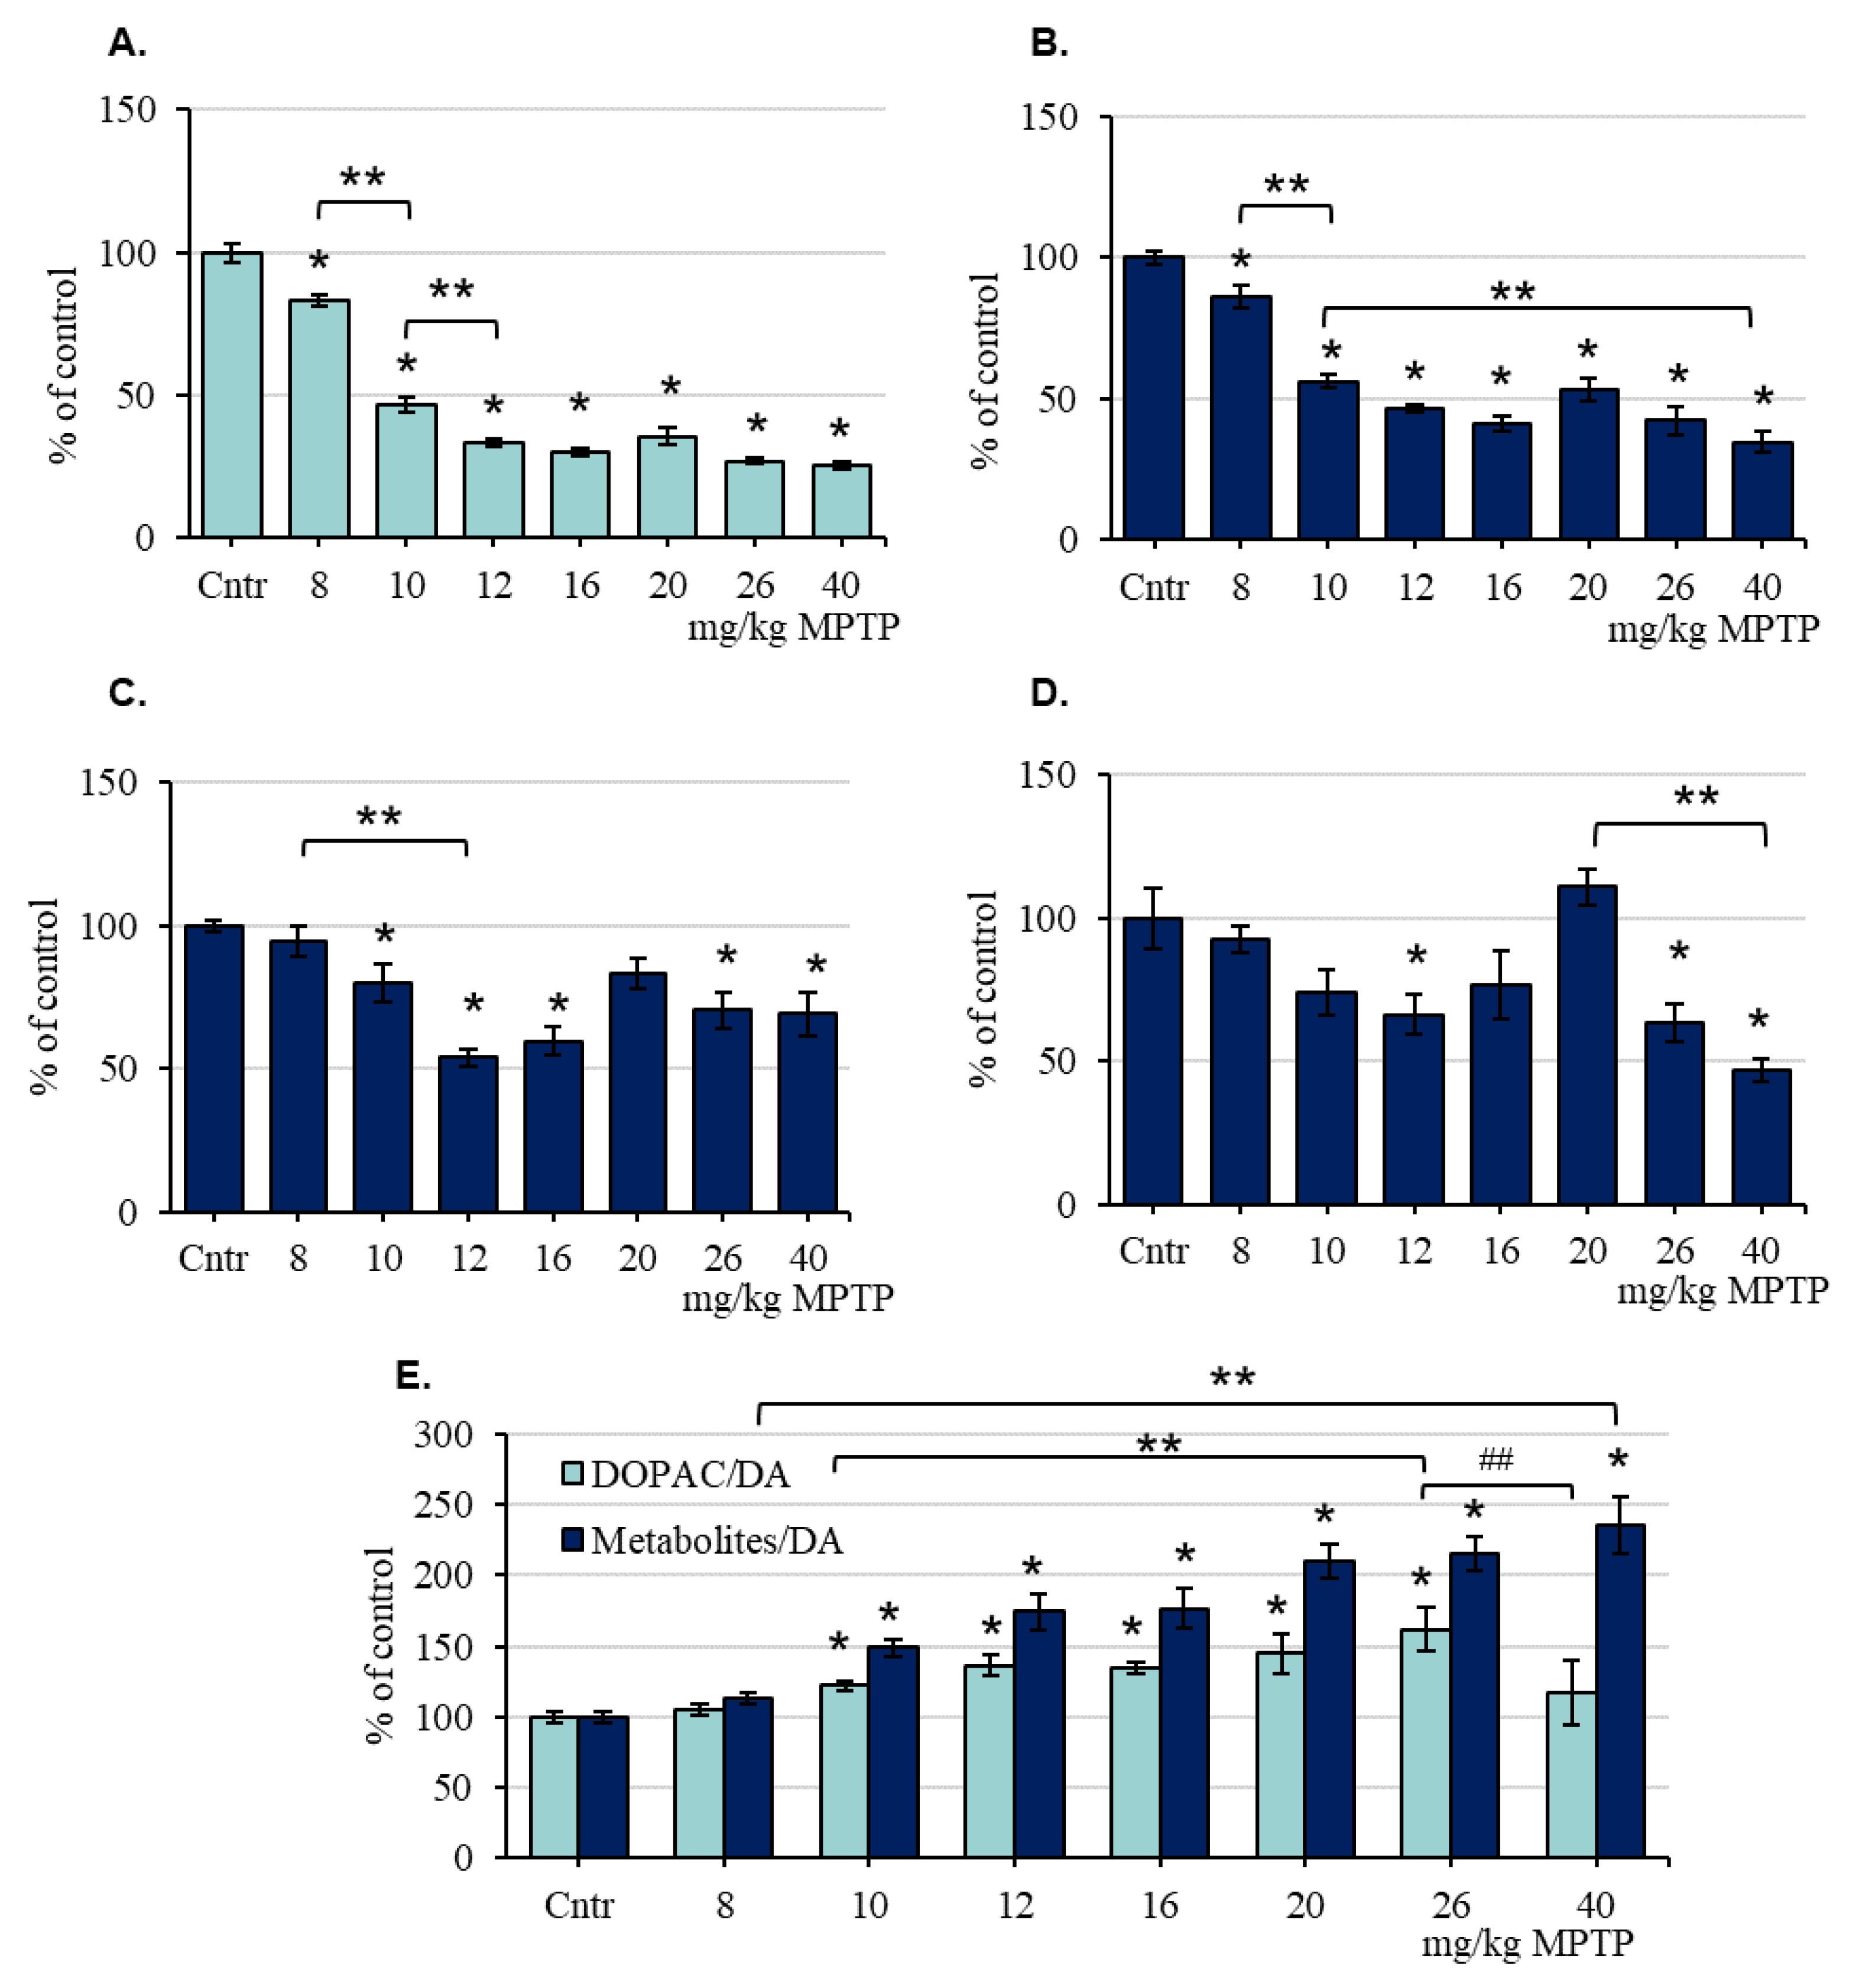
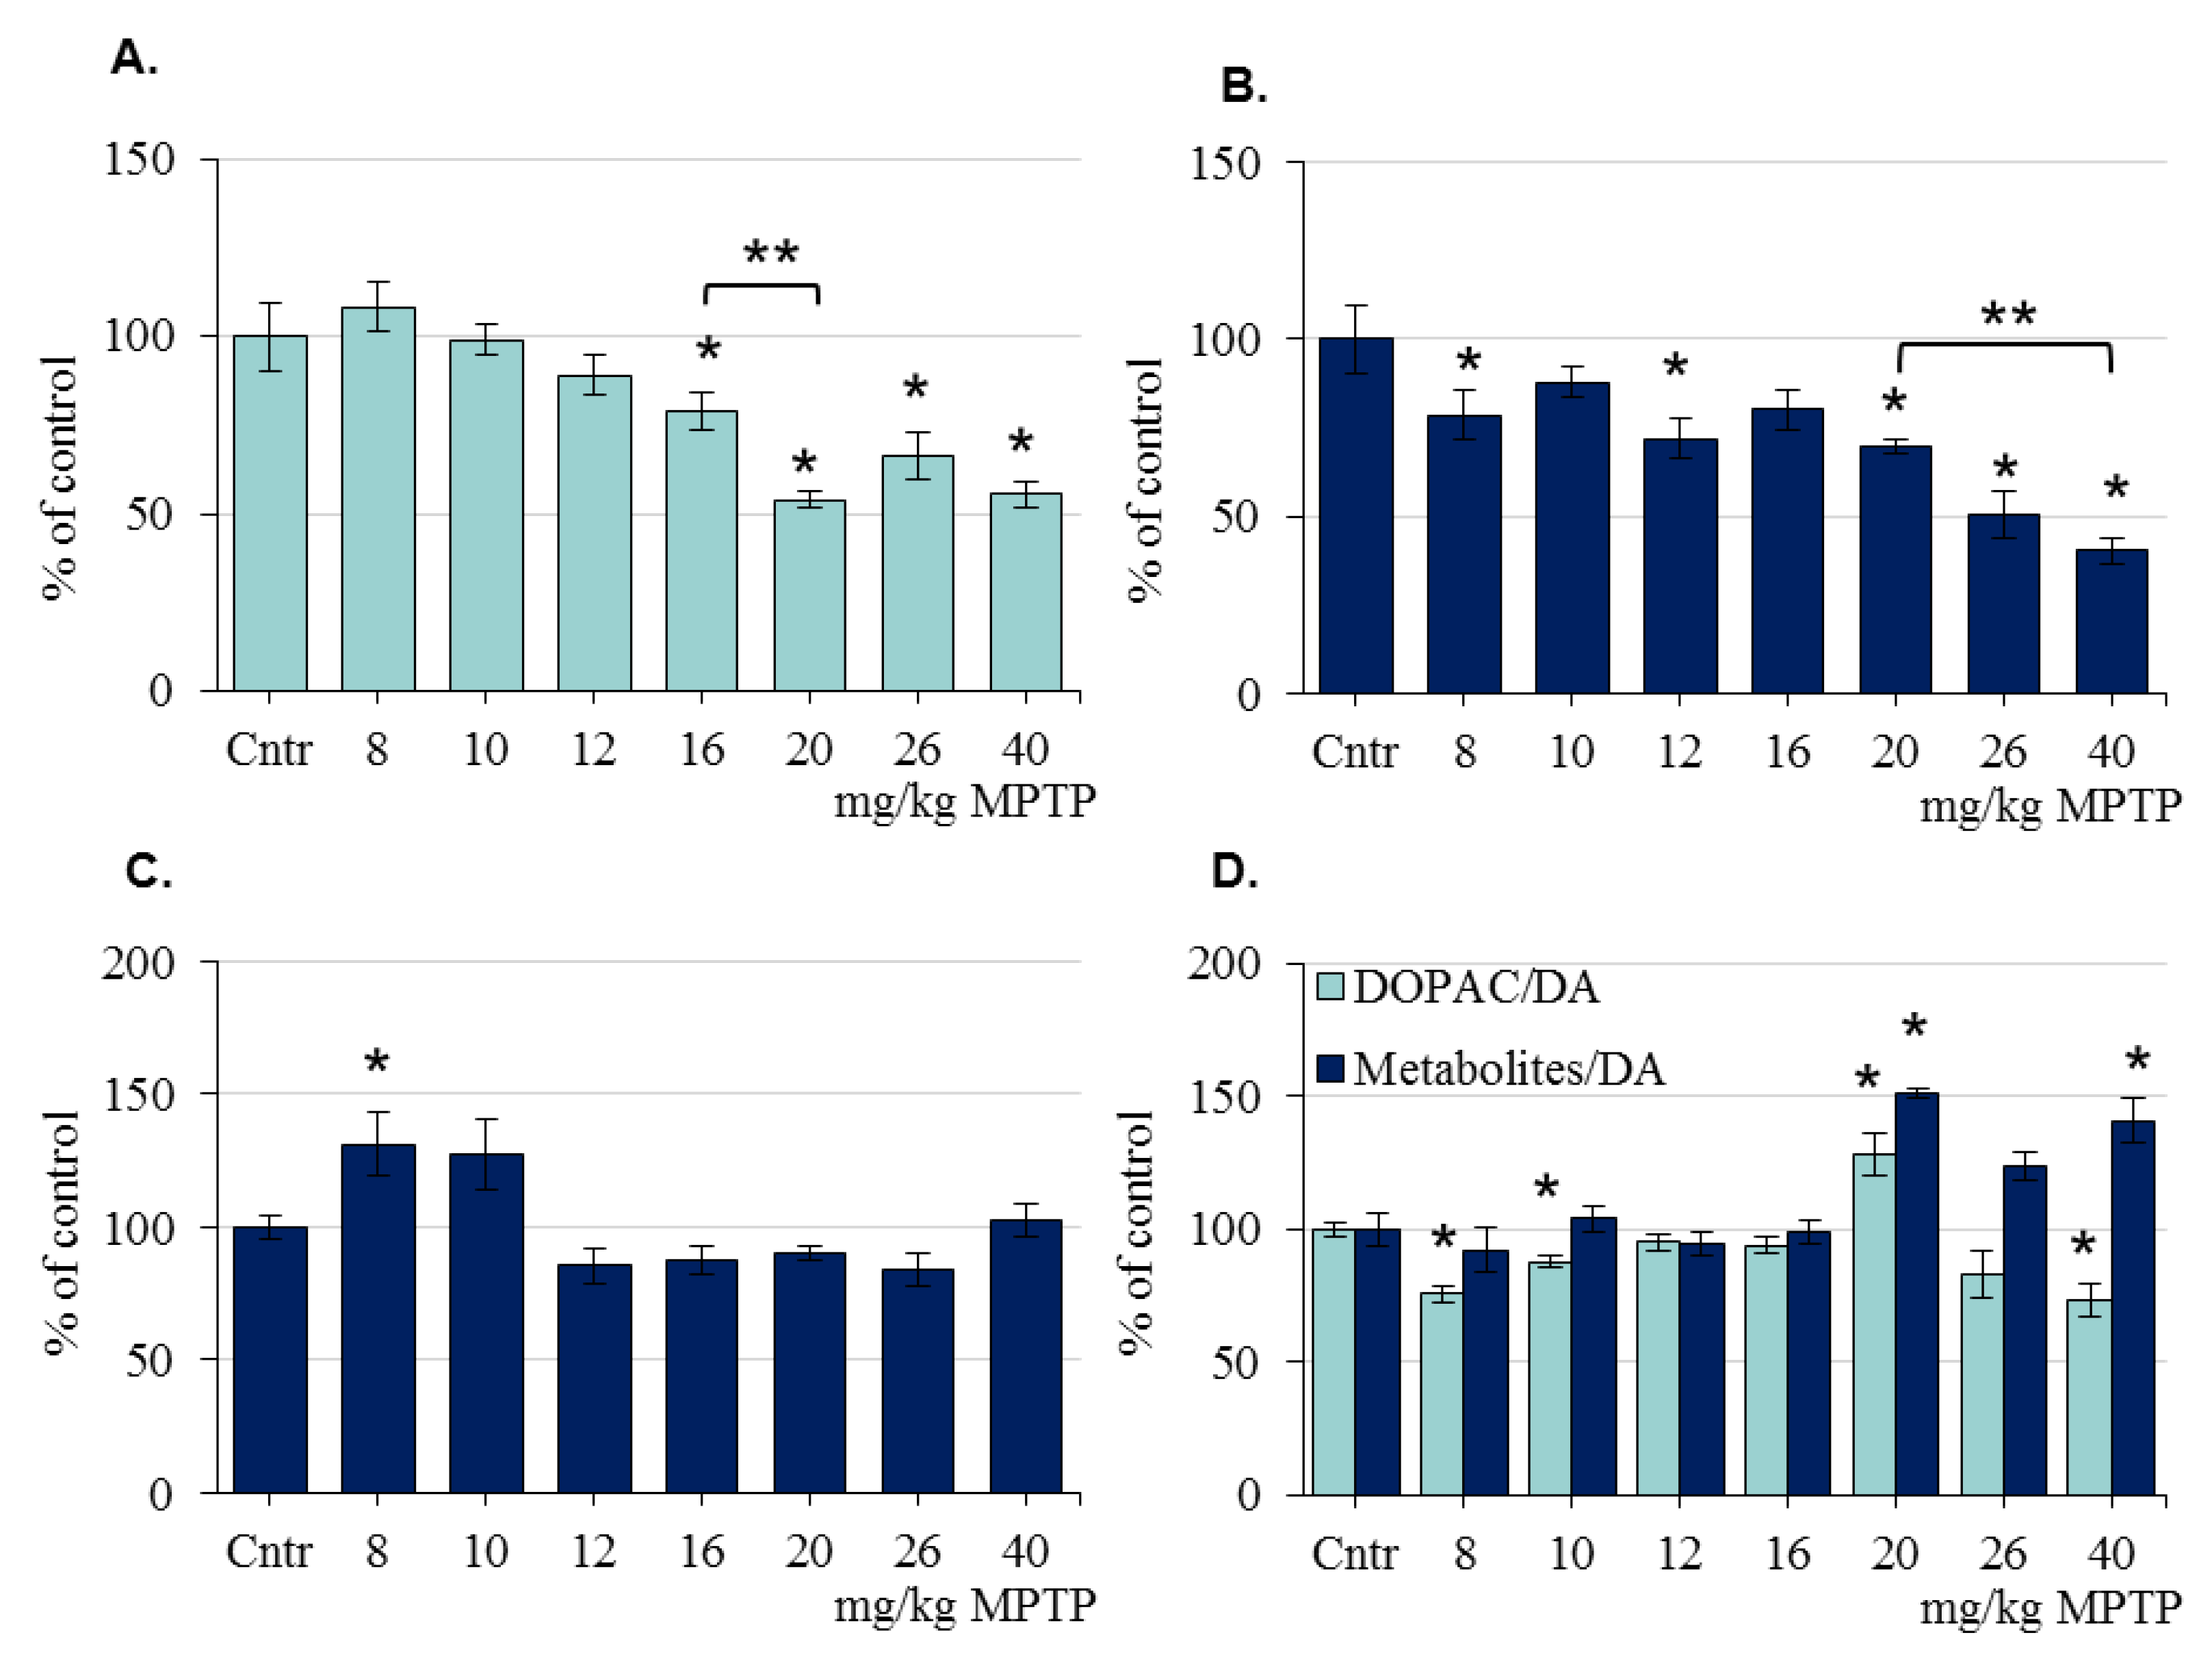
2.2. The Concentration of Dopamine and Its Metabolites in the Striatum of Mice after the Administration of 1-Methyl-4-phenyl-1,2,3,6-tetrahydropyridine
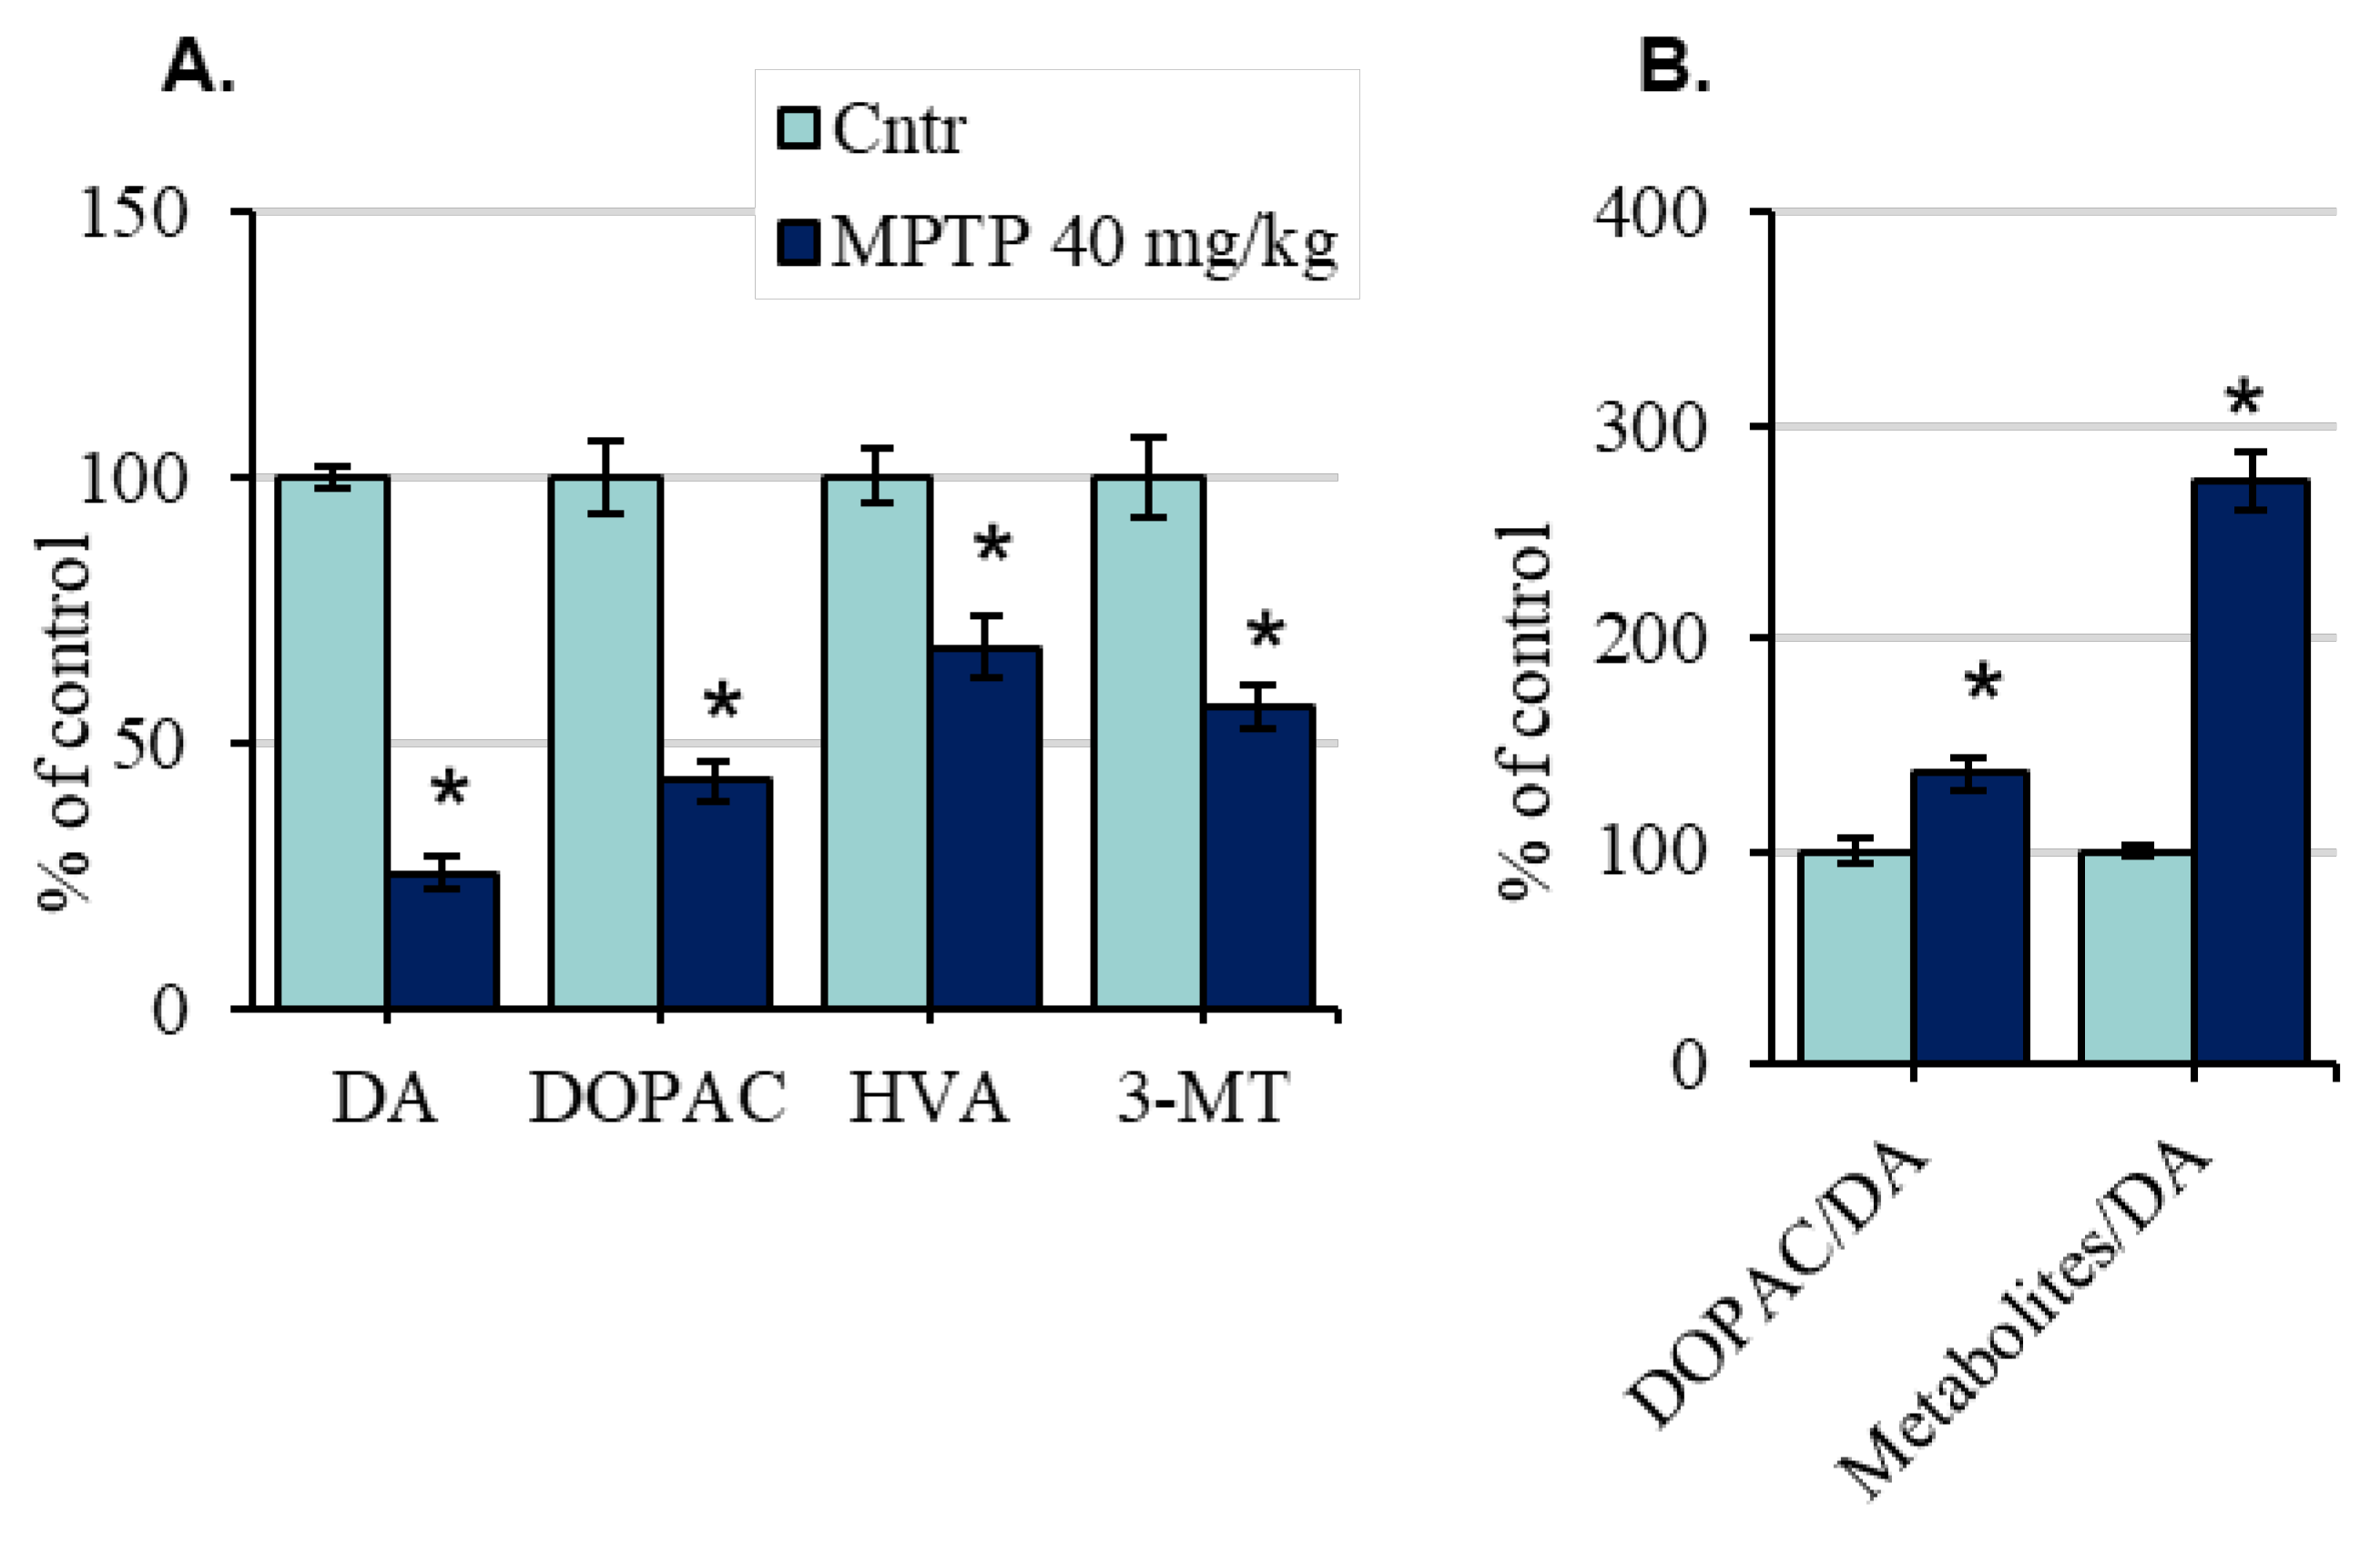
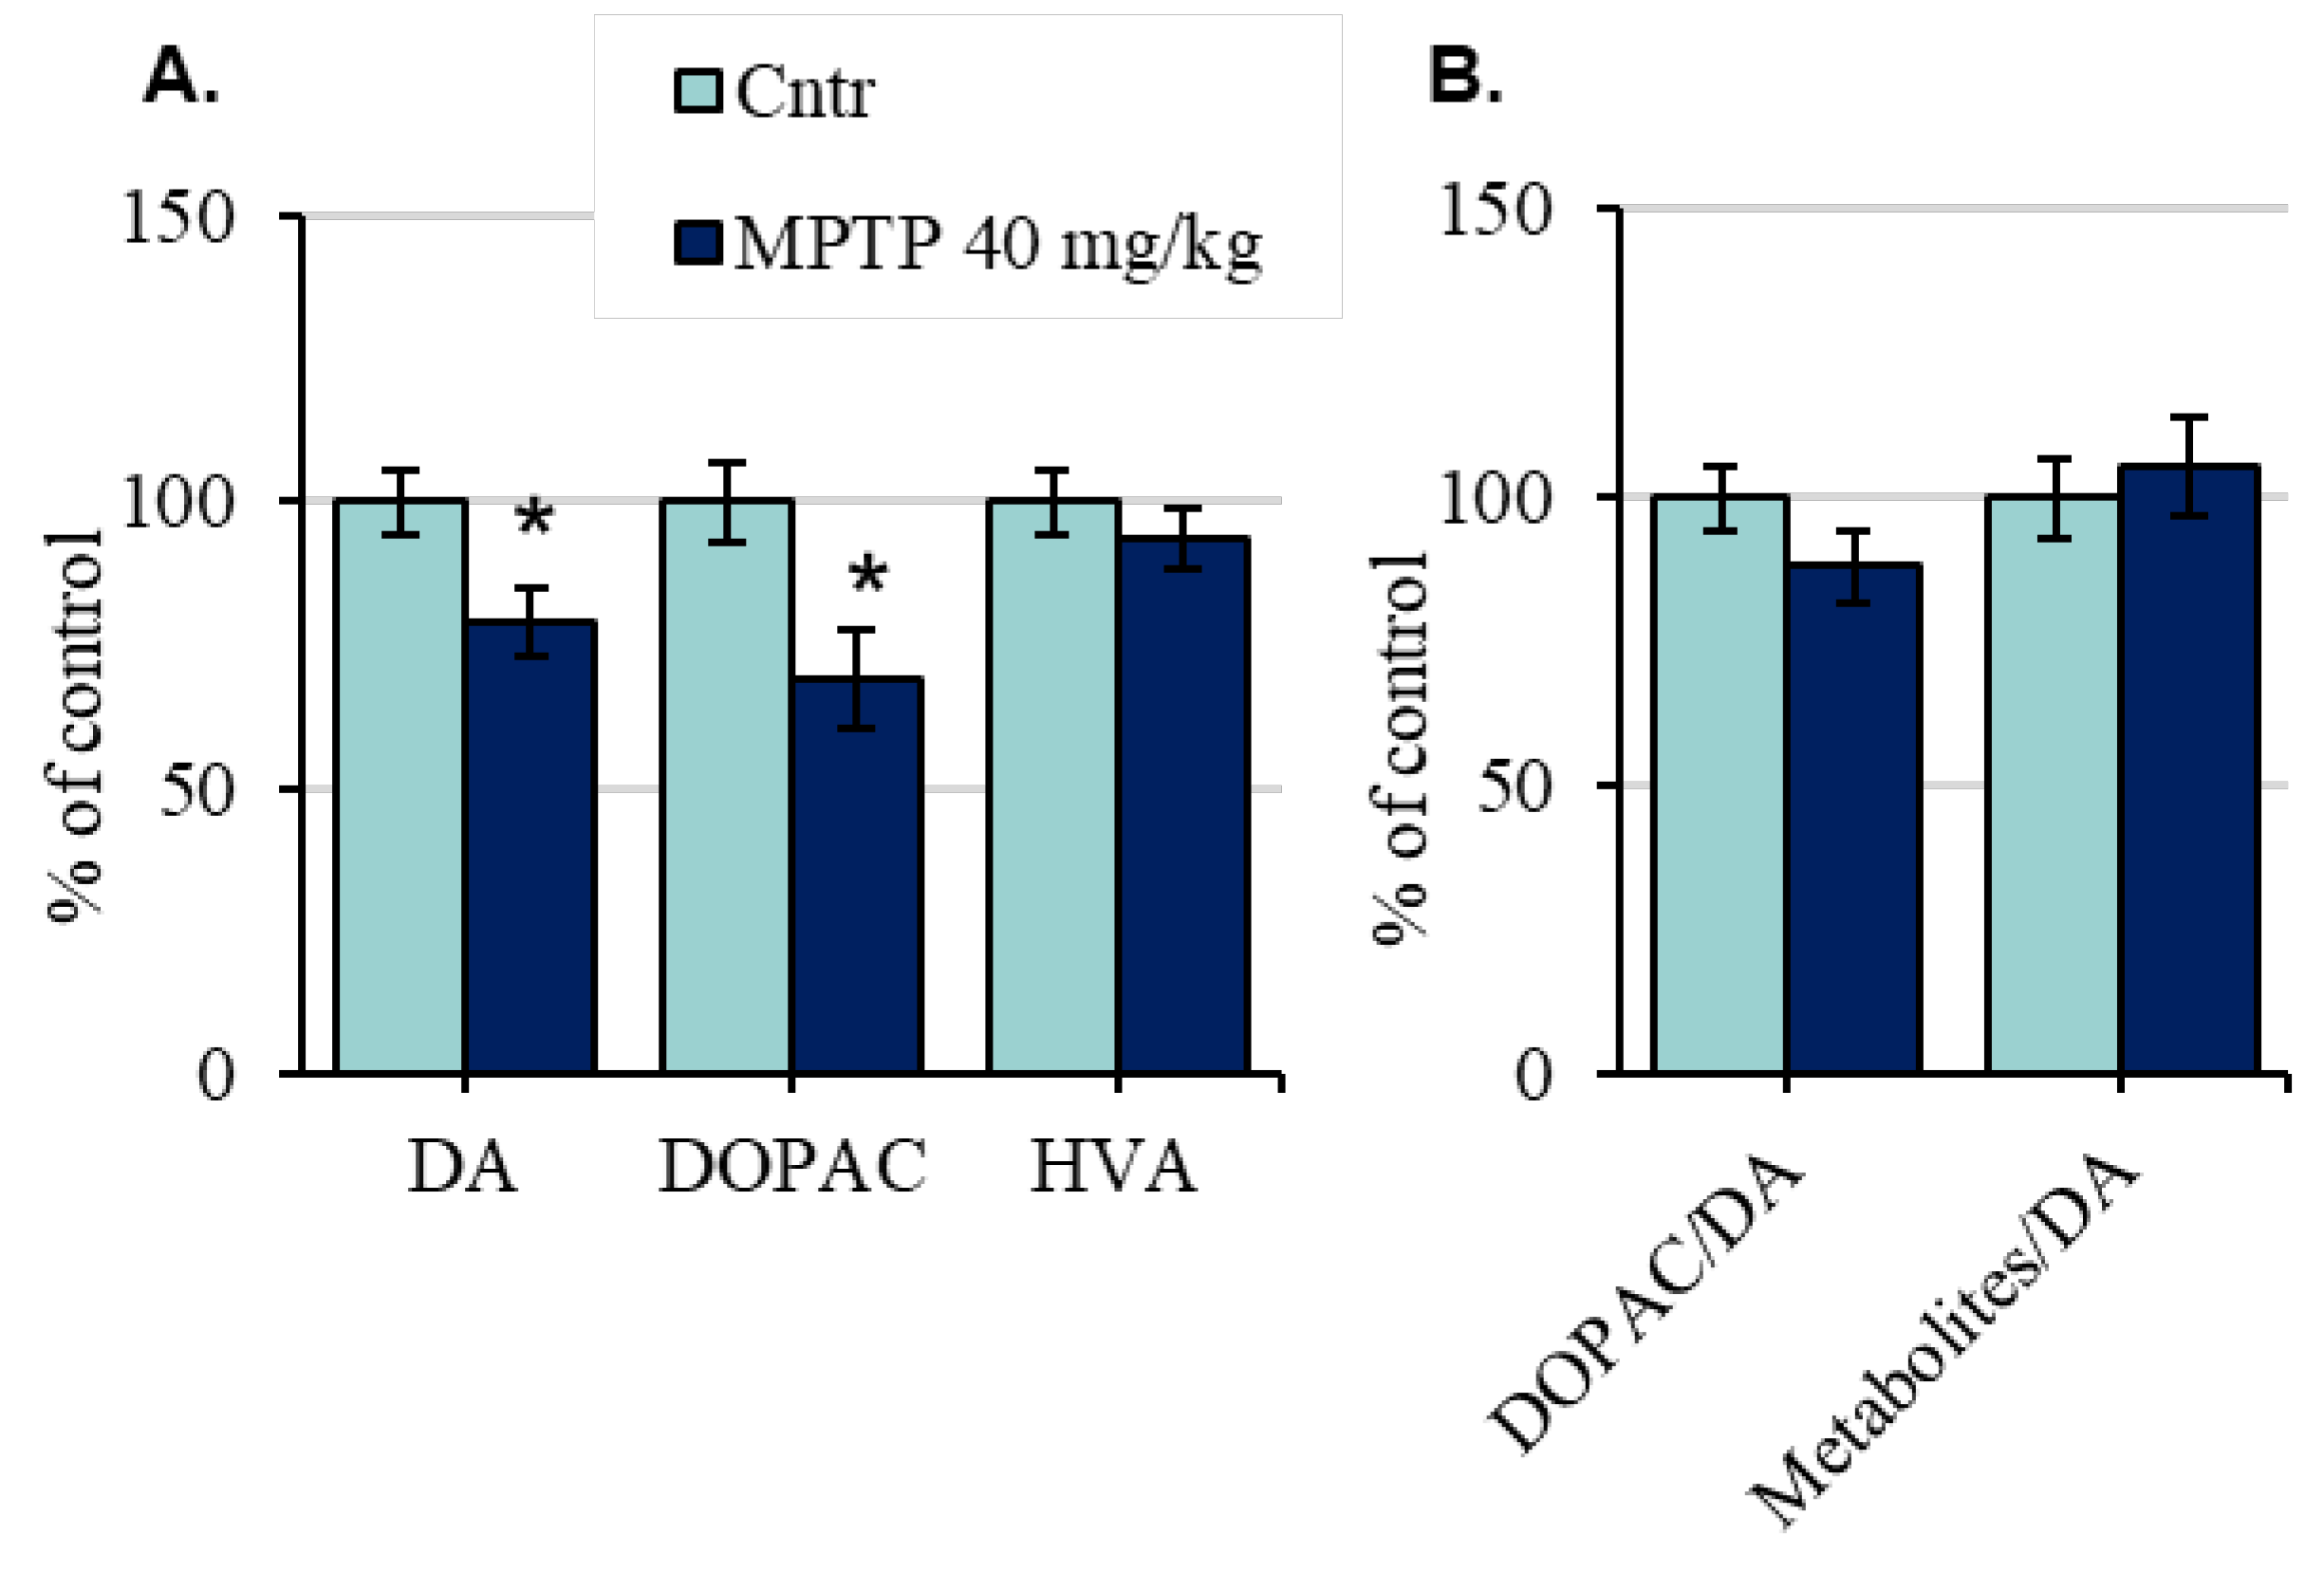
2.3. The Content of Dopamine and Its Metabolites in the Substantia Nigra of Mice after the Administration of 1-Methyl-4-phenyl-1,2,3,6-tetrahydropyridine
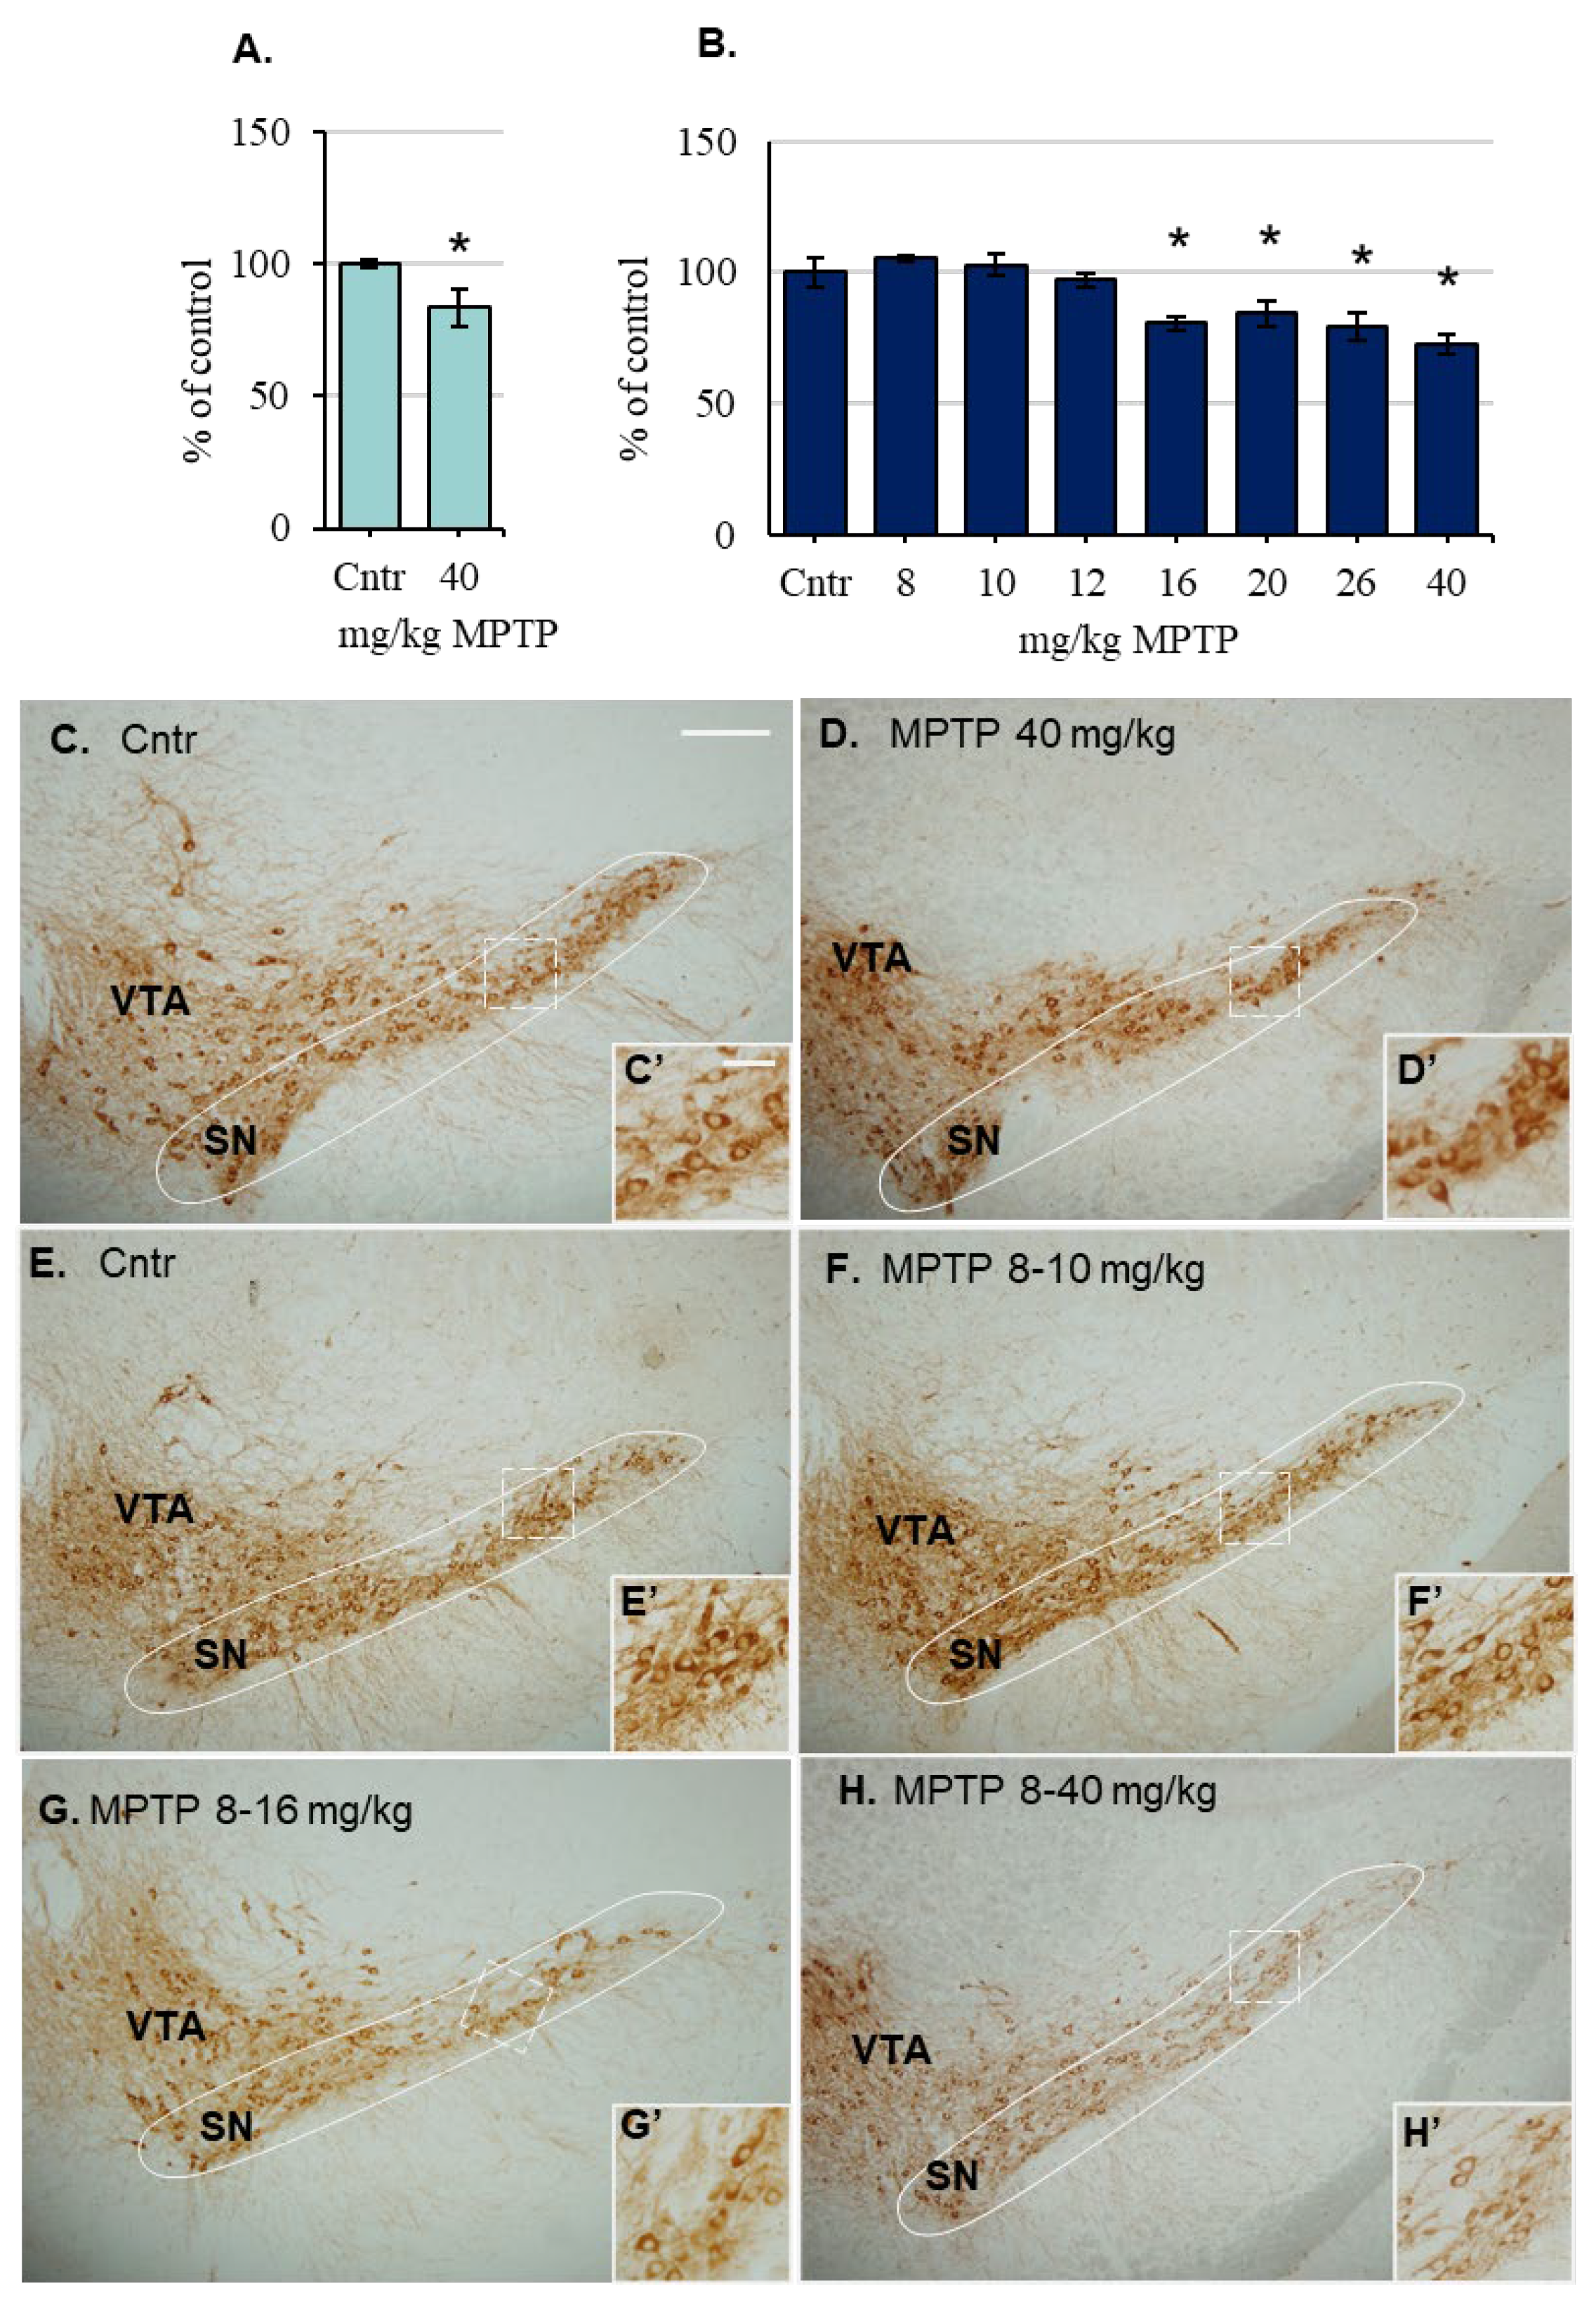
2.4. The Content of Tyrosine Hydroxylase (TH)-Immunopositive Neurons in the Substantia Nigra of Mice after the Administration of 1-Methyl-4-phenyl-1,2,3,6-tetrahydropyridine
3. Discussion
4. Materials and Methods
4.1. Animals
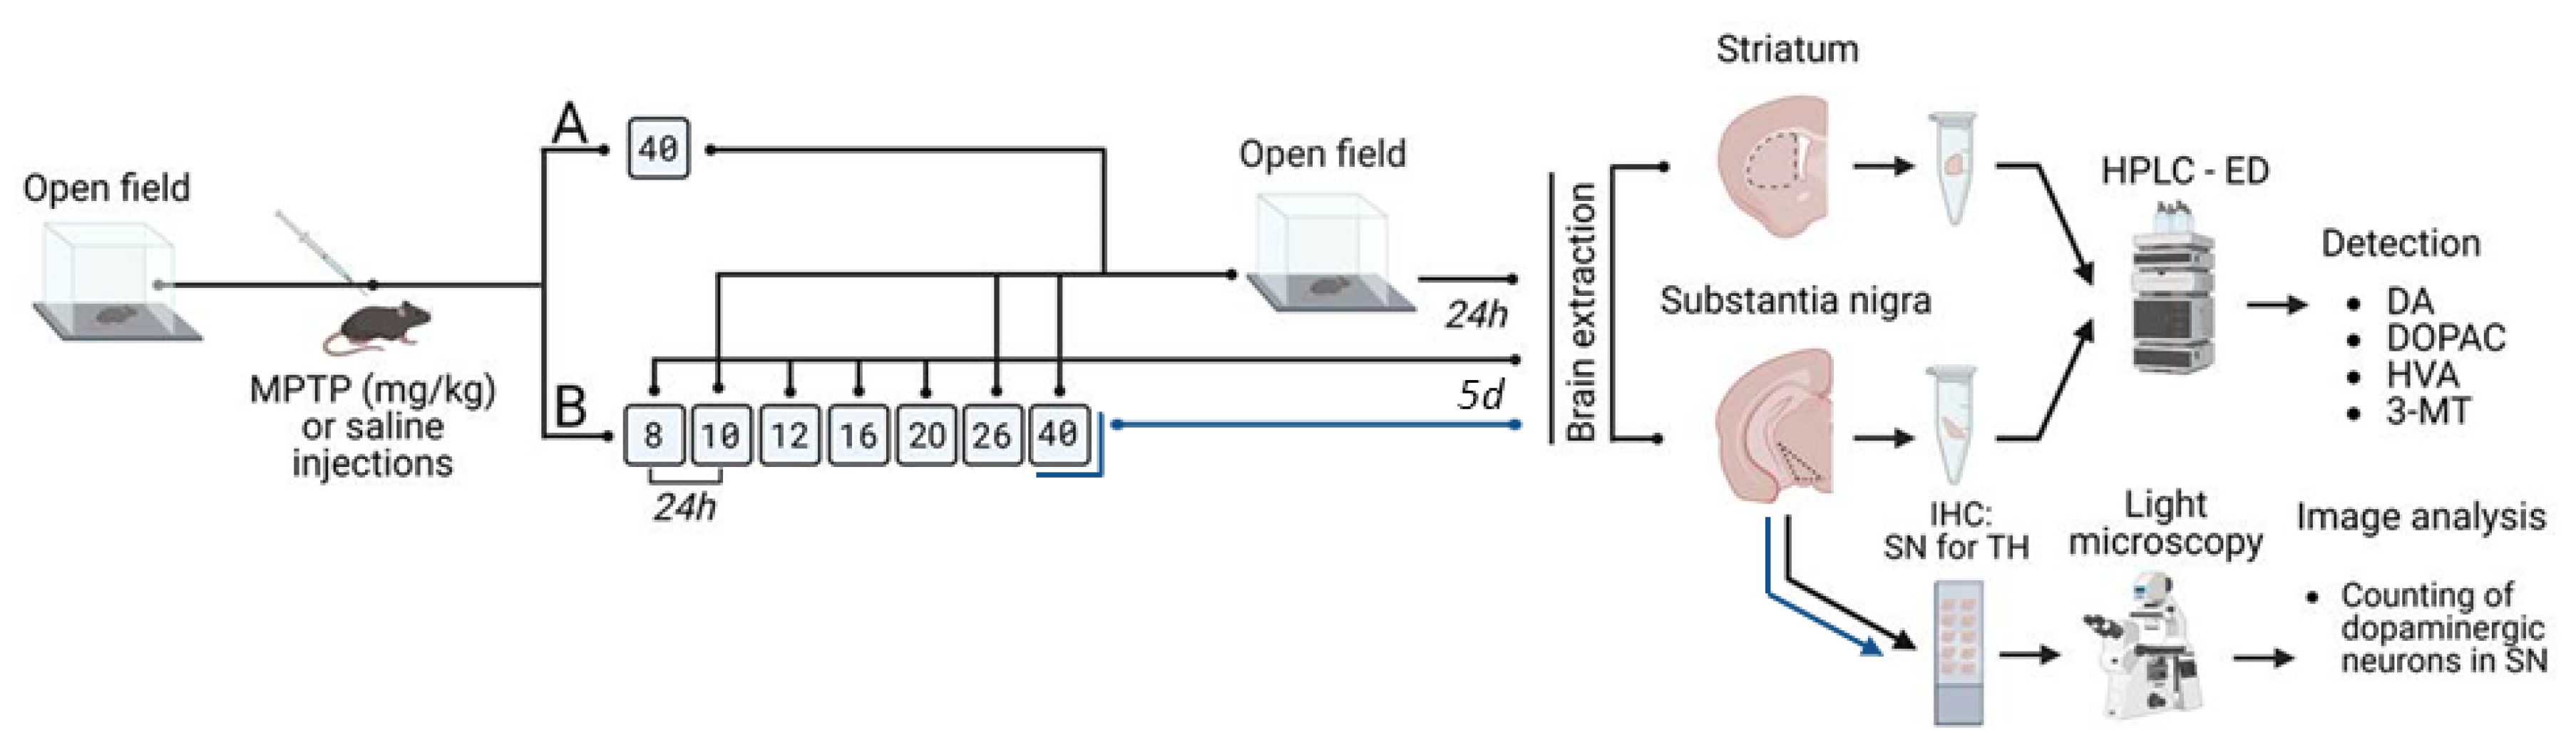
4.2. Experiments
4.3. Sample Preparation for Analysis
4.4. Methods
4.4.1. High Performance Liquid Chromatography with Electrochemical Detection
4.4.2. Immunohistochemistry
4.4.3. Microscopy and Image Analysis
4.4.4. Statistical Analysis
5. Conclusions
Supplementary Materials
Author Contributions
Funding
Institutional Review Board Statement
Informed Consent Statement
Data Availability Statement
Acknowledgments
Conflicts of Interest
Abbreviations
| 3-MT | 3-methoxytyramine |
| AADC | aromatic L-amino acid decarboxylase |
| DA | dopamine |
| DAT | dopamine transporter |
| DOPAC | 3,4-dihydroxyphenylacetic acid |
| HVA | homovanillic acid |
| MPP+ | 1-methyl-4-phenylpyridinium |
| MPTP | 1-methyl-4-phenyl-1,2,3,6-tetrahydropyridine |
| PBS | phosphate-buffered saline |
| PD | Parkinson’s disease |
| SN | substantia nigra |
| TH | tyrosine hydroxylase |
References
- Kalia, L.V.; Lang, A.E. Parkinson’s disease. Lancet 2015, 386, 896–912. [Google Scholar] [CrossRef] [PubMed]
- Ugrumov, M.V. Development of early diagnosis of Parkinson’s disease: Illusion or reality? CNS Neurosci. Ther. 2020, 26, 997–1009. [Google Scholar] [CrossRef] [PubMed]
- Beitz, J.M. Parkinson’s disease: A review. Front. Biosci. Sch. Ed. 2014, 6, 65–74. [Google Scholar] [CrossRef] [PubMed]
- Bernheimer, H.; Birkmayer, W.; Hornykiewicz, O.; Jellinger, K.; Seitelberger, F. Brain dopamine and the syndromes of Parkinson and Huntington. Clinical, morphological and neurochemical correlations. J. Neurol. Sci. 1973, 20, 415–455. [Google Scholar] [CrossRef] [PubMed]
- Scherman, D.; Desnos, C.; Darchen, F.; Pollak, P.; Javoy-Agid, F.; Agid, Y. Striatal dopamine deficiency in Parkinson’s disease: Role of aging. Ann. Neurol. 1989, 26, 551–557. [Google Scholar] [CrossRef]
- Agid, Y. Parkinson’s disease: Pathophysiology. Lancet 1991, 337, 1321–1324. [Google Scholar] [CrossRef]
- Fearnley, J.M.; Lees, A.J. Ageing and Parkinson’s disease: Substantia nigra regional selectivity. Brain 1991, 114, 2283–2301. [Google Scholar] [CrossRef]
- Greffard, S.; Verny, M.; Bonnet, A.M.; Beinis, J.Y.; Gallinari, C.; Meaume, S.; Piette, F.; Hauw, J.J.; Duyckaerts, C. Motor score of the Unified Parkinson Disease Rating Scale as a good predictor of Lewy body-associated neuronal loss in the substantia nigra. Arch. Neurol. 2006, 63, 584–588. [Google Scholar] [CrossRef] [Green Version]
- Costall, B.; Marsden, C.D.; Naylor, R.J.; Pycock, C.J. The relationship between striatal and mesolimbic dopamine dysfunction and the nature of circling responses following 6-hydroxydopamine and electrolytic lesions of the ascending dopamine systems of rat brain. Brain Res. 1976, 118, 87–113. [Google Scholar] [CrossRef]
- Björklund, A.; Dunnett, S.B.; Stenevi, U.; Lewis, M.E.; Iversen, S.D. Reinnervation of the denervated striatum by substantia nigra transplants: Functional consequences as revealed by pharmacological and sensorimotor testing. Brain Res. 1980, 199, 307–333. [Google Scholar] [CrossRef]
- Liu, C.; Kaeser, P.S. Mechanisms and regulation of dopamine release. Curr. Opin. Neurobiol. 2019, 57, 46–53. [Google Scholar] [CrossRef]
- Mahlknecht, P.; Seppi, K.; Poewe, W. The Concept of Prodromal Parkinson’s Disease. J. Park. Dis. 2015, 5, 681–697. [Google Scholar] [CrossRef] [Green Version]
- Heikkila, R.E.; Hess, A.; Duvoisin, R.C. Dopaminergic neurotoxicity of 1-methyl-4-phenyl-1,2,5,6-tetrahydropyridine in mice. Science 1984, 224, 1451–1453. [Google Scholar] [CrossRef]
- Sundström, E.; Strömberg, I.; Tsutsumi, T.; Olson, L.; Jonsson, G. Studies on the effect of 1-methyl-4-phenyl-1,2,3,6-tetrahydropyridine (MPTP) on central catecholamine neurons in C57BL/6 mice. Comparison with three other strains of mice. Brain Res. 1987, 405, 26–38. [Google Scholar] [CrossRef]
- Jackson-Lewis, V.; Jakowec, M.; Burke, R.E.; Przedborski, S. Time course and morphology of dopaminergic neuronal death caused by the neurotoxin 1-methyl-4-phenyl-1,2,3,6-tetrahydropyridine. Neurodegeneration 1995, 4, 257–269. [Google Scholar] [CrossRef]
- Tatton, N.A.; Kish, S.J. In situ detection of apoptotic nuclei in the substantia nigra compacta of 1-methyl-4-phenyl-1,2,3,6-tetrahydropyridine-treated mice using terminal deoxynucleotidyl transferase labelling and acridine orange staining. Neuroscience 1997, 77, 1037–1048. [Google Scholar] [CrossRef]
- Bezard, E.; Dovero, S.; Bioulac, B.; Gross, C.E. Kinetics of nigral degeneration in a chronic model of MPTP-treated mice. Neurosci. Lett. 1997, 234, 47–50. [Google Scholar] [CrossRef]
- Petroske, E.; Meredith, G.E.; Callen, S.; Totterdell, S.; Lau, Y.S. Mouse model of Parkinsonism: A comparison between subacute MPTP and chronic MPTP/probenecid treatment. Neuroscience 2001, 106, 589–601. [Google Scholar] [CrossRef]
- Antolín, I.; Mayo, J.C.; Sainz, R.M.; del Brío Mde, L.; Herrera, F.; Martín, V.; Rodríguez, C. Protective effect of melatonin in a chronic experimental model of Parkinson’s disease. Brain Res. 2002, 943, 163–173. [Google Scholar] [CrossRef]
- Serra, P.A.; Sciola, L.; Delogu, M.R.; Spano, A.; Monaco, G.; Miele, E.; Rocchitta, G.; Miele, M.; Migheli, R.; Desole, M.S. The neurotoxin 1-methyl-4-phenyl-1,2,3,6-tetrahydropyridine induces apoptosis in mouse nigrostriatal glia. Relevance to nigral neuronal death and striatal neurochemical changes. J. Biol. Chem. 2002, 277, 34451–34461. [Google Scholar] [CrossRef]
- Kühn, K.; Wellen, J.; Link, N.; Maskri, L.; Lübbert, H.; Stichel, C.C. The mouse MPTP model: Gene expression changes in dopaminergic neurons. Eur. J. Neurosci. 2003, 17, 1–12. [Google Scholar] [CrossRef] [PubMed]
- Kurosaki, R.; Muramatsu, Y.; Kato, H.; Araki, T. Biochemical, behavioral and immunohistochemical alterations in MPTP-treated mouse model of Parkinson’s disease. Pharmacol. Biochem. Behav. 2004, 78, 1431–1453. [Google Scholar] [CrossRef] [PubMed]
- Fornai, F.; Schlüter, O.M.; Lenzi, P.; Gesi, M.; Ruffoli, R.; Ferrucci, M.; Lazzeri, G.; Busceti, C.L.; Pontarelli, F.; Battaglia, G.; et al. Parkinson-like syndrome induced by continuous MPTP infusion: Convergent roles of the ubiquitin-proteasome system and alpha-synuclein. Proc. Natl. Acad. Sci. USA 2005, 102, 3413–3418. [Google Scholar] [CrossRef] [PubMed] [Green Version]
- Anderson, D.W.; Bradbury, K.A.; Schneider, J.S. Neuroprotection in Parkinson models varies with toxin administration protocol. Eur. J. Neurosci. 2006, 24, 3174–3182. [Google Scholar] [CrossRef] [PubMed]
- Jackson-Lewis, V.; Przedborski, S. Protocol for the MPTP mouse model of Parkinson’s disease. Nat. Protoc. 2007, 2, 141–151. [Google Scholar] [CrossRef]
- Gibrat, C.; Saint-Pierre, M.; Bousquet, M.; Lévesque, D.; Rouillard, C.; Cicchetti, F. Differences between subacute and chronic MPTP mice models: Investigation of dopaminergic neuronal degeneration and alpha-synuclein inclusions. J. Neurochem. 2009, 109, 1469–1482. [Google Scholar] [CrossRef]
- McCollum, M.; Ma, Z.; Cohen, E.; Leon, R.; Tao, R.; Wu, J.Y.; Maharaj, D.; Wei, J. Post-MPTP treatment with granulocyte colony-stimulating factor improves nigrostriatal function in the mouse model of Parkinson’s disease. Mol. Neurobiol. 2010, 41, 410–419. [Google Scholar] [CrossRef]
- Ugrumov, M.V.; Khaindrava, V.G.; Kozina, E.A.; Kucheryanu, V.G.; Bocharov, E.V.; Kryzhanovsky, G.N.; Kudrin, V.S.; Narkevich, V.B.; Klodt, P.M.; Rayevsky, K.S.; et al. Modeling of presymptomatic and symptomatic stages of parkinsonism in mice. Neuroscience 2011, 181, 175–188. [Google Scholar] [CrossRef]
- Goldberg, N.R.; Haack, A.K.; Lim, N.S.; Janson, O.K.; Meshul, C.K. Dopaminergic and behavioral correlates of progressive lesioning of the nigrostriatal pathway with 1-methyl-4-phenyl-1,2,3,6-tetrahydropyridine. Neuroscience 2011, 180, 256–271. [Google Scholar] [CrossRef]
- Fifel, K.; Dkhissi-Benyahya, O.; Cooper, H.M. Lack of long-term changes in circadian, locomotor, and cognitive functions in acute and chronic MPTP (1-methyl-4-phenyl-1,2,3,6-tetrahydropyridine) mouse models of Parkinson’s disease. Chronobiol. Int. 2013, 30, 741–755. [Google Scholar] [CrossRef]
- Muñoz-Manchado, A.B.; Villadiego, J.; Romo-Madero, S.; Suárez-Luna, N.; Bermejo-Navas, A.; Rodríguez-Gómez, J.A.; Garrido-Gil, P.; Labandeira-García, J.L.; Echevarría, M.; López-Barneo, J.; et al. Chronic and progressive Parkinson’s disease MPTP model in adult and aged mice. J. Neurochem. 2016, 136, 373–387. [Google Scholar] [CrossRef] [Green Version]
- Torres, E.R.S.; Akinyeke, T.; Stagaman, K.; Duvoisin, R.M.; Meshul, C.K.; Sharpton, T.J.; Raber, J. Effects of Sub-Chronic MPTP Exposure on Behavioral and Cognitive Performance and the Microbiome of Wild-Type and mGlu8 Knockout Female and Male Mice. Front. Behav. Neurosci. 2018, 18, 140. [Google Scholar] [CrossRef] [Green Version]
- Lai, F.; Jiang, R.; Xie, W.; Liu, X.; Tang, Y.; Xiao, H.; Gao, J.; Jia, Y.; Bai, Q. Intestinal Pathology and Gut Microbiota Alterations in a Methyl-4-phenyl-1,2,3,6-tetrahydropyridine (MPTP) Mouse Model of Parkinson’s Disease. Neurochem. Res. 2018, 43, 1986–1999. [Google Scholar] [CrossRef]
- Iring, A.; Tóth, A.; Baranyi, M.; Otrokocsi, L.; Módis, L.V.; Gölöncsér, F.; Varga, B.; Hortobágyi, T.; Bereczki, D.; Dénes, Á.; et al. The dualistic role of the purinergic P2Y12-receptor in an in vivo model of Parkinson’s disease: Signalling pathway and novel therapeutic targets. Pharmacol. Res. 2022, 176, 106045. [Google Scholar] [CrossRef]
- Huang, R.; Gao, Y.; Chen, J.; Duan, Q.; He, P.; Zhang, J.; Huang, H.; Zhang, Q.; Ma, G.; Zhang, Y.; et al. TGR5 Agonist INT-777 Alleviates Inflammatory Neurodegeneration in Parkinson’s Disease Mouse Model by Modulating Mitochondrial Dynamics in Microglia. Neuroscience 2022, 10, 100–119. [Google Scholar] [CrossRef]
- Chao, R.Y.; Cheng, C.H.; Wu, S.N.; Chen, P.C. Defective trafficking of Kv2.1 channels in MPTP-induced nigrostriatal degeneration. J. Neurochem. 2018, 144, 483–497. [Google Scholar] [CrossRef] [Green Version]
- Shimoji, M.; Zhang, L.; Mandir, A.S.; Dawson, V.L.; Dawson, T.M. Absence of inclusion body formation in the MPTP mouse model of Parkinson’s disease. Brain Res. Mol. Brain Res. 2005, 134, 103–108. [Google Scholar] [CrossRef]
- Przedborski, S.; Jackson-Lewis, V.; Naini, A.B.; Jakowec, M.; Petzinger, G.; Miller, R.; Akram, M. The parkinsonian toxin 1-methyl-4-phenyl-1,2,3,6-tetrahydropyridine (MPTP): A technical review of its utility and safety. J. Neurochem. 2001, 76, 1265–1274. [Google Scholar] [CrossRef] [Green Version]
- Kozina, E.A.; Khakimova, G.R.; Khaindrava, V.G.; Kucheryanu, V.G.; Vorobyeva, N.E.; Krasnov, A.N.; Georgieva, S.G.; Kerkerian-Le Goff, L.; Ugrumov, M.V. Tyrosine hydroxylase expression and activity in nigrostriatal dopaminergic neurons of MPTP-treated mice at the presymptomatic and symptomatic stages of parkinsonism. J. Neurol. Sci. 2014, 340, 198–207. [Google Scholar] [CrossRef]
- Mingazov, E.R.; Khakimova, G.R.; Kozina, E.A.; Medvedev, A.E.; Buneeva, O.A.; Bazyan, A.S.; Ugrumov, M.V. MPTP Mouse Model of Preclinical and Clinical Parkinson’s Disease as an Instrument for Translational Medicine. Mol. Neurobiol. 2018, 55, 2991–3006. [Google Scholar] [CrossRef]
- Kordower, J.H.; Olanow, C.W.; Dodiya, H.B.; Chu, Y.; Beach, T.G.; Adler, C.H.; Halliday, G.M.; Bartus, R.T. Disease duration and the integrity of the nigrostriatal system in Parkinson’s disease. Brain 2013, 136, 2419–2431. [Google Scholar] [CrossRef] [PubMed] [Green Version]
- Chiba, K.; Trevor, A.; Castagnoli, N., Jr. Metabolism of the neurotoxic tertiary amine, MPTP, by brain monoamine oxidase. Biochem. Biophys. Res. Commun. 1984, 120, 574–578. [Google Scholar] [CrossRef] [PubMed]
- Tipton, K.F.; Singer, T.P. Advances in our understanding of the mechanisms of the neurotoxicity of MPTP and related compounds. J. Neurochem. 1993, 61, 1191–1206. [Google Scholar] [CrossRef] [PubMed]
- Kolacheva, A.A.; Ugrumov, M.V. Dopamine Synthesis as a Mechanism of Brain Plasticity in Nigrostriatal System Pathology. Dokl. Biochem. Biophys. 2018, 479, 83–86. [Google Scholar] [CrossRef] [PubMed]
- Bezard, E.; Gross, C.E.; Fournier, M.C.; Dovero, S.; Bloch, B.; Jaber, M. Absence of MPTP-induced neuronal death in mice lacking the dopamine transporter. Exp. Neurol. 1999, 155, 268–273. [Google Scholar] [CrossRef]
- Gainetdinov, R.R.; Fumagalli, F.; Jones, S.R.; Caron, M.G. Dopamine transporter is required for in vivo MPTP neurotoxicity: Evidence from mice lacking the transporter. J. Neurochem. 1997, 69, 1322–1325. [Google Scholar] [CrossRef]
- Yamada, T.; McGeer, P.L.; Baimbridge, K.G.; McGeer, E.G. Relative sparing in Parkinson’s disease of substantia nigra dopamine neurons containing calbindin-D28K. Brain Res. 1990, 526, 303–307. [Google Scholar] [CrossRef]
- Lavoie, B.; Parent, A. Dopaminergic neurons expressing calbindin in normal and parkinsonian monkeys. Neuroreport 1991, 2, 601–604. [Google Scholar] [CrossRef]
- Damier, P.; Hirsch, E.C.; Agid, Y.; Graybiel, A.M. The substantia nigra of the human brain. II. Patterns of loss of dopamine-containing neurons in Parkinson’s disease. Brain 1999, 122, 1437–1448. [Google Scholar] [CrossRef]
- Crocker, S.J.; Smith, P.D.; Jackson-Lewis, V.; Lamba, W.R.; Hayley, S.P.; Grimm, E.; Callaghan, S.M.; Slack, R.S.; Melloni, E.; Przedborski, S.; et al. Inhibition of calpains prevents neuronal and behavioral deficits in an MPTP mouse model of Parkinson’s disease. J. Neurosci. 2003, 23, 4081–4091. [Google Scholar] [CrossRef] [Green Version]
- Bezard, E.; Gross, C.E. Compensatory mechanisms in experimental and human parkinsonism: Towards a dynamic approach. Prog. Neurobiol. 1998, 55, 93–116. [Google Scholar] [CrossRef] [PubMed]
- Bezard, E.; Gross, C.E.; Brotchie, J.M. Presymptomatic compensation in Parkinson’s disease is not dopamine-mediated. Trends Neurosci. 2003, 26, 215–221. [Google Scholar] [CrossRef] [PubMed]
- Blesa, J.; Trigo-Damas, I.; Dileone, M.; Del Rey, N.L.; Hernandez, L.F.; Obeso, J.A. Compensatory mechanisms in Parkinson’s disease: Circuits adaptations and role in disease modification. Exp. Neurol. 2017, 298, 148–161. [Google Scholar] [CrossRef] [PubMed]
- Postuma, R.B.; Berg, D. Prodromal Parkinson’s Disease: The Decade Past, the Decade to Come. Mov. Disord. 2019, 34, 665–675. [Google Scholar] [CrossRef]
- Paxinos, G.; Franklin, K.B.J. The Mouse Brain in Stereotaxic Coordinates, Compact, 2nd ed.; Academic Press: Cambridge, UK, 2001. [Google Scholar]
- Khaindrava, V.G.; Ershov, P.V.; Antsiperov, V.E.; Obukhov, Y.V.; Nanaev, A.K.; Ugriumov, M.V. Optimization of counting process of dopaminergic neurons in substantia nigra of parkinsonian mice. Cell Tissue Biol. 2010, 4, 391–398. [Google Scholar] [CrossRef]


| Subchronic Models | Acute Model | ||
|---|---|---|---|
| Preclinical Stage | Clinical Stage | Clinical Stage | |
| Daily MPTP injections (mg/kg) | 8, 10 | 8, 10, 12, 16, 20, 26, 40 | 40 |
| Motor behavior | No motor disorders | Motor disorders | Motor disorders |
| DA level in the striatum compared to the control (100%) | 47% | 26% | 25% |
| Number of DAergic neurons in the SN compared to the control (100%) | 97% | 72% | 84% |
| Dopamine turnover (DOPAC/DA) as an indicator of neurotransmission efficiency | Increased | Decreased | Increased |
Disclaimer/Publisher’s Note: The statements, opinions and data contained in all publications are solely those of the individual author(s) and contributor(s) and not of MDPI and/or the editor(s). MDPI and/or the editor(s) disclaim responsibility for any injury to people or property resulting from any ideas, methods, instructions or products referred to in the content. |
© 2022 by the authors. Licensee MDPI, Basel, Switzerland. This article is an open access article distributed under the terms and conditions of the Creative Commons Attribution (CC BY) license (https://creativecommons.org/licenses/by/4.0/).
Share and Cite
Kolacheva, A.; Bannikova, A.; Pavlova, E.; Bogdanov, V.; Ugrumov, M. Modeling of the Progressive Degradation of the Nigrostriatal Dopaminergic System in Mice to Study the Mechanisms of Neurodegeneration and Neuroplasticity in Parkinson’s Disease. Int. J. Mol. Sci. 2023, 24, 683. https://doi.org/10.3390/ijms24010683
Kolacheva A, Bannikova A, Pavlova E, Bogdanov V, Ugrumov M. Modeling of the Progressive Degradation of the Nigrostriatal Dopaminergic System in Mice to Study the Mechanisms of Neurodegeneration and Neuroplasticity in Parkinson’s Disease. International Journal of Molecular Sciences. 2023; 24(1):683. https://doi.org/10.3390/ijms24010683
Chicago/Turabian StyleKolacheva, Anna, Alyona Bannikova, Ekaterina Pavlova, Vsevolod Bogdanov, and Michael Ugrumov. 2023. "Modeling of the Progressive Degradation of the Nigrostriatal Dopaminergic System in Mice to Study the Mechanisms of Neurodegeneration and Neuroplasticity in Parkinson’s Disease" International Journal of Molecular Sciences 24, no. 1: 683. https://doi.org/10.3390/ijms24010683