
Isocitrate Dehydrogenase Alpha-1 Modulates Lifespan and Oxidative Stress Tolerance in Caenorhabditis elegans
 and
and 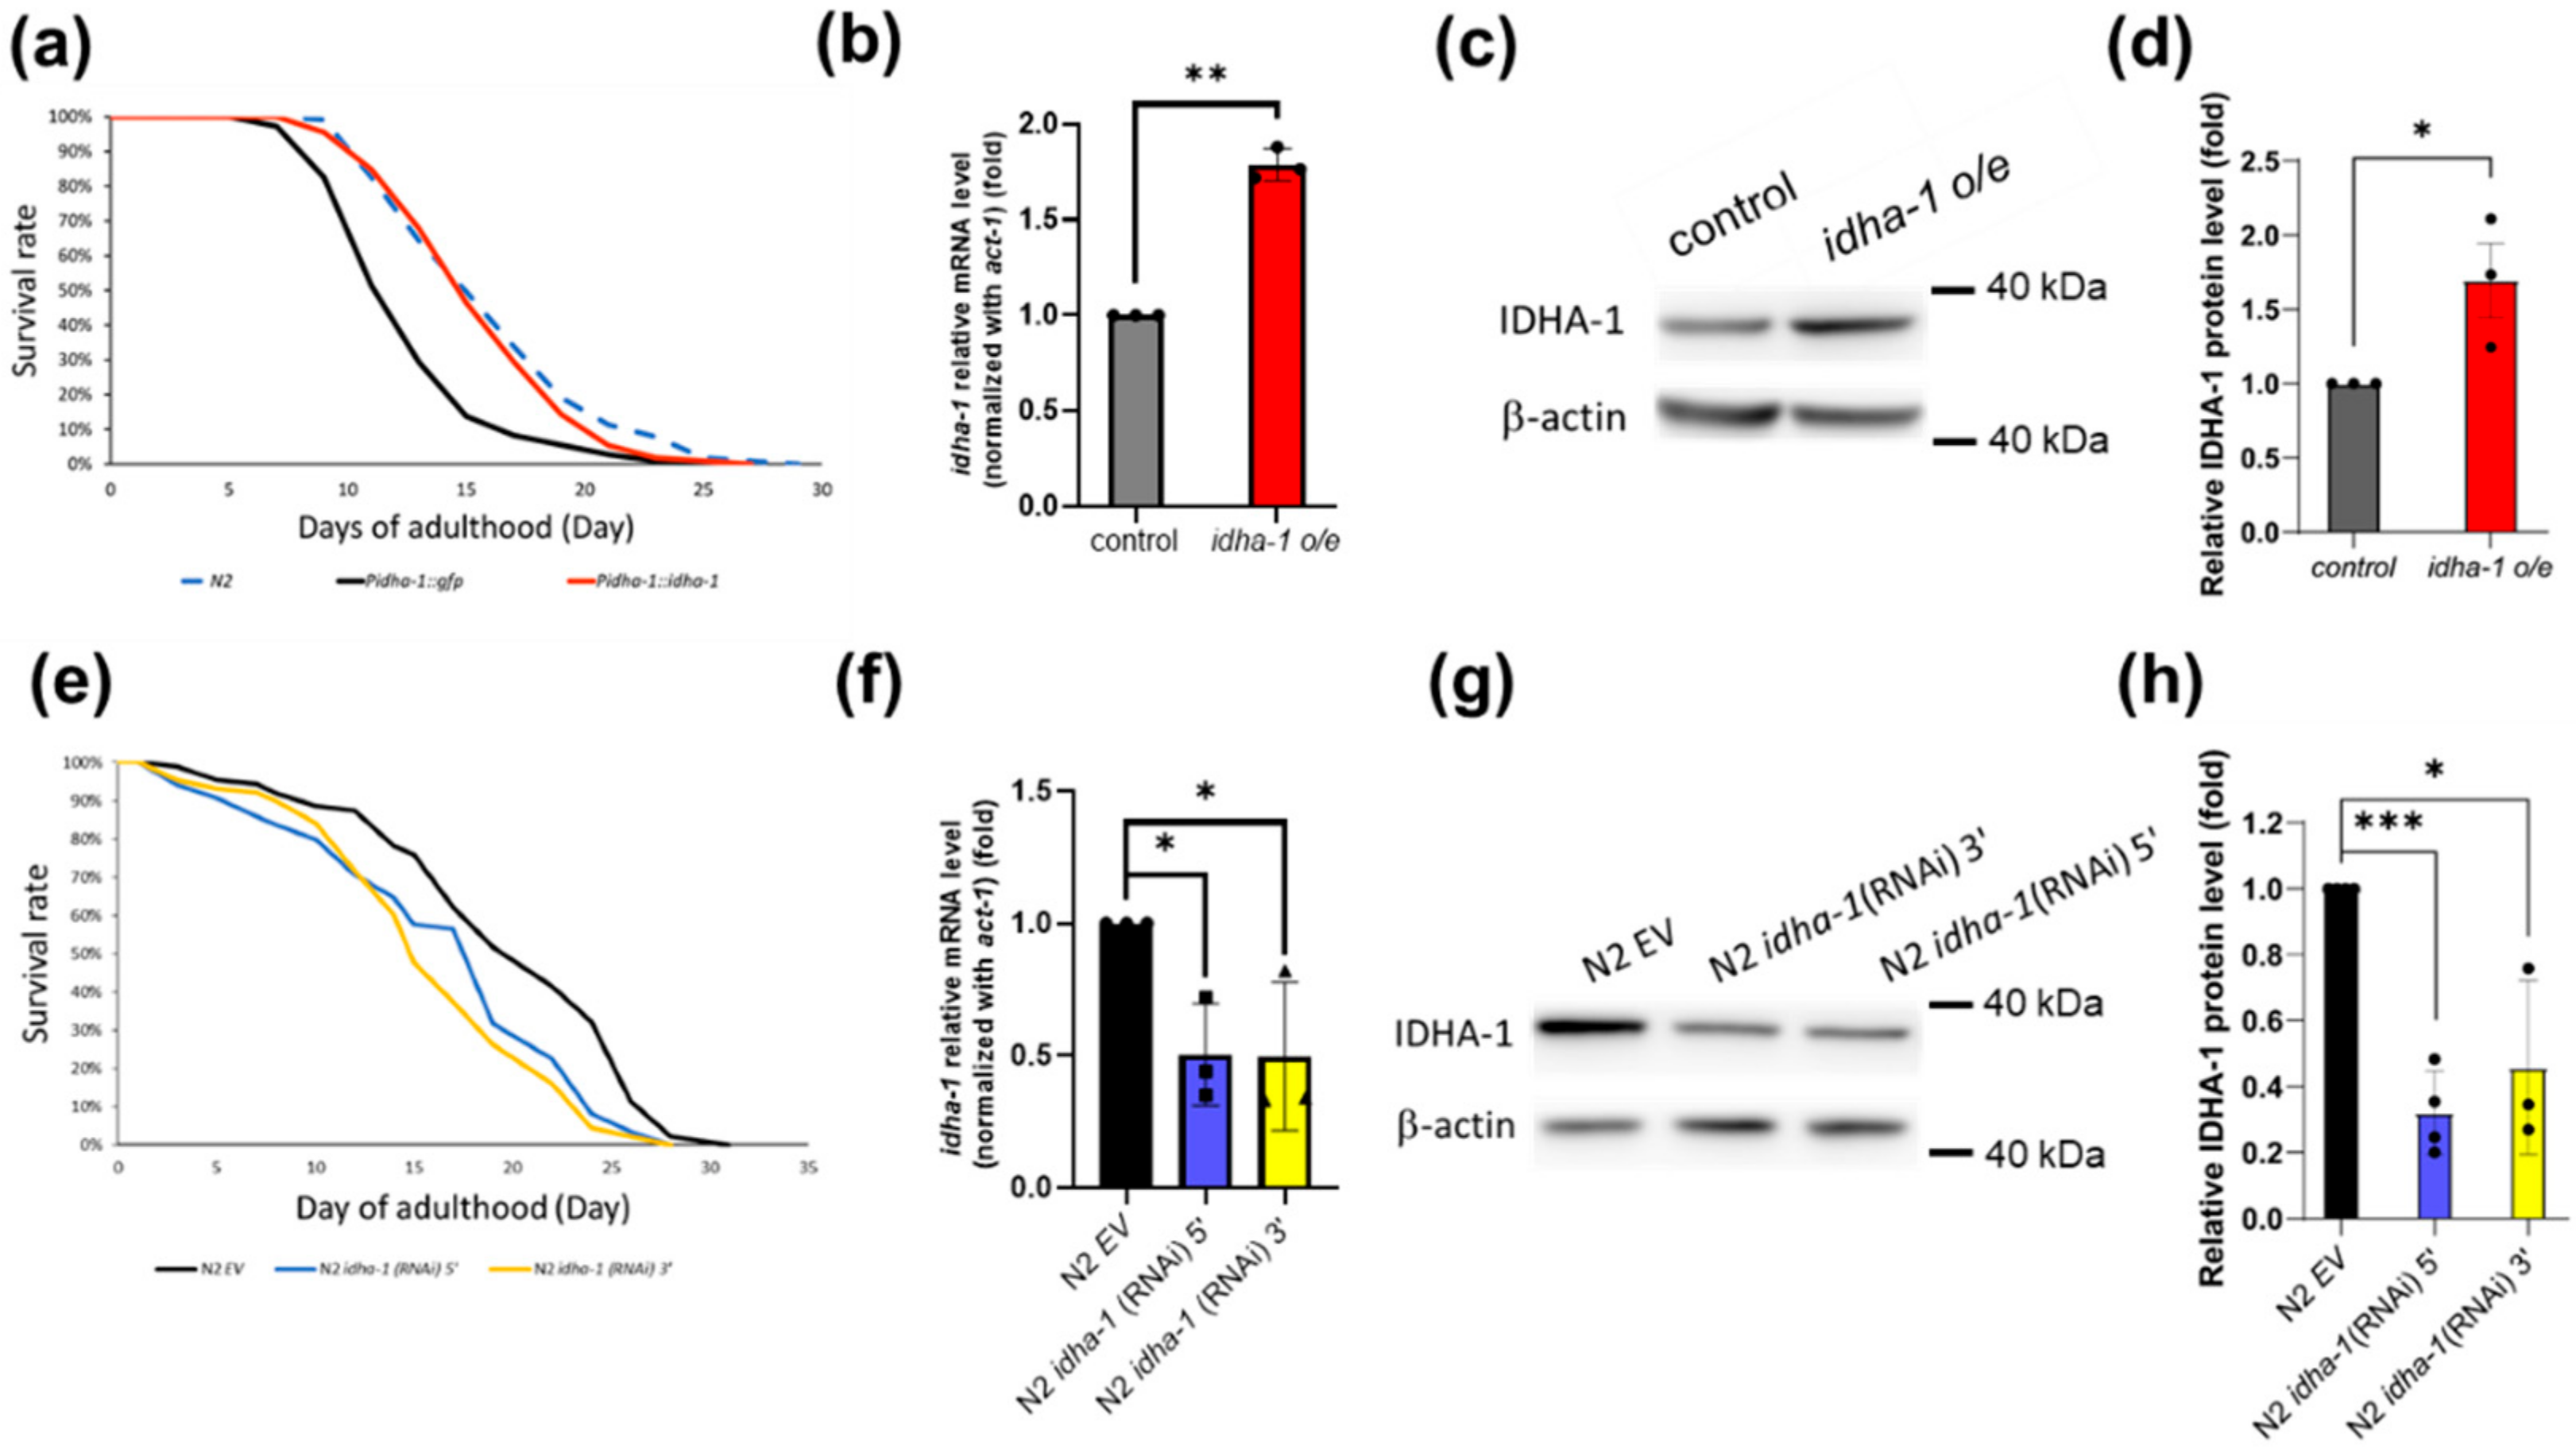
Abstract
:1. Introduction
2. Results
2.1. Isocitrate Dehydrogenase Alpha-1 Expression Regulates Lifespan in C. elegans
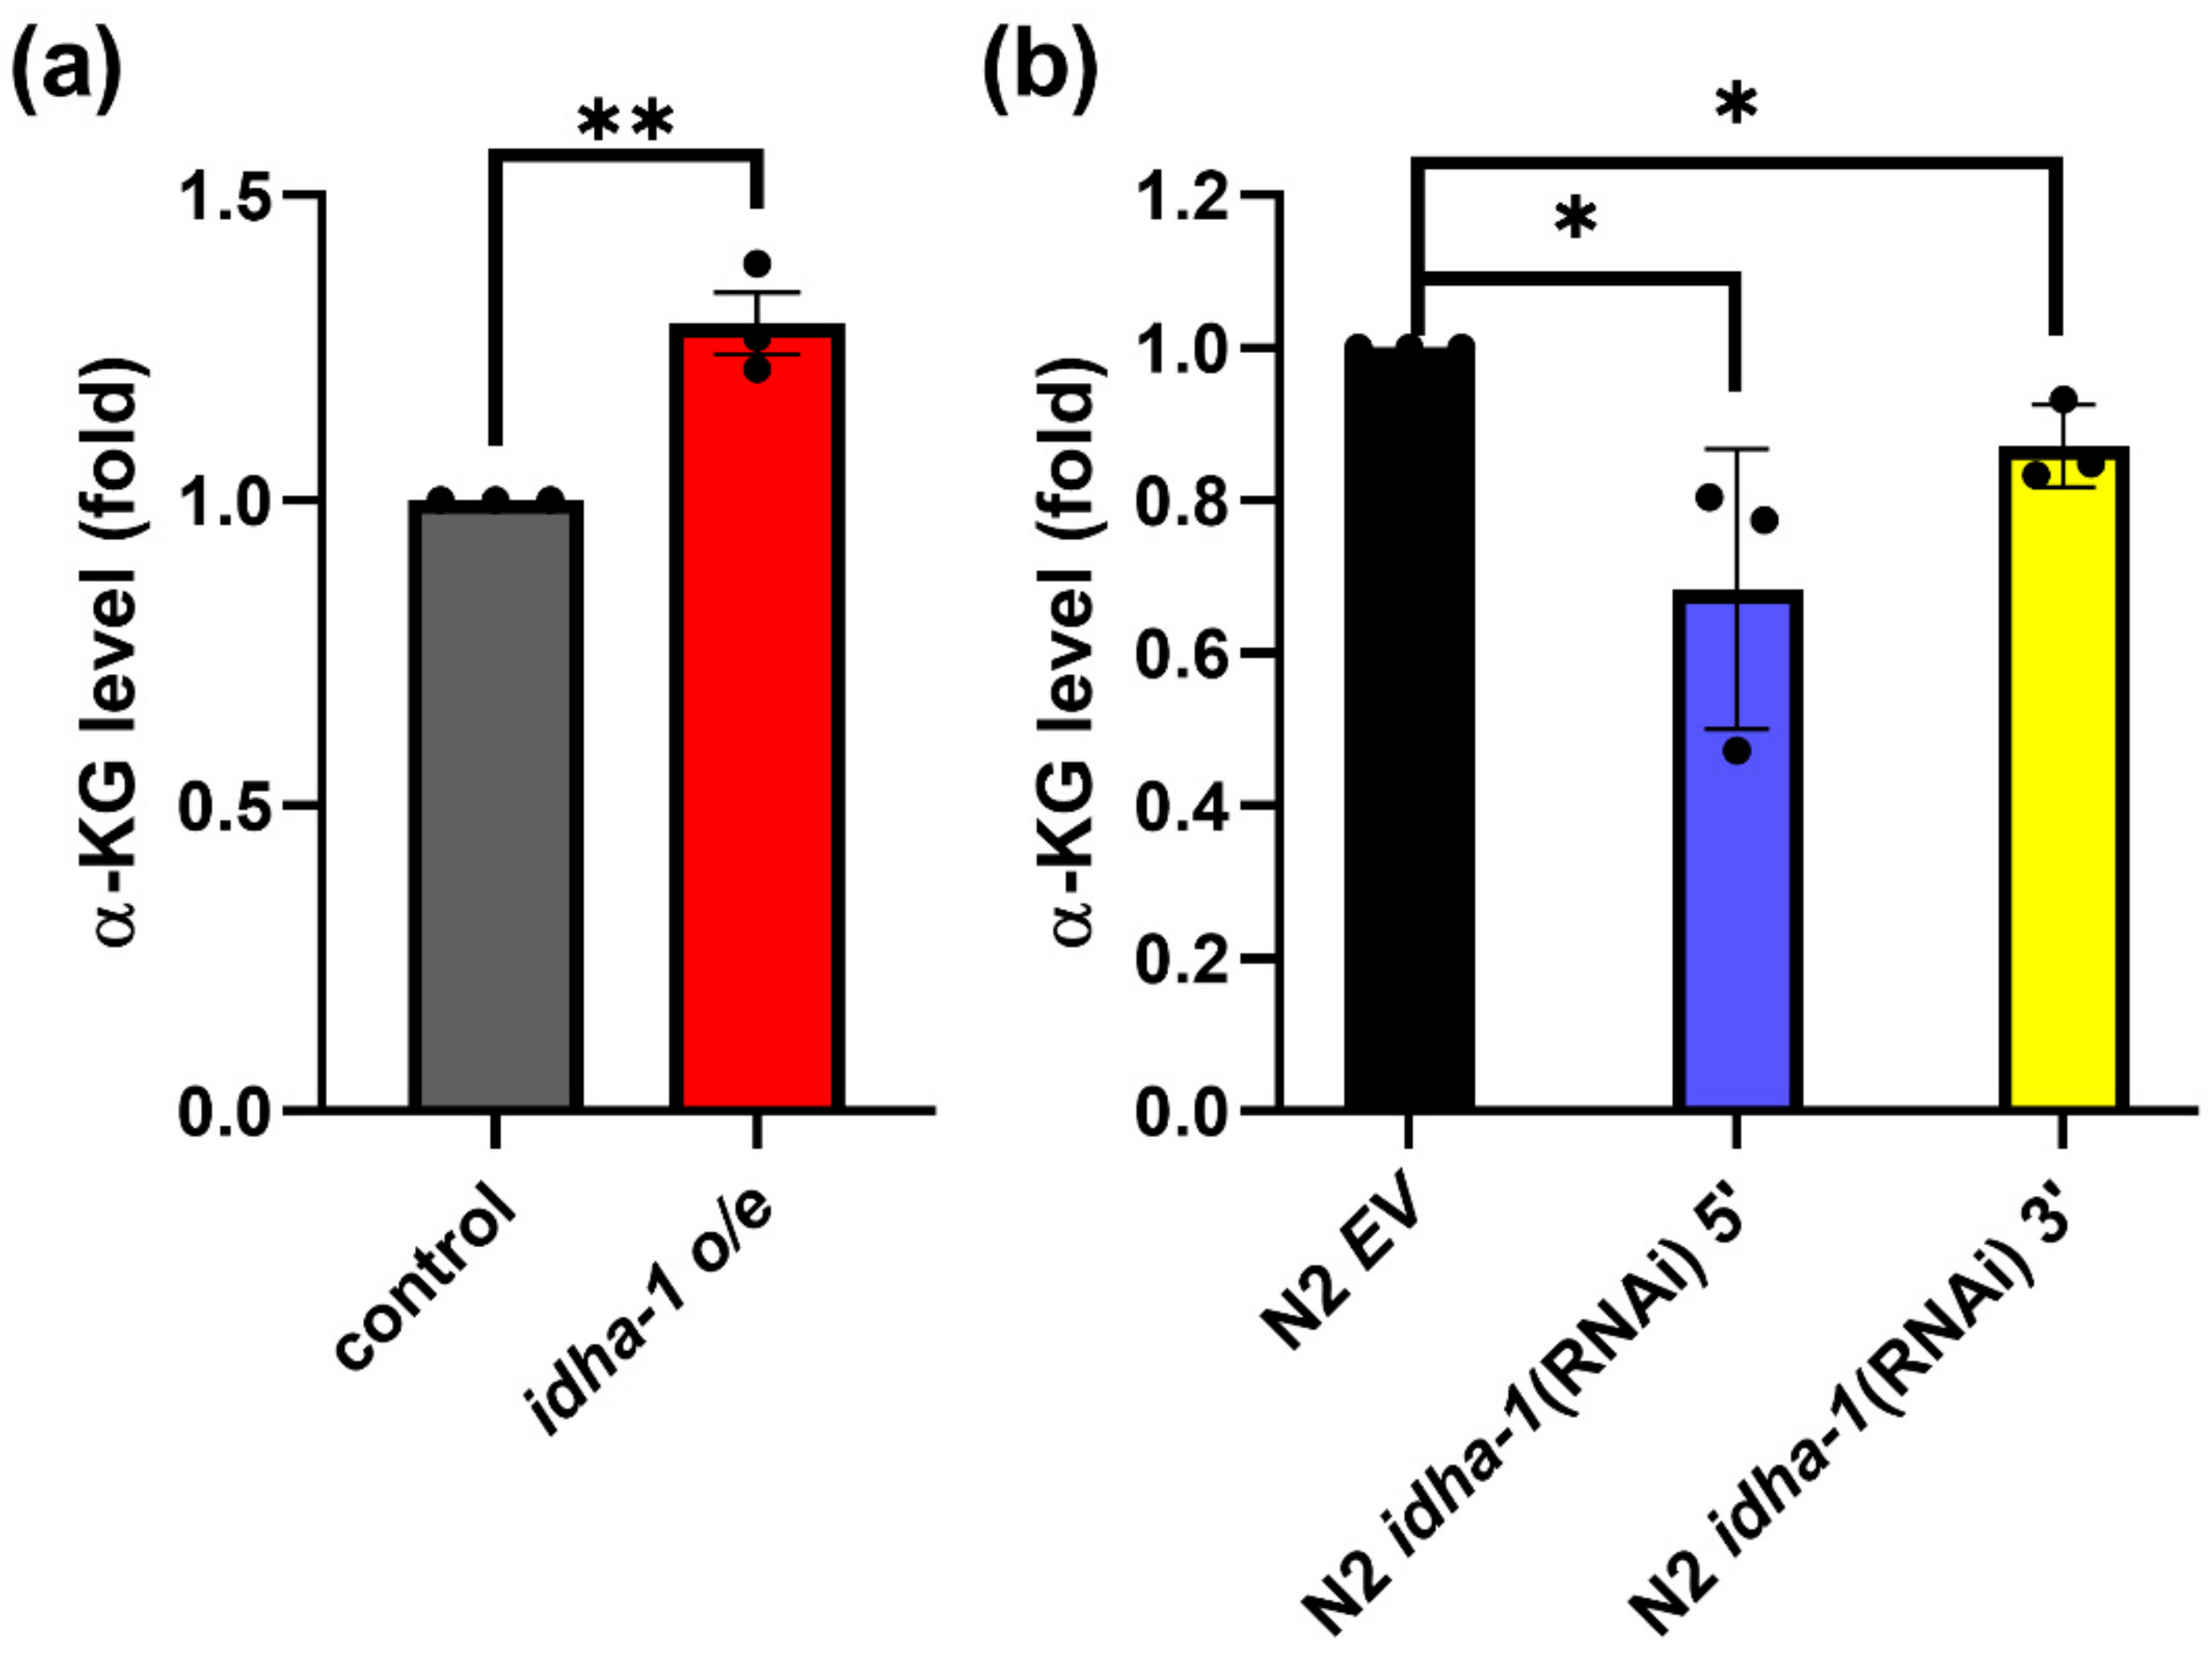
2.2. Expression of idha-1 Modulates α-Ketoglutarate Levels
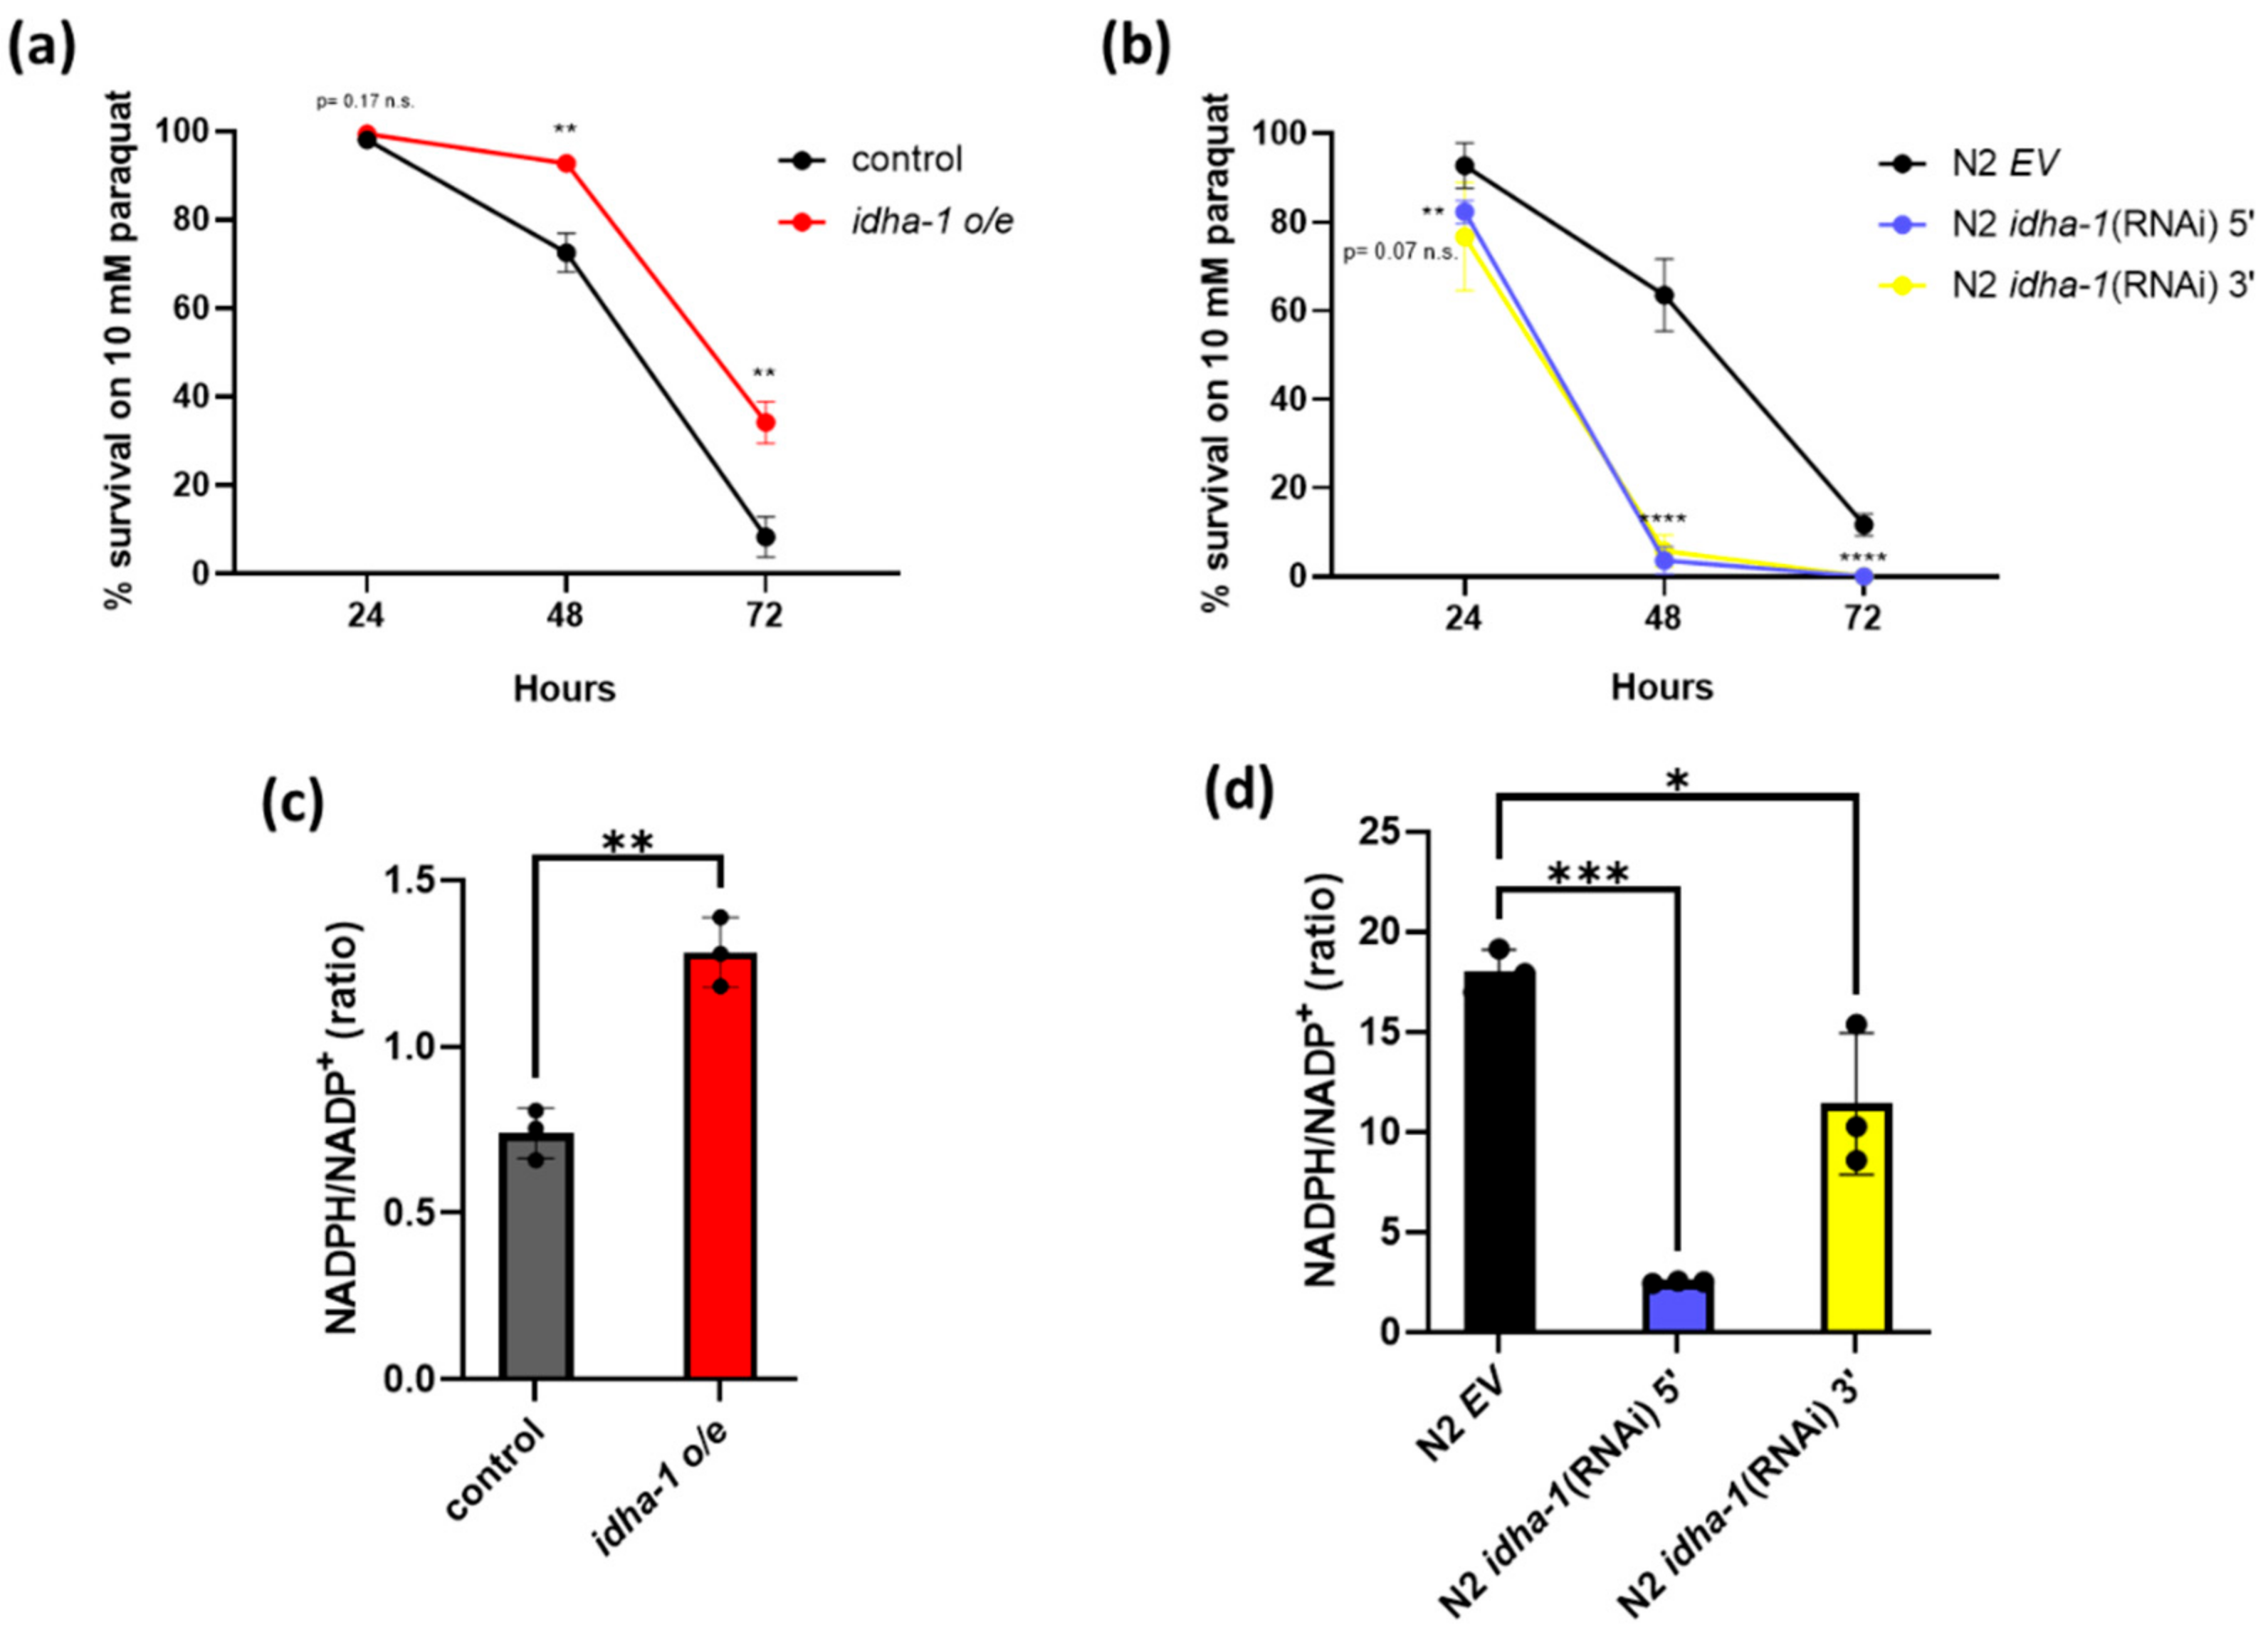
2.3. Expression of idha-1 Manages the Tolerance to Oxidative Stress and Levels of NADPH/NADP+ Ratio
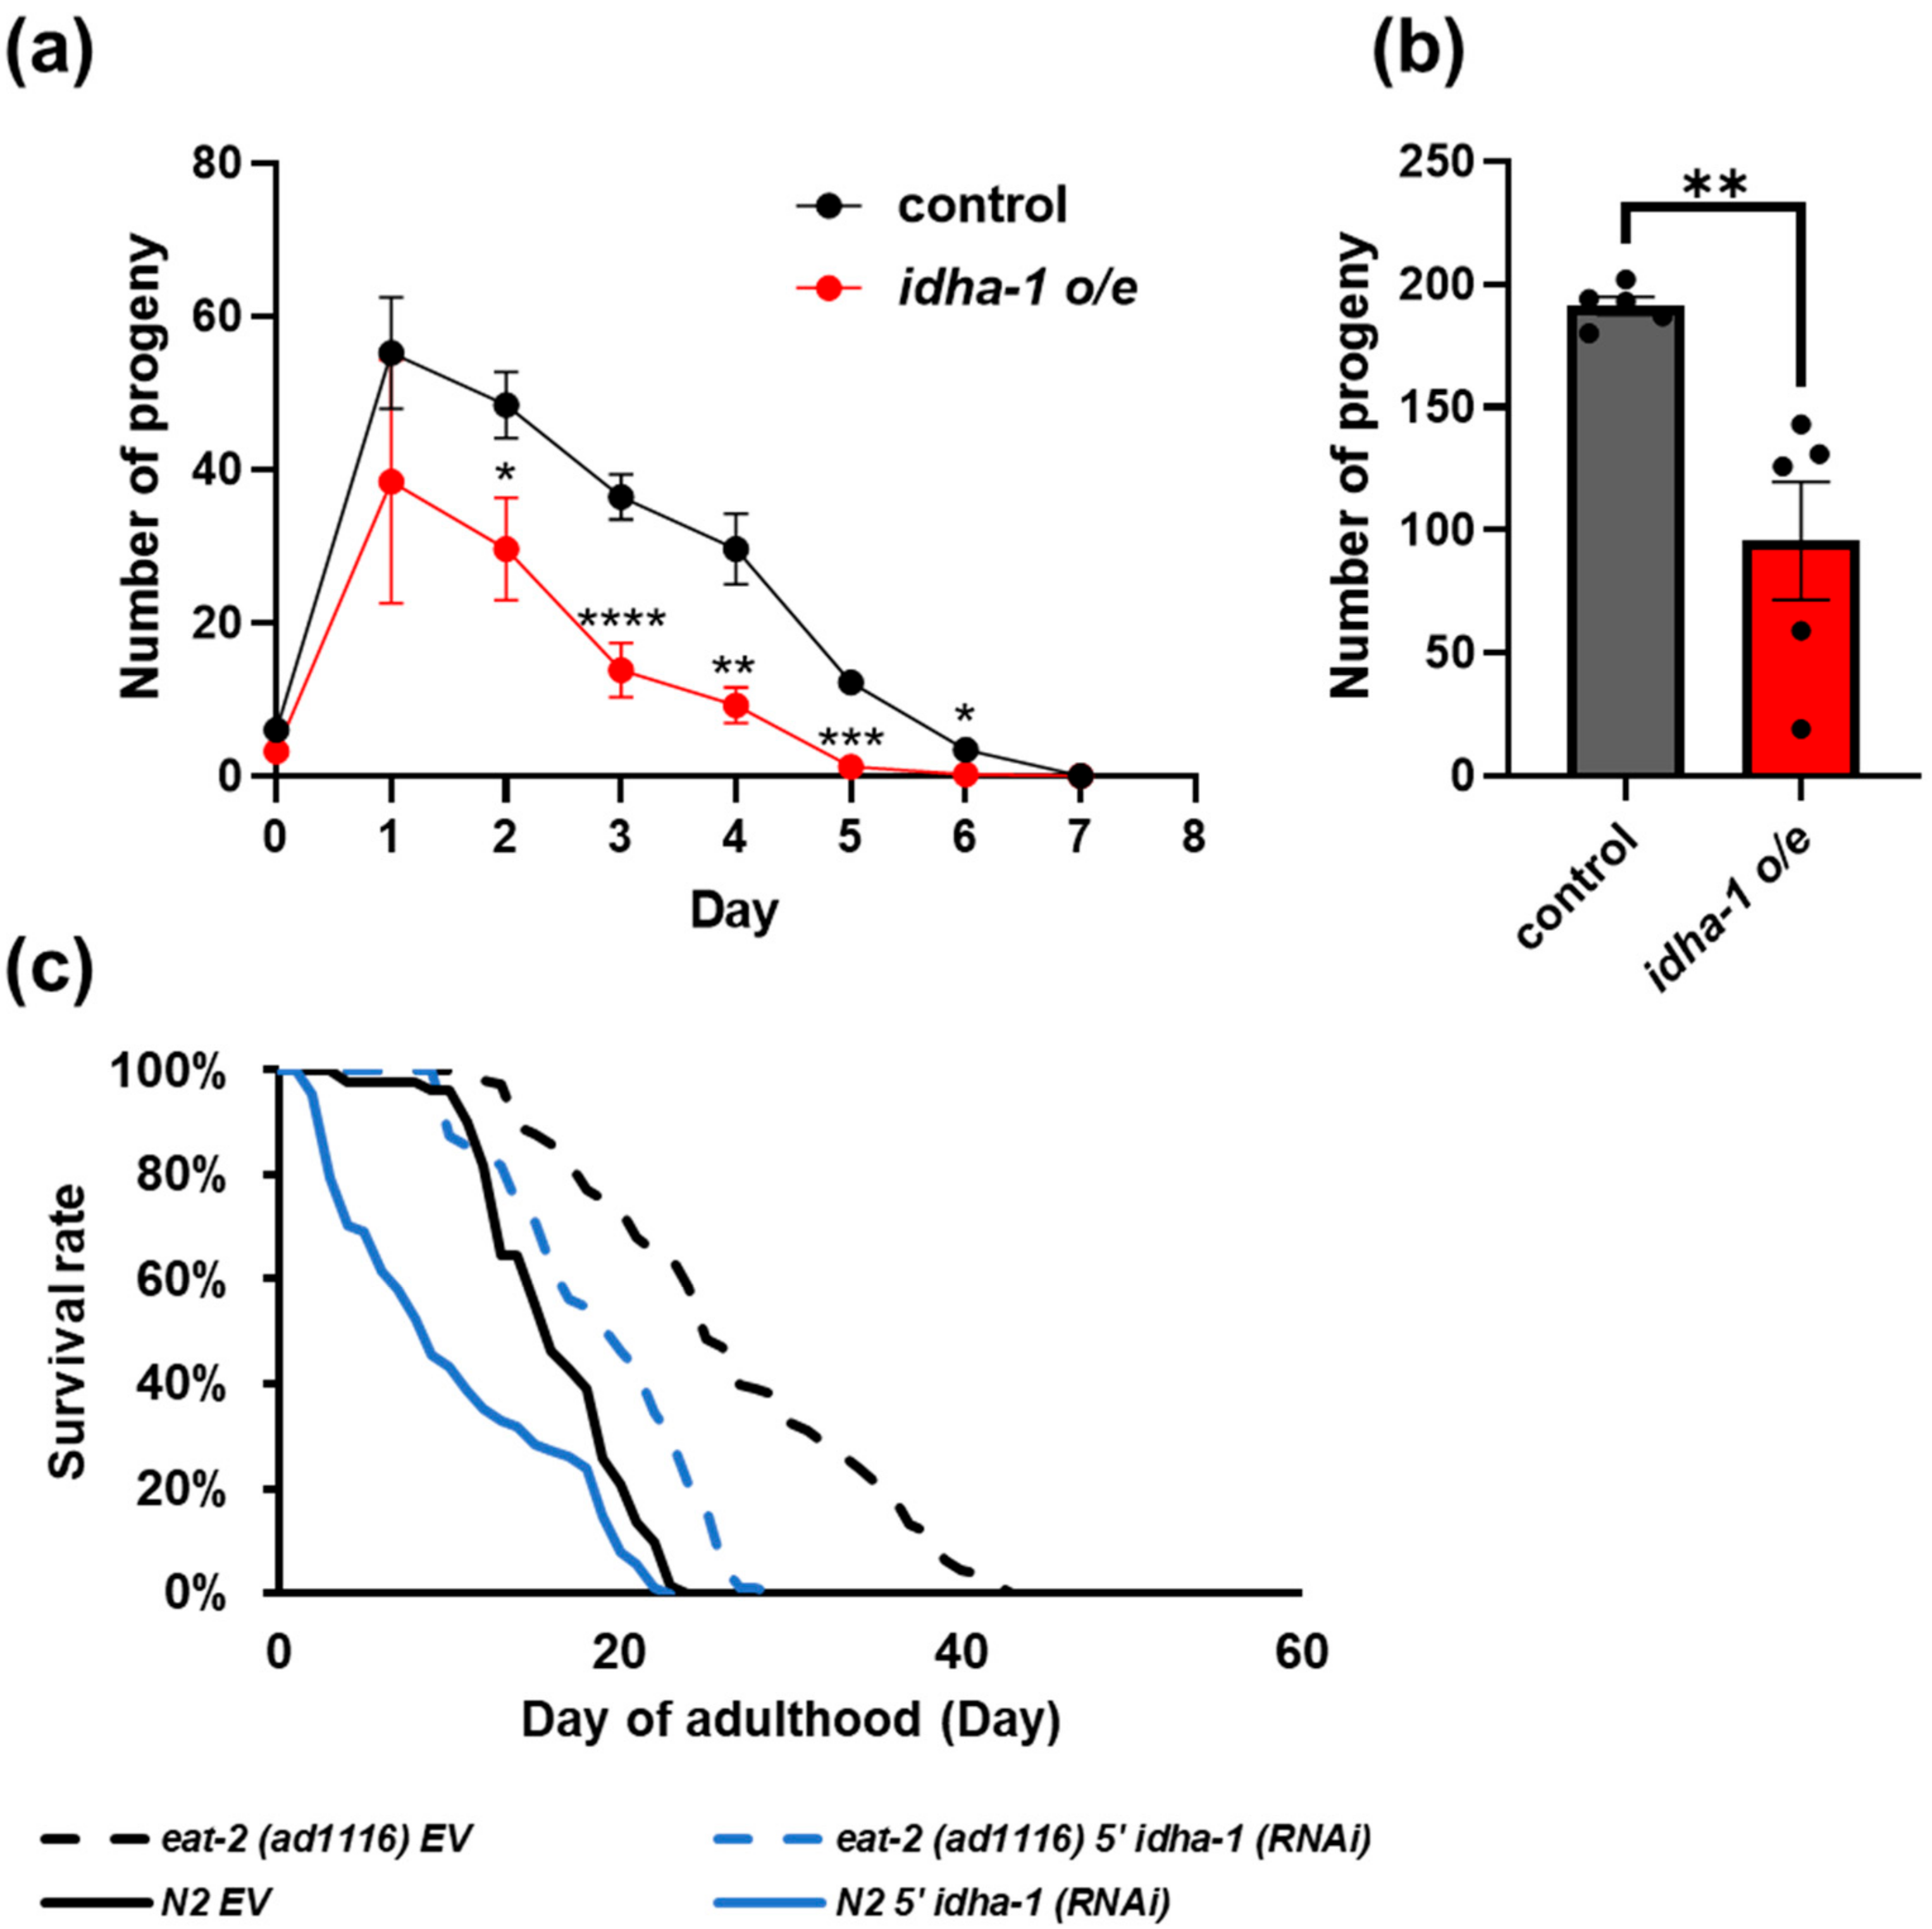
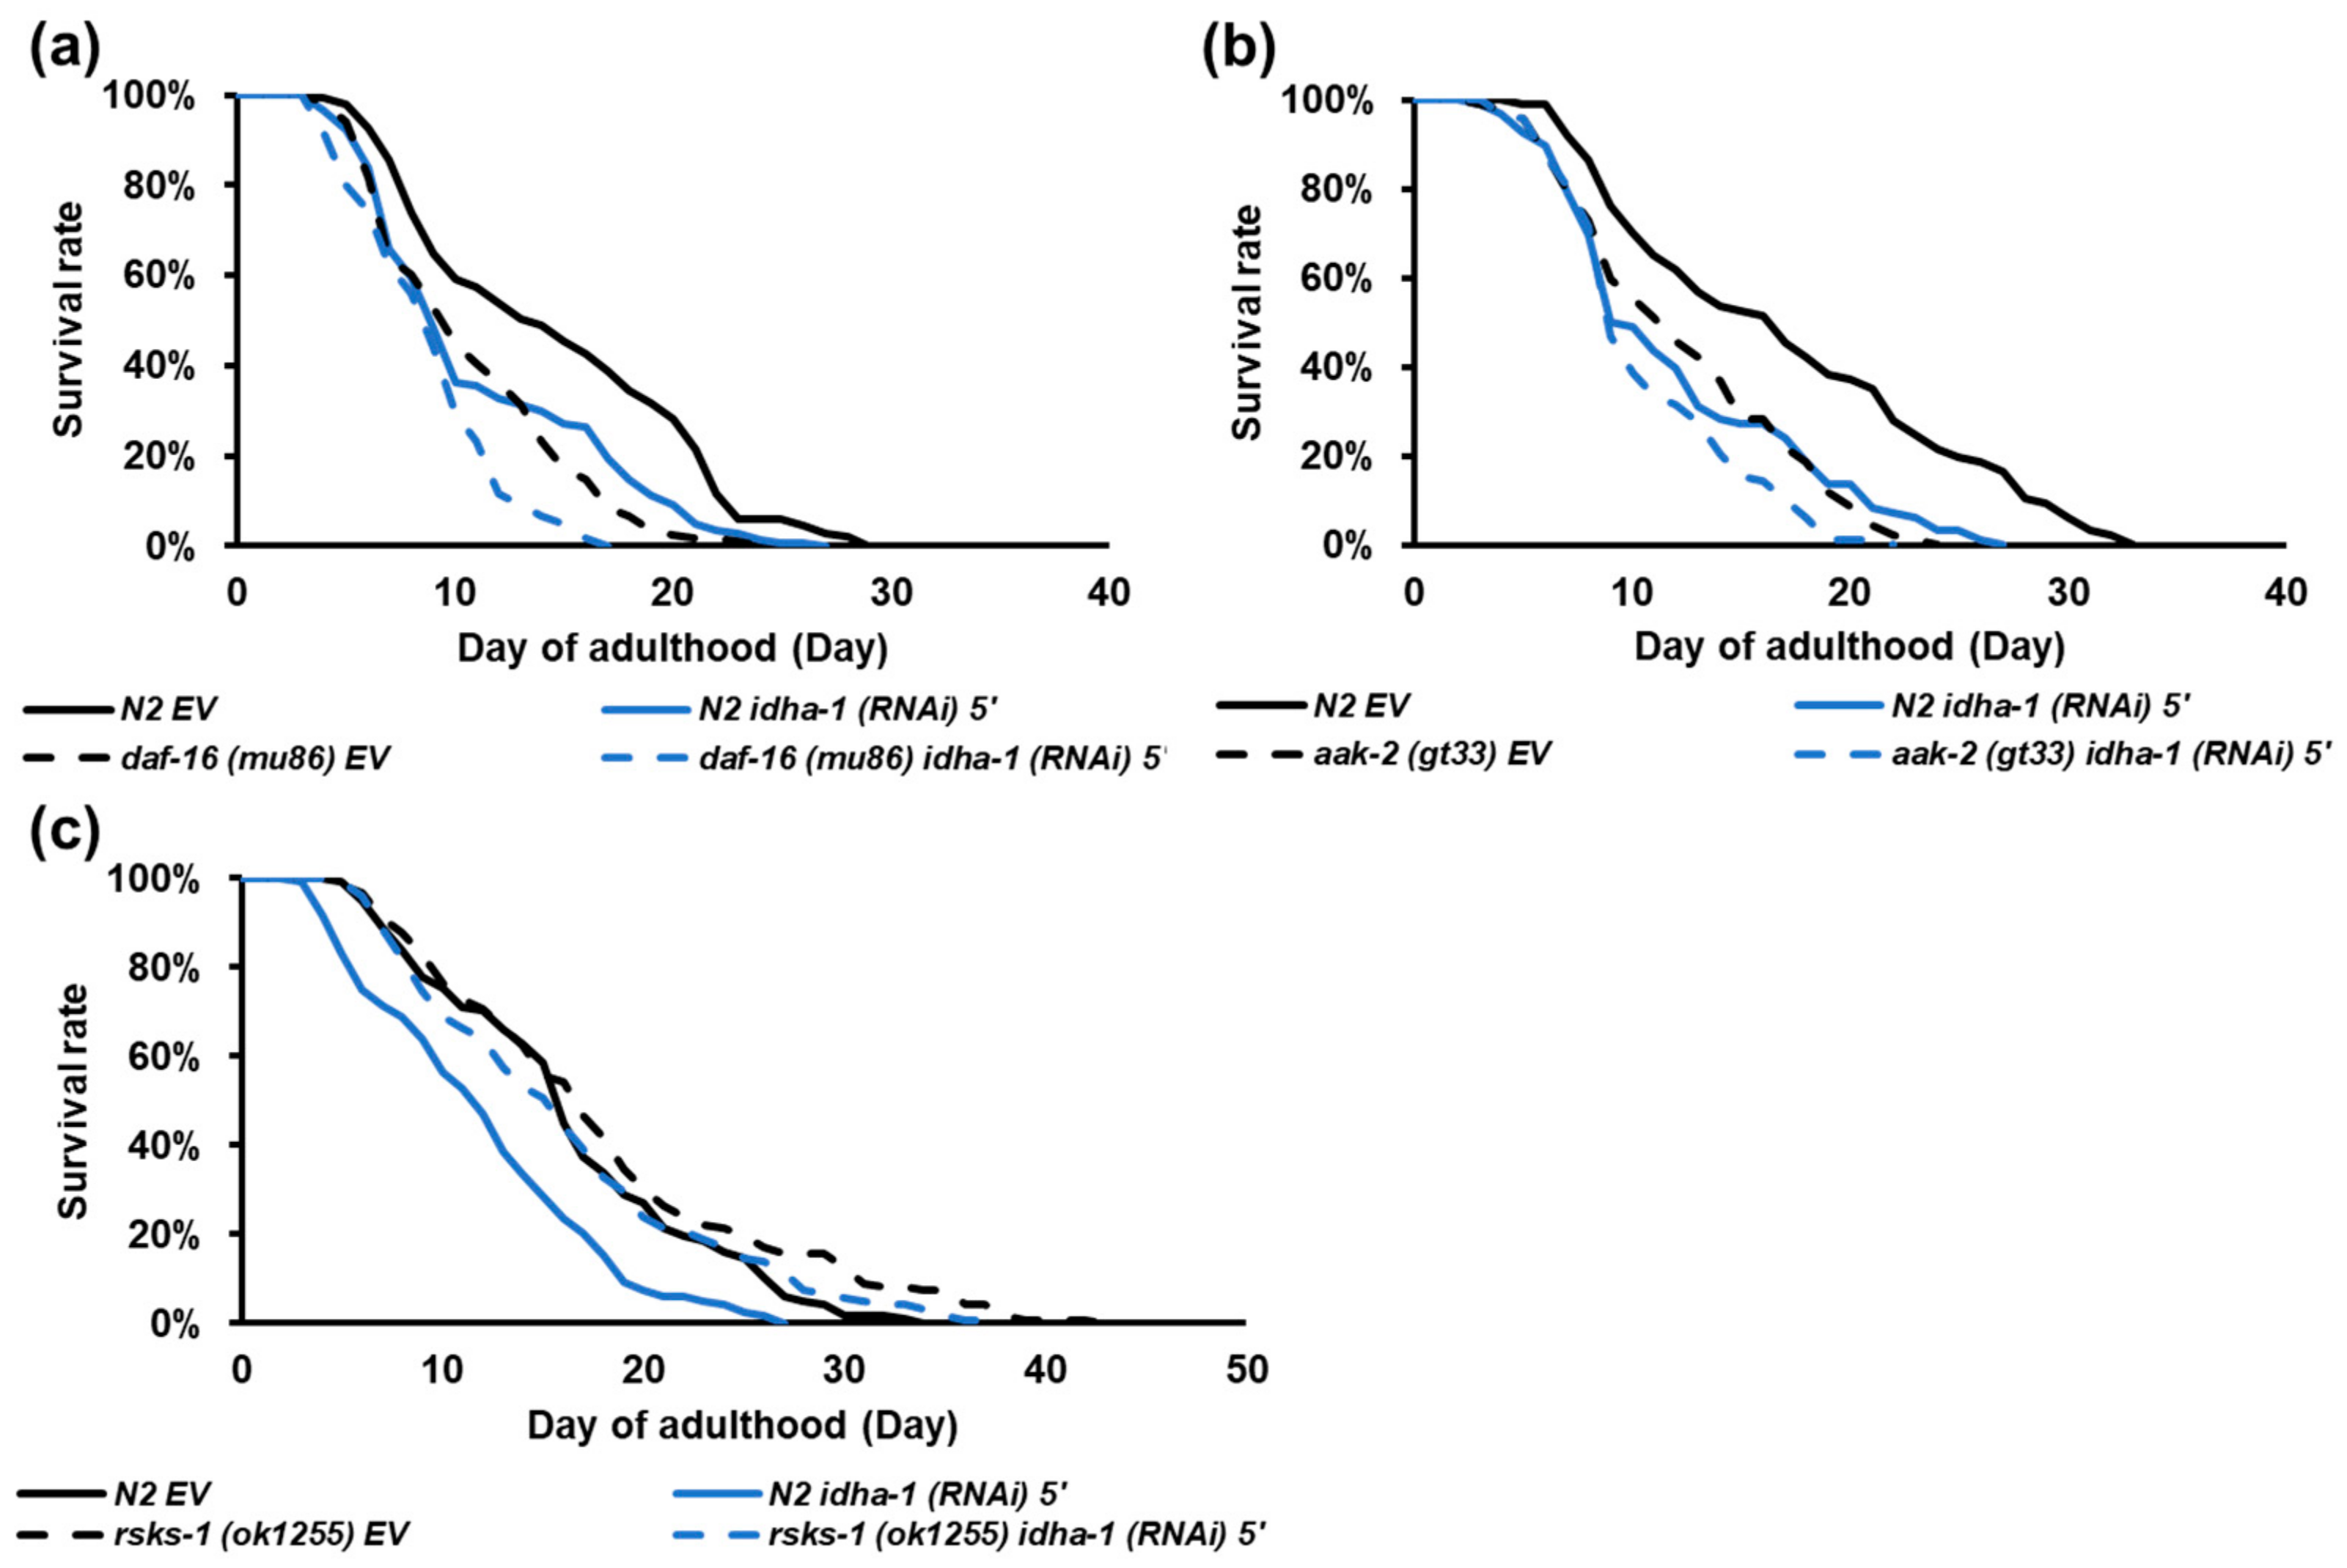
2.4. idha-1 Plays A Role in Dietary Restriction Induced Longevity
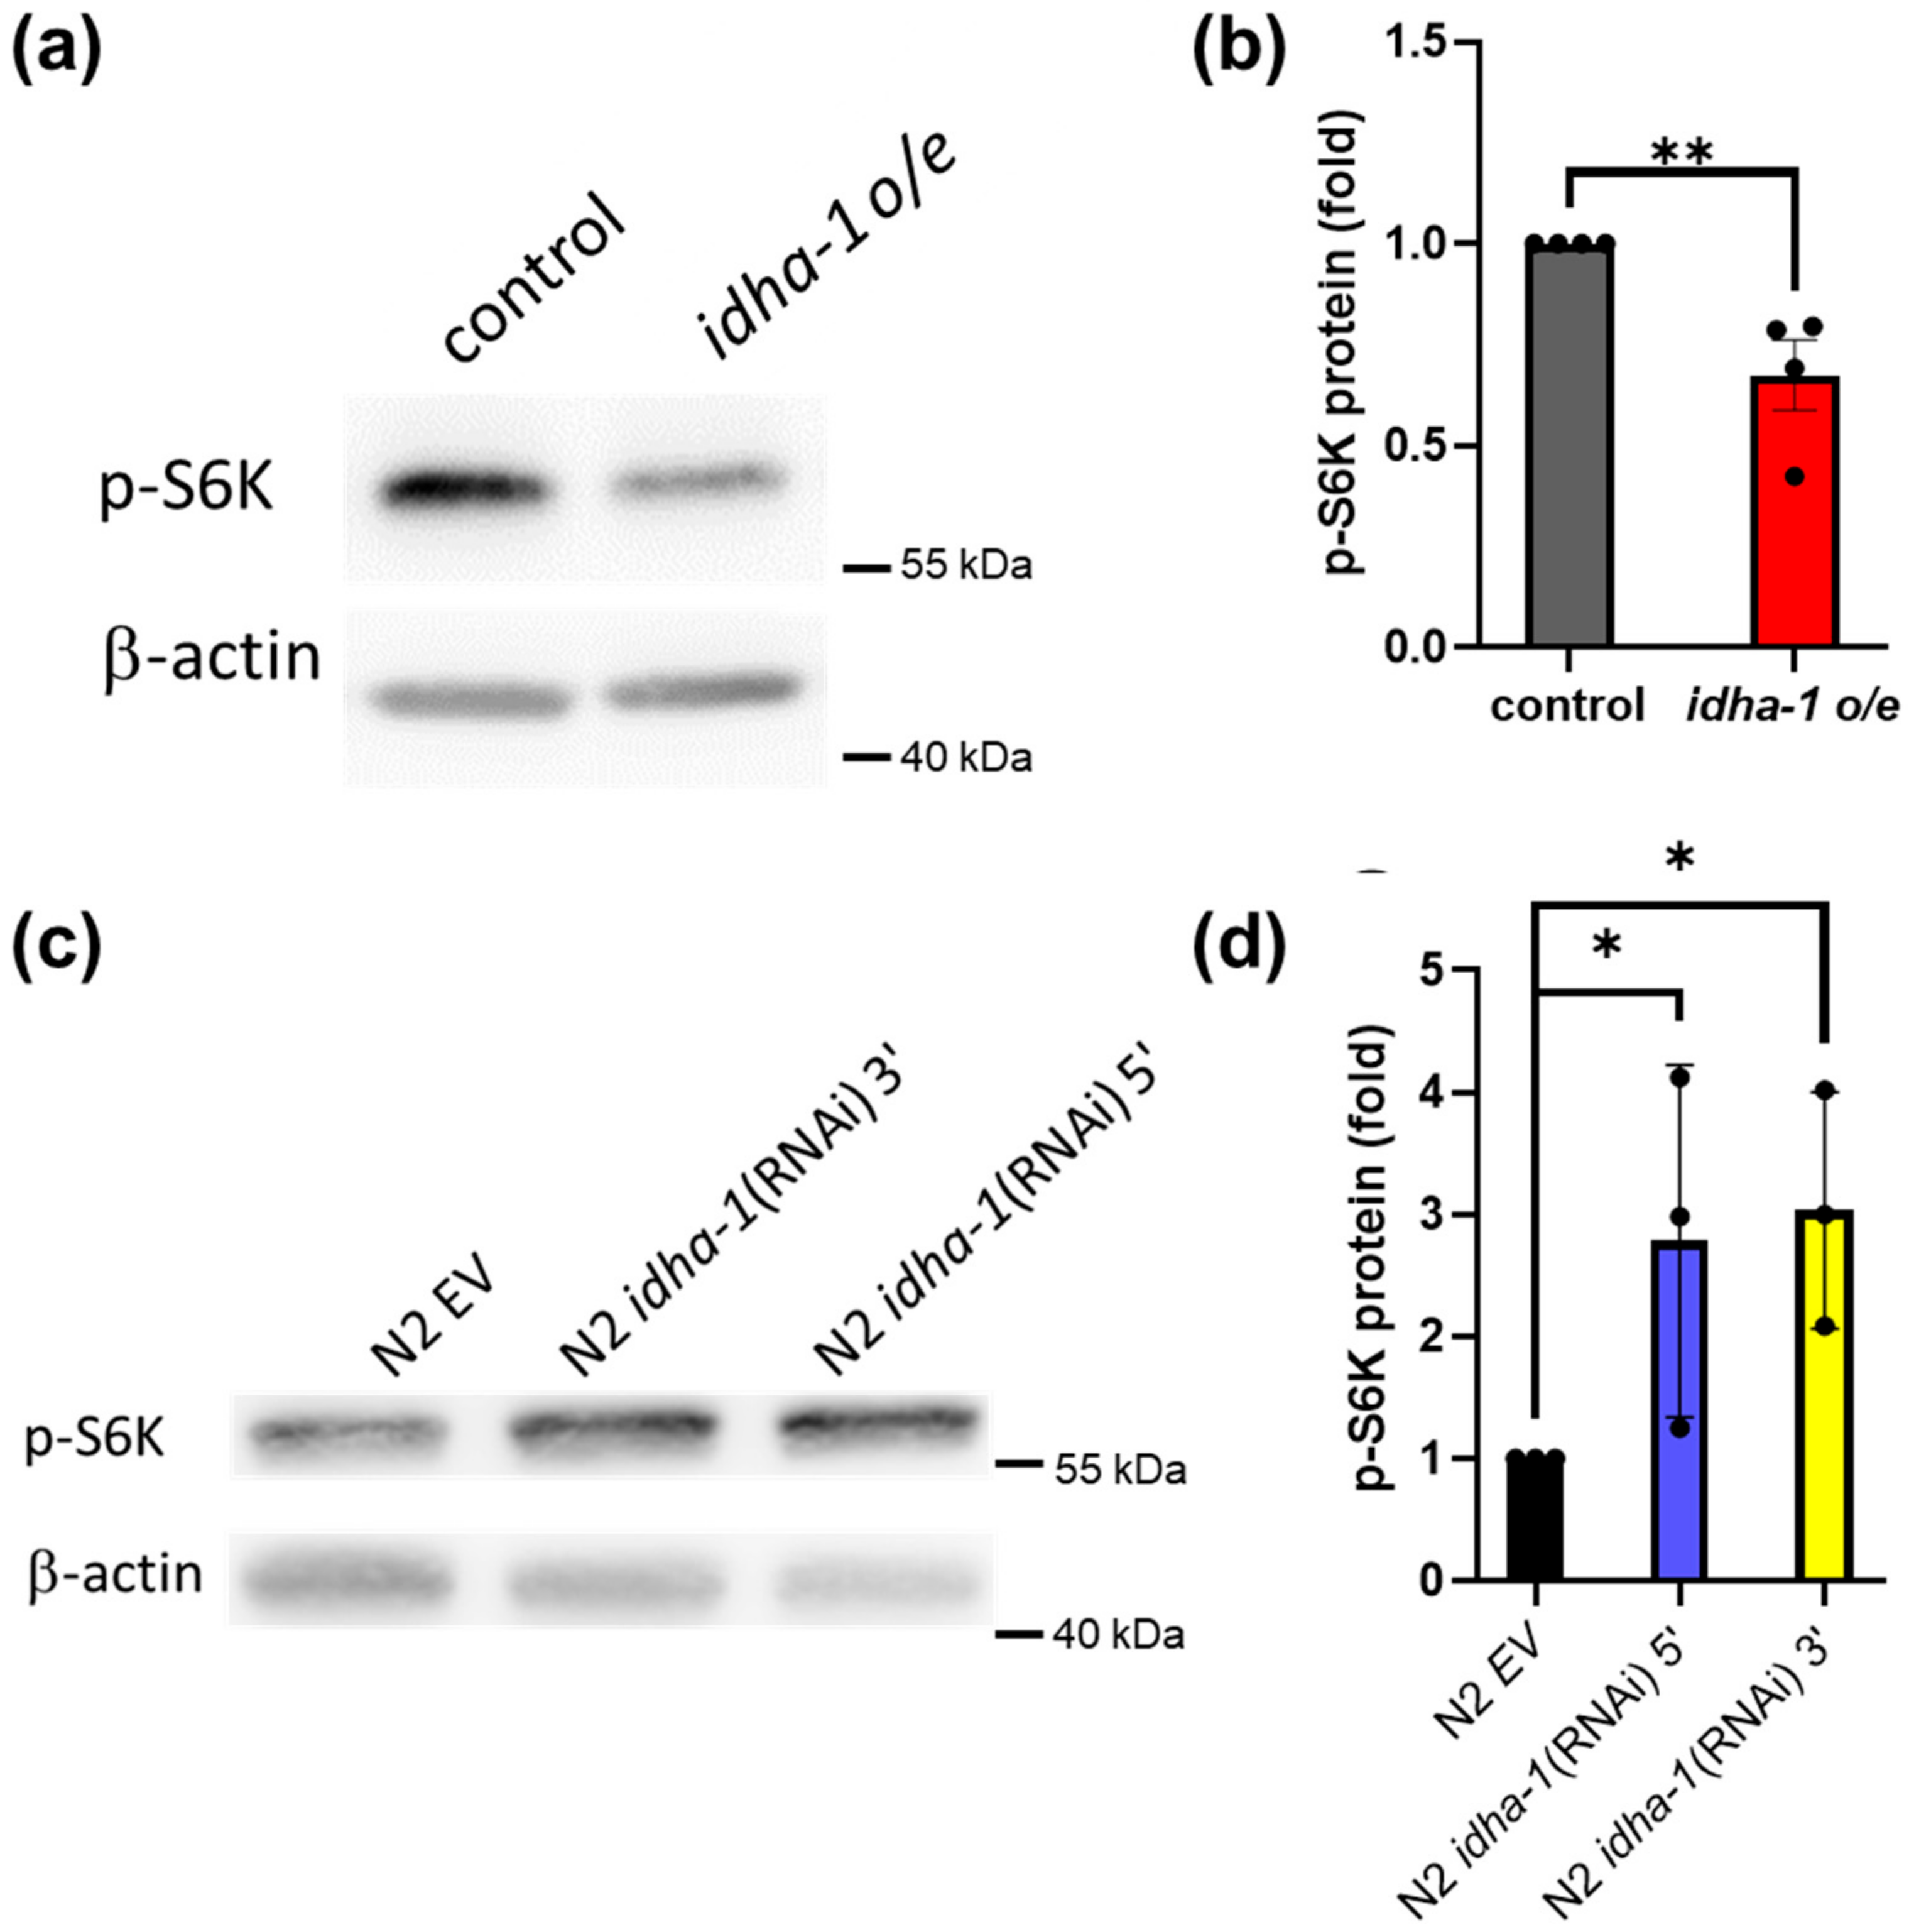
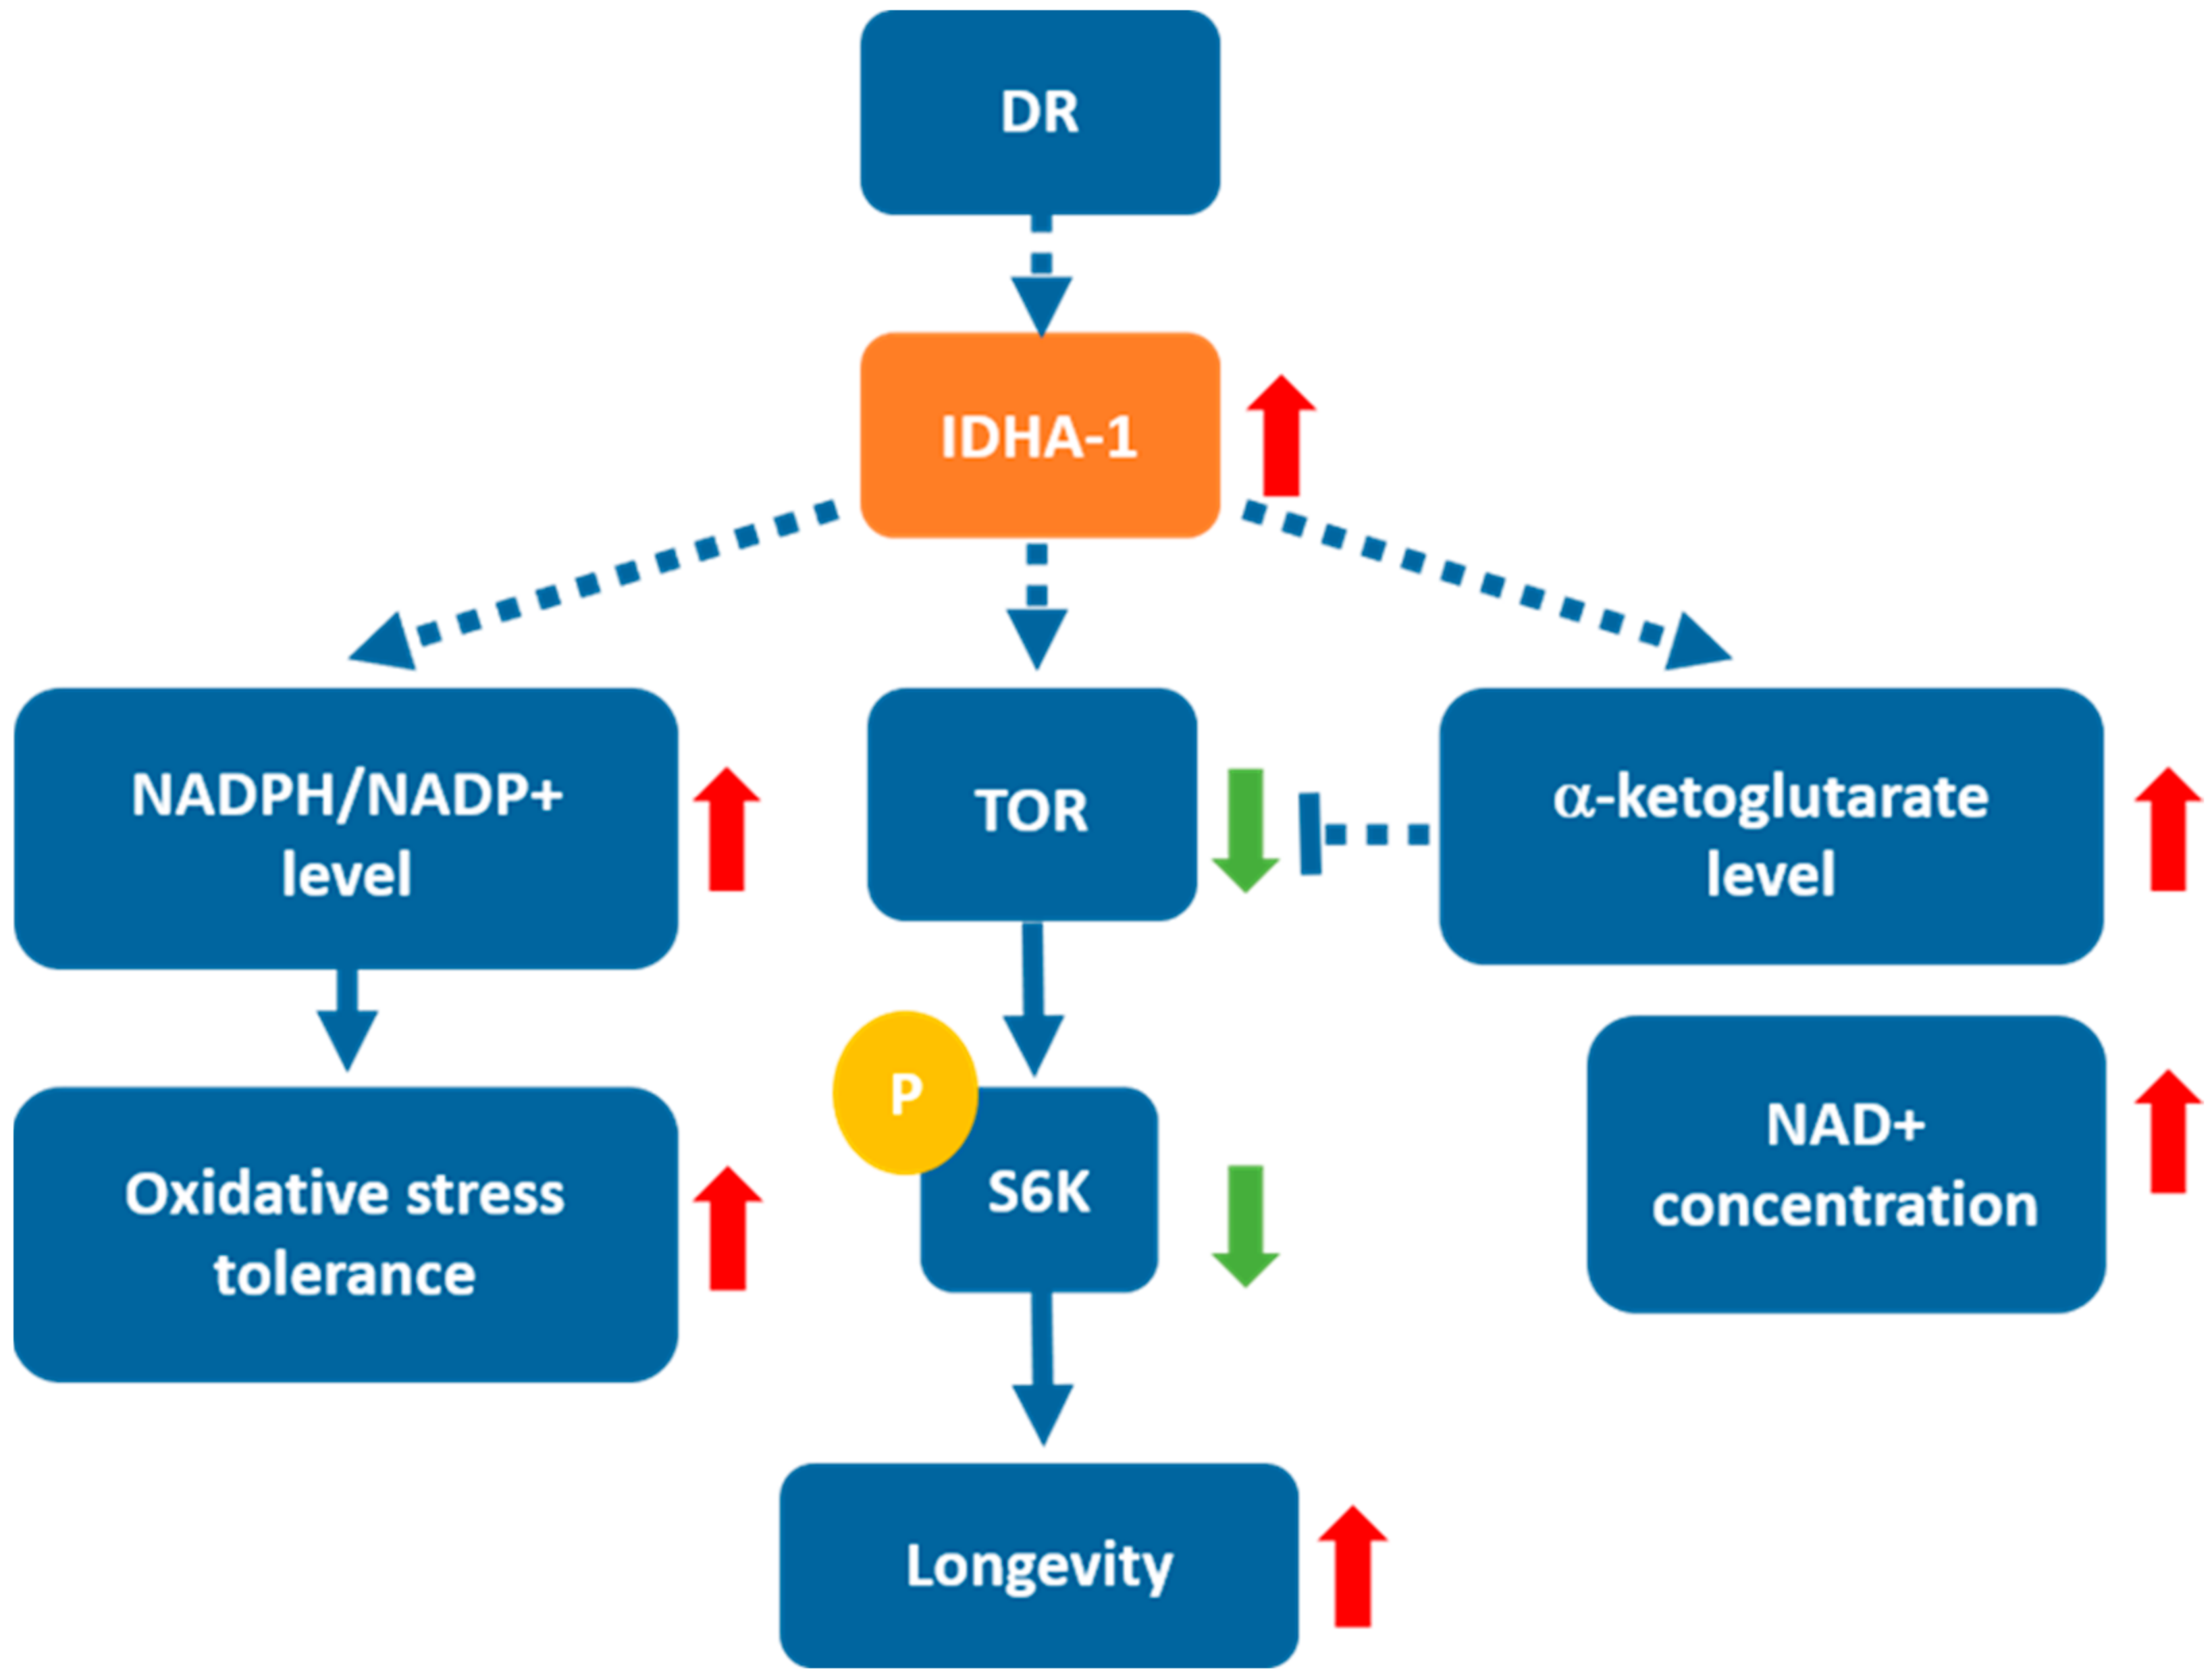
2.5. Expression of idha-1 May Regulate Lifespan via Inversely Modulating TOR Signaling
3. Discussion
4. Materials and Methods
4.1. Generation of RNA Interference Constructs against idha-1
4.2. Generation of idha-1 Overexpression Transgenic Worms
4.3. Lifespan Analysis and Oxidative Stress Assay
4.4. Western Blot
4.5. RNA Extraction and qRT-PCR
4.6. Measurement of α-Ketoglutarate Level
4.7. NADPH/NADP+ and NAD+/NADH Quantification
Supplementary Materials
Author Contributions
Funding
Institutional Review Board Statement
Informed Consent Statement
Data Availability Statement
Acknowledgments
Conflicts of Interest
References
- Kirkwood, T.B. Evolution of ageing. Mech. Ageing Dev. 2002, 123, 737–745. [Google Scholar] [CrossRef]
- Riera, C.E.; Dillin, A. Tipping the metabolic scales towards increased longevity in mammals. Nat. Cell Biol. 2015, 17, 196–203. [Google Scholar] [CrossRef] [PubMed]
- Kennedy, B.K.; Steffen, K.K.; Kaeberlein, M. Ruminations on dietary restriction and aging. Cell. Mol. Life Sci. 2007, 64, 1323–1328. [Google Scholar] [CrossRef]
- Green, C.L.; Lamming, D.W.; Fontana, L. Molecular mechanisms of dietary restriction promoting health and longevity. Nat. Rev. Mol. Cell Biol. 2022, 23, 56–73. [Google Scholar] [CrossRef] [PubMed]
- Soultoukis, G.A.; Partridge, L. Dietary Protein, Metabolism, and Aging. Annu. Rev. Biochem. 2016, 85, 5–34. [Google Scholar] [CrossRef] [PubMed] [Green Version]
- Fontana, L.; Partridge, L. Promoting Health and Longevity through Diet: From Model Organisms to Humans. Cell 2015, 161, 106–118. [Google Scholar] [CrossRef] [Green Version]
- Kenyon, C.J. The genetics of ageing. Nature 2010, 464, 504–512. [Google Scholar] [CrossRef]
- Stanfel, M.N.; Shamieh, L.S.; Kaeberlein, M.; Kennedy, B.K. The TOR pathway comes of age. Biochim. Biophys. Acta 2009, 1790, 1067–1074. [Google Scholar] [CrossRef] [Green Version]
- Johnson, S.C.; Rabinovitch, P.S.; Kaeberlein, M. mTOR is a key modulator of ageing and age-related disease. Nature 2013, 493, 338–345. [Google Scholar] [CrossRef] [Green Version]
- Vellai, T.; Takacs-Vellai, K.; Zhang, Y.; Kovacs, A.L.; Orosz, L.; Muller, F. Genetics: Influence of TOR kinase on lifespan in C. elegans. Nature 2003, 426, 620. [Google Scholar] [CrossRef]
- Harrison, D.E.; Strong, R.; Sharp, Z.D.; Nelson, J.F.; Astle, C.M.; Flurkey, K.; Nadon, N.L.; Wilkinson, J.E.; Frenkel, K.; Carter, C.S.; et al. Rapamycin fed late in life extends lifespan in genetically heterogeneous mice. Nature 2009, 460, 392–395. [Google Scholar] [CrossRef] [PubMed] [Green Version]
- Hansen, M.; Taubert, S.; Crawford, D.; Libina, N.; Lee, S.-J.; Kenyon, C. Lifespan extension by conditions that inhibit translation in Caenorhabditis elegans. Aging Cell 2007, 6, 95–110. [Google Scholar] [CrossRef] [PubMed] [Green Version]
- Kaeberlein, M.; Powers, R.W., 3rd; Steffen, K.K.; Westman, E.A.; Hu, D.; Dang, N.; Kerr, E.O.; Kirkland, K.T.; Fields, S.; Kennedy, B.K. Regulation of yeast replicative life span by TOR and Sch9 in response to nutrients. Science 2005, 310, 1193–1196. [Google Scholar] [CrossRef] [PubMed] [Green Version]
- Kapahi, P.; Zid, B.M.; Harper, T.; Koslover, D.; Sapin, V.; Benzer, S. Regulation of lifespan in Drosophila by modulation of genes in the TOR signaling pathway. Curr. Biol. 2004, 14, 885–890. [Google Scholar] [CrossRef] [Green Version]
- Lopez-Otin, C.; Blasco, M.A.; Partridge, L.; Serrano, M.; Kroemer, G. The hallmarks of aging. Cell 2013, 153, 1194–1217. [Google Scholar] [CrossRef] [Green Version]
- Katewa, S.D.; Khanna, A.; Kapahi, P. Mitobolites: The elixir of life. Cell Metab. 2014, 20, 8–9. [Google Scholar] [CrossRef] [Green Version]
- Chin, R.M.; Fu, X.; Pai, M.Y.; Vergnes, L.; Hwang, H.; Deng, G.; Diep, S.; Lomenick, B.; Meli, V.S.; Monsalve, G.C.; et al. The metabolite α-ketoglutarate extends lifespan by inhibiting ATP synthase and TOR. Nature 2014, 510, 397–401. [Google Scholar] [CrossRef] [Green Version]
- Mouchiroud, L.; Molin, L.; Kasturi, P.; Triba, M.N.; Dumas, M.E.; Wilson, M.C.; Halestrap, A.P.; Roussel, D.; Masse, I.; Dallière, N.; et al. Pyruvate imbalance mediates metabolic reprogramming and mimics lifespan extension by dietary restriction in Caenorhabditis elegans. Aging Cell 2011, 10, 39–54. [Google Scholar] [CrossRef]
- Mishur, R.J.; Khan, M.; Munkácsy, E.; Sharma, L.; Bokov, A.; Beam, H.; Radetskaya, O.; Borror, M.; Lane, R.; Bai, Y.; et al. Mitochondrial metabolites extend lifespan. Aging Cell 2016, 15, 336–348. [Google Scholar] [CrossRef]
- Su, Y.; Wang, T.; Wu, N.; Li, D.; Fan, X.; Xu, Z.; Mishra, S.K.; Yang, M. Alpha-ketoglutarate extends Drosophila lifespan by inhibiting mTOR and activating AMPK. Aging 2019, 11, 4183–4197. [Google Scholar] [CrossRef]
- Fan, S.; Lin, C.; Wei, Y.; Yeh, S.; Tsai, Y.; Lee, A.C.; Lin, W.; Wang, P. Dietary citrate supplementation enhances longevity, metabolic health, and memory performance through promoting ketogenesis. Aging Cell 2021, 20, e13510. [Google Scholar] [CrossRef] [PubMed]
- Edwards, C.B.; Copes, N.; Brito, A.G.; Canfield, J.; Bradshaw, P.C. Malate and Fumarate Extend Lifespan in Caenorhabditis elegans. PLoS ONE 2013, 8, e58345. [Google Scholar] [CrossRef] [PubMed] [Green Version]
- Shahmirzadi, A.A.; Edgar, D.; Liao, C.-Y.; Hsu, Y.-M.; Lucanic, M.; Shahmirzadi, A.A.; Wiley, C.D.; Gan, G.; Kim, D.E.; Kasler, H.G.; et al. Alpha-Ketoglutarate, an Endogenous Metabolite, Extends Lifespan and Compresses Morbidity in Aging Mice. Cell Metab. 2020, 32, 447–456.e6. [Google Scholar] [CrossRef] [PubMed]
- Gyanwali, B.; Lim, Z.X.; Soh, J.; Lim, C.; Guan, S.P.; Goh, J.; Maier, A.B.; Kennedy, B.K. Alpha-Ketoglutarate dietary supplementation to improve health in humans. Trends Endocrinol. Metab. 2022, 33, 136–146. [Google Scholar] [CrossRef] [PubMed]
- Butler, J.A.; Mishur, R.J.; Bhaskaran, S.; Rea, S.L. A metabolic signature for long life in the Caenorhabditis elegans Mit mutants. Aging Cell 2013, 12, 130–138. [Google Scholar] [CrossRef] [Green Version]
- Gabriel, J.L.; Zervos, P.R.; Plaut, G.W. Activity of purified NAD-specific isocitrate dehydrogenase at modulator and substrate concentrations approximating conditions in mitochondria. Metabolism 1986, 35, 661–667. [Google Scholar] [CrossRef]
- Wang, H.-D.; Kazemi-Esfarjani, P.; Benzer, S. Multiple-stress analysis for isolation of Drosophila longevity genes. Proc. Natl. Acad. Sci. USA 2004, 101, 12610–12615. [Google Scholar] [CrossRef] [Green Version]
- Wang, C.-T.; Chen, Y.-C.; Wang, Y.-Y.; Huang, M.-H.; Yen, T.-L.; Li, H.; Liang, C.-J.; Sang, T.-K.; Ciou, S.-C.; Yuh, C.-H.; et al. Reduced neuronal expression of ribose-5-phosphate isomerase enhances tolerance to oxidative stress, extends lifespan, and attenuates polyglutamine toxicity in Drosophila. Aging Cell 2012, 11, 93–103. [Google Scholar] [CrossRef] [Green Version]
- Liu, Y.L.; Lu, W.C.; Brummel, T.J.; Yuh, C.H.; Lin, P.T.; Kao, T.Y.; Li, F.Y.; Liao, P.C.; Benzer, S.; Wang, H.D. Reduced expression of alpha-1,2-mannosidase I extends lifespan in Drosophila melanogaster and Caenorhabditis elegans. Aging Cell 2009, 8, 370–379. [Google Scholar] [CrossRef] [Green Version]
- Lin, Y.H.; Chen, Y.C.; Kao, T.Y.; Lin, Y.C.; Hsu, T.E.; Wu, Y.C.; Ja, W.W.; Brummel, T.J.; Kapahi, P.; Yuh, C.H.; et al. Diacylglycerol lipase regulates lifespan and oxidative stress response by inversely modulating TOR signaling in Drosophila and C. elegans. Aging Cell 2014, 13, 755–764. [Google Scholar] [CrossRef]
- Someya, S.; Yu, W.; Hallows, W.C.; Xu, J.; Vann, J.M.; Leeuwenburgh, C.; Tanokura, M.; Denu, J.M.; Prolla, T.A. Sirt3 Mediates Reduction of Oxidative Damage and Prevention of Age-Related Hearing Loss under Caloric Restriction. Cell 2010, 143, 802–812. [Google Scholar] [CrossRef] [PubMed] [Green Version]
- Da Cunha, G.L.; de Oliveira, A.K. Citric acid cycle: A mainstream metabolic pathway influencing life span in Drosophila melanogaster? Exp. Gerontol. 1996, 31, 705–715. [Google Scholar] [CrossRef] [PubMed]
- Amador-Noguez, D.; Yagi, K.; Venable, S.; Darlington, G. Gene expression profile of long-lived Ames dwarf mice and Little mice. Aging Cell 2004, 3, 423–441. [Google Scholar] [CrossRef] [PubMed]
- Perron, J.T.; Tyson, R.L.; Sutherland, G.R. Maintenance of tricarboxylic acid cycle kinetics in Brown–Norway Fischer 344 rats may translate to longevity. Neurosci. Lett. 2000, 281, 91–94. [Google Scholar] [CrossRef]
- Gorrini, C.; Harris, I.S.; Mak, T.W. Modulation of oxidative stress as an anticancer strategy. Nat. Rev. Drug Discov. 2013, 12, 931–947. [Google Scholar] [CrossRef]
- Bar, D.Z.; Charar, C.; Dorfman, J.; Yadid, T.; Tafforeau, L.; Lafontaine, D.L.J.; Gruenbaum, Y. Cell size and fat content of dietary-restricted Caenorhabditis elegans are regulated by ATX-2, an mTOR repressor. Proc. Natl. Acad. Sci. USA 2016, 113, E4620–E4629. [Google Scholar] [CrossRef] [Green Version]
- Santos, J.; Leitão-Correia, F.; Sousa, M.J.; Leão, C. Dietary Restriction and Nutrient Balance in Aging. Oxidative Med. Cell. Longev. 2015, 2016, 4010357. [Google Scholar] [CrossRef] [Green Version]
- Kapahi, P.; Kaeberlein, M.; Hansen, M. Dietary restriction and lifespan: Lessons from invertebrate models. Ageing Res. Rev. 2017, 39, 3–14. [Google Scholar] [CrossRef]
- Hansen, M.; Rubinsztein, D.C.; Walker, D.W. Autophagy as a promoter of longevity: Insights from model organisms. Nat. Rev. Mol. Cell. Biol. 2018, 19, 579–593. [Google Scholar] [CrossRef]
- Chen, C.; Zhou, M.; Ge, Y.; Wang, X. SIRT1 and aging related signaling pathways. Mech. Ageing Dev. 2020, 187, 111215. [Google Scholar] [CrossRef]
- Rahman, S.; Islam, R. Mammalian Sirt1: Insights on its biological functions. Cell Commun. Signal. 2011, 9, 11. [Google Scholar] [CrossRef] [Green Version]
- Berdichevsky, A.; Viswanathan, M.; Horvitz, H.R.; Guarente, L.C. elegans SIR-2.1 Interacts with 14-3-3 Proteins to Activate DAF-16 and Extend Life Span. Cell 2006, 125, 1165–1177. [Google Scholar] [CrossRef] [Green Version]
- Cantó, C.; Menzies, K.J.; Auwerx, J. NAD+ Metabolism and the Control of Energy Homeostasis: A Balancing Act between Mitochondria and the Nucleus. Cell Metab. 2015, 22, 31–53. [Google Scholar] [CrossRef] [Green Version]
- Kang, W.; Suzuki, M.; Saito, T.; Miyado, K. Emerging Role of TCA Cycle-Related Enzymes in Human Diseases. Int. J. Mol. Sci. 2021, 22, 13057. [Google Scholar] [CrossRef]
- Martínez-Reyes, I.; Chandel, N.S. Mitochondrial TCA cycle metabolites control physiology and disease. Nat. Commun. 2020, 11, 102. [Google Scholar] [CrossRef]


Disclaimer/Publisher’s Note: The statements, opinions and data contained in all publications are solely those of the individual author(s) and contributor(s) and not of MDPI and/or the editor(s). MDPI and/or the editor(s) disclaim responsibility for any injury to people or property resulting from any ideas, methods, instructions or products referred to in the content. |
© 2022 by the authors. Licensee MDPI, Basel, Switzerland. This article is an open access article distributed under the terms and conditions of the Creative Commons Attribution (CC BY) license (https://creativecommons.org/licenses/by/4.0/).
Share and Cite
Lin, Z.-H.; Chang, S.-Y.; Shen, W.-C.; Lin, Y.-H.; Shen, C.-L.; Liao, S.-B.; Liu, Y.-C.; Chen, C.-S.; Ching, T.-T.; Wang, H.-D. Isocitrate Dehydrogenase Alpha-1 Modulates Lifespan and Oxidative Stress Tolerance in Caenorhabditis elegans. Int. J. Mol. Sci. 2023, 24, 612. https://doi.org/10.3390/ijms24010612
Lin Z-H, Chang S-Y, Shen W-C, Lin Y-H, Shen C-L, Liao S-B, Liu Y-C, Chen C-S, Ching T-T, Wang H-D. Isocitrate Dehydrogenase Alpha-1 Modulates Lifespan and Oxidative Stress Tolerance in Caenorhabditis elegans. International Journal of Molecular Sciences. 2023; 24(1):612. https://doi.org/10.3390/ijms24010612
Chicago/Turabian StyleLin, Zhi-Han, Shun-Ya Chang, Wen-Chi Shen, Yen-Hung Lin, Chiu-Lun Shen, Sin-Bo Liao, Yu-Chun Liu, Chang-Shi Chen, Tsui-Ting Ching, and Horng-Dar Wang. 2023. "Isocitrate Dehydrogenase Alpha-1 Modulates Lifespan and Oxidative Stress Tolerance in Caenorhabditis elegans" International Journal of Molecular Sciences 24, no. 1: 612. https://doi.org/10.3390/ijms24010612