
Transcriptomic Studies of Antidepressant Action in Rodent Models of Depression: A First Meta-Analysis

 ,
,  , , and
Abstract
:1. Introduction
2. Results
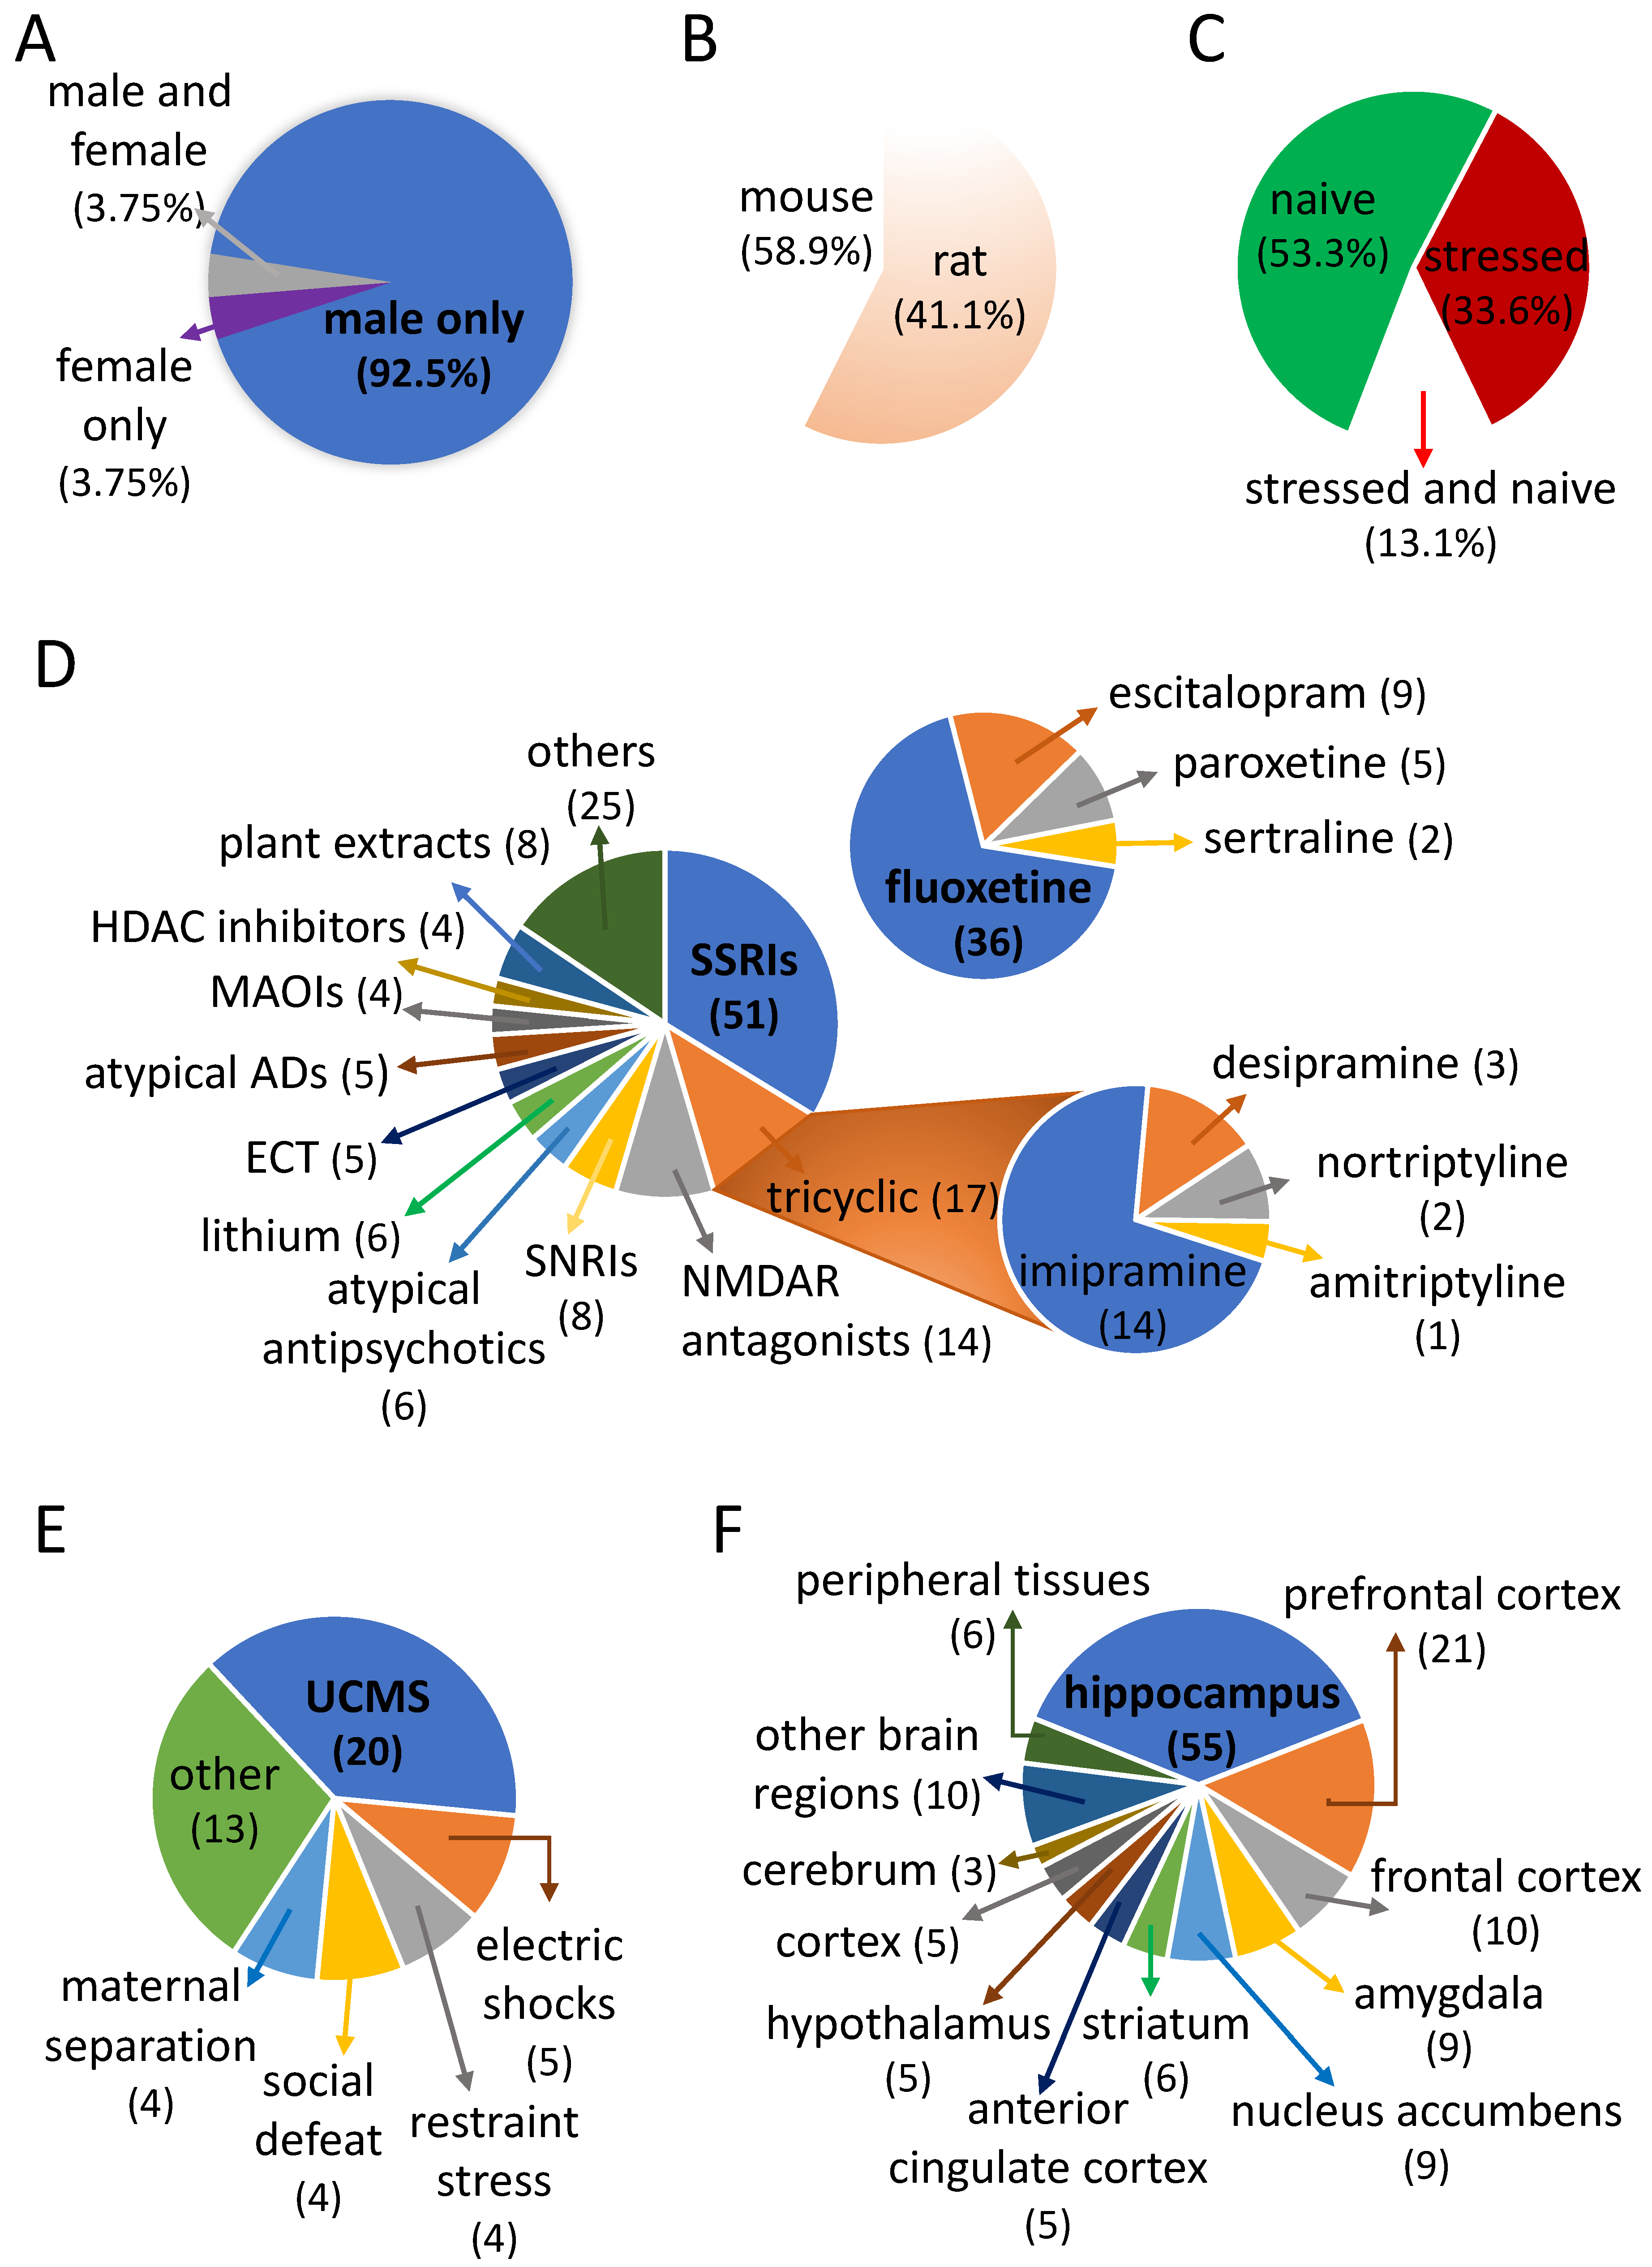
2.1. Preponderance of Studies Investigating the Effect of Fluoxetine
2.2. Signature of FLX Response in Stressed Rodents
2.3. Signature of FLX Response in Naive Rodents
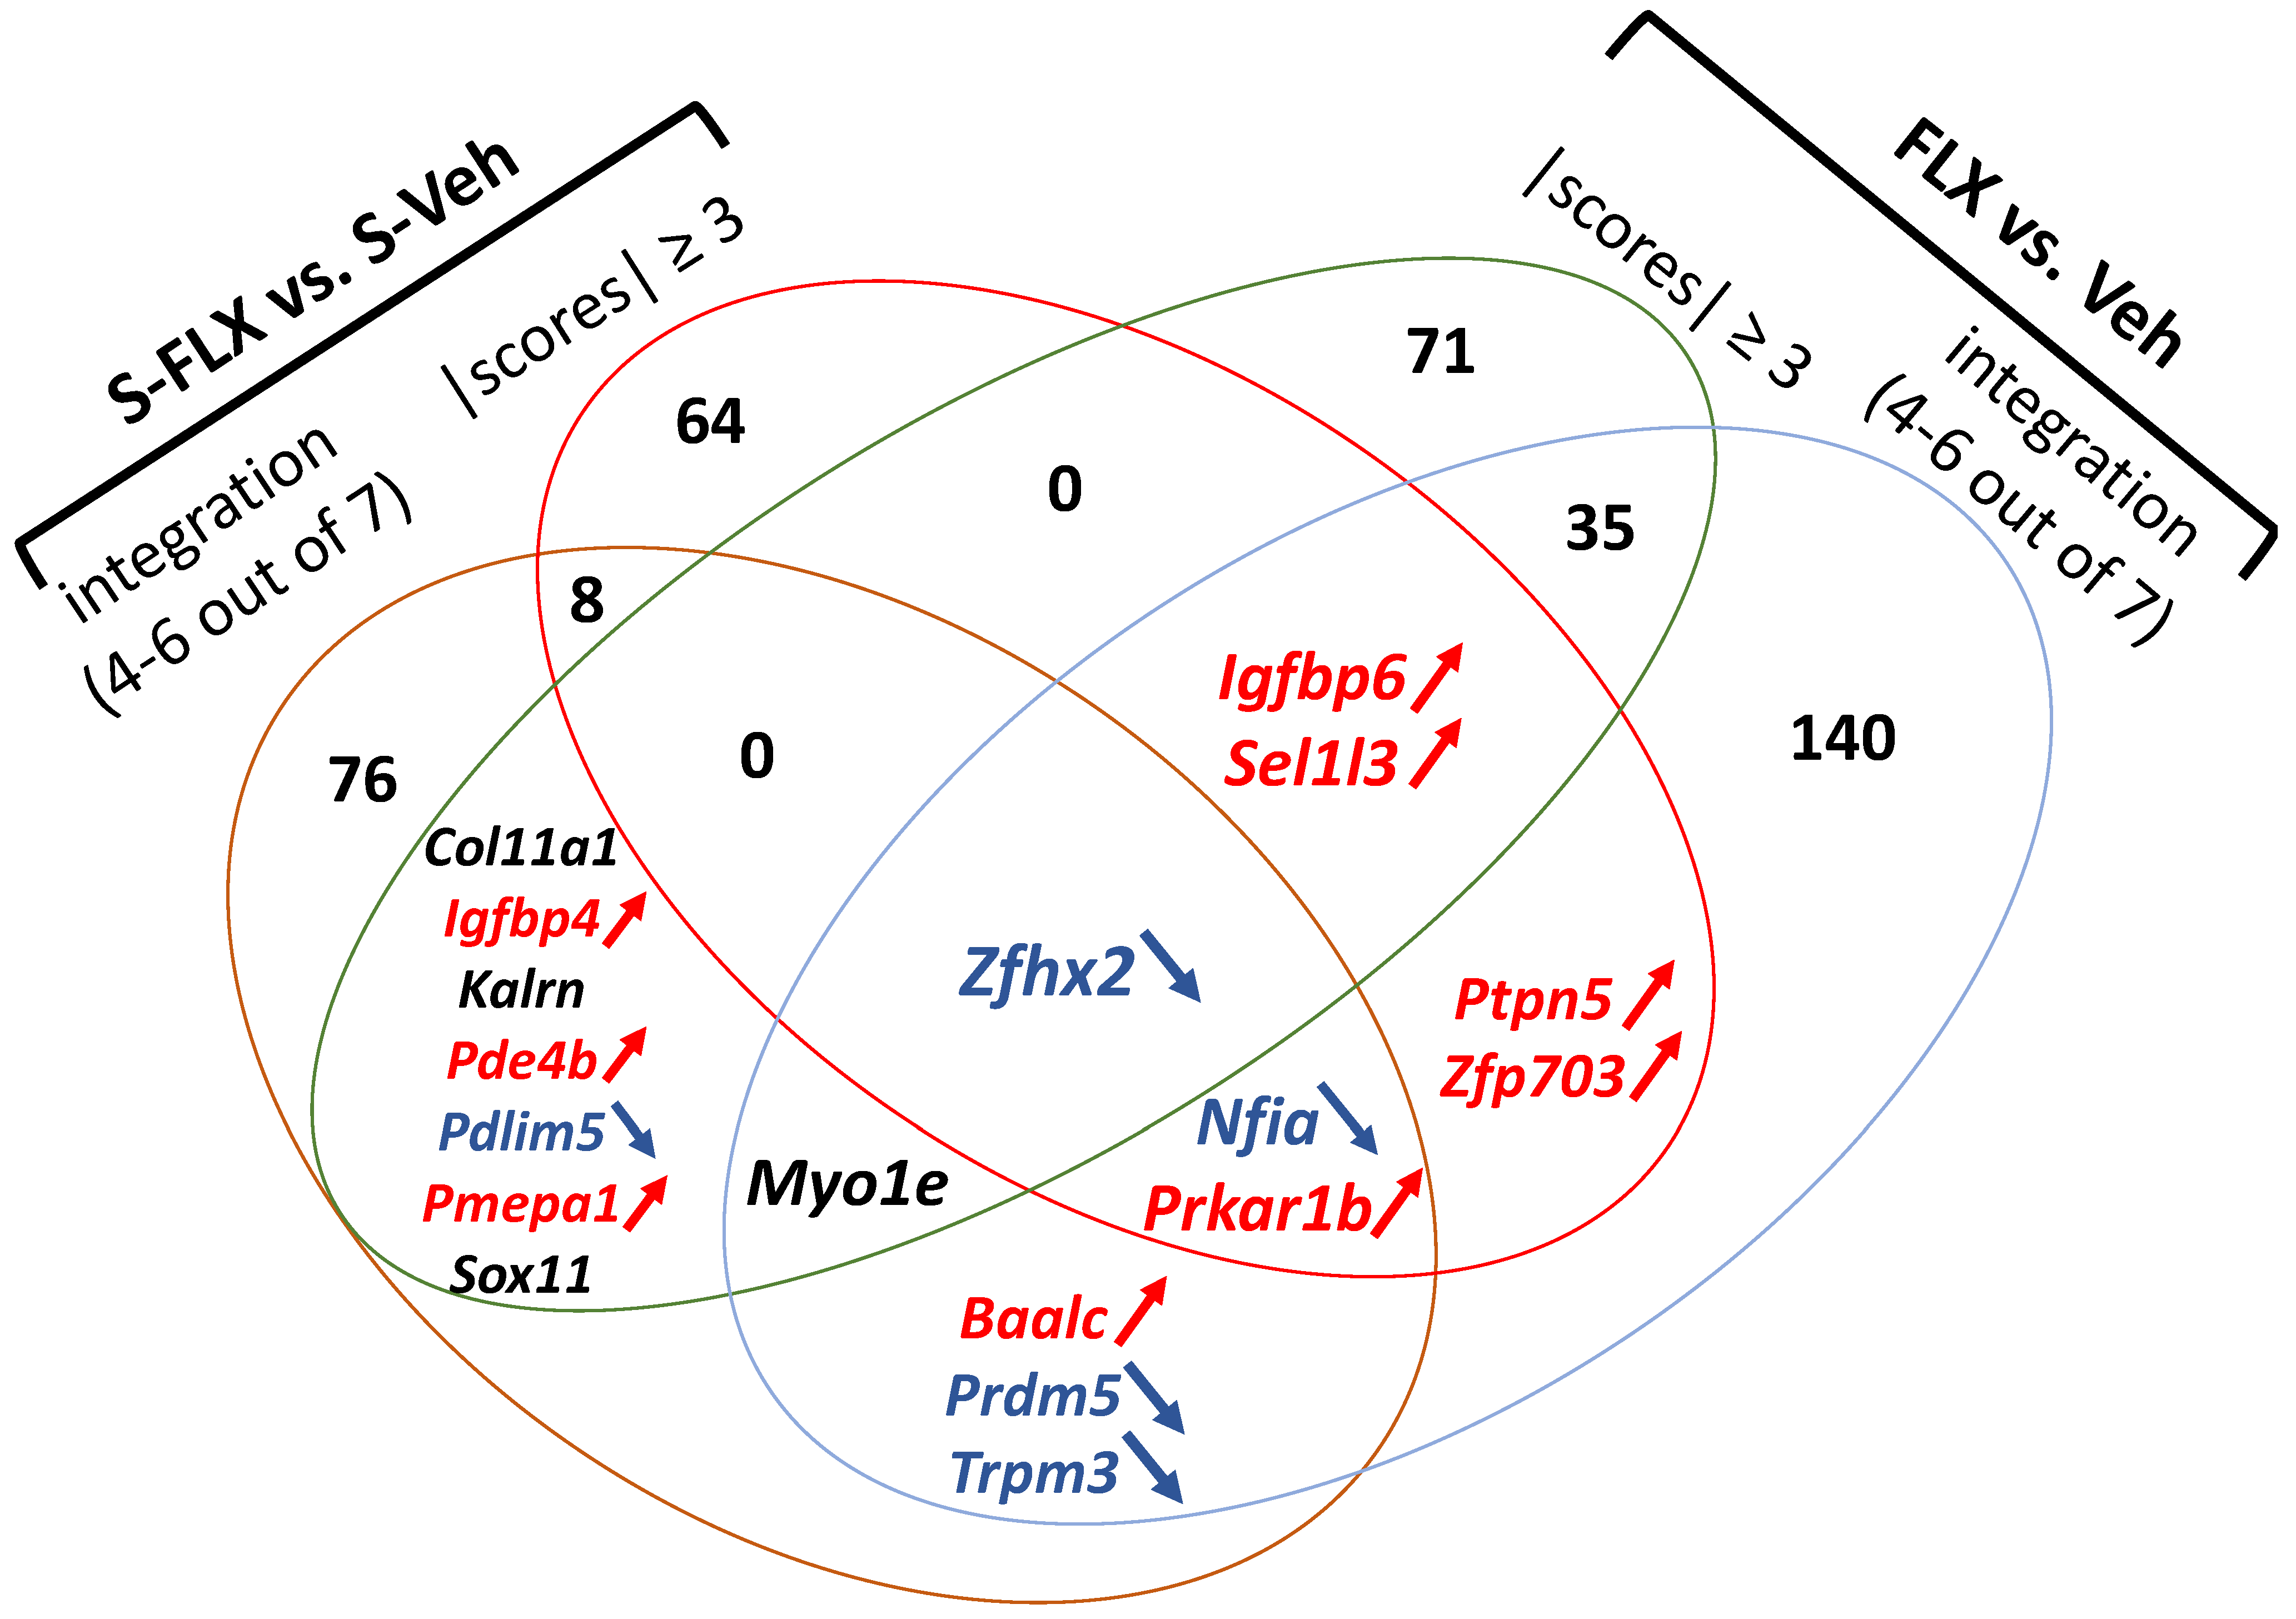
2.4. Shared Signature of FLX in Stressed and Naïve Rodents
3. Discussion
3.1. Methodological Constraints
3.1.1. Current Picture: A Fragmented Landscape
3.1.2. Methodological Choices
3.2. Biological Pathways and Genes
3.2.1. Serotonin System and BDNF
3.2.2. Immediate Early Genes
3.2.3. Signal Transduction Pathways
- a
- MAP kinases
- b
- WNT/catenin
- c
- PI3K/AKT
- d
- Cyclic AMP
- e
- Glucorticoïds
- f
- Synaptic plasticity
3.2.4. Emerging Pathways
4. Methods and Materials
4.1. Systematic Search of the Literature
4.2. Bioinformatic Analyses
4.2.1. Individual Reprocessing of Published Experiments—Microarrays
4.2.2. Individual Reprocessing of Published Experiments—RNA-Seq
4.3. Integration Analyses
4.4. Portraits of FLX Action
4.5. Ontological Analysis
5. Conclusions
Supplementary Materials
Author Contributions
Funding
Institutional Review Board Statement
Informed Consent Statement
Data Availability Statement
Acknowledgments
Conflicts of Interest
References
- Friedrich, M.J. Depression Is the Leading Cause of Disability around the World. JAMA 2017, 317, 1517. [Google Scholar] [CrossRef] [PubMed]
- Malhi, G.S.; Mann, J.J. Depression. Lancet 2018, 392, 2299–2312. [Google Scholar] [CrossRef]
- Hasin, D.S.; Sarvet, A.L.; Meyers, J.L.; Saha, T.D.; Ruan, W.J.; Stohl, M.; Grant, B.F. Epidemiology of Adult DSM-5 Major Depressive Disorder and Its Specifiers in the United States. JAMA Psychiatry 2018, 75, 336–346. [Google Scholar] [CrossRef] [Green Version]
- Perlis, R.H. Abandoning personalization to get to precision in the pharmacotherapy of depression. World Psychiatry 2016, 15, 228–235. [Google Scholar] [CrossRef] [Green Version]
- Cipriani, A.; Furukawa, T.A.; Salanti, G.; Chaimani, A.; Atkinson, L.Z.; Ogawa, Y.; Leucht, S.; Ruhe, H.G.; Turner, E.H.; Higgins, J.P.T.; et al. Comparative efficacy and acceptability of 21 antidepressant drugs for the acute treatment of adults with major depressive disorder: A systematic review and network meta-analysis. Lancet 2018, 391, 1357–1366. [Google Scholar] [CrossRef] [Green Version]
- Casarotto, P.C.; Girych, M.; Fred, S.M.; Kovaleva, V.; Moliner, R.; Enkavi, G.; Biojone, C.; Cannarozzo, C.; Sahu, M.P.; Kaurinkoski, K.; et al. Antidepressant drugs act by directly binding to TRKB neurotrophin receptors. Cell 2021, 184, 1299–1313.e19. [Google Scholar] [CrossRef]
- Trivedi, M.H.; Daly, E.J. Treatment strategies to improve and sustain remission in major depressive disorder. Dialogues Clin. Neurosci. 2008, 10, 377–384. [Google Scholar]
- Kraus, C.; Kadriu, B.; Zarate, C.A., Jr.; Kasper, S. Prognosis and improved outcomes in major depression: A review. Transl. Psychiatry 2019, 9, 12–17. [Google Scholar] [CrossRef] [Green Version]
- Le-Niculescu, H.; Roseberry, K.; Gill, S.S.; Levey, D.F.; Phalen, P.L.; Mullen, J.; Williams, A.; Bhairo, S.; Voegtline, T.; Davis, H.; et al. Precision medicine for mood disorders: Objective assessment, risk prediction, pharmacogenomics, and repurposed drugs. Mol. Psychiatry 2021, 26, 2776–2804. [Google Scholar] [CrossRef]
- Cook, I.A.; Congdon, E.; Krantz, D.E.; Hunter, A.M.; Coppola, G.; Hamilton, S.P.; Leuchter, A.F. Time Course of Changes in Peripheral Blood Gene Expression During Medication Treatment for Major Depressive Disorder. Front. Genet. 2019, 10, 870. [Google Scholar] [CrossRef]
- Pisanu, C.; Severino, G.; De Toma, I.; Dierssen, M.; Fusar-Poli, P.; Gennarelli, M.; Lio, P.; Maffioletti, E.; Maron, E.; Mehta, D.; et al. Transcriptional biomarkers of response to pharmacological treatments in severe mental disorders: A systematic review. Eur. Neuropsychopharmacol. 2022, 55, 112–157. [Google Scholar] [CrossRef] [PubMed]
- Mariani, N.; Cattane, N.; Pariante, C.; Cattaneo, A. Gene expression studies in Depression development and treatment: An overview of the underlying molecular mechanisms and biological processes to identify biomarkers. Transl. Psychiatry 2021, 11, 354. [Google Scholar] [CrossRef] [PubMed]
- Carrillo-Roa, T.; Labermaier, C.; Weber, P.; Herzog, D.P.; Lareau, C.; Santarelli, S.; Wagner, K.V.; Rex-Haffner, M.; Harbich, D.; Scharf, S.H.; et al. Common genes associated with antidepressant response in mouse and man identify key role of glucocorticoid receptor sensitivity. PLoS Biol. 2017, 15, e2002690. [Google Scholar] [CrossRef]
- Wang, Q.; Timberlake, M.A., 2nd; Prall, K.; Dwivedi, Y. The recent progress in animal models of depression. Prog. Neuropsychopharmacol. Biol. Psychiatry 2017, 77, 99–109. [Google Scholar] [CrossRef] [PubMed]
- Baker, M.; Hong, S.-I.; Kang, S.; Choi, D.-S. Rodent models for psychiatric disorders: Problems and promises. Lab. Anim. Res. 2020, 36, 9. [Google Scholar] [CrossRef] [PubMed] [Green Version]
- Scarpa, J.R.; Fatma, M.; Loh, Y.-H.E.; Traore, S.R.; Stefan, T.; Chen, T.H.; Nestler, E.J.; Labonté, B. Shared Transcriptional Signatures in Major Depressive Disorder and Mouse Chronic Stress Models. Biol. Psychiatry 2020, 88, 159–168. [Google Scholar] [CrossRef]
- Cathomas, F.; Murrough, J.W.; Nestler, E.J.; Han, M.-H.; Russo, S.J. Neurobiology of Resilience: Interface Between Mind and Body. Biol. Psychiatry 2019, 86, 410–420. [Google Scholar] [CrossRef]
- Lorsch, Z.S.; Hamilton, P.; Ramakrishnan, A.; Parise, E.M.; Salery, M.; Wright, W.; Lepack, A.E.; Mews, P.; Issler, O.; McKenzie, A.; et al. Stress resilience is promoted by a Zfp189-driven transcriptional network in prefrontal cortex. Nat. Neurosci. 2019, 22, 1413–1423. [Google Scholar] [CrossRef]
- Dudek, K.A.; Dion-Albert, L.; Kaufmann, F.N.; Tuck, E.; Lebel, M.; Menard, C. Neurobiology of resilience in depression: Immune and vascular insights from human and animal studies. Eur. J. Neurosci. 2021, 53, 183–221. [Google Scholar] [CrossRef] [Green Version]
- Krishnan, V.; Nestler, E.J. Animal Models of Depression: Molecular Perspectives. Mol. Funct. Model. Neuropsychiatry 2011, 7, 121–147. [Google Scholar] [CrossRef] [Green Version]
- Hervé, M.; Bergon, A.; Le Guisquet, A.-M.; Leman, S.; Consoloni, J.-L.; Fernandez-Nunez, N.; Lefebvre, M.-N.; El-Hage, W.; Belzeaux, R.; Belzung, C.; et al. Translational Identification of Transcriptional Signatures of Major Depression and Antidepressant Response. Front. Mol. Neurosci. 2017, 10, 248. [Google Scholar] [CrossRef] [PubMed]
- Gammie, S.C. Evaluation of animal model congruence to human depression based on large-scale gene expression patterns of the CNS. Sci. Rep. 2022, 12, 1–14. [Google Scholar] [CrossRef] [PubMed]
- Gammie, S.C. Creation of a gene expression portrait of depression and its application for identifying potential treatments. Sci. Rep. 2021, 11, 3829. [Google Scholar] [CrossRef]
- Rayan, N.A.; Kumar, V.; Aow, J.; Rastegar, N.; Lim, M.G.L.; O’Toole, N.; Aliwarga, E.; Arcego, D.M.; Yeo, H.T.G.; Wong, J.Y.; et al. Integrative multi-omics landscape of fluoxetine action across 27 brain regions reveals global increase in energy metabolism and region-specific chromatin remodelling. Mol. Psychiatry 2022, 1–16. [Google Scholar] [CrossRef]
- Carboni, L.; Marchetti, L.; Lauria, M.; Gass, P.; Vollmayr, B.; Redfern, A.; Jones, L.; Razzoli, M.; Malki, K.; Begni, V.; et al. Cross-species evidence from human and rat brain transcriptome for growth factor signaling pathway dysregulation in major depression. Neuropsychopharmacology 2018, 43, 2134–2145. [Google Scholar] [CrossRef] [PubMed] [Green Version]
- Lin, E.; Tsai, S.-J. Genome-wide microarray analysis of gene expression profiling in major depression and antidepressant therapy. Prog. Neuro-Psychopharmacology Biol. Psychiatry 2016, 64, 334–340. [Google Scholar] [CrossRef]
- Ramos-Da-Silva, L.; Carlson, P.T.; Silva-Costa, L.C.; Martins-De-Souza, D.; de Almeida, V. Molecular Mechanisms Associated with Antidepressant Treatment on Major Depression. Complex Psychiatry 2021, 7, 49–59. [Google Scholar] [CrossRef]
- Kumar, S.; Gál, Z.; Gonda, X.; Huse, R.J.; Juhasz, G.; Bagdy, G.; Petschner, P. Transcriptomic changes following chronic administration of selective serotonin reuptake inhibitors: A review of animal studies. Neuropsychopharmacol. Hung. 2019, 21, 26–35. [Google Scholar]
- Ramsteijn, A.S.; Verkaik-Schakel, R.N.; Houwing, D.J.; Plösch, T.; Olivier, J.D.A. Perinatal exposure to fluoxetine and maternal adversity affect myelin-related gene expression and epigenetic regulation in the corticolimbic circuit of juvenile rats. Neuropsychopharmacology 2022, 47, 1620–1632. [Google Scholar] [CrossRef]
- Rajkumar, A.P.; Qvist, P.; Donskov, J.G.; Lazarus, R.; Pallesen, J.; Nava, N.; Winther, G.; Liebenberg, N.; la Cour, S.H.; Paternoster, V.; et al. Reduced Brd1 expression leads to reversible depression-like behaviors and gene-expression changes in female mice. Transl. Psychiatry 2020, 10, 239. [Google Scholar] [CrossRef]
- Sheftel, C.M.; Liu, L.; Field, S.L.; Weaver, S.R.; Vezina, C.M.; Peñagaricano, F.; Hernandez, L.L. Impact of Fluoxetine Treatment and Folic Acid Supplementation on the Mammary Gland Transcriptome During Peak Lactation. Front. Pharmacol. 2022, 13, 828735. [Google Scholar] [CrossRef] [PubMed]
- Malki, K.; Lourdusamy, A.; Binder, E.; Payá-Cano, J.; Sluyter, F.; Craig, I.; Keers, R.; McGuffin, P.; Uher, R.; Schalkwyk, L.C. Antidepressant-dependent mRNA changes in mouse associated with hippocampal neurogenesis in a mouse model of depression. Pharmacogenet. Genom. 2012, 22, 765–776. [Google Scholar] [CrossRef] [PubMed]
- Malki, K.; Uher, R.; Paya-Cano, J.; Binder, E.; Rietschel, M.; Zobel, A.; Mors, O.; Hauser, J.; Henigsberg, N.; Jerman, B.; et al. Convergent Animal and Human Evidence Suggests a Role of PPM1A Gene in Response to Antidepressants. Biol. Psychiatry 2011, 69, 360–365. [Google Scholar] [CrossRef] [PubMed]
- Malki, K.; Tosto, M.G.; Mouriño-Talín, H.; Rodríguez-Lorenzo, S.; Pain, O.; Jumhaboy, I.; Liu, T.; Parpas, P.; Newman, S.; Malykh, A.; et al. Highly polygenic architecture of antidepressant treatment response: Comparative analysis of SSRI and NRI treatment in an animal model of depression. Am. J. Med. Genet. Part B Neuropsychiatr. Genet. 2017, 174, 235–250. [Google Scholar] [CrossRef] [PubMed] [Green Version]
- Akkouh, I.A.; Skrede, S.; Holmgren, A.; Ersland, K.M.; Hansson, L.; Bahrami, S.; Andreassen, O.A.; Steen, V.M.; Djurovic, S.; Hughes, T. Exploring lithium’s transcriptional mechanisms of action in bipolar disorder: A multi-step study. Neuropsychopharmacology 2020, 45, 947–955. [Google Scholar] [CrossRef] [PubMed]
- Park, J.-Y.; Lee, E.-H.; Kwon, H.-J.; Baek, I.-S.; Seo, J.-S.; Kim, K.-S.; Han, P.-L. Behavioral Engagement With Playable Objects Resolves Stress-Induced Adaptive Changes by Reshaping the Reward System. Biol. Psychiatry 2022, 91, 676–689. [Google Scholar] [CrossRef] [PubMed]
- Frazer, S.; Otomo, K.; Dayer, A. Early-life serotonin dysregulation affects the migration and positioning of cortical interneuron subtypes. Transl. Psychiatry 2015, 5, e644. [Google Scholar] [CrossRef] [Green Version]
- Miao, N.; Jin, J.; Kim, S.-N.; Sun, T. Hippocampal MicroRNAs Respond to Administration of Antidepressant Fluoxetine in Adult Mice. Int. J. Mol. Sci. 2018, 19, 671. [Google Scholar] [CrossRef] [Green Version]
- Ulrich-Merzenich, G.; Kelber, O.; Koptina, A.; Freischmidt, A.; Heilmann, J.; Müller, J.; Zeitler, H.; Seidel, M.; Ludwig, M.; Heinrich, E.; et al. Novel neurological and immunological targets for salicylate-based phytopharmaceuticals and for the anti-depressant imipramine. Phytomedicine 2012, 19, 930–939. [Google Scholar] [CrossRef]
- Ulrich-Merzenich, G.; Koptina, A.; Kelber, O.; Freischmidt, A.; Heilmann, J.; Müller, J.; Sadeghlar, F.; Zeitler, H.; Wagner, H. Prediction of adverse events by in vivo gene expression profiling exemplified for phytopharmaceuticals containing salicylates and the antidepressant imipramine. Phytomedicine 2012, 19, 322–329. [Google Scholar] [CrossRef]
- Iegaki, N.; Narita, Y.; Hattori, N.; Hirata, Y.; Ichihara, K. Royal jelly reduces depression-like behavior through possible effects on adrenal steroidogenesis in a murine model of unpredictable chronic mild stress. Biosci. Biotechnol. Biochem. 2020, 84, 606–612. [Google Scholar] [CrossRef] [PubMed]
- Igarashi, Y.; Nakatsu, N.; Yamashita, T.; Ono, A.; Ohno, Y.; Urushidani, T.; Yamada, H. Open TG-GATEs: A large-scale toxicogenomics database. Nucleic Acids Res. 2015, 43, D921–D927. [Google Scholar] [CrossRef] [PubMed]
- Kawamoto, T.; Ito, Y.; Morita, O.; Honda, H. Mechanism-based risk assessment strategy for drug-induced cholestasis using the transcriptional benchmark dose derived by toxicogenomics. J. Toxicol. Sci. 2017, 42, 427–436. [Google Scholar] [CrossRef] [PubMed] [Green Version]
- Sakaida, M.; Sukeno, M.; Imoto, Y.; Tsuchiya, S.; Sugimoto, Y.; Okuno, Y.; Segi-Nishida, E. Electroconvulsive seizure-induced changes in gene expression in the mouse hypothalamic paraventricular nucleus. J. Psychopharmacol. 2013, 27, 1058–1069. [Google Scholar] [CrossRef]
- Schmidt, E.F.; Warner-Schmidt, J.L.; Otopalik, B.G.; Pickett, S.B.; Greengard, P.; Heintz, N. Identification of the Cortical Neurons that Mediate Antidepressant Responses. Cell 2012, 149, 1152–1163. [Google Scholar] [CrossRef] [Green Version]
- Sargin, D.; Chottekalapanda, R.U.; Perit, K.E.; Yao, V.; Chu, D.; Sparks, D.W.; Kalik, S.; Power, S.K.; Troyanskaya, O.G.; Schmidt, E.F.; et al. Mapping the physiological and molecular markers of stress and SSRI antidepressant treatment in S100a10 corticostriatal neurons. Mol. Psychiatry 2020, 25, 1112–1129. [Google Scholar] [CrossRef] [Green Version]
- Bagot, R.C.; Cates, H.M.; Purushothaman, I.; Vialou, V.; Heller, E.A.; Yieh, L.; LaBonté, B.; Peña, C.J.; Shen, L.; Wittenberg, G.M.; et al. Ketamine and Imipramine Reverse Transcriptional Signatures of Susceptibility and Induce Resilience-Specific Gene Expression Profiles. Biol. Psychiatry 2017, 81, 285–295. [Google Scholar] [CrossRef] [Green Version]
- Kao, C.-Y.; He, Z.; Zannas, A.S.; Hahn, O.; Kühne, C.; Reichel, J.M.; Binder, E.B.; Wotjak, C.T.; Khaitovich, P.; Turck, C.W. Fluoxetine treatment prevents the inflammatory response in a mouse model of posttraumatic stress disorder. J. Psychiatr. Res. 2016, 76, 74–83. [Google Scholar] [CrossRef]
- Conti, B.; Maier, R.; Barr, A.; Morale, M.C.; Lu, X.; Sanna, P.P.; Bilbe, G.; Hoyer, D.; Bartfai, T. Region-specific transcriptional changes following the three antidepressant treatments electro convulsive therapy, sleep deprivation and fluoxetine. Mol. Psychiatry 2007, 12, 167–189. [Google Scholar] [CrossRef] [Green Version]
- Surget, A.; Wang, Y.; Leman, S.; Ibarguen-Vargas, Y.; Edgar, N.; Griebel, G.; Belzung, C.; Sibille, E. Corticolimbic Transcriptome Changes are State-Dependent and Region-Specific in a Rodent Model of Depression and of Antidepressant Reversal. Neuropsychopharmacology 2009, 34, 1363–1380. [Google Scholar] [CrossRef]
- Samuels, B.A.; Leonardo, E.D.; Dranovsky, A.; Williams, A.; Wong, E.; Nesbitt, A.M.; McCurdy, R.D.; Hen, R.; Alter, M. Global state measures of the dentate gyrus gene expression system predict antidepressant-sensitive behaviors. PLoS ONE 2014, 9, e85136. [Google Scholar] [CrossRef] [PubMed]
- Patrício, P.; Mateus-Pinheiro, A.; Irmler, M.; Alves, N.D.; Machado-Santos, A.R.; Morais, M.; Correia, J.S.; Korostynski, M.; Piechota, M.; Stoffel, R.; et al. Differential and Converging Molecular Mechanisms of Antidepressants’ Action in the Hippocampal Dentate Gyrus. Neuropsychopharmacology 2015, 40, 338–349. [Google Scholar] [CrossRef]
- Wang, Y.; Jiang, H.; Meng, H.; Lu, J.; Li, J.; Zhang, X.; Yang, X.; Zhao, B.; Sun, Y.; Bao, T. Genome-wide transcriptome analysis of hippocampus in rats indicated that TLR/NLR signaling pathway was involved in the pathogenisis of depressive disorder induced by chronic restraint stress. Brain Res. Bull. 2017, 134, 195–204. [Google Scholar] [CrossRef]
- Hagihara, H.; Ohira, K.; Miyakawa, T. Transcriptomic evidence for immaturity induced by antidepressant fluoxetine in the hippocampus and prefrontal cortex. Neuropsychopharmacol. Rep. 2019, 39, 78–89. [Google Scholar] [CrossRef] [PubMed]
- Imoto, Y.; Segi-Nishida, E.; Suzuki, H.; Kobayashi, K. Rapid and stable changes in maturation-related phenotypes of the adult hippocampal neurons by electroconvulsive treatment. Mol. Brain 2017, 10, 8. [Google Scholar] [CrossRef] [PubMed] [Green Version]
- Miller, B.H.; Schultz, L.E.; Gulati, A.; Cameron, M.D.; Pletcher, M.T. Genetic Regulation of Behavioral and Neuronal Responses to Fluoxetine. Neuropsychopharmacology 2008, 33, 1312–1322. [Google Scholar] [CrossRef] [PubMed]
- Kroeze, Y.; Peeters, D.; Boulle, F.; Hove, D.L.A.V.D.; van Bokhoven, H.; Zhou, H.; Homberg, J.R. Long-term consequences of chronic fluoxetine exposure on the expression of myelination-related genes in the rat hippocampus. Transl. Psychiatry 2015, 5, e642. [Google Scholar] [CrossRef] [Green Version]
- Sarkar, A.; Chachra, P.; Kennedy, P.; Pena, C.J.; Desouza, L.A.; Nestler, E.J.; Vaidya, V.A. Hippocampal HDAC4 Contributes to Postnatal Fluoxetine-Evoked Depression-Like Behavior. Neuropsychopharmacology 2014, 39, 2221–2232. [Google Scholar] [CrossRef] [Green Version]
- Tellam, R.L.; Rushton, P.; Schuerman, P.; Pala, I.; Anane, D. The primary reasons behind data sharing, its wider benefits and how to cope with the realities of commercial data. BMC Genom. 2015, 16, 626. [Google Scholar] [CrossRef] [Green Version]
- Seney, M.L.; Glausier, J.; Sibille, E. Large-Scale Transcriptomics Studies Provide Insight Into Sex Differences in Depression. Biol. Psychiatry 2022, 91, 14–24. [Google Scholar] [CrossRef]
- Malberg, J.E.; Blendy, J.A. Antidepressant action: To the nucleus and beyond. Trends Pharmacol. Sci. 2005, 26, 631–638. [Google Scholar] [CrossRef] [PubMed]
- Kim, W.; Chung, C. Brain-wide cellular mapping of acute stress-induced activation in male and female mice. FASEB J. 2021, 35, e22041. [Google Scholar] [CrossRef] [PubMed]
- Monteggia, L.M.; Luikart, B.; Barrot, M.; Theobold, D.; Malkovska, I.; Nef, S.; Parada, L.F.; Nestler, E.J. Brain-Derived Neurotrophic Factor Conditional Knockouts Show Gender Differences in Depression-Related Behaviors. Biol. Psychiatry 2007, 61, 187–197. [Google Scholar] [CrossRef]
- Tylee, A.; Walters, P. Onset of action of antidepressants. BMJ 2007, 334, 911–912. [Google Scholar] [CrossRef] [PubMed] [Green Version]
- Moncrieff, J.; Cooper, R.E.; Stockmann, T.; Amendola, S.; Hengartner, M.P.; Horowitz, M.A. The serotonin theory of depression: A systematic umbrella review of the evidence. Mol. Psychiatry 2022, 1–14. [Google Scholar] [CrossRef]
- Benton, C.; Wiltshire, T. Biological alterations in depression. In Psychiatric Disorders—Trends and Developments; Uehara, T., Ed.; Intechopen: Rijeka, Croatia, 2011; pp. 223–266. [Google Scholar]
- Apazoglou, K.; Farley, S.; Gorgievski, V.; Belzeaux, R.; López, J.P.; Grenier, J.; Ibrahim, E.C.; El Khoury, M.-A.; Tse, Y.C.; Mongredien, R.; et al. Antidepressive effects of targeting ELK-1 signal transduction. Nat. Med. 2018, 24, 591–597. [Google Scholar] [CrossRef]
- Fanselow, M.S.; Dong, H.W. Are the dorsal and ventral hippocampus functionally distinct structures? Neuron 2010, 65, 7–19. [Google Scholar] [CrossRef] [Green Version]
- Ding, S.-L.; Yao, Z.; Hirokawa, K.E.; Nguyen, T.N.; Graybuck, L.T.; Fong, O.; Bohn, P.; Ngo, K.; Smith, K.A.; Koch, C.; et al. Distinct Transcriptomic Cell Types and Neural Circuits of the Subiculum and Prosubiculum along the Dorsal-Ventral Axis. Cell Rep. 2020, 31, 107648. [Google Scholar] [CrossRef]
- Floriou-Servou, A.; von Ziegler, L.; Stalder, L.; Sturman, O.; Privitera, M.; Rassi, A.; Cremonesi, A.; Thöny, B.; Bohacek, J. Distinct Proteomic, Transcriptomic, and Epigenetic Stress Responses in Dorsal and Ventral Hippocampus. Biol. Psychiatry 2018, 84, 531–541. [Google Scholar] [CrossRef] [Green Version]
- Żurawek, D.; Turecki, G. The miRNome of Depression. Int. J. Mol. Sci. 2021, 22, 11312. [Google Scholar] [CrossRef]
- Li, Q.S.; Galbraith, D.; Morrison, R.L.; Trivedi, M.H.; Drevets, W.C. Circulating microRNA associated with future relapse status in major depressive disorder. Front. Psychiatry 2022, 13, 937360. [Google Scholar] [CrossRef] [PubMed]
- O’Connor, R.M.; Grenham, S.; Dinan, T.G.; Cryan, J.F. microRNAs as novel antidepressant targets: Converging effects of ketamine and electroconvulsive shock therapy in the rat hippocampus. Int. J. Neuropsychopharmacol. 2013, 16, 1885–1892. [Google Scholar] [CrossRef] [PubMed]
- Lopez, J.P.; Fiori, L.M.; Cruceanu, C.; Lin, R.; LaBonte, B.; Cates, H.M.; Heller, E.A.; Vialou, V.; Ku, S.M.; Gerald, C.; et al. MicroRNAs 146a/b-5 and 425-3p and 24-3p are markers of antidepressant response and regulate MAPK/Wnt-system genes. Nat. Commun. 2017, 8, 15497. [Google Scholar] [CrossRef] [PubMed] [Green Version]
- Belzeaux, R.; Fiori, L.M.; Lopez, J.P.; Boucekine, M.; Boyer, L.; Blier, P.; Farzan, F.; Frey, B.N.; Giacobbe, P.; Lam, R.W.; et al. Predicting Worsening Suicidal Ideation With Clinical Features and Peripheral Expression of Messenger RNA and MicroRNA During Antidepressant Treatment. J. Clin. Psychiatry 2019, 80, 22559. [Google Scholar] [CrossRef]
- Yrondi, A.; Fiori, L.M.; Frey, B.N.; Lam, R.W.; MacQueen, G.M.; Milev, R.; Müller, D.J.; Foster, J.A.; Kennedy, S.H.; Turecki, G. Association Between Side Effects and Blood microRNA Expression Levels and Their Targeted Pathways in Patients With Major Depressive Disorder Treated by a Selective Serotonin Reuptake Inhibitor, Escitalopram: A CAN-BIND-1 Report. Int. J. Neuropsychopharmacol. 2020, 23, 88–95. [Google Scholar] [CrossRef]
- Nojima, T.; Proudfoot, N.J. Mechanisms of lncRNA biogenesis as revealed by nascent transcriptomics. Nat. Rev. Mol. Cell Biol. 2022, 23, 389–406. [Google Scholar] [CrossRef]
- Roy, B.; Wang, Q.; Dwivedi, Y. Long Noncoding RNA-Associated Transcriptomic Changes in Resiliency or Susceptibility to Depression and Response to Antidepressant Treatment. Int. J. Neuropsychopharmacol. 2018, 21, 461–472. [Google Scholar] [CrossRef] [Green Version]
- Zhang, C.-L.; Li, Y.-J.; Lu, S.; Zhang, T.; Xiao, R.; Luo, H.-R. Fluoxetine ameliorates depressive symptoms by regulating lncRNA expression in the mouse hippocampus. Zool. Res. 2021, 42, 28–42. [Google Scholar] [CrossRef]
- Liu, L.; Wang, H.; Chen, X.; Zhang, Y.; Li, W.; Rao, X.; Liu, Y.; Zhao, L.; Pu, J.; Gui, S.; et al. Integrative Analysis of Long Non-coding RNAs, Messenger RNAs, and MicroRNAs Indicates the Neurodevelopmental Dysfunction in the Hippocampus of Gut Microbiota-Dysbiosis Mice. Front. Mol. Neurosci. 2021, 14, 745437. [Google Scholar] [CrossRef]
- Hao, W.-Z.; Chen, Q.; Wang, L.; Tao, G.; Gan, H.; Deng, L.-J.; Huang, J.-Q.; Chen, J.-X. Emerging roles of long non-coding RNA in depression. Prog. Neuro-Psychopharmacol. Biol. Psychiatry 2022, 115, 110515. [Google Scholar] [CrossRef]
- Zimmerman, A.J.; Hafez, A.K.; Amoah, S.K.; Rodriguez, B.A.; Dell’Orco, M.; Lozano, E.; Hartley, B.J.; Alural, B.; Lalonde, J.; Chander, P.; et al. A psychiatric disease-related circular RNA controls synaptic gene expression and cognition. Mol. Psychiatry 2020, 25, 2712–2727. [Google Scholar] [CrossRef] [PubMed] [Green Version]
- Mao, J.; Li, T.; Fan, D.; Zhou, H.; Feng, J.; Liu, L.; Zhang, C.; Wang, X. Abnormal expression of rno_circRNA_014900 and rno_circRNA_005442 induced by ketamine in the rat hippocampus. BMC Psychiatry 2020, 20, 1. [Google Scholar] [CrossRef]
- Lesch, K.; Aulakh, C.S.; Wolozin, B.L.; Tolliver, T.J.; Hill, J.L.; Murphy, D.L. Regional brain expression of serotonin transporter mRNA and its regulation by reuptake inhibiting antidepressants. Mol. Brain Res. 1993, 17, 31–35. [Google Scholar] [CrossRef]
- Neumaier, J.F.; Root, D.C.; Hamblin, M.W. Chronic Fluoxetine Reduces Serotonin Transporter mRNA and 5-HT1B mRNA in a Sequential Manner in the Rat Dorsal Raphe Nucleus. Neuropsychopharmacology 1996, 15, 515–522. [Google Scholar] [CrossRef]
- Koed, K.; Linnet, K. The serotonin transporter messenger RNA level in rat brain is not regulated by antidepressants. Biol. Psychiatry 1997, 42, 1177–1180. [Google Scholar] [CrossRef]
- Maekawa, T.; Kim, S.; Nakai, D.; Makino, C.; Takagi, T.; Ogura, H.; Yamada, K.; Chatton, B.; Ishii, S. Social isolation stress induces ATF-7 phosphorylation and impairs silencing of the 5-HT 5B receptor gene. EMBO J. 2010, 29, 196–208. [Google Scholar] [CrossRef] [Green Version]
- Rostene, W.; Fischette, C.; Rainbow, T.; McEwen, B. Modulation by vasoactive intestinal peptide of serotonin1 receptors in the dorsal hippocampus of the rat brain: An autoradiographic study. Neurosci. Lett. 1983, 37, 143–148. [Google Scholar] [CrossRef]
- Etgen, A.; Browning, E. Activators of cyclic adenosine 3’:5’-monophosphate accumulation in rat hippocampal slices: Action of vasoactive intestinal peptide (VIP). J. Neurosci. 1983, 3, 2487–2493. [Google Scholar] [CrossRef] [Green Version]
- Rostene, W.; Fischette, C.; McEwen, B. Modulation by vasoactive intestinal peptide (VIP) of serotonin receptors in membranes from rat hippocampus. J. Neurosci. 1983, 3, 2414–2419. [Google Scholar] [CrossRef] [Green Version]
- Huang, Y.-L.; Yu, J.-P.; Wang, G.-H.; Chen, Z.-H.; Wang, Q.; Xiao, L. Effect of fluoxetine on depression-induced changes in the expression of vasoactive intestinal polypeptide and corticotrophin releasing factor in rat duodenum. World J. Gastroenterol. 2007, 13, 6060–6065. [Google Scholar] [CrossRef]
- Ibi, D.; Takuma, K.; Koike, H.; Mizoguchi, H.; Tsuritani, K.; Kuwahara, Y.; Kamei, H.; Nagai, T.; Yoneda, Y.; Nabeshima, T.; et al. Social isolation rearing-induced impairment of the hippocampal neurogenesis is associated with deficits in spatial memory and emotion-related behaviors in juvenile mice. J. Neurochem. 2008, 105, 921–932. [Google Scholar] [CrossRef] [PubMed]
- Ieraci, A.; Mallei, A.; Popoli, M. Social Isolation Stress Induces Anxious-Depressive-Like Behavior and Alterations of Neuroplasticity-Related Genes in Adult Male Mice. Neural Plast. 2016, 2016, 1–13. [Google Scholar] [CrossRef] [PubMed]
- Anderson, S.T.; Commins, S.; Moynagh, P.N.; Coogan, A.N. Lipopolysaccharide-induced sepsis induces long-lasting affective changes in the mouse. Brain Behav. Immun. 2015, 43, 98–109. [Google Scholar] [CrossRef] [Green Version]
- Navailles, S.; Zimnisky, R.; Schmauss, C. Expression of Glucocorticoid Receptor and Early Growth Response Gene 1 during Postnatal Development of Two Inbred Strains of Mice Exposed to Early Life Stress. Dev. Neurosci. 2010, 32, 139–148. [Google Scholar] [CrossRef] [PubMed] [Green Version]
- Monsey, M.S.; Boyle, L.M.; Zhang, M.L.; Nguyen, C.P.; Kronman, H.G.; Ota, K.T.; Duman, R.S.; Taylor, J.R.; Schafe, G.E. Chronic Corticosterone Exposure Persistently Elevates the Expression of Memory-Related Genes in the Lateral Amygdala and Enhances the Consolidation of a Pavlovian Fear Memory. PLoS ONE 2014, 9, e91530. [Google Scholar] [CrossRef] [PubMed] [Green Version]
- Jeanneteau, F.; Barrère, C.; Vos, M.; De Vries, C.J.; Rouillard, C.; Levesque, D.; Dromard, Y.; Moisan, M.-P.; Duric, V.; Franklin, T.C.; et al. The Stress-Induced Transcription Factor NR4A1 Adjusts Mitochondrial Function and Synapse Number in Prefrontal Cortex. J. Neurosci. 2018, 38, 1335–1350. [Google Scholar] [CrossRef] [PubMed] [Green Version]
- Vialou, V.; Thibault, M.; Kaska, S.; Cooper, S.; Gajewski, P.; Eagle, A.; Mazei-Robison, M.; Nestler, E.J.; Robison, A. Differential induction of FosB isoforms throughout the brain by fluoxetine and chronic stress. Neuropharmacology 2015, 99, 28–37. [Google Scholar] [CrossRef] [Green Version]
- Sibille, E.; Wang, Y.; Joeyen-Waldorf, J.; Gaiteri, C.; Surget, A.; Oh, S.; Belzung, C.; Tseng, G.C.; Lewis, D. A Molecular Signature of Depression in the Amygdala. Am. J. Psychiatry 2009, 166, 1011–1024. [Google Scholar] [CrossRef] [Green Version]
- Sillaber, I.; Panhuysen, M.; Henniger, M.S.H.; Ohl, F.; Kühne, C.; Pütz, B.; Pohl, T.; Deussing, J.M.; Paez-Pereda, M.; Holsboer, F. Profiling of behavioral changes and hippocampal gene expression in mice chronically treated with the SSRI paroxetine. Psychopharmacology 2008, 200, 557–572. [Google Scholar] [CrossRef] [Green Version]
- Molteni, R.; Calabrese, F.; Mancini, M.; Racagni, G.; Riva, M.A. Basal and stress-induced modulation of activity-regulated cytoskeletal associated protein (Arc) in the rat brain following duloxetine treatment. Psychopharmacology 2008, 201, 285–292. [Google Scholar] [CrossRef]
- Brivio, P.; Corsini, G.; Riva, M.A.; Calabrese, F. Chronic vortioxetine treatment improves the responsiveness to an acute stress acting through the ventral hippocampus in a glucocorticoid-dependent way. Pharmacol. Res. 2019, 142, 14–21. [Google Scholar] [CrossRef] [PubMed]
- Zhang, W.-J.; Wang, H.-H.; Lv, Y.-D.; Liu, C.-C.; Sun, W.-Y.; Tian, L.-J. Downregulation of Egr-1 Expression Level via GluN2B Underlies the Antidepressant Effects of Ketamine in a Chronic Unpredictable Stress Animal Model of Depression. Neuroscience 2018, 372, 38–45. [Google Scholar] [CrossRef] [PubMed]
- Erburu, M.; Cajaleon, L.; Guruceaga, E.; Venzala, E.; Muñoz-Cobo, I.; Beltrán, E.; Puerta, E.; Tordera, R. Chronic mild stress and imipramine treatment elicit opposite changes in behavior and in gene expression in the mouse prefrontal cortex. Pharmacol. Biochem. Behav. 2015, 135, 227–236. [Google Scholar] [CrossRef] [PubMed]
- Waller, J.A.; Tamm, J.A.; Abdourahman, A.; Pehrson, A.L.; Li, Y.; Cajina, M.; Sánchez, C. Chronic vortioxetine treatment in rodents modulates gene expression of neurodevelopmental and plasticity markers. Eur. Neuropsychopharmacol. 2017, 27, 192–203. [Google Scholar] [CrossRef]
- Scarpa, J.R.; Jiang, P.; Gao, V.D.; Fitzpatrick, K.; Millstein, J.; Olker, C.; Gotter, A.; Winrow, C.J.; Renger, J.J.; Kasarskis, A.; et al. Cross-species systems analysis identifies gene networks differentially altered by sleep loss and depression. Sci. Adv. 2018, 4, eaat1294. [Google Scholar] [CrossRef] [Green Version]
- Muzio, L.; Brambilla, V.; Calcaterra, L.; D’Adamo, P.; Martino, G.; Benedetti, F. Increased neuroplasticity and hippocampal microglia activation in a mice model of rapid antidepressant treatment. Behav. Brain Res. 2016, 311, 392–402. [Google Scholar] [CrossRef]
- Papp, M.; Gruca, P.; Faron-Górecka, A.; Kusmider, M.; Willner, P. Genomic Screening of Wistar and Wistar-Kyoto Rats Exposed to Chronic Mild Stress and Deep Brain Stimulation of Prefrontal Cortex. Neuroscience 2019, 423, 66–75. [Google Scholar] [CrossRef] [PubMed]
- Savitz, J.; Frank, M.B.; Victor, T.; Bebak, M.; Marino, J.H.; Bellgowan, P.S.; McKinney, B.A.; Bodurka, J.; Teague, K.; Drevets, W.C. Inflammation and neurological disease-related genes are differentially expressed in depressed patients with mood disorders and correlate with morphometric and functional imaging abnormalities. Brain Behav. Immun. 2013, 31, 161–171. [Google Scholar] [CrossRef] [Green Version]
- Manji, H.K.; Quiroz, J.A.; Sporn, J.; Payne, J.L.; Denicoff, K.; Gray, N.A.; Zarate, C.A., Jr.; Charney, D.S. Enhancing neuronal plasticity and cellular resilience to develop novel, improved therapeutics for difficult-to-treat depression. Biol. Psychiatry 2003, 53, 707–742. [Google Scholar] [CrossRef] [Green Version]
- Svenningsson, P.; Tzavara, E.T.; Witkin, J.M.; Fienberg, A.A.; Nomikos, G.G.; Greengard, P. Involvement of striatal and extrastriatal DARPP-32 in biochemical and behavioral effects of fluoxetine (Prozac). Proc. Natl. Acad. Sci. USA 2002, 99, 3182–3187. [Google Scholar] [CrossRef] [Green Version]
- Crozatier, C.; Farley, S.; Mansuy, I.; Dumas, S.; Giros, B.; Tzavara, E. Calcineurin (protein phosphatase 2B) is involved in the mechanisms of action of antidepressants. Neuroscience 2007, 144, 1470–1476. [Google Scholar] [CrossRef] [PubMed]
- Nibuya, M.; Nestler, E.; Duman, R. Chronic antidepressant administration increases the expression of cAMP response element binding protein (CREB) in rat hippocampus. J. Neurosci. 1996, 16, 2365–2372. [Google Scholar] [CrossRef] [PubMed]
- Gould, T.D.; O’Donnell, K.C.; Picchini, A.M.; Dow, E.R.; Chen, G.; Manji, H.K. Generation and behavioral characterization of β-catenin forebrain-specific conditional knock-out mice. Behav. Brain Res. 2008, 189, 117–125. [Google Scholar] [CrossRef] [Green Version]
- Urigüen, L.; Arteta, D.; Díez-Alarcia, R.; Diaz, A.; Pazos, A.; Meana, J.J.; Ferrer-Alcón, M. Gene expression patterns in brain cortex of three different animal models of depression. Genes Brain Behav. 2008, 7, 649–658. [Google Scholar] [CrossRef] [PubMed]
- Kulikova, E.; Kulikov, A.; Kulikov, E.K.A.A. Striatal-enriched Tyrosine Protein Phosphatase (STEP) in the Mechanisms of Depressive Disorders. Curr. Protein Pept. Sci. 2017, 18, 1152–1162. [Google Scholar] [CrossRef]
- Kulikova, E.; Khotskin, N.; Illarionova, N.; Sorokin, I.; Bazhenova, E.; Kondaurova, E.; Volcho, K.; Khomenko, T.; Salakhutdinov, N.; Ponimaskin, E.; et al. Inhibitor of Striatal-Enriched Protein Tyrosine Phosphatase, 8-(Trifluoromethyl)-1,2,3,4,5-Benzopentathiepin-6-Amine hydrochloride (TC-2153), Produces Antidepressant-Like Effect and Decreases Functional Activity and Protein Level of 5-HT2A Receptor in the Brain. Neuroscience 2018, 394, 220–231. [Google Scholar] [CrossRef]
- Huang, G.-J.; Ben-David, E.; Piella, A.T.; Edwards, A.; Flint, J.; Shifman, S. Neurogenomic Evidence for a Shared Mechanism of the Antidepressant Effects of Exercise and Chronic Fluoxetine in Mice. PLoS ONE 2012, 7, e35901. [Google Scholar] [CrossRef] [Green Version]
- Niu, H.; Gou, R.; Xu, Q.; Duan, D. Recombinant insulin-like growth factor binding protein-4 inhibits proliferation and promotes differentiation of neural progenitor cells. Neurosci. Lett. 2017, 642, 71–76. [Google Scholar] [CrossRef]
- Pilar-Cuellar, F.; Vidal, R.; Diaz, A.; Castro, E.; Anjos, S.; Vargas, V.; Romero, B.; Valdizan, E. Signaling Pathways Involved in Antidepressant-Induced Cell Proliferation and Synaptic Plasticity. Curr. Pharm. Des. 2014, 20, 3776–3794. [Google Scholar] [CrossRef] [Green Version]
- Xu, C.; Tian, G.; Jiang, C.; Xue, H.; Kuerbanjiang, M.; Sun, L.; Gu, L.; Zhou, H.; Liu, Y.; Zhang, Z.; et al. NPTX2 promotes colorectal cancer growth and liver metastasis by the activation of the canonical Wnt/β-catenin pathway via FZD6. Cell Death Dis. 2019, 10, 217. [Google Scholar] [CrossRef] [Green Version]
- Huang, W.; Zhao, Y.; Zhu, X.; Cai, Z.; Wang, S.; Yao, S.; Qi, Z.; Xie, P. Fluoxetine upregulates phosphorylated-AKT and phosphorylated-ERK1/2 proteins in neural stem cells: Evidence for a crosstalk between AKT and ERK1/2 pathways. J. Mol. Neurosci. 2013, 49, 244–249. [Google Scholar] [CrossRef] [PubMed]
- Bergeron, Y.; Bureau, G.; Laurier-Laurin, M.É.; Asselin, E.; Massicotte, G.; Cyr, M. Genetic Deletion of Akt3 Induces an Endophenotype Reminiscent of Psychiatric Manifestations in Mice. Front. Mol. Neurosci. 2017, 10, 102. [Google Scholar] [CrossRef] [PubMed]
- Prieto, A.; O’Dell, S.; Varnum, B.; Lai, C. Localization and signaling of the receptor protein tyrosine kinase Tyro3 in cortical and hippocampal neurons. Neuroscience 2007, 150, 319–334. [Google Scholar] [CrossRef] [Green Version]
- Takahashi, M.; Terwilliger, R.; Lane, C.; Mezes, P.S.; Conti, M.; Duman, R.S. Chronic antidepressant administration increases the expression of cAMP-specific phosphodiesterase 4A and 4B isoforms. J. Neurosci. 1999, 19, 610–618. [Google Scholar] [CrossRef] [PubMed] [Green Version]
- Miró, X.; Pérez-Torres, S.; Artigas, F.; Puigdomènech, P.; Palacios, J.M.; Mengod, G. Regulation of cAMP phosphodiesterase mRNAs expression in rat brain by acute and chronic fluoxetine treatment. An in situ hybridization study. Neuropharmacology 2002, 43, 1148–1157. [Google Scholar] [CrossRef]
- Dlaboga, D.; Hajjhussein, H.; O’Donnell, J.M. Regulation of phosphodiesterase-4 (PDE4) expression in mouse brain by repeated antidepressant treatment: Comparison with rolipram. Brain Res. 2006, 1096, 104–112. [Google Scholar] [CrossRef]
- Fatemi, S.H.; Folsom, T.D.; Reutiman, T.J.; Braun, N.N.; Lavergne, L.G. Levels of phosphodiesterase 4A and 4B are altered by chronic treatment with psychotropic medications in rat frontal cortex. Synapse 2010, 64, 550–555. [Google Scholar] [CrossRef]
- Fujita, M.; Richards, E.M.; Niciu, M.; Ionescu, D.F.; Zoghbi, S.S.; Hong, J.; Telu, S.; Hines, C.S.; Pike, V.W.; Zarate, C.A.; et al. cAMP signaling in brain is decreased in unmedicated depressed patients and increased by treatment with a selective serotonin reuptake inhibitor. Mol. Psychiatry 2016, 22, 754–759. [Google Scholar] [CrossRef] [Green Version]
- Anacker, C.; Zunszain, P.A.; Carvalho, L.A.; Pariante, C.M. The glucocorticoid receptor: Pivot of depression and of antidepressant treatment? Psychoneuroendocrinology 2011, 36, 415–425. [Google Scholar] [CrossRef] [Green Version]
- Anacker, C.; Zunszain, P.A.; Cattaneo, A.; Carvalho, L.A.; Garabedian, M.J.; Thuret, S.; Price, J.; Pariante, C.M. Antidepressants increase human hippocampal neurogenesis by activating the glucocorticoid receptor. Mol. Psychiatry 2011, 16, 738–750. [Google Scholar] [CrossRef] [Green Version]
- de Kloet, E.R.; Otte, C.; Kumsta, R.; Kok, L.; Hillegers, M.H.J.; Hasselmann, H.; Kliegel, D.; Joëls, M. Stress and Depression: A Crucial Role of the Mineralocorticoid Receptor. J. Neuroendocr. 2016, 28. [Google Scholar] [CrossRef] [PubMed]
- Herzog, D.P.; Cuadrado, D.P.; Treccani, G.; Jene, T.; Opitz, V.; Hasch, A.; Lutz, B.; Lieb, K.; Sillaber, I.; van der Kooij, M.A.; et al. A distinct transcriptional signature of antidepressant response in hippocampal dentate gyrus granule cells. Transl. Psychiatry 2021, 11, 4. [Google Scholar] [CrossRef] [PubMed]
- Daskalakis, N.P.; Meijer, O.C.; de Kloet, E.R. Mineralocorticoid receptor and glucocorticoid receptor work alone and together in cell-type-specific manner: Implications for resilience prediction and targeted therapy. Neurobiol. Stress 2022, 18, 100455. [Google Scholar] [CrossRef] [PubMed]
- Bin Wang, B.; Xin, N.; Qian, X.; Zhai, L.; Miao, Z.; Yang, Y.; Li, S.; Sun, M.; Xu, X.; Li, X.-J. Ahi1 regulates the nuclear translocation of glucocorticoid receptor to modulate stress response. Transl. Psychiatry 2021, 11, 188. [Google Scholar] [CrossRef]
- Sagner, A.; Zhang, I.; Watson, T.; Lazaro, J.; Melchionda, M.; Briscoe, J. A shared transcriptional code orchestrates temporal patterning of the central nervous system. PLoS Biol. 2021, 19, e3001450. [Google Scholar] [CrossRef]
- Orsetti, M.; Di Brisco, F.; Rinaldi, M.; Dallorto, D.; Ghi, P. Some molecular effectors of antidepressant action of quetiapine revealed by DNA microarray in the frontal cortex of anhedonic rats. Pharmacogenet. Genom. 2009, 19, 600–612. [Google Scholar] [CrossRef]
- Barakat, A.K.; Scholl, C.; Steffens, M.; Brandenburg, K.; Ising, M.; Lucae, S.; Holsboer, F.; Laje, G.; Kalayda, G.V.; Jaehde, U.; et al. Citalopram-induced pathways regulation and tentative treatment-outcome-predicting biomarkers in lymphoblastoid cell lines from depression patients. Transl. Psychiatry 2020, 10, 210. [Google Scholar] [CrossRef]
- Machado-Vieira, R.; Zarate, C.A., Jr.; Manji, H.K. Emerging Novel Treatments for Severe Mood Disorders Involving Cellular Plasticity Cascades. Curr. Psychos. Ther. Rep. 2006, 4, 181–190. [Google Scholar] [CrossRef]
- Cheng, Y.; An, Q.; Wang, J.; Wang, Y.; Dong, J.; Yin, J. RasGRF1 participates in the protective effect of tanshinone IIA on depressive like behaviors of a chronic unpredictable mild stress induced mouse model. Gene 2020, 754, 144817. [Google Scholar] [CrossRef]
- Dmitrzak-Weglarz, M.; Szczepankiewicz, A.; Rybakowski, J.; Kapelski, P.; Bilska, K.; Skibinska, M.; Reszka, E.; Lesicka, M.; Jablonska, E.; Wieczorek, E.; et al. Expression Biomarkers of Pharmacological Treatment Outcomes in Women with Unipolar and Bipolar Depression. Pharmacopsychiatry 2021, 54, 261–268. [Google Scholar] [CrossRef]
- Pothula, S.; Kato, T.; Liu, R.-J.; Wu, M.; Gerhard, D.; Shinohara, R.; Sliby, A.-N.; Chowdhury, G.M.I.; Behar, K.L.; Sanacora, G.; et al. Cell-type specific modulation of NMDA receptors triggers antidepressant actions. Mol. Psychiatry 2020, 26, 5097–5111. [Google Scholar] [CrossRef] [PubMed]
- Hare, B.D.; Shinohara, R.; Liu, R.J.; Pothula, S.; Dileone, R.J.; Duman, R.S. Optogenetic stimulation of medial prefrontal cortex Drd1 neurons produces rapid and long-lasting antidepressant effects. Nat. Commun. 2019, 10, 223. [Google Scholar] [CrossRef] [PubMed]
- Belzeaux, R.; Azorin, J.-M.; Ibrahim, E.C. Monitoring candidate gene expression variations before, during and after a first major depressive episode in a 51-year-old man. BMC Psychiatry 2014, 14, 73. [Google Scholar] [CrossRef] [PubMed] [Green Version]
- Liu, Z.; Zhu, F.; Yao, L.; Yang, C.; Xiao, L.; Zhu, J.; Wang, H.; Wang, G.; Liu, W.; Xiao, Z. PDLIM5 gene polymorphisms and short term antidepressant response in Chinese major depressive disorders. Int. J. Clin. Exp. Med. 2013, 6, 677–682. [Google Scholar] [PubMed]
- Horiuchi, Y.; Ishikawa, M.; Kaito, N.; Iijima, Y.; Tanabe, Y.; Ishiguro, H.; Arinami, T. Experimental Evidence for the Involvement of PDLIM5 in Mood Disorders in Hetero Knockout Mice. PLoS ONE 2013, 8, e59320. [Google Scholar] [CrossRef] [Green Version]
- Ribeiro, L.F.; Verpoort, B.; Nys, J.; Vennekens, K.M.; Wierda, K.D.; De Wit, J. SorCS1-mediated sorting in dendrites maintains neurexin axonal surface polarization required for synaptic function. PLOS Biol. 2019, 17, e3000466. [Google Scholar] [CrossRef] [Green Version]
- Lauterbach, E.C. Psychotropic Drug Effects on Gene Transcriptomics Relevant to Alzheimer Disease. Alzheimer Dis. Assoc. Disord. 2012, 26, 1–7. [Google Scholar] [CrossRef]
- Pechstein, A.; Shupliakov, O.; Haucke, V. Intersectin 1: A versatile actor in the synaptic vesicle cycle. Biochem. Soc. Trans. 2010, 38, 181–186. [Google Scholar] [CrossRef] [Green Version]
- Gerosa, L.; Mazzoleni, S.; Rusconi, F.; Longaretti, A.; Lewerissa, E.; Pelucchi, S.; Murru, L.; Giannelli, S.G.; Broccoli, V.; Marcello, E.; et al. The epilepsy-associated protein PCDH19 undergoes NMDA receptor-dependent proteolytic cleavage and regulates the expression of immediate-early genes. Cell Rep. 2022, 39, 110857. [Google Scholar] [CrossRef]
- von Wittgenstein, J.; Zheng, F.; Wittmann, M.-T.; Balta, E.-A.; Ferrazzi, F.; Schäffner, I.; Häberle, B.M.; Valero-Aracama, M.J.; Koehl, M.; Miranda, C.J.; et al. Sox11 is an Activity-Regulated Gene with Dentate-Gyrus-Specific Expression Upon General Neural Activation. Cereb. Cortex 2020, 30, 3731–3743. [Google Scholar] [CrossRef]
- Komine, Y.; Takao, K.; Miyakawa, T.; Yamamori, T. Behavioral Abnormalities Observed in Zfhx2-Deficient Mice. PLoS ONE 2012, 7, e53114. [Google Scholar] [CrossRef] [PubMed] [Green Version]
- Habib, A.M.; Matsuyama, A.; Okorokov, A.L.; Santana-Varela, S.; Bras, J.T.; Aloisi, A.M.; Emery, E.C.; Bogdanov, Y.D.; Follenfant, M.; Gossage, S.J.; et al. A novel human pain insensitivity disorder caused by a point mutation in ZFHX2. Brain 2018, 141, 365–376. [Google Scholar] [CrossRef]
- Thippeswamy, H.; Davies, W. A new molecular risk pathway for postpartum mood disorders: Clues from steroid sulfatase–deficient individuals. Arch. Women’s Ment. Health 2020, 24, 391–401. [Google Scholar] [CrossRef] [PubMed]
- Niculescu, A.B.; Levey, D.; Phalen, P.; Le-Niculescu, H.; Dainton-Howard, H.; Jain, N.; Belanger, E.; James, A.; George, S.; Weber, H.; et al. Understanding and predicting suicidality using a combined genomic and clinical risk assessment approach. Mol. Psychiatry 2015, 20, 1266–1285. [Google Scholar] [CrossRef] [PubMed]
- Niculescu, A.B.; Le-Niculescu, H.; Levey, D.F.; Phalen, P.L.; Dainton, H.L.; Roseberry, K.; Niculescu, E.M.; Niezer, J.O.; Williams, A.; Graham, D.L.; et al. Precision medicine for suicidality: From universality to subtypes and personalization. Mol. Psychiatry 2017, 22, 1250–1273. [Google Scholar] [CrossRef] [Green Version]
- Ferreira, A.C.; Osório, F.D.L. Peripheral oxytocin concentrations in psychiatric disorders—A systematic review and methanalysis: Further evidence. Prog. Neuro-Psychopharmacol. Biol. Psychiatry 2022, 117, 110561. [Google Scholar] [CrossRef]
- Hori, H.; Nakamura, S.; Yoshida, F.; Teraishi, T.; Sasayama, D.; Ota, M.; Hattori, K.; Kim, Y.; Higuchi, T.; Kunugi, H. Integrated profiling of phenotype and blood transcriptome for stress vulnerability and depression. J. Psychiatr. Res. 2018, 104, 202–210. [Google Scholar] [CrossRef]
- Guilloux, J.-P.; Bassi, S.; Ding, Y.; Walsh, C.; Turecki, G.; Tseng, G.; Cyranowski, J.M.; Sibille, E. Testing the Predictive Value of Peripheral Gene Expression for Nonremission Following Citalopram Treatment for Major Depression. Neuropsychopharmacology 2015, 40, 701–710. [Google Scholar] [CrossRef] [Green Version]
- Davis, S.; Meltzer, P.S. GEOquery: A bridge between the Gene Expression Omnibus (GEO) and BioConductor. Bioinformatics 2007, 23, 1846–1847. [Google Scholar] [CrossRef] [Green Version]
- Carvalho, B.S.; Irizarry, R.A. A framework for oligonucleotide microarray preprocessing. Bioinformatics 2010, 26, 2363–2367. [Google Scholar] [CrossRef] [Green Version]
- Ritchie, M.E.; Belinda, P.; Wu, D.; Hu, Y.; Law, C.W.; Shi, W.; Smyth, G.K. limma powers differential expression analyses for RNA-sequencing and microarray studies. Nucleic Acids Res. 2015, 43, e47. [Google Scholar] [CrossRef] [PubMed]
- Joshi, N.A.; Fass, J.N. Sickle: A Sliding-Window, Adaptive, Quality-Based Trimming Tool for FastQ Files; Version 1.33; Github: San Francisco, CA, USA, 2011. [Google Scholar]
- Dobin, A.; Davis, C.A.; Schlesinger, F.; Drenkow, J.; Zaleski, C.; Jha, S.; Batut, P.; Chaisson, M.; Gingeras, T.R. STAR: Ultrafast universal RNA-seq aligner. Bioinformatics 2013, 29, 15–21. [Google Scholar] [CrossRef] [PubMed]
- Liao, Y.; Smyth, G.K.; Shi, W. feature Counts: An efficient general purpose program for assigning sequence reads to genomic features. Bioinformatics 2014, 30, 923–930. [Google Scholar] [CrossRef] [Green Version]
- Love, M.I.; Huber, W.; Anders, S. Moderated estimation of fold change and dispersion for RNA-seq data with DESeq2. Genome Biol. 2014, 15, 550. [Google Scholar] [CrossRef] [PubMed] [Green Version]
- Zhu, A.; Ibrahim, J.G.; Love, M.I. Heavy-tailed prior distributions for sequence count data: Removing the noise and preserving large differences. Bioinformatics 2018, 35, 2084–2092. [Google Scholar] [CrossRef] [Green Version]
- Wickham, H. ggplot2, 1st ed.; Use R; Springer: New York, NY, USA, 2009; p. 213. [Google Scholar]
- Prada, C.; Lima, D.; Nakaya, H. MetaVolcanoR: Gene Expression Meta-Analysis Visualization Tool; R Package Version 1.10.0; GitHun: San Francisco, CA, USA, 2022. [Google Scholar]
- Sherman, B.T.; Hao, M.; Qiu, J.; Jiao, X.; Baseler, M.W.; Lane, H.C.; Imamichi, T.; Chang, W. DAVID: A web server for functional enrichment analysis and functional annotation of gene lists (2021 update). Nucleic Acids Res. 2022, 50, W216–W221. [Google Scholar] [CrossRef]
- Kang, H.J.; Voleti, B.; Hajszan, T.; Rajkowska, G.; Stockmeier, C.A.; Licznerski, P.; Lepack, A.; Majik, M.; Jeong, L.S.; Banasr, M.; et al. Decreased expression of synapse-related genes and loss of synapses in major depressive disorder. Nat. Med. 2012, 18, 1413–1417. [Google Scholar] [CrossRef]
- Seney, M.L.; Huo, Z.; Cahill, K.; French, L.; Puralewski, R.; Zhang, J.; Logan, R.W.; Tseng, G.; Lewis, D.A.; Sibille, E. Opposite Molecular Signatures of Depression in Men and Women. Biol. Psychiatry 2018, 84, 18–27. [Google Scholar] [CrossRef]
- Pettai, K.; Milani, L.; Tammiste, A.; Võsa, U.; Kolde, R.; Eller, T.; Nutt, D.; Metspalu, A.; Maron, E. Whole-genome expression analysis reveals genes associated with treatment response to escitalopram in major depression. Eur. Neuropsychopharmacol. 2016, 26, 1475–1483. [Google Scholar] [CrossRef]
- Duric, V.; Banasr, M.; Stockmeier, C.A.; Simen, A.A.; Newton, S.S.; Overholser, J.C.; Jurjus, G.J.; Dieter, L.; Duman, R.S. Altered expression of synapse and glutamate related genes in post-mortem hippocampus of depressed subjects. Int. J. Neuropsychopharmacol. 2012, 16, 69–82. [Google Scholar] [CrossRef]


| Meta-Analysis | ID | Ref. | Rodent | Stress | Fluoxetine | Hippocampus Dissection | Sample Number | Platform |
|---|---|---|---|---|---|---|---|---|
| mouse S-FLX vs. S-Veh | GSE84185 | [21] | 8-week BALB/c | 8-week UCMS | In drinking water (10–20 mg/kg/day) for the last 6 weeks | dentate gyrus | N = 21: 8 NS-Veh; 8 S-Veh; 5 S-FLX-R | Agilent SurePrint G3 Mouse Gene Expression 8 × 60 K |
| private | [50] | 8-week BALB/c | 7-week UCMS | ip administration (20 mg/kg/day) from week 2 to the end of UCMS | dentate gyrus 5 h after the last injection | N = 18: 6 NS-Sal; 6 S-Sal; 6 S-FLX | Affymetrix GeneChip Mouse Genome 430 2.0 | |
| SRP057486 | [48] | 7–8-week C57BL/6NCrl | fear conditioning by electric foot shock | in drinking water (20 mg/kg/day) 12 h after conditioning and for 28 days, followed by 28-day wash out | dorsal cornu ammonis 1 (CA1) 9 weeks after stress | N = 9: 3 NS-Veh; 3 S-Veh; 3 S-FLX | Illumina Genome Analyzer II system | |
| GSE43261 | [51] | 7–8-week C57BL/6J | corticosterone (35 μg/mL) in drinking water for 21 days | in drinking water (160 μg/mL) for 21 days | dorsal or ventral dentate gyrus | N = 30: (8 NS-Veh; 7 S-FLX-R) per area | Affymetrix Mouse Genome 430 2.0 | |
| rat S-FLX vs. S-Veh | GSE56028 | [52] | 2-month Wistar | 6-week UCMS | ip administration (10 mg/kg/day in ultra-pure water), for the last 2 weeks | dentate gyrus | N = 9: 3 NS-Veh; 3 S-Veh; 3 S-FLX | Affymetrix Rat Gene 1.0 ST |
| SRP131063 | NA | 6–7-week Sprague-Dawley | 5-week UCMS | ip administration (7 mg/kg/day) the last week of UCMS. | hippocampus | N = 9: 3 NS-Sal; 3 S-Sal; 3 S-FLX | Illumina HiSeq 4000 | |
| SRP084288 | [53] | 6-week Sprague-Dawley | restraint stress (6 h/day) for 28 days | administration by gavage (10 mg/kg/day) one hour before stress for 28 days | hippocampus | N = 3: 1 CTL; 1 S; 1 S-FLX | Illumina Nextseq 500/151 nt | |
| mouse FLX vs. Veh | GSE84185 | [21] | 8-week BALB/c | No | In drinking water (10–20 mg/kg/day) for 6 weeks | dentate gyrus | N= 16: 8 NS-Veh; 8 NS-FLX | Agilent SurePrint G3 Mouse Gene Expression 8 × 60 K |
| SRP057486 | [48] | 7–8-week C57BL/6NCrl | No | in drinking water (20 mg/kg/day) for 28 days, followed by 5-week wash out | dorsal cornu ammonis 1 (CA1) | N = 6: 3 Veh; 3 FLX | Illumina Genome Analyzer II system | |
| GSE118669 | [54] | 9-week C57BL/6J | No | subcutaneous releasing pellet (15 mg/kg/day) in the dorsal interscapular region for 3 weeks | dentate gyrus | N = 16: 8 Veh; 8 FLX | Affymetrix Mouse Genome 430 2.0 | |
| GSE54307 | [55] | 8-week C57BL/6J | No | in drinking water (22 mg/kg/day) for 4 weeks | dentate gyrus 24 h after the end of FLX treatment | N = 2: 1 Veh; 1 FLX | Affymetrix Mouse Genome 430 2.0 | |
| GSE6476 | [56] | 3–5-week DBA/2J | No | in drinking water (18 mg/kg/day) for 3 weeks | hippocampus | N = 4: 2 CTL; 2 FLX | Affymetrix Mouse Genome 430 2.0 | |
| rat FLX vs. Veh | SRP056480 | [57] | Wistar | No | oral gavage (12 mg/kg/day) or Veh (1% methylcellulose) from PND 67 to 88 | hippocampus at PND 128 | N = 4: 2 pools of 2 rats per group (Veh; FLX) | Illumina Genome Analyzer IIx |
| GSE42940 | [58] | 2-month Sprague-Dawley | No | po (10 mg/kg) or Veh (5% sucrose) from PND 2 to 21 and wash out for 5 weeks | hippocampus | N = 8: 4 Veh; 4 FLX | Agilent TIFR-Rat-8 × 15 K v1.0 |
| Dataset ID | GSE43261 | GSE56028 | GSE84185 | SRP057486 | SRP084288 | SRP131063 | Surget 2009 | Consensus Score | |||||||
|---|---|---|---|---|---|---|---|---|---|---|---|---|---|---|---|
| Gene | log2FC | p | log2FC | p | log2FC | p | log2FC | p | log2FC | p | log2FC | p | log2FC | p | |
| Adprm | −0.096 | 4.25 × 10⁻² | −0.251 | 5.43 × 10⁻³ | −0.105 | 4.01 × 10⁻² | 0.035 | 6.92 × 10⁻¹ | −0.287 | 7.68 × 10⁻³ | 0.054 | 6.83 × 10⁻¹ | −0.012 | 9.11 × 10⁻¹ | −4 |
| Arc | 1.796 | 9.70 × 10⁻³ | −0.379 | 3.20 × 10⁻² | 1.946 | 5.65 × 10⁻⁶ | −0.011 | 7.98 × 10⁻¹ | −0.001 | 9.61 × 10⁻¹ | 0.282 | 3.87 ×10⁻⁴ | −0.390 | 2.18 ×10⁻² | 1 |
| Ddah1 | 0.370 | 1.03 × 10⁻⁴ | −0.051 | 6.22 × 10⁻¹ | 0.180 | 1.58 × 10⁻² | 0.104 | 2.28 × 10⁻¹ | 0.192 | 1.96 × 10⁻² | −0.205 | 1.75 ×10⁻³ | 0.174 | 2.51 ×10⁻² | 3 |
| Egr1 | 1.434 | 5.36 × 10⁻³ | −0.091 | 4.48 × 10⁻¹ | 1.883 | 1.13 × 10⁻⁵ | −0.308 | 5.97 × 10⁻⁴ | −0.117 | 4.20 × 10⁻¹ | 0.255 | 1.48 ×10⁻³ | −0.286 | 2.65 ×10⁻² | 1 |
| Ephb6 | 1.084 | 8.54 × 10⁻¹² | −0.176 | 7.84 × 10⁻² | 1.328 | 3.22 × 10⁻⁸ | −0.034 | 7.02 × 10⁻¹ | 0.242 | 4.84 × 10⁻³ | 0.269 | 1.71 ×10⁻⁴ | −0.037 | 7.49 × 10⁻¹ | 4 |
| Hmgcs1 | 0.766 | 7.36 × 10⁻⁵ | −0.218 | 3.04 × 10⁻² | 0.336 | 4.46 × 10⁻² | −0.145 | 7.06 × 10⁻² | 0.089 | 1.75 × 10⁻¹ | −0.410 | 3.43 ×10⁻¹¹ | −0.217 | 1.73 ×10⁻² | −1 |
| Kcng2 | −0.750 | 2.29 × 10⁻¹⁴ | 0.146 | 4.95 × 10⁻² | −1.648 | 1.07 × 10⁻⁵ | 0.094 | 2.29 × 10⁻¹ | 0.238 | 2.84 × 10⁻² | 0.127 | 4.95 ×10⁻² | 0.075 | 5.17 × 10⁻¹ | 1 |
| Klhl5 | −0.394 | 2.91 × 10⁻⁴ | −0.073 | 3.34 × 10⁻¹ | −0.562 | 1.95 × 10⁻⁵ | −0.013 | 8.71 × 10⁻¹ | 0.242 | 4.04 × 10⁻² | −0.172 | 8.79 ×10⁻³ | −0.177 | 2.34 ×10⁻² | −3 |
| Lzts1 | 0.301 | 1.35 × 10⁻³ | 0.014 | 8.95 × 10⁻¹ | 0.723 | 6.19 × 10⁻⁴ | −0.020 | 8.23 × 10⁻¹ | 0.345 | 7.62 × 10⁻⁵ | 0.165 | 3.34 ×10⁻² | −0.096 | 5.85 × 10⁻¹ | 4 |
| Mef2d | 0.202 | 5.24 × 10⁻⁴ | 0.038 | 7.29 × 10⁻¹ | 0.646 | 1.82 × 10⁻⁷ | 0.042 | 6.25 × 10⁻¹ | 0.227 | 2.63 × 10⁻² | 0.263 | 1.14 ×10⁻⁵ | −0.101 | 1.49 × 10⁻¹ | 4 |
| Nfib | −0.224 | 4.91 × 10⁻³ | 0.139 | 6.01 × 10⁻² | −0.929 | 4.53 × 10⁻⁷ | −0.052 | 5.40 × 10⁻¹ | −0.329 | 4.12 × 10⁻⁴ | −0.062 | 4.02 × 10⁻¹ | −0.310 | 1.20 ×10⁻² | −4 |
| Nr4a1 | 1.390 | 2.01 × 10⁻² | −0.395 | 4.02 × 10⁻² | 1.906 | 1.79 × 10⁻⁴ | −0.201 | 2.30 × 10⁻² | −0.072 | 9.00 × 10⁻¹ | 0.352 | 1.08 ×10⁻⁵ | −0.303 | 2.63 ×10⁻² | 0 |
| Oxtr | 1.420 | 1.52 × 10⁻⁵ | 0.214 | 4.93 × 10⁻² | −1.121 | 5.44 × 10⁻⁴ | 0.138 | 4.23 × 10⁻² | −0.012 | 8.13 × 10⁻¹ | 0.091 | 4.18 ×10⁻² | −0.051 | 7.59 × 10⁻¹ | 3 |
| Ppara | −0.165 | 8.29 × 10⁻³ | −0.187 | 3.29 × 10⁻² | −0.160 | 3.02 × 10⁻² | −0.024 | 7.45 × 10⁻¹ | −0.045 | 5.08 × 10⁻¹ | −0.101 | 4.22 × 10⁻¹ | −0.175 | 2.86 ×10⁻² | −4 |
| Prkar1b | 0.850 | 6.71 × 10⁻¹² | −0.018 | 8.51 × 10⁻¹ | 0.774 | 3.31 × 10⁻⁷ | −0.005 | 9.52 × 10⁻¹ | 0.284 | 3.64 × 10⁻⁴ | 0.181 | 9.95 ×10⁻³ | −0.148 | 1.14 × 10⁻¹ | 4 |
| Rimbp2 | 0.622 | 1.40 × 10⁻⁶ | −0.121 | 2.24 × 10⁻¹ | 0.768 | 9.56 × 10⁻³ | 0.179 | 3.87 × 10⁻² | 0.048 | 4.99 × 10⁻¹ | 0.158 | 7.54 ×10⁻³ | −0.001 | 9.95 × 10⁻¹ | 4 |
| Rps10 | −0.179 | 7.62 × 10⁻⁵ | 0.000 | 1.00 | −0.196 | 4.56 × 10⁻³ | −0.008 | 9.29 × 10⁻¹ | −0.227 | 3.07 × 10⁻³ | −0.253 | 3.39 ×10⁻⁴ | −0.194 | 8.19 × 10⁻² | −4 |
| Sgsm2 | 0.230 | 4.56 × 10⁻⁴ | −0.077 | 3.07 × 10⁻¹ | 0.180 | 2.16 × 10⁻² | 0.201 | 2.30 × 10⁻² | 0.164 | 6.88 × 10⁻² | 0.123 | 4.94 ×10⁻² | −0.048 | 4.99 × 10⁻¹ | 4 |
| Ttbk1 | 0.209 | 2.86 ×10⁻⁴ | −0.093 | 3.12 × 10⁻¹ | 0.386 | 1.58 ×10⁻⁶ | −0.019 | 8.15 × 10⁻¹ | 0.233 | 9.14 × 10⁻³ | 0.272 | 1.71 ×10⁻⁴ | −0.151 | 1.97 × 10⁻¹ | 4 |
| Ttyh3 | 0.275 | 1.01 ×10⁻⁴ | −0.065 | 3.24 × 10⁻¹ | 0.400 | 1.68 ×10⁻⁵ | 0.035 | 6.68 × 10⁻¹ | 0.249 | 3.61 × 10⁻³ | 0.231 | 1.14 × 10⁻³ | 0.061 | 4.37 × 10⁻¹ | 4 |
| Wnk1 | −0158 | 1.17 ×10⁻³ | 0159 | 2.04 × 10⁻¹ | −0300 | 2.07 ×10⁻² | −0183 | 4.11 ×10⁻² | −0223 | 2.17 ×10⁻³ | −0032 | 5.92 × 10⁻¹ | −0089 | 2.90 × 10⁻¹ | −4 |
| Wtap | −0137 | 3.81 ×10⁻³ | 0004 | 9.58 × 101 | −0271 | 4.47 ×10⁻³ | 0105 | 2.29 ×10⁻¹ | −0026 | 8.53 × 10⁻¹ | −0126 | 4.91 ×10⁻² | −0254 | 2.83 ×10⁻² | −4 |
| Zfhx2 | −0.350 | 2.05 × 10⁻⁷ | −0.165 | 1.51 × 10⁻¹ | −0.421 | 4.88 × 10⁻³ | −0.207 | 1.69 × 10⁻² | −0.200 | 1.95 × 10⁻² | 0.347 | 7.94 × 10⁻⁷ | −0.270 | 3.20 × 10⁻³ | −4 |
| Dataset ID | GSE43261 | GSE56028 | GSE84185 | SRP057486 | SRP084288 | SRP131063 | Surget 2009 | Consensus Score | Portrait Score | |||||||
|---|---|---|---|---|---|---|---|---|---|---|---|---|---|---|---|---|
| Gene | log2FC | p | log2FC | p | log2FC | p | log2FC | p | log2FC | p | log2FC | p | log2FC | p | ||
| Ier5 | 1.143 | 1.69 × 10⁻¹¹ | −0.009 | 9.29 × 10⁻¹ | 1.786 | 1.39 × 10⁻⁵ | 0.107 | 2.33 × 10⁻¹ | 0.119 | 3.36 × 10⁻¹ | 0.157 | 2.00 × 10⁻² | 0.238 | 8.61 × 10⁻² | 3 | 4.5566666 |
| Mapk4 | 0.928 | 9.14 × 10⁻⁷ | −0.040 | 6.26 × 10⁻¹ | 1.021 | 3.20 × 10⁻⁵ | −0.015 | 8.55 × 10⁻¹ | 0.169 | 7.03 × 10⁻² | 0.176 | 1.66 × 10⁻³ | 0.150 | 2.30 × 10⁻¹ | 3 | 4.5555544 |
| Diras2 | 0.310 | 6.90 × 10⁻⁷ | −0.046 | 5.63 × 10⁻¹ | 0.387 | 4.61 × 10⁻⁷ | 0.110 | 2.15 × 10⁻¹ | −0.028 | 4.61 × 10⁻¹ | 0.212 | 8.37 × 10⁻⁴ | 0.121 | 3.74 × 10⁻¹ | 3 | 4.4544333 |
| Kcnh3 | 0.162 | 3.22 × 10⁻² | −0.001 | 9.90 × 10⁻¹ | 1.004 | 2.57 × 10⁻⁷ | 0.169 | 5.02 × 10⁻² | 0.189 | 3.49 × 10⁻² | 0.284 | 1.83 × 10⁻⁴ | 0.048 | 5.57 × 10⁻¹ | 4 | 4.4456666 |
| Sema7a | 0.786 | 7.29 × 10⁻⁶ | 0.056 | 5.72 × 10⁻¹ | 1.083 | 1.89 × 10⁻⁶ | 0.037 | 6.38 × 10⁻¹ | 0.008 | 8.35 × 10⁻¹ | 0.168 | 1.43 × 10⁻² | 0.158 | 1.86 × 10⁻¹ | 3 | 4.4444666 |
| Mapk9 | 0.350 | 1.45 × 10⁻⁶ | 0.026 | 6.68 × 10⁻¹ | 0.248 | 1.13 × 10⁻⁴ | −0.028 | 7.22 × 10⁻¹ | 0.218 | 5.68 × 10⁻³ | −0.031 | 5.78 × 10⁻¹ | 0.132 | 1.41 × 10⁻¹ | 3 | 4.4444443 |
| Nptx2 | 2.410 | 2.74 × 10⁻⁷ | −0.132 | 5.64 × 10⁻¹ | 1.804 | 3.80 × 10⁻⁵ | −0.093 | 2.98 × 10⁻¹ | 0.209 | 3.74 × 10⁻² | 0.237 | 8.39 × 10⁻⁴ | 0.069 | 5.27 × 10⁻¹ | 4 | 4.3334333 |
| Prkar1b | 0.850 | 6.71 × 10⁻¹² | −0.018 | 8.51 × 10⁻¹ | 0.774 | 3.31 × 10⁻⁷ | −0.005 | 9.52 × 10⁻¹ | 0.284 | 3.64 × 10⁻⁴ | 0.181 | 9.95 × 10⁻³ | −0.148 | 1.14 × 10⁻¹ | 4 | 4.3333333 |
| Hmgcs1 | 0.766 | 7.36 × 10⁻⁵ | −0.218 | 3.04 × 10⁻² | 0.336 | 4.46 × 10⁻² | −0.145 | 7.06 × 10⁻² | 0.089 | 1.75 × 10⁻¹ | −0.410 | 3.43 × 10⁻¹¹ | −0.217 | 1.73 × 10⁻² | −1 | −4.3211111 |
| Rspo3 | −0.630 | 1.34 × 10⁻⁶ | −0.163 | 8.89 × 10⁻² | −0.966 | 3.40 × 10⁻⁶ | 0.063 | 4.81 × 10⁻¹ | −0.269 | 2.10 × 10⁻² | 0.072 | 4.25 × 10⁻¹ | −0.099 | 4.70 × 10⁻¹ | −3 | −4.4432333 |
| Cnn3 | 0.155 | 2.09x 10⁻² | −0.029 | 7.31 × 10⁻¹ | −0.772 | 1.08 × 10⁻⁶ | −0.055 | 5.13 × 10⁻¹ | −0.228 | 9.77 × 10⁻³ | −0.175 | 3.09 × 10⁻³ | −0.183 | 8.63 × 10⁻² | −2 | −4.4434445 |
| Sh3d19 | −0.677 | 1.80 × 10⁻¹¹ | −0.020 | 8.19 × 10⁻¹ | −0.643 | 2.80 × 10⁻⁶ | −0.112 | 1.86 × 10⁻¹ | −0.010 | 9.62 × 10⁻¹ | −0.131 | 1.16 × 10⁻¹ | −0.313 | 5.57 × 10⁻² | −2 | −4.4555555 |
| Category | ID | Name | Genes | Count | Fold enrichment | Padj |
|---|---|---|---|---|---|---|
| Cellular component | GO:0045202 | synapse | Add1, Adgrb1, Adgrl1, Arhgap44, Arhgdia, Atcay, Baalc, Btbd8, Cacna1g, Cacnb3, Cacng2, Cdkl5, Clstn1, Cyp46a1, Dlg1, Dlg2, Dlgap3, Dnajc6, Drd1, Egr3, Gabbr1, Gabra1, Gabrg2, Git1, Grin1, Grk2, Iqsec3, Kcnb1, Kcnk1, Lrrc4b, Magi2, Mink1, Mthfr, Ncs1, Nlgn2, Ntrk2, Pak5, Palm, Ppm1h, Prkar1b, Psd3, Rims3, Sh2d5, Shank1, Shank3, Slc30a3, Slc4a10, Slc5a7, Slc6a17, Strn4, Stx1a, Sv2a, Syn1, Syndig1, Syngap1, Syngr1, Vgf, Znrf1 | 58 | 3.61 | 2.05 × 10⁻¹⁴ |
| GO:0014069 | postsynaptic density | Add1, Adgrb1, Adgrl1, Arhgap44, Arhgef2, Atp1a1, Baalc, Baiap2, Cacng2, Cdk5r1, Clstn1, Dclk1, Dlg1, Dlg2, Dlgap3, Dnajc6, Git1, Grin1, Iqsec3, Lrp8, Magi2, Mink1, Ncs1, Ntrk2, Palm, Psd3, Sh2d5, Shank1, Shank3, Shisa8, Stx1a, Syn1, Syndig1, Syngap1 | 34 | 5.15 | 1.31 × 10⁻¹¹ | |
| GO:0030054 | cell junction | Adgrb1, Adgrl1, Arhgap44, Arhgef2, Atcay, Baalc, Basp1, Btbd8, Cacng2, Clstn1, Cyp46a1, Dlg1, Dlg2, Dlgap3, Drd1, Egr3, Gabbr1, Gabra1, Gabrg2, Git1, Grin1, Iqsec3, Itgav, Kcnb1, Kcnk1, Lrrc4b, Magi2, Mink1, Mpp7, Ncs1, Nlgn2, Ntrk2, Palm, Psd3, Ptk2, Rimbp2, Rims3, Sh2d5, Shank1, Shank3, Slc30a3, Slc4a10, Slc5a7, Slc6a17, Sptbn2, Strn4, Stx1a, Sv2a, Syndig1, Syngap1, Syngr1, Syt5, Vasp, Znrf1 | 53 | 3.13 | 2.12 × 10⁻¹⁰ | |
| GO:0005891 | voltage-gated calcium channel complex | Cacna1g, Cacna2d2, Cacna2d4, Cacnb1, Cacnb3, Cacng2, | 6 | 13.1 | 3.40 × 10⁻² | |
| Biological process | GO:0035556 | positive regulation of synaptic transmission, glutamatergic | Cacng2, Cacng3, Drd1, Grin1, Iqsec2, Nlgn2, Ntrk2, Oxtr, Ptgs2, Shank3, Tnr | 11 | 15.6 | 2.72 × 10⁻⁶ |
| GO:0010807 | regulation of synaptic vesicle priming | Nabp, Stx1a, Stx1b, Stxbp1, Stxbp5 | 5 | 29.9 | 2.90 × 10⁻² | |
| KEGG pathway | mmu04921 | oxytocin signaling pathway | Adcy2, Cacna2d2, Cacna2d4, Cacnb1, Cacnb3, Cacng2, Cacng3, Camk1g, Camk2d, Kras, Mylk3, Oxtr, Pik3r6, Prkacb, Ptgs2, Rock2 | 16 | 5.76 | 2.30 × 10⁻⁵ |
| mmu05414 | dilated cardiomyopathy | Adcy2, Cacna2d2, Cacna2d4, Cacnb1, Cacnb3, Cacng2, Cacng3, Itgav, Lmna, Prkacb, Tgfb3 | 11 | 6.44 | 1.66 × 10⁻³ | |
| mmu04261 | adrenergic signaling in cardiomyocytes | Adcy2, Atp1a1, Cacna2d2, Cacna2d4, Cacnb1, Cacnb3, Cacng2, Cacng3, Camk2d, Mapk11, Pik3r6, Ppp2r2c, Prkacb | 13 | 4.71 | 4.43 × 10⁻³ | |
| mmu04722 | neurotrophin signaling pathway | Arhgdia, Arhgdig, Bdnf, Camk2d, Grb2, Kras, Mapk9, Mapk11, Ntrk2, Pik3r2, Sort1 | 11 | 5.01 | 1.52 × 10⁻² | |
| Molecular function | GO:0005245 | voltage-gated calcium channel activity | Cacna1g, Cacna2d2, Cacna2d4, Cacnb1, Cacnb3, Cacng2, Cacng3, Itgav, Ncs1 | 9 | 12.0 | 3.93 × 10⁻⁴ |
| GO:0016301 | kinase activity | Acvr1c, Brsk2, Camk1g, Camk2d, Cdk5r1, Cdkl5, Dclk1, Grk2, Hkdc1, Ikbkg, Itpkc, Lmtk2, Mapk11, Mapk4, Mapk9, Mark4, Melk, Mink1, Mylk3, Ntrk2, Pak5, Pfkm, Pim1, Pip4k2b, Prkacb, Prkar1b, Ptk2, Rock2, Tesk1, Ttbk1, Tyro3 | 31 | 2.49 | 4.97 × 10⁻³ | |
| GO:0004672 | protein kinase activity | Acvr1c, Brsk2, Camk1g, Camk2d, Cdkl5, Dclk1, Ephb6, Grk2, Lmtk2, Mapk11, Mapk4, Mapk9, Mark4, Melk, Mink1, Mylk3, Ntrk2, Pak5, Pim1, Prkacb, Ptk2, Rock2, Tesk1, Ttbk1, Tyro3 | 25 | 2.56 | 3.01 × 10⁻² |
| Category | ID | Name | Genes | Count | Fold Enrichment | Padj |
|---|---|---|---|---|---|---|
| Cellular component | GO:0022626 | cytosolic ribosome | Apod, Eif2ak4, Rpl4, Rpl11, Rpl17, Rpl21, Rpl24, Rpl26, Rpl31, Rpl34, Rps6, Rps7, Rps10, Rps11, Rps12, Rps13, Rps15a, Rps24, Rps27a, Uba52 | 20 | 13.9 | 4.75 × 10⁻¹⁴ |
| GO:0005840 | ribosome | Mrpl3, Mrpl50, Mrps35, Rpl4, Rpl11, Rpl17, Rpl21, Rpl24, Rpl31, Rpl34, Rps6, Rps7, Rps10, Rps11, Rps12, Rps13, Rps15a, Rps24, Rps27a, Uba52 | 20 | 5.76 | 9.32 × 10⁻⁷ | |
| GO:0005912 | adherens junction | Ahi1, Cdh2, Dlg5, Ctnna1, Dll1, Fermt2, Frmd4a, Frmd4b, Pdlim5, Pgm5, Pkp2, Pkp5, Tspan33 | 13 | 4.61 | 1.14 × 10⁻² | |
| Molecular function | G:0003735 | structural constituent of ribosome | Mrpl3, Mrps35, Rpl4, Rpl11, Rpl17, Rpl21, Rpl24, Rpl26, Rpl31, Rpl34, Rps6, Rps7, Rps10, Rps11, Rps12, Rps13, Rps15a, Rps24, Rps27a, Uba52 | 20 | 5.85 | 9.53 × 10⁻⁷ |
| Biological process | GO:0006412 | translation | Eif2b2, Eif2s2, Eif3m, Mrpl3, Rpl4, Rpl11, Rpl17, Rpl21, Rpl24, Rpl26, Rpl31, Rpl34, Rps6, Rps7, Rps11, Rps12, Rps13, Rps15a, Rps24, Rps27a, Tars2, Uba52 | 22 | 3.91 | 5.58 × 10⁻⁴ |
| Dataset ID | GSE118669 | GSE42940 | GSE4307 | GSE6476 | GSE84185 | SRP056481 | SRP057486 | Consensus Score | |||||||
|---|---|---|---|---|---|---|---|---|---|---|---|---|---|---|---|
| Gene | log2FC | p | log2FC | p | log2FC | p | log2FC | p | log2FC | p | log2FC | p | log2FC | p | |
| Arhgef28 | −0.354 | 1.14 × 10⁻³ | −0.774 | 1.60 × 10⁻² | −0.748 | 8.14 × 10⁻² | −0.191 | 3.42 × 10⁻² | −1.251 | 7.89 × 10⁻¹¹ | 0.140 | 2.15 × 10⁻¹ | −0.122 | 2.92 × 10⁻¹ | −4 |
| Arrb2 | −0.179 | 1.94 × 10⁻² | −1.311 | 1.48 × 10⁻³ | −0.184 | 5.83 × 10⁻¹ | −0.156 | 5.25 × 10⁻² | −0.250 | 2.34 × 10⁻³ | −0.013 | 9.13 × 10⁻¹ | −0.227 | 4.81 × 10⁻² | −4 |
| Cd68 | 0.377 | 3.33 × 10⁻⁴ | −0.257 | 1.77 × 10⁻¹ | 0.9468 | 1.94 × 10⁻¹ | 0.842 | 3.67 × 10⁻⁴ | 0.193 | 4.49 × 10⁻² | 0.0034 | 9.49 × 10⁻¹ | 0.352 | 1.03 × 10⁻² | 4 |
| Cfh | 0.077 | 6.62 × 10⁻¹ | 0.461 | 2.91 × 10⁻² | 1.3316 | 2.28 × 10⁻² | 0.430 | 8.38 × 10⁻⁴ | 0.027 | 3.68 × 10⁻¹ | 0.054 | 5.75 × 10⁻¹ | 0.392 | 1.96 × 10⁻³ | 4 |
| Cdon | −0.274 | 1.76 × 10⁻² | −0.847 | 4.12 × 10⁻² | −3.139 | 3.14 × 10⁻³ | −0.359 | 7.20 × 10⁻² | −0.607 | 1.71 × 10⁻⁴ | −0.103 | 3.78 × 10⁻¹ | −0.031 | 8.19 × 10⁻¹ | −4 |
| Chgb | 0.227 | 3.03 × 10⁻² | −0.751 | 4.05 × 10⁻² | 0.507 | 3.48 × 10⁻¹ | 0.396 | 1.27 × 10⁻³ | −0.376 | 1.84 × 10⁻⁵ | −0.249 | 3.94 × 10⁻² | 0.111 | 3.34 × 10⁻¹ | −1 |
| Ddr1 | 0.245 | 9.08 × 10⁻⁴ | −0.276 | 2.83 × 10⁻¹ | 1.145 | 5.00 × 10⁻² | 0.261 | 8.30 × 10⁻⁴ | −0.493 | 2.22 × 10⁻⁵ | 0.097 | 4.09 × 10⁻¹ | 0.342 | 2.84 × 10⁻³ | 3 |
| Doc2b | −0.506 | 1.51 × 10⁻³ | 0.371 | 1.83 × 10⁻¹ | −0.798 | 7.63 × 10⁻² | −0.233 | 1.07 × 10⁻² | −3.232 | 3.42 × 10⁻¹¹ | 0.028 | 7.90 × 10⁻¹ | −0.416 | 4.12 × 10⁻⁴ | −4 |
| Fat4 | −0.890 | 4.54 × 10⁻⁴ | 0.000 | 1.00 | 0.000 | 1.00 | −1.352 | 1.80 × 10⁻³ | −1.748 | 2.48 × 10⁻¹¹ | −0.210 | 6.03 × 10⁻² | −0.342 | 1.25 × 10⁻² | −4 |
| Gpr12 | −0.402 | 3.06 × 10⁻² | −0.708 | 2.38 × 10⁻² | −1.981 | 1.71 × 10⁻¹ | −0.837 | 2.38 × 10⁻⁴ | −0.491 | 1.25 × 10⁻⁶ | −0.115 | 3.16 × 10⁻¹ | −0.001 | 9.95 × 10⁻¹ | −4 |
| Gsn | 0.303 | 2.82 × 10⁻² | 0.783 | 1.49 × 10⁻¹ | 1.488 | 7.55 × 10⁻² | 0.549 | 4.24 × 10⁻³ | 0.397 | 4.04 × 10⁻⁶ | 0.106 | 3.13 × 10⁻¹ | 0.495 | 1.16 × 10⁻⁴ | 4 |
| H2-D1 | 0.210 | 9.67 × 10⁻² | 0.000 | 1.00 | 1.173 | 3.25 × 10⁻² | 0.673 | 1.07 × 10⁻² | 0.424 | 3.22 × 10⁻⁴ | 0.000 | 1.00 | 0.425 | 3.57 × 10⁻⁴ | 4 |
| Homer1 | 0.174 | 4.03 × 10⁻² | 0.688 | 5.84 × 10⁻³ | 0.873 | 6.39 × 10⁻² | 2.919 | 1.41 × 10⁻³ | 1.133 | 7.05 × 10⁻¹² | 0.057 | 6.17 × 10⁻¹ | −0.307 | 2.55 × 10⁻² | 3 |
| Htr1b | 0.121 | 3.19 × 10⁻² | 0.544 | 9.07 × 10⁻³ | 1.466 | 1.88 × 10⁻² | −1.189 | 1.03 × 10⁻³ | 1.084 | 2.35 × 10⁻³ | 0.076 | 3.90 × 10⁻¹ | −0.262 | 5.54 × 10⁻² | 3 |
| Htr5b | 0.920 | 3.29 × 10⁻³ | 0.987 | 7.01 × 10⁻² | 0.847 | 7.59 × 10⁻¹ | −1.112 | 3.30 × 10⁻² | 1.252 | 7.36 × 10⁻³ | 0.224 | 4.37 × 10⁻² | −0.477 | 4.97 × 10⁻⁴ | 1 |
| Igfbp6 | 1.110 | 2.04 × 10⁻⁴ | 0.081 | 6.67 × 10⁻¹ | 2.796 | 2.01 × 10⁻¹ | 0.821 | 1.64 × 10⁻² | 2.720 | 3.41 × 10⁻¹⁰ | −0.079 | 4.68 × 10⁻¹ | 0.325 | 6.21 × 10⁻³ | 4 |
| Ints10 | −0.129 | 2.54 × 10⁻² | 0.000 | 1.00 | 0.000 | 1.00 | −0.562 | 6.79 × 10⁻⁴ | −0.259 | 2.41 × 10⁻³ | 0.016 | 8.92 × 10⁻¹ | −0.254 | 1.42 × 10⁻² | −4 |
| Isoc1 | −0.460 | 6.82 × 10⁻⁵ | −0.337 | 4.55 × 10⁻² | −1.803 | 1.54 × 10⁻² | −0.360 | 2.98 × 10⁻² | −0.761 | 1.26 × 10⁻⁷ | −0.051 | 4.85 × 10⁻¹ | 0.035 | 7.98 × 10⁻¹ | −5 |
| Itga4 | −0.437 | 1.33 × 10⁻² | −0.007 | 9.83 × 10⁻¹ | −3.476 | 6.77 × 10⁻² | −0.601 | 2.59 × 10⁻² | −1.608 | 1.14 × 10⁻¹⁰ | −0.012 | 8.44 × 10⁻¹ | −0.490 | 2.28 × 10⁻⁵ | −4 |
| Itsn1 | −0.238 | 3.80 × 10⁻³ | −2.471 | 1.91 × 10⁻³ | −0.915 | 5.91 × 10⁻² | −0.232 | 2.93 × 10⁻³ | −0.785 | 1.52 × 10⁻⁸ | −0.068 | 5.71 × 10⁻¹ | −0.164 | 1.84 × 10⁻¹ | −4 |
| Kirrel3 | −0.264 | 1.02 × 10⁻³ | −0.603 | 4.93 × 10⁻² | 0.000 | 1.00 | −0.447 | 5.77 × 10⁻³ | −0.617 | 9.80 × 10⁻⁸ | −0.105 | 3.65 × 10⁻¹ | 0.030 | 8.29 × 10⁻¹ | −4 |
| Knstrn | 0.182 | 2.56 × 10⁻² | 0.000 | 1.00 | 3.322 | 2.93 × 10⁻³ | 0.153 | 1.00 × 10⁻² | 1.627 | 1.10 × 10⁻¹¹ | 0.002 | 9.38 × 10⁻¹ | 0.026 | 8.34 × 10⁻¹ | 4 |
| Map1a | −0.146 | 1.24 × 10⁻² | −3.255 | 4.42 × 10⁻³ | 0.000 | 1.00 | −0.116 | 2.02 × 10⁻² | −0.199 | 2.12 × 10⁻³ | −0.059 | 6.26 × 10⁻¹ | −0.273 | 1.40 × 10⁻² | −5 |
| Mpdz | −0.355 | 9.19 × 10⁻⁵ | −0.074 | 7.18 × 10⁻¹ | −0.226 | 5.95 × 10⁻¹ | −0.323 | 2.64 × 10⁻² | −0.540 | 6.63 × 10⁻⁵ | −0.071 | 5.55 × 10⁻¹ | −0.250 | 4.02 × 10⁻² | −4 |
| Mat2a | 0.195 | 6.33 × 10⁻³ | 0.689 | 3.65 × 10⁻³ | 1.323 | 2.40 × 10⁻² | −0.210 | 1.34 × 10⁻² | −0.398 | 8.29 × 10⁻⁵ | 0.046 | 6.98 × 10⁻¹ | 0.014 | 8.81 × 10⁻¹ | 1 |
| Mylk | 0.333 | 3.40 × 10⁻² | −0.616 | 2.80 × 10⁻³ | 1.305 | 2.24 × 10⁻¹ | 0.792 | 9.15 × 10⁻³ | −1.215 | 1.07 × 10⁻⁷ | 0.034 | 7.68 × 10⁻¹ | 0.455 | 8.35 × 10⁻⁴ | 1 |
| Myo1e | 0.203 | 9.58 × 10⁻³ | 0.540 | 1.79 × 10⁻¹ | 1.855 | 1.08 × 10⁻² | 0.054 | 3.40 × 10⁻² | 0.837 | 2.74 × 10⁻⁶ | −0.005 | 9.59 × 10⁻¹ | 0.290 | 2.78 × 10⁻² | 5 |
| Negr1 | −0.255 | 9.34 × 10⁻³ | 0.472 | 5.96 × 10⁻¹ | 0.000 | 1.00 | −0.326 | 3.76 × 10⁻³ | −0.588 | 3.19 × 10⁻³ | −0.246 | 3.52 × 10⁻² | 0.023 | 8.60 × 10⁻¹ | −4 |
| Nhsl2 | −0.427 | 5.59 × 10⁻⁴ | 0.000 | 1.00 | −0.671 | 3.28 × 10⁻¹ | −0.356 | 1.84 × 10⁻² | −0.868 | 5.61 × 10⁻¹⁰ | 0.000 | 1.00 | −0.302 | 6.20 × 10⁻³ | −4 |
| Ntrk3 | −0.253 | 3.34 × 10⁻³ | 0.179 | 2.81 × 10⁻¹ | 1.932 | 5.89 × 10⁻² | −0.156 | 5.25 × 10⁻³ | −0.414 | 2.52 × 10⁻⁶ | −0.059 | 6.23 × 10⁻¹ | −0.409 | 1.31 × 10⁻⁴ | −4 |
| Pcdh7 | 0.355 | 2.30 × 10⁻⁴ | 0.498 | 3.95 × 10⁻¹ | 1.132 | 4.86 × 10⁻² | 0.222 | 4.79 × 10⁻² | 1.167 | 1.04 × 10⁻⁷ | −0.114 | 3.09 × 10⁻¹ | 0.204 | 9.10 × 10⁻² | 4 |
| Pcdh19 | −0.572 | 4.44 × 10⁻³ | 0.000 | 1.00 | 0.000 | 1.00 | −0.252 | 1.31 × 10⁻² | −1.419 | 9.69 × 10⁻¹⁵ | −0.114 | 3.35 × 10⁻¹ | −0.413 | 1.08 × 10⁻⁴ | −4 |
| Pde4b | 0.427 | 8.61 × 10⁻⁶ | −0.064 | 7.55 × 10⁻¹ | 0.763 | 3.36 × 10⁻¹ | 0.180 | 2.91 × 10⁻² | 0.485 | 7.66 × 10⁻⁷ | 0.036 | 7.31 × 10⁻¹ | 0.517 | 6.00 × 10⁻⁷ | 4 |
| Pde7b | −0.720 | 6.86 × 10⁻⁴ | 0.063 | 8.82 × 10⁻¹ | −1.251 | 3.96 × 10⁻² | −0.587 | 1.96 × 10⁻² | 0.511 | 1.55 × 10⁻³ | −0.287 | 8.38 × 10⁻³ | −0.054 | 6.10 × 10⁻¹ | −3 |
| Pdlim5 | −0.124 | 2.95 × 10⁻² | −0.722 | 8.51 × 10⁻³ | 0.900 | 7.04 × 10⁻² | 0.459 | 9.00 × 10⁻³ | −2.857 | 2.37 × 10⁻¹² | −0.165 | 9.09 × 10⁻² | 0.267 | 3.40 × 10⁻² | −1 |
| Rab27a | −0.474 | 1.50 × 10⁻³ | 0.967 | 1.82 × 10⁻¹ | −2.928 | 5.78 × 10⁻³ | −0.680 | 2.90 × 10⁻² | −1.773 | 8.63 × 10⁻¹⁰ | −0.047 | 6.45 × 10⁻¹ | −0.096 | 4.85 × 10⁻¹ | −4 |
| Rasgrf1 | −0.394 | 5.36 × 10⁻⁵ | −0.200 | 2.02 × 10⁻¹ | −0.443 | 3.55 × 10⁻¹ | −0.519 | 4.75 × 10⁻⁴ | −1.051 | 2.38 × 10⁻¹⁰ | −0.006 | 9.59 × 10⁻¹ | −0.335 | 5.16 × 10⁻⁴ | −4 |
| Rassf5 | 0.281 | 8.67 × 10⁻³ | −1.470 | 2.91 × 10⁻¹ | 1.934 | 9.78 × 10⁻³ | 0.156 | 8.56 × 10⁻³ | 0.398 | 6.61 × 10⁻⁴ | −0.004 | 9.66 × 10⁻¹ | 0.225 | 8.59 × 10⁻² | 4 |
| S100a6 | 0.473 | 4.52 × 10⁻³ | −0.668 | 1.93 × 10⁻² | 2.020 | 1.08 × 10⁻¹ | 2.247 | 3.72 × 10⁻⁴ | 1.012 | 4.01 × 10⁻¹¹ | −0.027 | 7.80 × 10⁻¹ | 0.368 | 7.22 × 10⁻³ | 3 |
| Scn3b | −0.245 | 7.02 × 10⁻³ | −0.479 | 1.05 × 10⁻² | −0.678 | 1.15 × 10⁻¹ | −0.594 | 5.20 × 10⁻⁵ | −0.971 | 4.31 × 10⁻⁸ | 0.178 | 1.41 × 10⁻¹ | −0.304 | 2.13 × 10⁻² | −5 |
| Sel1l3 | 0.281 | 8.20 × 10⁻⁴ | −1.470 | 1.00 | 1.934 | 3.86 × 10⁻² | 0.156 | 1.18 × 10⁻² | 0.398 | 9.19 × 10⁻⁷ | −0.004 | 2.82 × 10⁻¹ | 0.225 | 8.62 × 10⁻¹ | 4 |
| Sema3a | 0.948 | 6.47 × 10⁻⁴ | −0.388 | 4.91 × 10⁻¹ | 2.727 | 3.16 × 10⁻² | 1.152 | 4.04 × 10⁻³ | 4.176 | 2.62 × 10⁻¹¹ | −0.004 | 9.07 × 10⁻¹ | −0.084 | 5.41 × 10⁻¹ | 4 |
| Sorcs1 | 1.183 | 1.18 × 10⁻³ | −0.366 | 3.72 × 10⁻¹ | 1.372 | 9.98 × 10⁻² | 1.300 | 1.04 × 10⁻² | 2.102 | 8.85 × 10⁻⁸ | 0.059 | 5.70 × 10⁻¹ | 0.495 | 2.66 × 10⁻⁴ | 4 |
| Tfrc | 0.269 | 6.62 × 10⁻⁴ | 0.610 | 3.00 × 10⁻¹ | 0.795 | 2.65 × 10⁻¹ | 0.725 | 7.75 × 10⁻³ | 0.435 | 2.85 × 10⁻⁶ | −0.103 | 3.92 × 10⁻¹ | 0.298 | 8.19 × 10⁻³ | 4 |
| Tnxb | −0.323 | 4.79 × 10⁻⁴ | 0.000 | 1.00 | −0.695 | 3.40 × 10⁻¹ | −0.574 | 7.37 × 10⁻³ | −1.462 | 6.94 × 10⁻⁹ | 0.000 | 1.00 | −0.398 | 3.57 × 10⁻³ | −4 |
| Zfhx2 | −0.145 | 1.02 × 10⁻² | 0.000 | 1.00 | 0.000 | 1.00 | −0.051 | 3.74 × 10⁻² | −0.653 | 2.51 × 10⁻⁹ | 0.035 | 7.70 × 10⁻¹ | −0.479 | 9.56 × 10⁻⁵ | −4 |
| Zfp316 | −0.218 | 4.28 × 10⁻³ | −1.324 | 3.00 × 10⁻⁴ | −1.531 | 1.80 × 10⁻² | −0.912 | 8.63 × 10⁻³ | −0.448 | 1.30 × 10⁻³ | −0.107 | 3.35 × 10⁻¹ | 0.019 | 8.72 × 10⁻¹ | −5 |
| Dataset ID | GSE118669 | GSE42940 | GSE4307 | GSE6476 | GSE84185 | SRP056481 | SRP057486 | Consensus Score | Portrait Score | |||||||
|---|---|---|---|---|---|---|---|---|---|---|---|---|---|---|---|---|
| Gene | log2FC | p | log2FC | p | log2FC | p | log2FC | p | log2FC | p | log2FC | p | log2FC | p | ||
| Vip | 0.306 | 3.19 × 10⁻² | 0.141 | 5.63 × 10⁻¹ | 0.934 | 9.13 × 10⁻² | 0.002 | 9.84 × 10⁻¹ | 2.129 | 6.92 × 10⁻⁹ | 0.122 | 2.30 × 10⁻¹ | 0.318 | 1.61 × 10⁻² | 3 | 55,566,665 |
| Gsn | 0.303 | 2.82 × 10⁻² | 0.783 | 1.49 × 10⁻¹ | 1.49 | 7.55 × 10⁻² | 0.549 | 4.24 × 10⁻³ | 0.397 | 4.04 × 10⁻⁶ | 0.106 | 3.13 × 10⁻¹ | 0.495 | 1.16 × 10⁻⁴ | 4 | 46,777,777 |
| Cd9 | 0.209 | 8.41 × 10⁻² | 0.458 | 2.96 × 10⁻² | 1.346 | 1.53 × 10⁻¹ | 0.764 | 3.18 × 10⁻³ | −0.168 | 5.47 × 10⁻² | 0.205 | 8.59 × 10⁻² | 0.426 | 1.46 × 10⁻³ | 3 | 46666655 |
| S100a10 | 0.203 | 1.55 × 10⁻¹ | 0.308 | 8.39 × 10⁻² | 1.600 | 5.32 × 10⁻² | 0.619 | 1.09 × 10⁻² | 1.107 | 9.75 × 10⁻⁹ | 0.068 | 5.22 × 10⁻¹ | 0.258 | 5.77 × 10⁻² | 2 | 45,777,777 |
| Fcgr2b | 0.142 | 5.86 × 10⁻² | 0.688 | 3.57 × 10⁻² | 1.566 | 3.08 × 10⁻² | 0.920 | 1.59 × 10⁻² | 0.617 | 7.66 × 10⁻⁶ | 0.004 | 9.53 × 10⁻¹ | 0.390 | 3.44 × 10⁻³ | 5 | 45,666,666 |
| Vsnl1 | 0.212 | 4.23 × 10⁻² | 0.596 | 3.87 × 10⁻² | 0.408 | 2.37 × 10⁻¹ | −0.084 | 4.32 × 10⁻¹ | 1.372 | 4.34 × 10⁻¹² | 0.220 | 6.71 × 10⁻² | 0.205 | 1.23 × 10⁻¹ | 3 | 45,666,555 |
| Bgn | 0.144 | 4.83 × 10⁻¹ | 0.495 | 4.41 × 10⁻² | 1.739 | 6.86 × 10⁻² | 1.368 | 9.10 × 10⁻³ | 0.377 | 3.47 × 10⁻² | 0.100 | 3.76 × 10⁻¹ | 0.302 | 1.76 × 10⁻² | 4 | 45,555,777 |
| Sel1l3 | 0.281 | 8.20 × 10⁻⁴ | −1.470 | 1.00 | 1.934 | 3.86 × 10⁻² | 0.156 | 1.18 × 10⁻² | 0.398 | 9.19 × 10⁻⁷ | −0.004 | 2.82 × 10⁻¹ | 0.225 | 8.62 × 10⁻¹ | 4 | 45,555,555 |
| Ppp2r5c | 0.392 | 8.26 × 10⁻⁴ | −0.289 | 2.68 × 10⁻¹ | 1.23 | 5.69 × 10⁻² | 0.216 | 7.36 × 10⁻³ | 1.25 | 3.61 × 10⁻¹⁰ | 0.109 | 3.63 × 10⁻¹ | 0.040 | 7.18 × 10⁻¹ | 3 | 45,444,444 |
| Ddr1 | 0.245 | 9.08 × 10⁻⁴ | −0.276 | 2.83 × 10⁻¹ | 1.145 | 5.00 × 10⁻² | 0.261 | 8.30 × 10⁻⁴ | −0.493 | 2.22 × 10⁻⁵ | 0.097 | 4.09 × 10⁻¹ | 0.342 | 2.84 × 10⁻³ | 3 | 45,333,333 |
| Anxa5 | 0.109 | 1.86 × 10⁻¹ | 0.678 | 5.12 × 10⁻² | 0.981 | 7.99 × 10⁻² | 0.641 | 2.84 × 10⁻³ | 0.259 | 3.55 × 10⁻³ | 0.083 | 4.81 × 10⁻¹ | 0.314 | 9.22 × 10⁻³ | 3 | 44,667,777 |
| Spock3 | 0.375 | 1.77 × 10⁻² | 0.287 | 3.05 × 10⁻¹ | 1.462 | 2.78 × 10⁻² | 0.419 | 3.12 × 10⁻³ | 0.362 | 1.12 × 10⁻² | 0.053 | 6.58 × 10⁻¹ | 0.317 | 1.33 × 10⁻² | 5 | 44,557,777 |
| Icam1 | 0.027 | 7.66 × 10⁻¹ | 0.640 | 3.06 × 10⁻¹ | 0.869 | 5.82 × 10⁻² | 0.164 | 6.84 × 10⁻³ | −0.008 | 5.96 × 10⁻¹ | 0.110 | 2.43 × 10⁻¹ | 0.311 | 1.19 × 10⁻² | 2 | 44,555,556 |
| Rassf8 | 0.382 | 1.38 × 10⁻² | −0.501 | 6.59 × 10⁻¹ | 1.424 | 7.20 × 10⁻² | 0.577 | 2.20 × 10⁻³ | 0.971 | 1.39 × 10⁻⁵ | 0.026 | 8.17 × 10⁻¹ | 0.279 | 3.82 × 10⁻² | 4 | 44,554,466 |
| Tspan5 | 0.231 | 1.90 × 10⁻¹ | 1.609 | 1.56 × 10⁻² | 1.041 | 8.04 × 10⁻² | 0.378 | 3.79 × 10⁻³ | 0.787 | 2.00 × 10⁻⁸ | 0.008 | 9.47 × 10⁻¹ | −0.108 | 3.79 × 10⁻¹ | 3 | 44,554,444 |
| Kif5b | 0.218 | 3.85 × 10⁻³ | 0.699 | 4.29 × 10⁻² | 0.350 | 2.86 × 10⁻¹ | 0.055 | 4.41 × 10⁻¹ | 0.586 | 1.36 × 10⁻⁸ | 0.012 | 9.17 × 10⁻¹ | 0.257 | 1.03 × 10⁻² | 4 | 44,455,557 |
| Cfh | 0.077 | 6.62 × 10⁻¹ | 0.461 | 2.91 × 10⁻² | 1.3316 | 2.28 × 10⁻² | 0.430 | 8.38 × 10⁻⁴ | 0.027 | 3.68 × 10⁻¹ | 0.054 | 5.75 × 10⁻¹ | 0.392 | 1.96 × 10⁻³ | 4 | 44,455,556 |
| Homer1 | 0.174 | 4.03 × 10⁻² | 0.688 | 5.84 × 10⁻³ | 0.873 | 6.39 × 10⁻² | 2.919 | 1.41 × 10⁻³ | 1.133 | 7.05 × 10⁻¹² | 0.057 | 6.17 × 10⁻¹ | −0.307 | 2.55 × 10⁻² | 3 | 44,455,555 |
| Tmem47 | 0.346 | 2.20 × 10⁻³ | 0.000 | 1.00 | 1.247 | 4.33 × 10⁻² | 0.546 | 1.13 × 10⁻² | 0.000 | 1.00 | 0.050 | 6.67 × 10⁻¹ | 0.250 | 2.10 × 10⁻² | 4 | 44,445,555 |
| Tmem98 | 0.190 | 2.81 × 10⁻² | 0.000 | 1.00 | 0.753 | 7.81 × 10⁻² | 0.312 | 2.47 × 10⁻¹ | −0.222 | 2.87 × 10⁻² | 0.184 | 6.86 × 10⁻² | 0.655 | 1.19 × 10⁻⁶ | 1 | 44,445,444 |
| Knstrn | 0.182 | 2.56 × 10⁻² | 0.000 | 1.00 | 3.322 | 2.93 × 10⁻³ | 0.153 | 1.00 × 10⁻² | 1.627 | 1.10 × 10⁻¹¹ | 0.002 | 9.38 × 10⁻¹ | 0.026 | 8.34 × 10⁻¹ | 4 | 44,444,444 |
| Sema3a | 0.948 | 6.47 × 10⁻⁴ | −0.388 | 4.91 × 10⁻¹ | 2.727 | 3.16 × 10⁻² | 1.152 | 4.04 × 10⁻³ | 4.176 | 2.62 × 10⁻¹¹ | −0.004 | 9.07 × 10⁻¹ | −0.084 | 5.41 × 10⁻¹ | 4 | 44,443,312 |
| C1qb | 0.240 | 5.04 × 10⁻⁴ | −0.180 | 3.60 × 10⁻¹ | 1.00 | 4.37 × 10⁻² | 0.873 | 1.59 × 10⁻⁴ | −0.011 | 8.42 × 10⁻¹ | 0.030 | 7.94 × 10⁻¹ | 0.473 | 2.69 × 10⁻⁵ | 4 | 44,433,344 |
| Dpp4 | −0.111 | 1.13 × 10⁻¹ | 0.329 | 9.32 × 10⁻² | 3.517 | 2.42 × 10⁻² | 0.028 | 3.80 × 10⁻¹ | 1.553 | 3.13 × 10⁻¹¹ | 0.017 | 7.28 × 10⁻¹ | 0.211 | 5.37 × 10⁻² | 2 | 44,333,455 |
| Igfbp6 | 1.110 | 2.04 × 10⁻⁴ | 0.081 | 6.67 × 10⁻¹ | 2.796 | 2.01 × 10⁻¹ | 0.821 | 1.64 × 10⁻² | 2.720 | 3.41 × 10⁻¹⁰ | −0.079 | 4.68 × 10⁻¹ | 0.325 | 6.21 × 10⁻³ | 4 | 43,445,554 |
| Adk | −0.161 | 5.78 × 10⁻² | 0.338 | 8.46 × 10⁻² | 1.000 | 4.86 × 10⁻² | 0.117 | 1.76 × 10⁻¹ | 2.226 | 2.74 × 10⁻⁸ | 0.053 | 6.57 × 10⁻¹ | 0.261 | 4.21 × 10⁻² | 3 | 43,345,555 |
| Actr10 | −0.120 | 1.99 × 10⁻² | 0.554 | 4.28 × 10⁻³ | 0.816 | 7.05 × 10⁻² | 0.170 | 2.88 × 10⁻³ | −0.207 | 4.49 × 10⁻³ | 0.129 | 2.78 × 10⁻¹ | 0.062 | 5.24 × 10⁻¹ | 0 | 43,332,233 |
| Drd1 | 1.070 | 3.46 × 10⁻³ | −0.279 | 5.07 × 10⁻¹ | 0.000 | 1.00 | 1.734 | 1.68 × 10⁻³ | 1.472 | 1.73 × 10⁻⁸ | −0.077 | 4.06 × 10⁻¹ | 0.251 | 3.38 × 10⁻² | 4 | 43,332,223 |
| Tyro3 | 0.267 | 4.15 × 10⁻² | −0.202 | 4.39 × 10⁻¹ | 1.572 | 2.11 × 10⁻² | −0.438 | 4.39 × 10⁻² | 1.818 | 1.16 × 10⁻⁹ | 0.128 | 2.77 × 10⁻¹ | −0.131 | 3.40 × 10⁻¹ | 2 | 43,321,112 |
| Sox11 | 0.614 | 6.75 × 10⁻³ | 1.267 | 1.63 × 10⁻³ | 1.617 | 5.52 × 10⁻² | 1.215 | 9.06 × 10⁻⁶ | −0.476 | 1.15 × 10⁻⁴ | −0.033 | 7.03 × 10⁻¹ | −0.205 | 1.32 × 10⁻¹ | 2 | 43,321,111 |
| Trpm3 | −0.437 | 1.49 × 10⁻⁴ | 0.107 | 7.64 × 10⁻¹ | 0.000 | 1.00 | −0.946 | 1.39 × 10⁻² | −1.568 | 9.87 × 10⁻⁹ | −0.188 | 1.06 × 10⁻¹ | −0.016 | 8.63 × 10⁻¹ | −3 | −44,443,334 |
| Jun | −0.439 | 1.30 × 10⁻² | −0.609 | 3.06 × 10⁻¹ | −1.000 | 1.07 × 10⁻¹ | 0.267 | 8.55 × 10⁻² | −2.150 | 7.95 × 10⁻¹¹ | −0.143 | 2.20 × 10⁻¹ | −0.003 | 9.71 × 10⁻¹ | −2 | −44,444,444 |
| Efnb3 | −0.383 | 1.12 × 10⁻² | 0.000 | 1.00 | −0.694 | 2.27 × 10⁻¹ | −0.686 | 1.56 × 10⁻³ | −2.080 | 2.00 × 10⁻¹² | −0.128 | 2.74 × 10⁻¹ | 0.197 | 8.16 × 10⁻² | −3 | −44,444,444 |
| Lct | −0.600 | 1.75 × 10⁻⁴ | −0.567 | 1.15 × 10⁻¹ | −1.100 | 1.16 × 10⁻¹ | 0.266 | 5.55 × 10⁻¹ | −4.916 | 4.72 × 10⁻¹² | 0.011 | 3.89 × 10⁻¹ | −0.421 | 3.72 × 10⁻⁴ | −3 | −44,444,444 |
| Pdia6 | −0.390 | 1.76 × 10⁻⁴ | 0.440 | 2.97 × 10⁻¹ | −1.320 | 1.05 × 10⁻¹ | −0.247 | 7.76 × 10⁻⁴ | −0.112 | 2.60 × 10⁻¹ | −0.070 | 5.61 × 10⁻¹ | −0.382 | 2.62 × 10⁻⁴ | −3 | −44,444,444 |
| Kcnq3 | −0.297 | 9.57 × 10⁻³ | 0.000 | 1.0 | 0.000 | 1.00 | −0.452 | 1.47 × 10⁻² | −0.176 | 6.74 × 10⁻² | −0.176 | 1.33 × 10⁻¹ | −0.367 | 3.62 × 10⁻³ | −3 | −44,444,455 |
| Mcm6 | −0.593 | 3.24 × 10⁻⁵ | −0.526 | 5.41 × 10⁻² | −1.105 | 7.72 × 10⁻² | −0.419 | 4.23 × 10⁻¹ | −2.518 | 1.14 × 10⁻¹⁰ | −0.028 | 7.34 × 10⁻¹ | −0.008 | 9.38 × 10⁻¹ | −2 | −44,445,666 |
| Cacna1d | −0.153 | 1.65 × 10⁻¹ | −0.613 | 1.86 × 10⁻² | −0.830 | 9.70 × 10⁻² | −0.309 | 1.29 × 10⁻² | −0.159 | 6.13 × 10⁻² | −0.082 | 4.98 × 10⁻¹ | −0.240 | 4.85 × 10⁻² | −3 | −44,566,677 |
| Nfia | −0.282 | 1.95 × 10⁻³ | 0.077 | 6.30 × 10⁻¹ | −0.408 | 4.77 × 10⁻¹ | −0.373 | 6.99 × 10⁻³ | −1.022 | 2.60 × 10⁻⁹ | −0.075 | 5.19 × 10⁻¹ | −0.369 | 5.85 × 10⁻³ | −4 | −44,655,556 |
| Nedd4l | −0.276 | 4.08 × 10⁻³ | −0.653 | 1.53 × 10⁻² | −0.283 | 3.90 × 10⁻¹ | −0.377 | 2.13 × 10⁻³ | −0.326 | 4.03 × 10⁻⁴ | −0.079 | 5.10 × 10⁻¹ | −0.258 | 2.86 × 10⁻² | −5 | −44,677,777 |
| Fndc1 | −0.377 | 3.74 × 10⁻³ | 0.000 | 1.00 | −1.356 | 1.14 × 10⁻¹ | 0.361 | 1.25 × 10⁻¹ | −1.817 | 4.60 × 10⁻⁹ | −0.113 | 1.43 × 10⁻¹ | −0.233 | 8.75 × 10⁻² | −2 | −45,444,444 |
| Ntf3 | −0.938 | 2.00 × 10⁻³ | 0.208 | 3.41 × 10⁻¹ | −3.919 | 2.35 × 10⁻¹ | −1.793 | 5.70 × 10⁻⁴ | −3.831 | 1.97 × 10⁻¹² | −0.156 | 1.64 × 10⁻¹ | 0.015 | 8.04 × 10⁻¹ | −3 | −45444,444 |
| Itga4 | −0.437 | 1.33 × 10⁻² | −0.007 | 9.83 × 10⁻¹ | −3.476 | 6.77 × 10⁻² | −0.601 | 2.59 × 10⁻² | −1.608 | 1.14 × 10⁻¹⁰ | −0.012 | 8.44 × 10⁻¹ | −0.490 | 2.28 × 10⁻⁵ | −4 | −45,555,466 |
| Kbtbd11 | −0.191 | 1.58 × 10⁻² | 0.000 | 1.00 | 0.000 | 1.00 | −0.998 | 1.18 × 10⁻² | −1.353 | 2.14 × 10⁻¹⁰ | −0.158 | 1.82 × 10⁻¹ | −0.231 | 7.09 × 10⁻² | −3 | −45,555,555 |
| Kctd4 | −0.238 | 2.69 × 10⁻³ | 0.000 | 1.00 | −0.544 | 3.16 × 10⁻¹ | −0.516 | 2.34 × 10⁻³ | −1.775 | 2.59 × 10⁻¹⁰ | −0.223 | 6.47 × 10⁻² | 0.021 | 7.70 × 10⁻¹ | −3 | −45,555,555 |
| Tnxb | −0.323 | 4.79 × 10⁻⁴ | 0.000 | 1.00 | −0.695 | 3.40 × 10⁻¹ | −0.574 | 7.37 × 10⁻³ | −1.462 | 6.94 × 10⁻⁹ | 0.000 | 1.00 | −0.398 | 3.57 × 10⁻³ | −4 | −45,555,555 |
| Scn3b | −0.245 | 7.02 × 10⁻³ | −0.479 | 1.05 × 10⁻² | −0.678 | 1.15 × 10⁻¹ | −0.594 | 5.20 × 10⁻⁵ | −0.971 | 4.31 × 10⁻⁸ | 0.178 | 1.41 × 10⁻¹ | −0.304 | 2.13 × 10⁻² | −5 | −45,555,555 |
| Foxo1 | −0.500 | 2.14 × 10⁻³ | −0.208 | 3.19 × 10⁻¹ | −0.840 | 1.99 × 10⁻¹ | −0.587 | 1.09 × 10⁻³ | −1.836 | 1.47 × 10⁻¹² | −0.137 | 2.26 × 10⁻¹ | −0.037 | 7.27 × 10⁻¹ | −3 | −45,566,666 |
| Rasgrf1 | −0.394 | 5.36 × 10⁻⁵ | −0.200 | 2.02 × 10⁻¹ | −0.443 | 3.55 × 10⁻¹ | −0.519 | 4.75 × 10⁻⁴ | −1.051 | 2.38 × 10⁻¹⁰ | −0.006 | 9.59 × 10⁻¹ | −0.335 | 5.16 × 10⁻⁴ | −4 | −45,666,667 |
| Auts2 | −0.223 | 1.52 × 10⁻³ | 0.000 | 1.00 | −0.491 | 3.48 × 10⁻¹ | −0.489 | 5.37 × 10⁻³ | −1.047 | 2.47 × 10⁻⁸ | −0.117 | 3.18 × 10⁻¹ | −0.245 | 7.51 × 10⁻² | −3 | −46,666,666 |
| Doc2b | −0.506 | 1.51 × 10⁻³ | 0.371 | 1.83 × 10⁻¹ | −0.798 | 7.63 × 10⁻² | −0.233 | 1.07 × 10⁻² | −3.232 | 3.42 × 10⁻¹¹ | 0.028 | 7.90 × 10⁻¹ | −0.416 | 4.12 × 10⁻⁴ | −4 | −54,444,433 |
| Dsp | −0.749 | 2.12 × 10⁻⁶ | 0.198 | 4.54 × 10⁻¹ | −1.471 | 9.31 × 10⁻² | −1.688 | 9.19 × 10⁻³ | −5.642 | 5.44 × 10⁻¹⁴ | −0.125 | 1.86 × 10⁻¹ | −0.023 | 7.13 × 10⁻¹ | −3 | −55,544,444 |
| Slc4a4 | −0.537 | 5.83 × 10⁻⁴ | 0.052 | 8.62 × 10⁻¹ | −1.062 | 1.43 × 10⁻¹ | −0.912 | 1.93 × 10⁻³ | −1.025 | 2.36 × 10⁻¹² | −0.166 | 1.61 × 10⁻¹ | 0.043 | 7.39 × 10⁻¹ | −3 | −55,554,455 |
| Pcdh19 | −0.572 | 4.43 × 10⁻³ | 0.000 | 1.00 | 0.000 | 1.00 | −0.252 | 1.31 × 10⁻² | −1.419 | 9.69 × 10⁻¹⁵ | −0.114 | 3.35 × 10⁻¹ | −0.413 | 1.08 × 10⁻⁴ | −4 | −55,555,555 |
| Fat4 | −0.890 | 4.54 × 10⁻⁴ | 0.000 | 1.00 | 0.000 | 1.00 | −1.352 | 1.80 × 10⁻³ | −1.748 | 2.48 × 10⁻¹¹ | −0.210 | 6.03 × 10⁻² | −0.342 | 1.25 × 10⁻² | −4 | −55,555,555 |
| Akt3 | −0.224 | 5.02 × 10⁻³ | −0.482 | 1.34 × 10⁻² | −0.819 | 1.04 × 10⁻¹ | −0.372 | 3.84 × 10⁻³ | −0.602 | 8.66 × 10⁻⁹ | 0.081 | 4.84 × 10⁻¹ | −0.128 | 1.81 × 10⁻¹ | −4 | −55,555,555 |
| Sipa1l2 | −0.553 | 2.89 × 10⁻⁵ | 0.000 | 1.00 | −0.804 | 1.28 × 10⁻¹ | −0.469 | 6.07 × 10⁻³ | −0.918 | 1.36 × 10⁻⁸ | −0.200 | 9.62 × 10⁻² | −0.050 | 6.56 × 10⁻¹ | −3 | −55,555,556 |
| Zfp316 | −0.218 | 4.28 × 10⁻³ | −1.324 | 3.00 × 10⁻⁴ | −1.531 | 1.80 × 10⁻² | −0.912 | 8.63 × 10⁻³ | −0.448 | 1.30 × 10⁻³ | −0.107 | 3.35 × 10⁻¹ | 0.019 | 8.72 × 10⁻¹ | −5 | −55,556,666 |
| Slit1 | −0.284 | 1.93 × 10⁻⁴ | −0.198 | 4.17 × 10⁻¹ | −0.807 | 1.18 × 10⁻¹ | 0.051 | 4.40 × 10⁻¹ | −2.120 | 6.68 × 10⁻¹² | −0.119 | 3.23 × 10⁻¹ | −0.407 | 2.67 × 10⁻⁴ | −3 | −55,566,665 |
| Itsn1 | −0.238 | 3.80 × 10⁻³ | −2.471 | 1.91 × 10⁻³ | −0.915 | 5.91 × 10⁻² | −0.232 | 2.93 × 10⁻³ | −0.785 | 1.52 × 10⁻⁸ | −0.068 | 5.71 × 10⁻¹ | −0.164 | 1.84 × 10⁻¹ | −4 | −55,777,777 |
| Category | ID | Name | Genes | Count | Fold Enrichment | Padj |
|---|---|---|---|---|---|---|
| Cellular component | GO:0030054 | cell junction | Actn2, Ahi1, Arhgap21, Cacna1c, Camk2b, Ccd85a, Chrm1, Chrna7, Clstn2, Ctbp2, Ddn, Dlg5, Dsp, Enah, Eps8, Faim2, Flrt3, Frmd4b, Gabra5, Gabrd, Gria1, Grid1, Hap1, Itsn1, Kctd12, Lgi1, Limd1, Lrrc7, Lrrtm1, Map1b, Mpdz, Mpp2, Nbea, Ncdn, Nfia, Nlgn3, Nos1, Nphp1, Nrxn1, Palm, Palmd, Pcdh1, Plpr4, Prkcg, Prrt1, Ptk2b, Rapgef2, Rgs12, Sarm1, Scn8a, Sema4f, Shisa6, Slc1a1, Sorbs1, Sptb, Sptbn4, Syt7, Tenm2, Traf4, Tspan33, Wasf1 | 61 | 2.43 | 1.70 × 10⁻⁷ |
| GO:0045202 | synapse | Ablim3, Bcan, Cacna1c, Calb1, Camk2b, Capn5, Chrm1, Chrna7, Clstn2, Ctbp2, Ddn, Dlg5, Doc2b, Enah, Eps8, Faim2, Gabra5, Gabrd, Gria1, Grid1, Grip1, Hap1, Itsn1, Kctd12, Lgi1, Lrrc7, Lrrtm1, Lypd1, Map1a, Map1b, Mpdz, Mpp2, Nbea, Ncdn, Nlgn3, Nos1, Nrxn1, Palm, Palmd, Plpr4, Ppfia4, Prkcg, Prrt1, Rapgef2, Rgs12, Sarm1, Sema4f, Shisa6, Slc1a1, Sorbs1, Syt7, Tenm2, Wasf1 | 53 | 2.23 | 5.62 × 10⁻⁵ | |
| Biological process | GO:2000310 | regulation of NMDA receptor activity | Dapk1, Mapk8ip2, Nlgn3, Nrxn1, Ptk2b, Rasgrf1, Rasgrf2 | 7 | 13.9 | 1.83 × 10⁻² |
| KEGG pathway | mmu04713 | circadian entrainment | Adcy1, Adcy9, Adcyap1r1, Cacna1c, Cacna1d, Camk2b, Gng7, Gria1, Nos1, Per3, Prkcg, Ryr1, Ryr2 | 13 | 4.82 | 3.85 × 10⁻³ |
| mmu04911 | insulin secretion | Abcc8, Adcy1, Adcy9, Adcyap1r1, Atf6b, Cacna1c, Cacna1d, Camk2b, Gck, Prkcg, Ryr2 | 11 | 4.65 | 3.12 × 10⁻² |
| Category | ID | Name | Genes | Count | Fold Enrichment | Padj |
|---|---|---|---|---|---|---|
| Cellular component | GO:0030424 | axon | Bdnf, Cdk5r1, Cst3, Dclk1, Dcx, Drd1, Ntrk2, Pink1, Ptpn5, Sema3a, Stx1b, Stxbp1, Tubb3 | 13 | 4.97 | 2.26 × 10⁻³ |
| GO:0009986 | cell surface | Bgn, Cd14, Cd151, Drd1, Ephb6, Fcgr4, H2-K1, H2-Q10, Ifitm3, Itgav, Ntrk2, Prlr, Tfrc, Tyro3 | 14 | 3.48 | 3.44 × 10⁻² | |
| GO:0005576 | extracellular region | Bdnf, Bgn, Brinp2, C1qb, Ccdc3, Cd14, Ccn4, Cst3, Ephb6, Gsn, Igfbp6, Lyzl4, Nptx2, Olfm3, Pcsk2, Sema3a, Sema3c, Serpina3n, Spock3, Tfrc, Vgf, Vip, Wnt10a | 23 | 2.37 | 3.62 × 10⁻² | |
| KEGG pathway | mmu04010 | MAPK signaling pathway | Bdnf, Cacna2d2, Cd14, Gadd45a, Kras, Mapk9, Mapk11, Ntrk2, Ptpn5, Rasgrp1 | 10 | 5.65 | 9.09 × 10⁻³ |
| Molecular function | GO:0016301 | kinase activity | Cdk5r1, Cdkl5, Cmpk1, Dclk1, Mapk4, Mapk9, Mapk11, Melk, Ntrk2, Pak5, Pink1, Prkar1b, Tyro3 | 13 | 3.73 | 4.60 × 10⁻² |
| Category | ID | Name | Genes | Count | Fold Enrichment | Padj |
|---|---|---|---|---|---|---|
| KEGG pathway | mmu04010 | MAPK signaling pathway | Akt3, Cacna1d, Flt3, Hspa2, Il1r1, Map3k4, Ntf3, Rasgrf1, Rps6kas, Stk4, Tgfb2 | 11 | 5.17 | 7.67 × 10⁻³ |
Publisher’s Note: MDPI stays neutral with regard to jurisdictional claims in published maps and institutional affiliations. |
© 2022 by the authors. Licensee MDPI, Basel, Switzerland. This article is an open access article distributed under the terms and conditions of the Creative Commons Attribution (CC BY) license (https://creativecommons.org/licenses/by/4.0/).
Share and Cite
Ibrahim, E.C.; Gorgievski, V.; Ortiz-Teba, P.; Belzeaux, R.; Turecki, G.; Sibille, E.; Charbonnier, G.; Tzavara, E.T. Transcriptomic Studies of Antidepressant Action in Rodent Models of Depression: A First Meta-Analysis. Int. J. Mol. Sci. 2022, 23, 13543. https://doi.org/10.3390/ijms232113543
Ibrahim EC, Gorgievski V, Ortiz-Teba P, Belzeaux R, Turecki G, Sibille E, Charbonnier G, Tzavara ET. Transcriptomic Studies of Antidepressant Action in Rodent Models of Depression: A First Meta-Analysis. International Journal of Molecular Sciences. 2022; 23(21):13543. https://doi.org/10.3390/ijms232113543
Chicago/Turabian StyleIbrahim, El Chérif, Victor Gorgievski, Pilar Ortiz-Teba, Raoul Belzeaux, Gustavo Turecki, Etienne Sibille, Guillaume Charbonnier, and Eleni T. Tzavara. 2022. "Transcriptomic Studies of Antidepressant Action in Rodent Models of Depression: A First Meta-Analysis" International Journal of Molecular Sciences 23, no. 21: 13543. https://doi.org/10.3390/ijms232113543