Article

Comparative Genomic and Expression Analysis Insight into Evolutionary Characteristics of PEBP Genes in Cultivated Peanuts and Their Roles in Floral Induction

Peanut Research Institute, College of Agronomy, Shenyang Agricultural University, Shenyang 110000, China
*
Authors to whom correspondence should be addressed.
These authors contributed equally to this work.
Int. J. Mol. Sci. 2022, 23(20), 12429; https://doi.org/10.3390/ijms232012429
Submission received: 30 August 2022 / Revised: 12 October 2022 / Accepted: 14 October 2022 / Published: 17 October 2022
(This article belongs to the Special Issue Comparative Genomics and Functional Genomics Analysis in Plants)

Abstract

:
Phosphatidyl ethanolamine-binding proteins (PEBPs) are involved in regulating flowering time and various developmental processes. Functions and expression patterns in cultivated peanuts (Arachis hypogaea L.) remain unknown. In this study, 33 PEBP genes in cultivated peanuts were identified and divided into four subgroups: FT, TFL, MFT and FT-like. Gene structure analysis showed that orthologs from A and B genomes in cultivated peanuts had highly similar structures, but some orthologous genes have subgenomic dominance. Gene collinearity and phylogenetic analysis explain that some PEBP genes play key roles in evolution. Cis-element analysis revealed that PEBP genes are mainly regulated by hormones, light signals and stress-related pathways. Multiple PEPB genes had different expression patterns between early and late-flowering genotypes. Further detection of its response to temperature and photoperiod revealed that PEBPs ArahyM2THPA, ArahyEM6VH3, Arahy4GAQ4U, ArahyIZ8FG5, ArahyG6F3P2, ArahyLUT2QN, ArahyDYRS20 and ArahyBBG51B were the key genes controlling the flowering response to different flowering time genotypes, photoperiods and temperature. This study laid the foundation for the functional study of the PEBP gene in cultivated peanuts and the adaptation of peanuts to different environments.

1. Introduction

Flowering is an important process that determines the success of plant reproduction. Plants must accurately combine internal and environmental signals to start the flowering process. The molecular mechanism of plant flowering is regulated by different pathways. The current research based on Arabidopsis has found that flowering pathways include light-dependent, autonomous, vernalization, gibberellin, temperature and age pathways [1,2]. Different pathways converge to downstream phosphatidylethanolamine-binding protein (PEBP) genes through molecular regulation, and these genes are transmitted downstream to floral meristem identify genes, which determine the formation of flowering [3].
PEBP is a kind of conserved protein found in plants that engages in several biological processes such as flowering time regulation and plant architecture management [1,2]. PEBP proteins are classified into three types: FLOWERING LOCUS T-like protein, TERMINAL FLOWER1 (TFL1)-like proteins and MOTHER OF FT AND TFL1 (MFT)-like proteins [4]. The FT-like subfamily in Arabidopsis has two members, FT and TWIN SISTER OF FT (TSF), both of which promote the transition from vegetative to reproductive growth [5]. FT is an activating protein that has been demonstrated to migrate from the leaves to the shoot apical meristem and interact with the transcription factor FLOWERING LOCUS D (FD) to speed up flowering [6]. TSF, the homologous gene of FT, promotes A. thaliana early flowering and has a redundant effect similar to that of FT overexpression [7]. TFL1, Arabidopsis thaliana CENTRORADIALIS (ATC) and BROTHER OF FT (BFT) are members of the TFL1-like subfamily, all of which have been shown to postpone flowering time [8,9]. TFL1 has a role in inhibiting flowering and plant architectural control by regulating the meristem genes [10]. ATC is a short-day triggered floral inhibitor, and overexpression of ATC can enhance the late-flowering phenotype [4]. Another member of the TFL1 subfamily is FT’s and TFL1’s brother (BFT). BFT overexpression in A. thaliana causes delayed flowering, although the bft mutant does not have the same phenotype as the tfl1 mutant [11]. MOTHER OF FT AND TFL1 (MFT) is the ancestor gene of FT and TFL1 and is involved in seed germination and development. MFT is found in high concentrations in seeds and roots and induces seed dormancy [12]. Overexpression of AtMFT can result in early flowering, but not to the same extent as FT. Furthermore, MFT is expressed exclusively in seeds, mostly via the ABA and GA signaling pathways, to assist in seed germination control [13].
Flowering characteristics of crops are of great significance to crop production. As a core gene in the flowering process, the PEBP gene has been identified and analyzed in many corps, such as the Arabidopsis FT gene ortholog Hd3a in rice (Oryza sativa), FT homologs in soybean (Glycine max) and the ZCN genes in maize (Zea mays) [14,15,16]. Hd3a, a rice FT ortholog of Arabidopsis, moves from the leaf to the shoot apical meristem and induces flowering [16]. The FT homologous gene GmFT1a in soybean is a flower-forming inhibitor. When the condition changes from short-day to long-day, soybean varieties that are sensitive to photoperiods will have delayed flowering, and the GmFT2a/5a gene is a flower-promoting gene, which is opposite to the expression of GmFT1a [17,18]. CENTRORADIALIS 8 (ZCN8) in maize (Zea mays) was expressed in the shoot apical meristem under short-day treatment, and its expression in the shoot apical meristem was not detected under long-day treatment. Therefore, ZCN8 is a key gene for flower formation in maize [19].
The cultivated peanut (Arachis hypogaea L.) is an oil crop widely grown around the world, which not only provides abundant oil products but also contains rich nutrients. Flowering time has a strong impact on biomass production, and it is therefore necessary to understand how flowering is regulated in important crops such as peanut. The flowering time of peanuts directly determines the growth duration and is closely related to peanut yields and growing regions [20]. Investigating the molecular patterns of flowering genes in peanuts and improving the effective flowering time can increase peanut production [21,22]. As an allotetraploid plant, peanut (AABB, 2n = 4x = 40) is produced from two diploid species, A. duranensis (AA genome) and A. ipaensis (BB genome) [23,24]. The PEBP genes in diploid wild peanut species were identified, and the PEBP genes in cultivated peanuts and tissue-specific expression pattern based on transcriptome data was analyzed [25]. In order to further understand the gene structure and function of PEBP genes in cultivated peanuts, in the present study, we re-identified the PEBP genes of cultivated and wild peanuts, explored their evolutionary characteristics in cultivated peanuts through comparative genomics, and further identified their floral induction and mechanisms to genoytpes, photoperiod and temperature. This study will contribute to further insight into the molecular function and regulation of PEBP genes in peanuts.

2. Results

2.1. Identification of PEBP Proteins

The Hidden Markov Model PF01161 was used as a query to identify the PEPB genes in the peanut genome and its two ancestors, and total of 64 protein candidate sequences have been identified in three Arachis genomes including 16 of A. ipaensis, 16 of A. duranensis and 32 of A. hypogaea. Six PEBP proteins of A. thaliana were used to perform a genome-wide search on 3 Arachis species, and all 64 genes were confirmed to be homologous with Arabidopsis (Table S1). These protein sequences were submitted to databases CDD, Pfam and SMART for identification of their PEBP conserved domain, and all the genes contained complete PEBP domains. A total of 32 protein sequences from A. hypogaea, 16 from the A. duranensis and 16 from the A. ipaensis were identified as PEBP proteins. The PEBP protein sequences of peanuts and Arabidopsis thaliana were clustered and compared with the gene structure, and it was found that PEBP genes were divided into 4 different types including FT, TFL, MFT and FT-like (Figure 1, Table S1). Among the 33 FT-type genes, there are 16 A. hypogaea genes, 8 A. duranensis genes and 9 A. ipaensis genes, while the TFL-type genes contains 8 A. hypogaea genes and 8 wild peanut genes. Among the 8 MFT-type genes, there are 4 wild peanut genes and 4 cultivated peanut genes, and the FT-like contains 4 cultivated peanut and 3 wild peanut genes. The full length of the candidate PEBP protein sequence, the molecular weight (MW), the isoelectric point (pI) and predicted subcellular localization were summarized (Table S1). The full length of the 53 protein sequences ranges from 103 to 216. The MW (kDa) range of these protein sequences is from 11.20 to 24.70, and pI is from 4.85 to 9.68. The vast majority of genes were predicted to be localized in the cytoplasm. All parameters are consistent with the range of the PEBP domain.

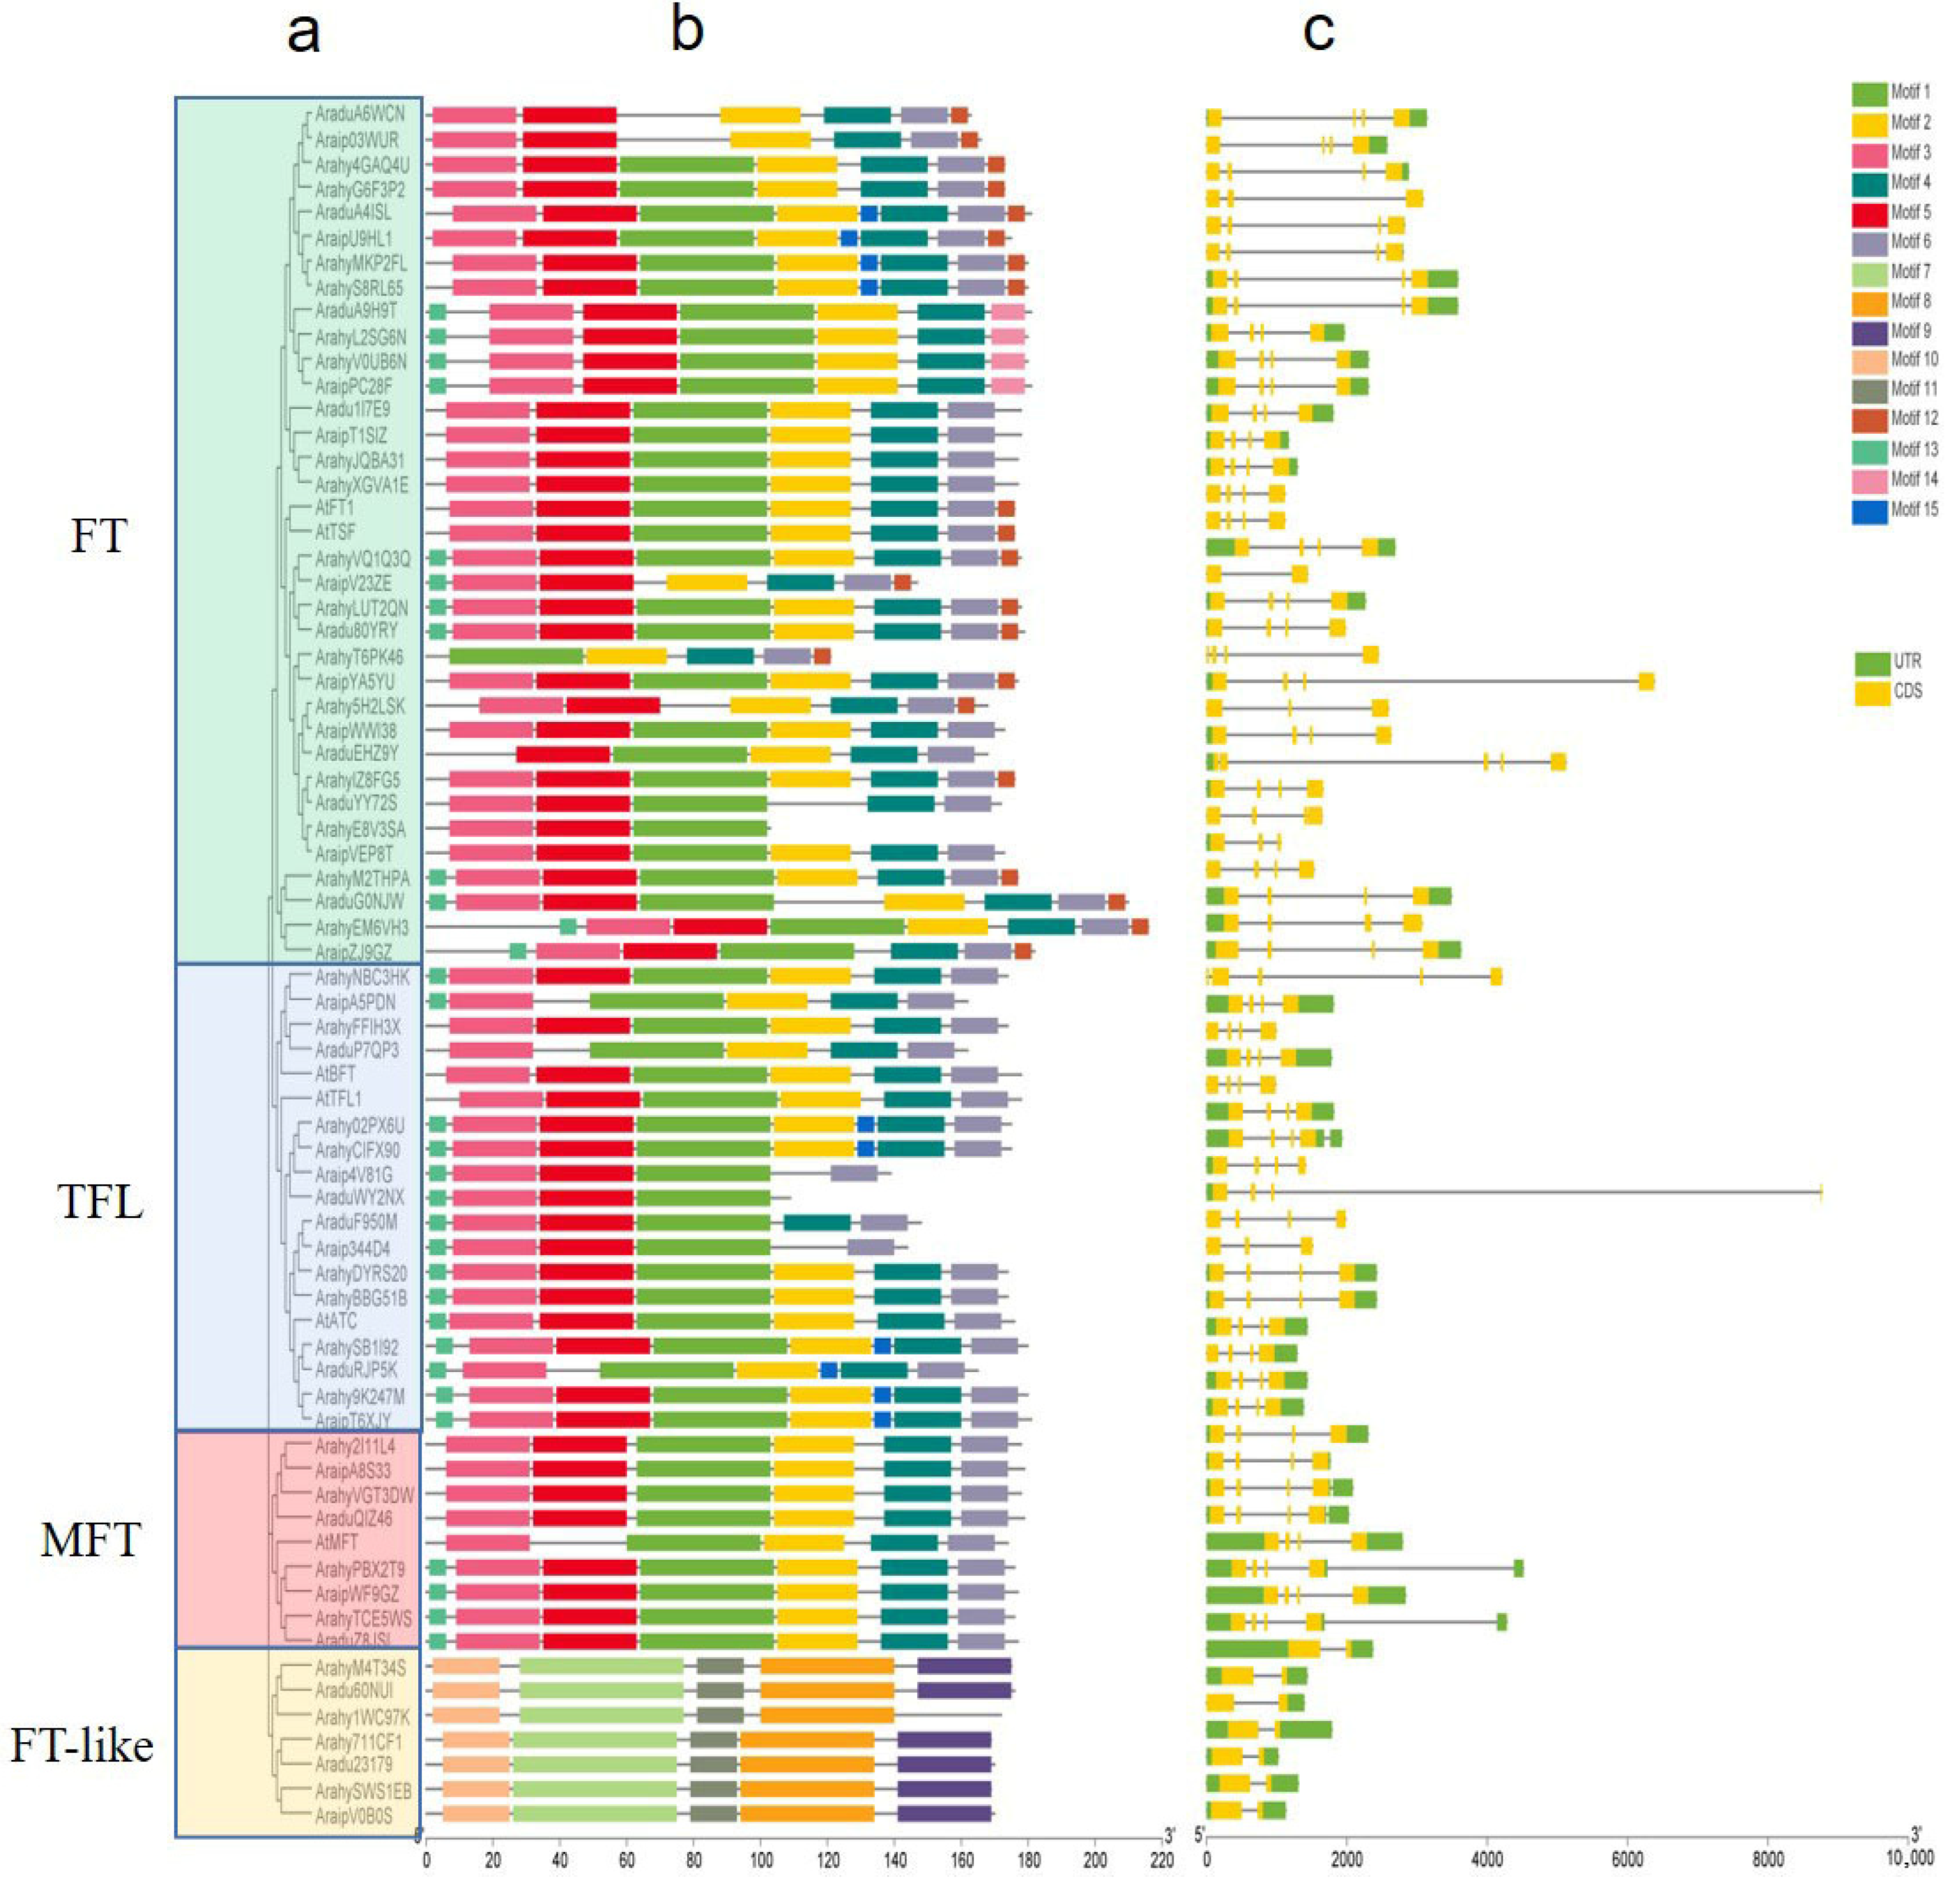
2.2. Structure and Orthologous Relationship Analysis of PEBP Genes

Conserved motifs in the 64 PEBP proteins were identified using the MEME online tool. In total, 15 motifs were identified in the peanut proteins, and the motifs identified were 6 to 50 amino acids in length (Figure 1 and Figure S1). The FT, TFL and MFT genes contain similar motifs, but no motif is shared by FT, TFL and MFT, and the motifs in FT-like are different to the other three classes, implying that it may be functionally different from typical PEBP genes. When comparing the PEPB proteins of cultivated peanuts with wild peanut, the genes in A. hypogaea are differentiated in structure; for example, motif 1 is absent in wild peanut protein AraduA6WCN and Arip03WUR compared with their orthologies, ArahyG6F3P2 and Arahy4GAQ4U, in cultivated peanuts. In TFL sub-family, Arahy02PX6U and AraHyCIFX90 contains motif 15 while their orthologies, Araip4V81G and Araip344D4, do not. The intron-exon structure pattern was explored based on the genome annotation file (GFF) to acquire a better understanding of the structural diversity of PEBP genes. Compared with the diploid wild peanut, A. hypogaea has four typical exons and three introns, except for FT-like, and has similar UTR and intron length, while the wild peanut has nine genes that did not fit this profile.
Orthologous relationships were identified between the A and B subgenomes of A. hypogaea and the wild diploid peanut based on phylogenetic analysis for FT, TFL and MFT clades (Figure 2). The results showed that PEBPs had high similarity between orthologous genes, indicating that PEBP genes were highly conserved in the evolutionary process. The similarity between A and B subgenomes reached more than 90%, except for the gene pair ArahyIZ8FG5 and ArahyE8V3SA, which were only 57.39% similar. The similarity of five genes between the two wild diploids was less than 80%, indicating that the sequences of the A and B subgenomes of the cultivated peanut tended to be more similar when compared to the pairs between A. duranensis and A. ipaensis. Some genes retained high similarity to A. duranensis, such as ArahyLUT2QN and ArahyIZ8FG5, and some genes retained high similarity to A. ipaensis, such as Arahy9K247M, Arahy2I11L4 and ArahyPBX2T9. Interestingly, some genes in the A and B subgenomes produced higher similarity to each other than their wild ancestor, such as gene pairs ArahyG6F3P2 and Arahy4GAQ4U, ArahyS8RL65 and ArahyMKP2FL, ArahyFFIH3X and ArahyNBC3HK, Arahy02PX6U and ArahyCIFX90 and ArahyDYRS20 and ArahyBBG51B. The sequence variation characteristics of different genes in cultivated peanuts may be the result of the adaptation of flowering traits to the environment.

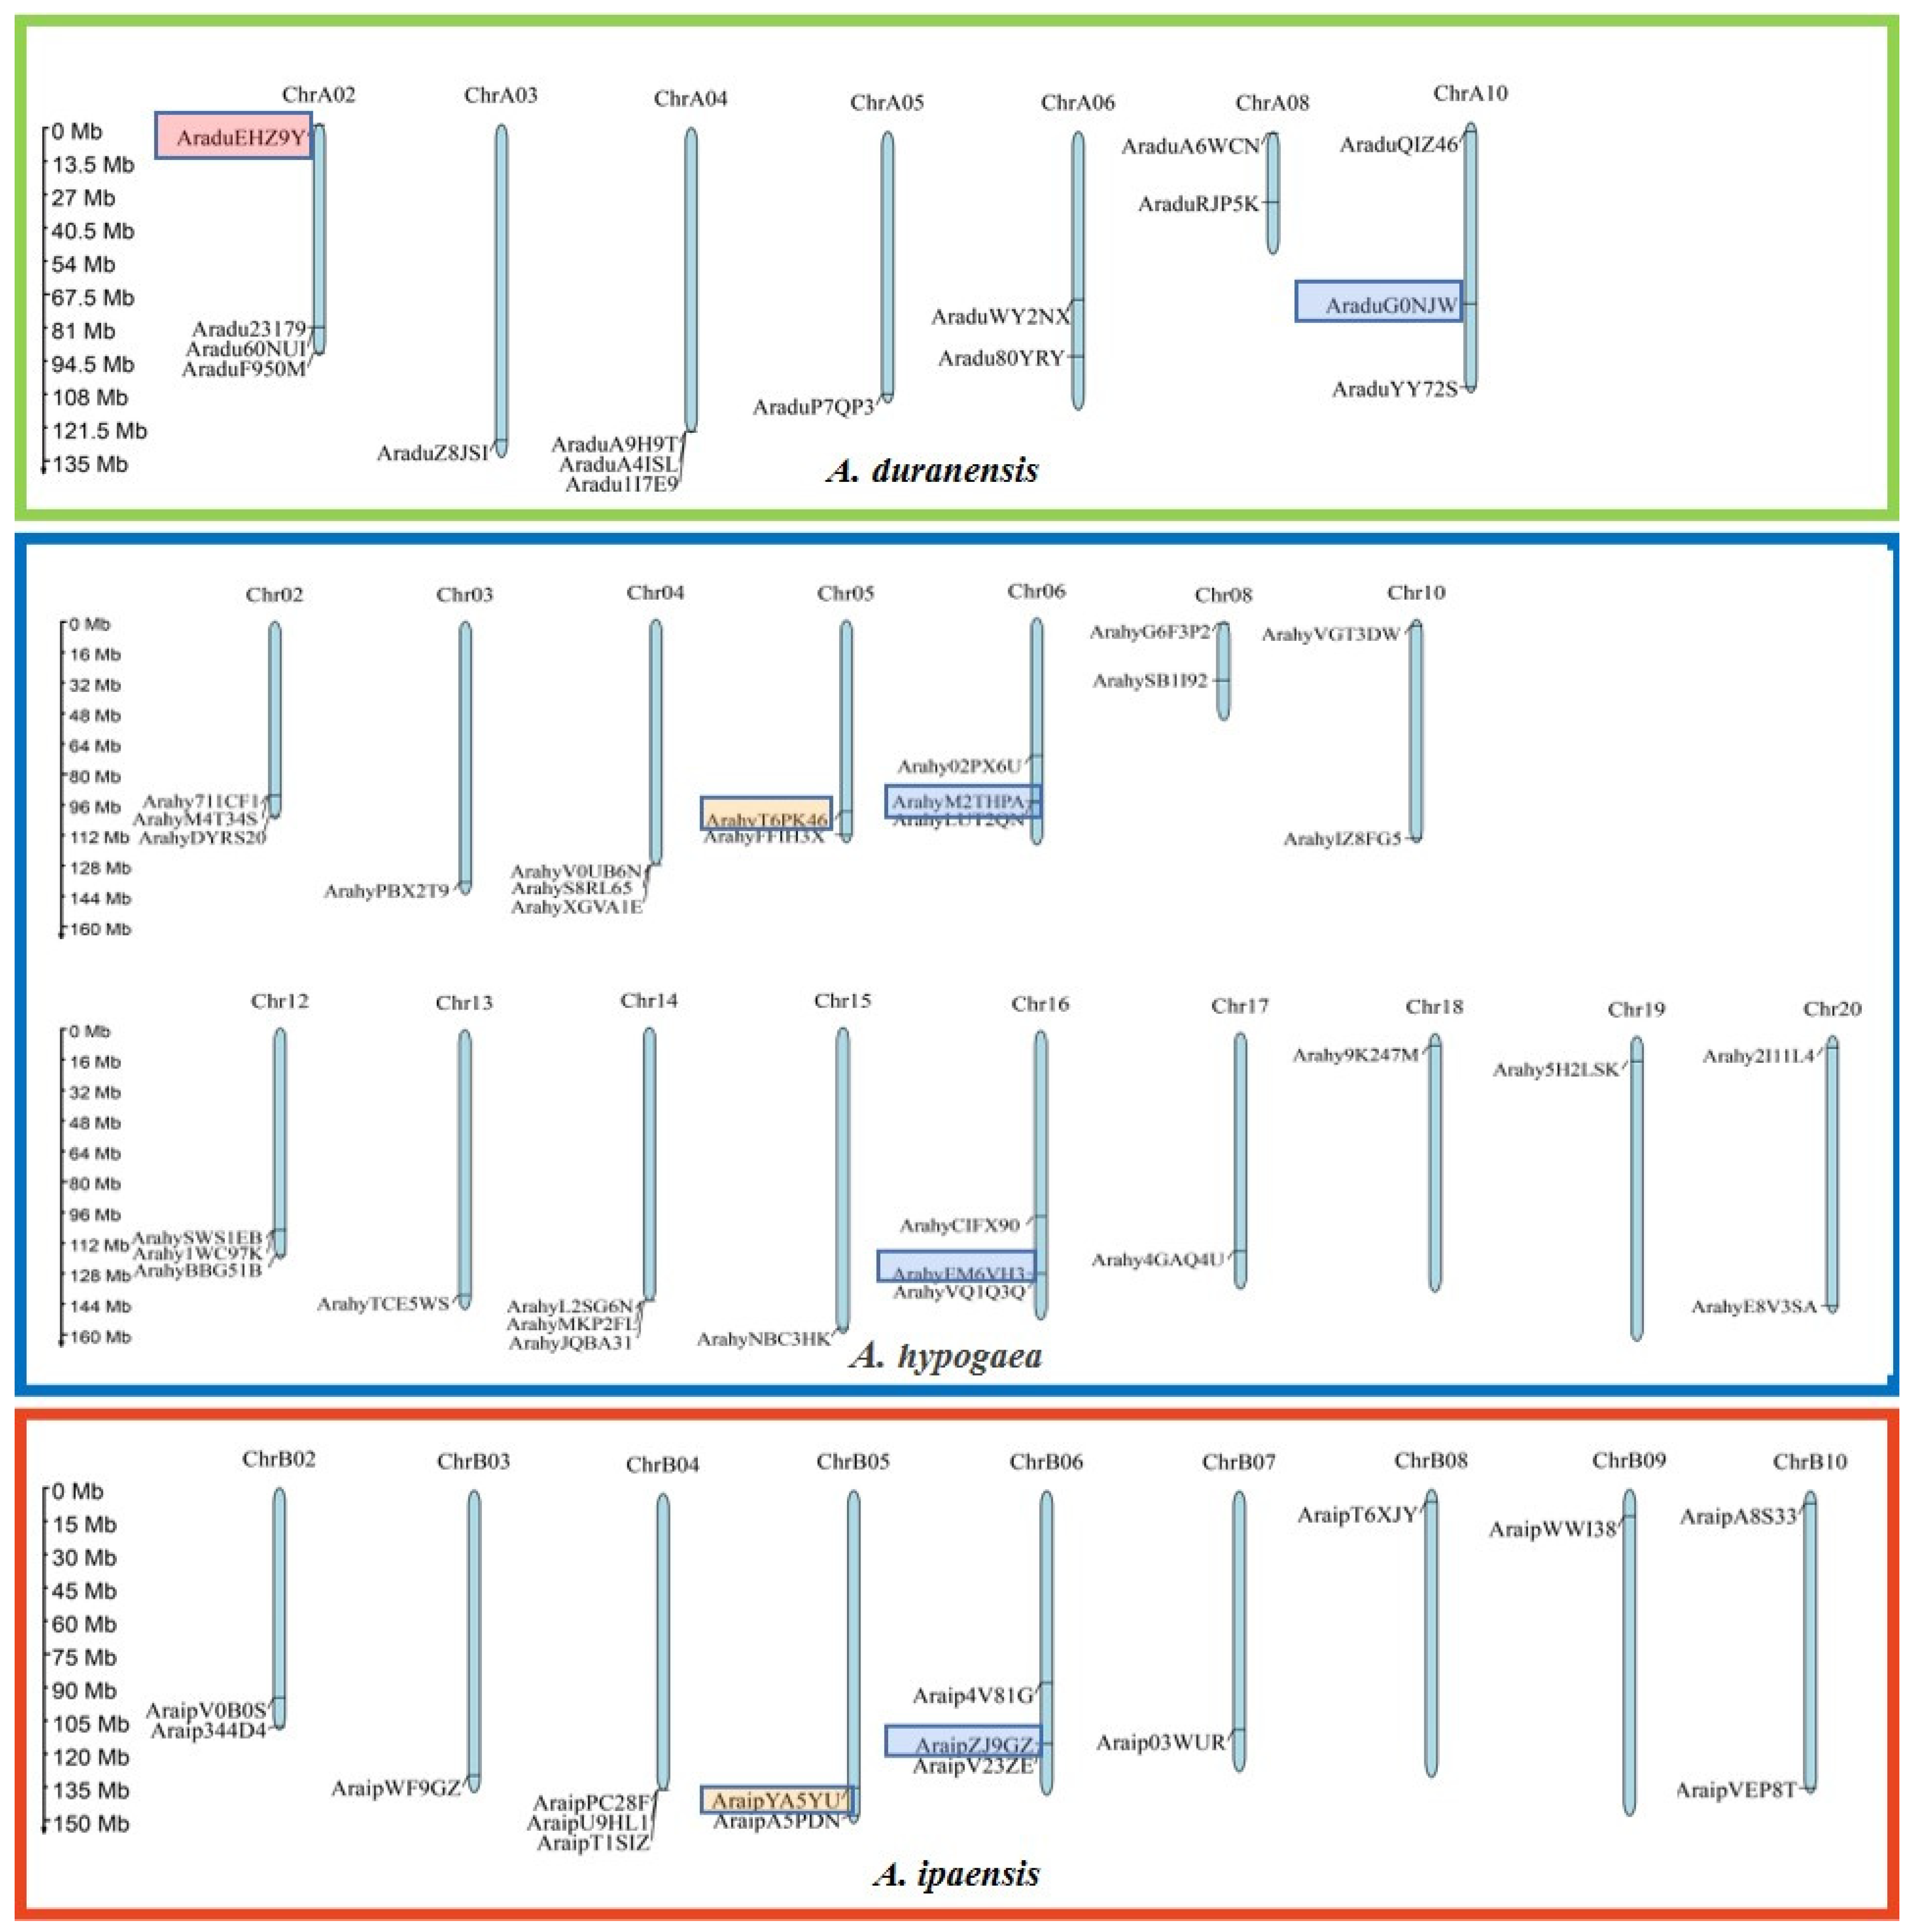
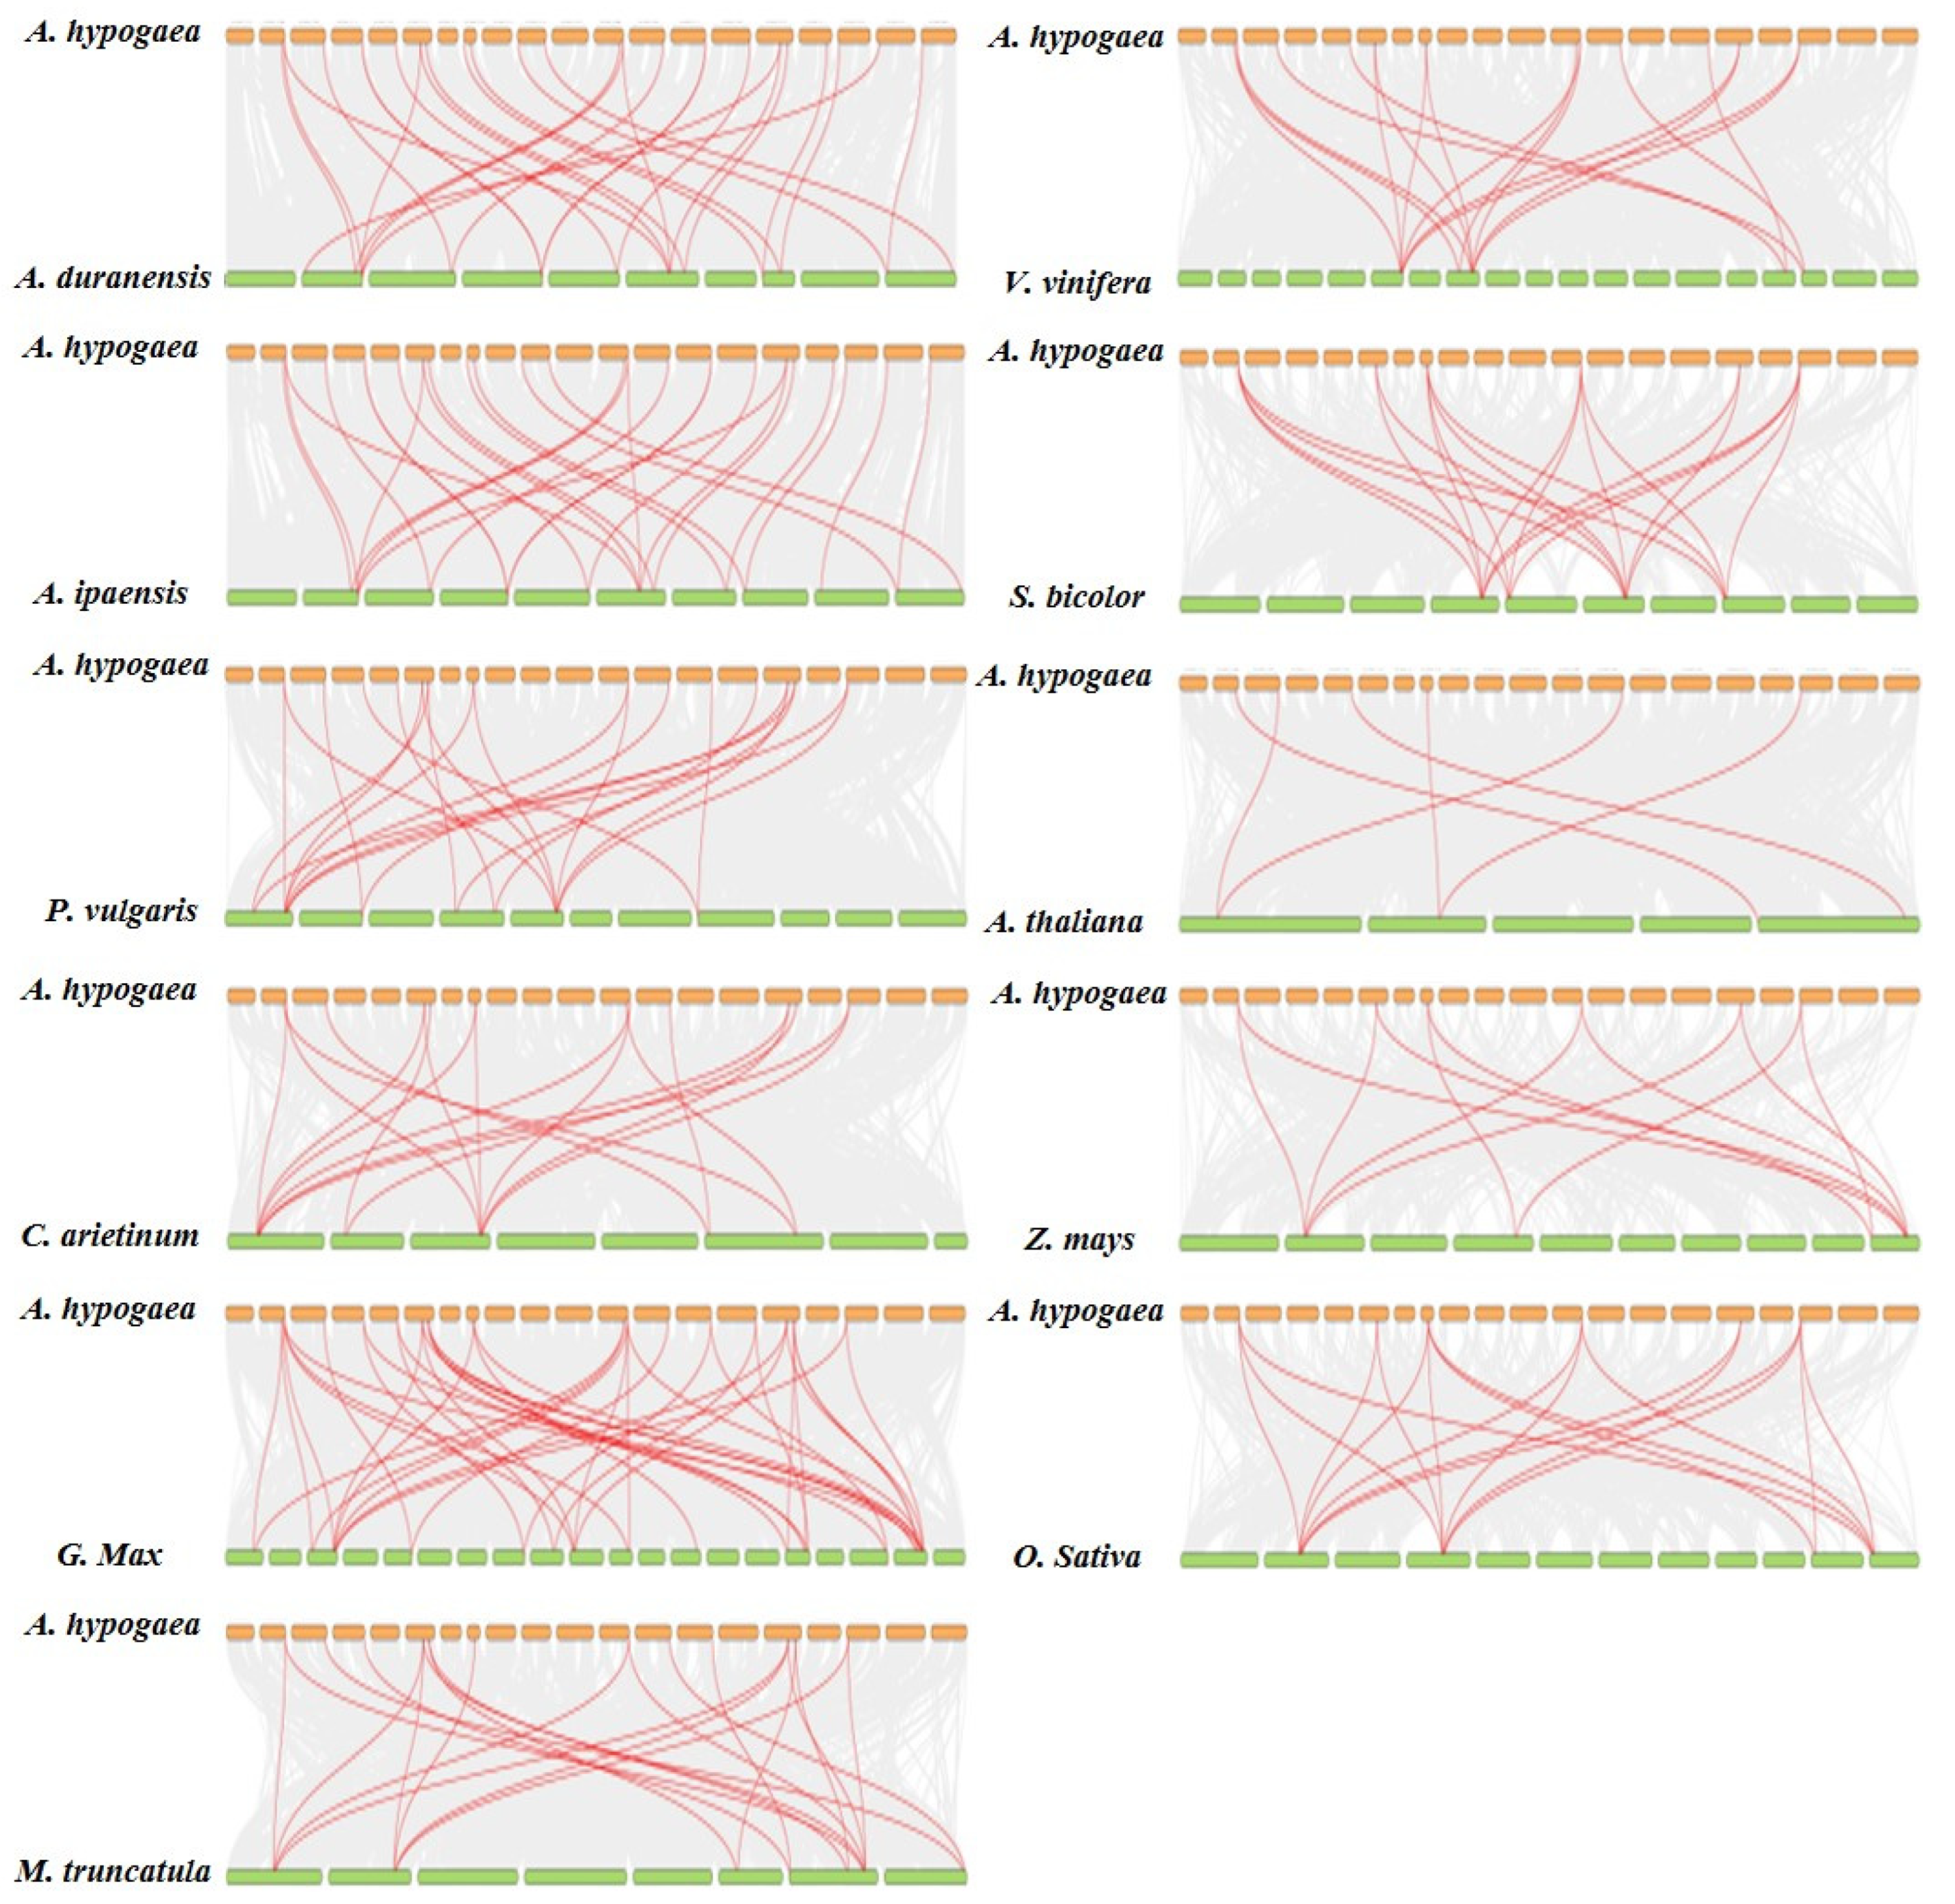
2.3. Distribution on Chromosomes and Synteny Analysis of PEBP Genes

The distribution map of the PEBP genes was drawn based on the gene position on the chromosome (Figure 3). The 32 PEBP genes of cultivated peanuts were distributed on 16 chromosomes and corresponded to those of wild peanuts. The chromosomal location of PEBPs in cultivated peanuts is consistent with the majority PEBPs of wild peanuts. Combined with the results of orthologous analysis, AraduEHZ9Y was absent in the corresponding position of cultivated peanuts. AraipYA5YU was not found in the corresponding position of chromosome 15 in the B subgenome of cultivated peanuts, but appeared on chromosome 5 in A subgenome, which may suggest that the gene has undergone homologous recombination between the A and B subgenomes. The location of ArduG0NJW is inconsistent with its orthologous gene, ArahyM2THPA, probably because ArduG0NJW is transposed in wild peanuts. This result showed that the peanut PEBP genes were homologous to that of wild peanuts, but some genes were transposed or recombined.
To further explore the evolutionary relationship of PEBP genes between cultivated peanuts, A. hypogaea, and other species, collinearity was investigated between PEBPs and homologs among other species. Homolog pairs were identified between PEBPs in A. hypogaea and other plants, including wild diploid peanuts, soybean, chickpea, alfalfa, common beans, Arabidopsis, grapes, rice, sorghum and maize (Figure 4). The number of colinear pairs between A. hypogaea and wild peanut species was both 28, respectively. The number of gene pairs in cultivated peanuts and other legumes including soybean, common bean, alfalfa and chickpea is 41, 22, 21 and 18, respectively; the number of gene pairs in the dicotyledonous plants grape and Arabidopsis is 20 and 6, and the gene pairs of monocotyledonous plants sorghum, rice and maize are 20, 18 and 12, respectively. The results show that the genetic relationship between PEBPs in cultivated peanuts and PEBPs in soybean, wild peanuts, common bean and alfalfa is close, and has a long distance of phylogenetic relationship with Arabidopsis. The TFL genes, Arahy02PX6U, ArahyCIFX90, ArahySB1I92, Arahy9K247M, ArahyDYRS20 and ArahyBBG51B exhibit the most homologous gene pairs with other species (Table S2). These 6 genes were present in a total of 22 to 25 gene pairs in cultivated peanuts and other species, compared with only 2 to 9 gene pairs for other PEBP genes. These results suggest these genes may play crucial roles in the PEBP gene family during evolution and have important functions.
The Ka/Ks ratios of PEBP gene pairs were determined to better understand the evolutionary limitations impacting the PEBP gene family. The Ka/Ks ratio of gene pairings between PEBP genes and their orthologous genes was less than 1, suggesting that the PEBP gene family has been subjected to intense selection pressure during evolution (Table S3).

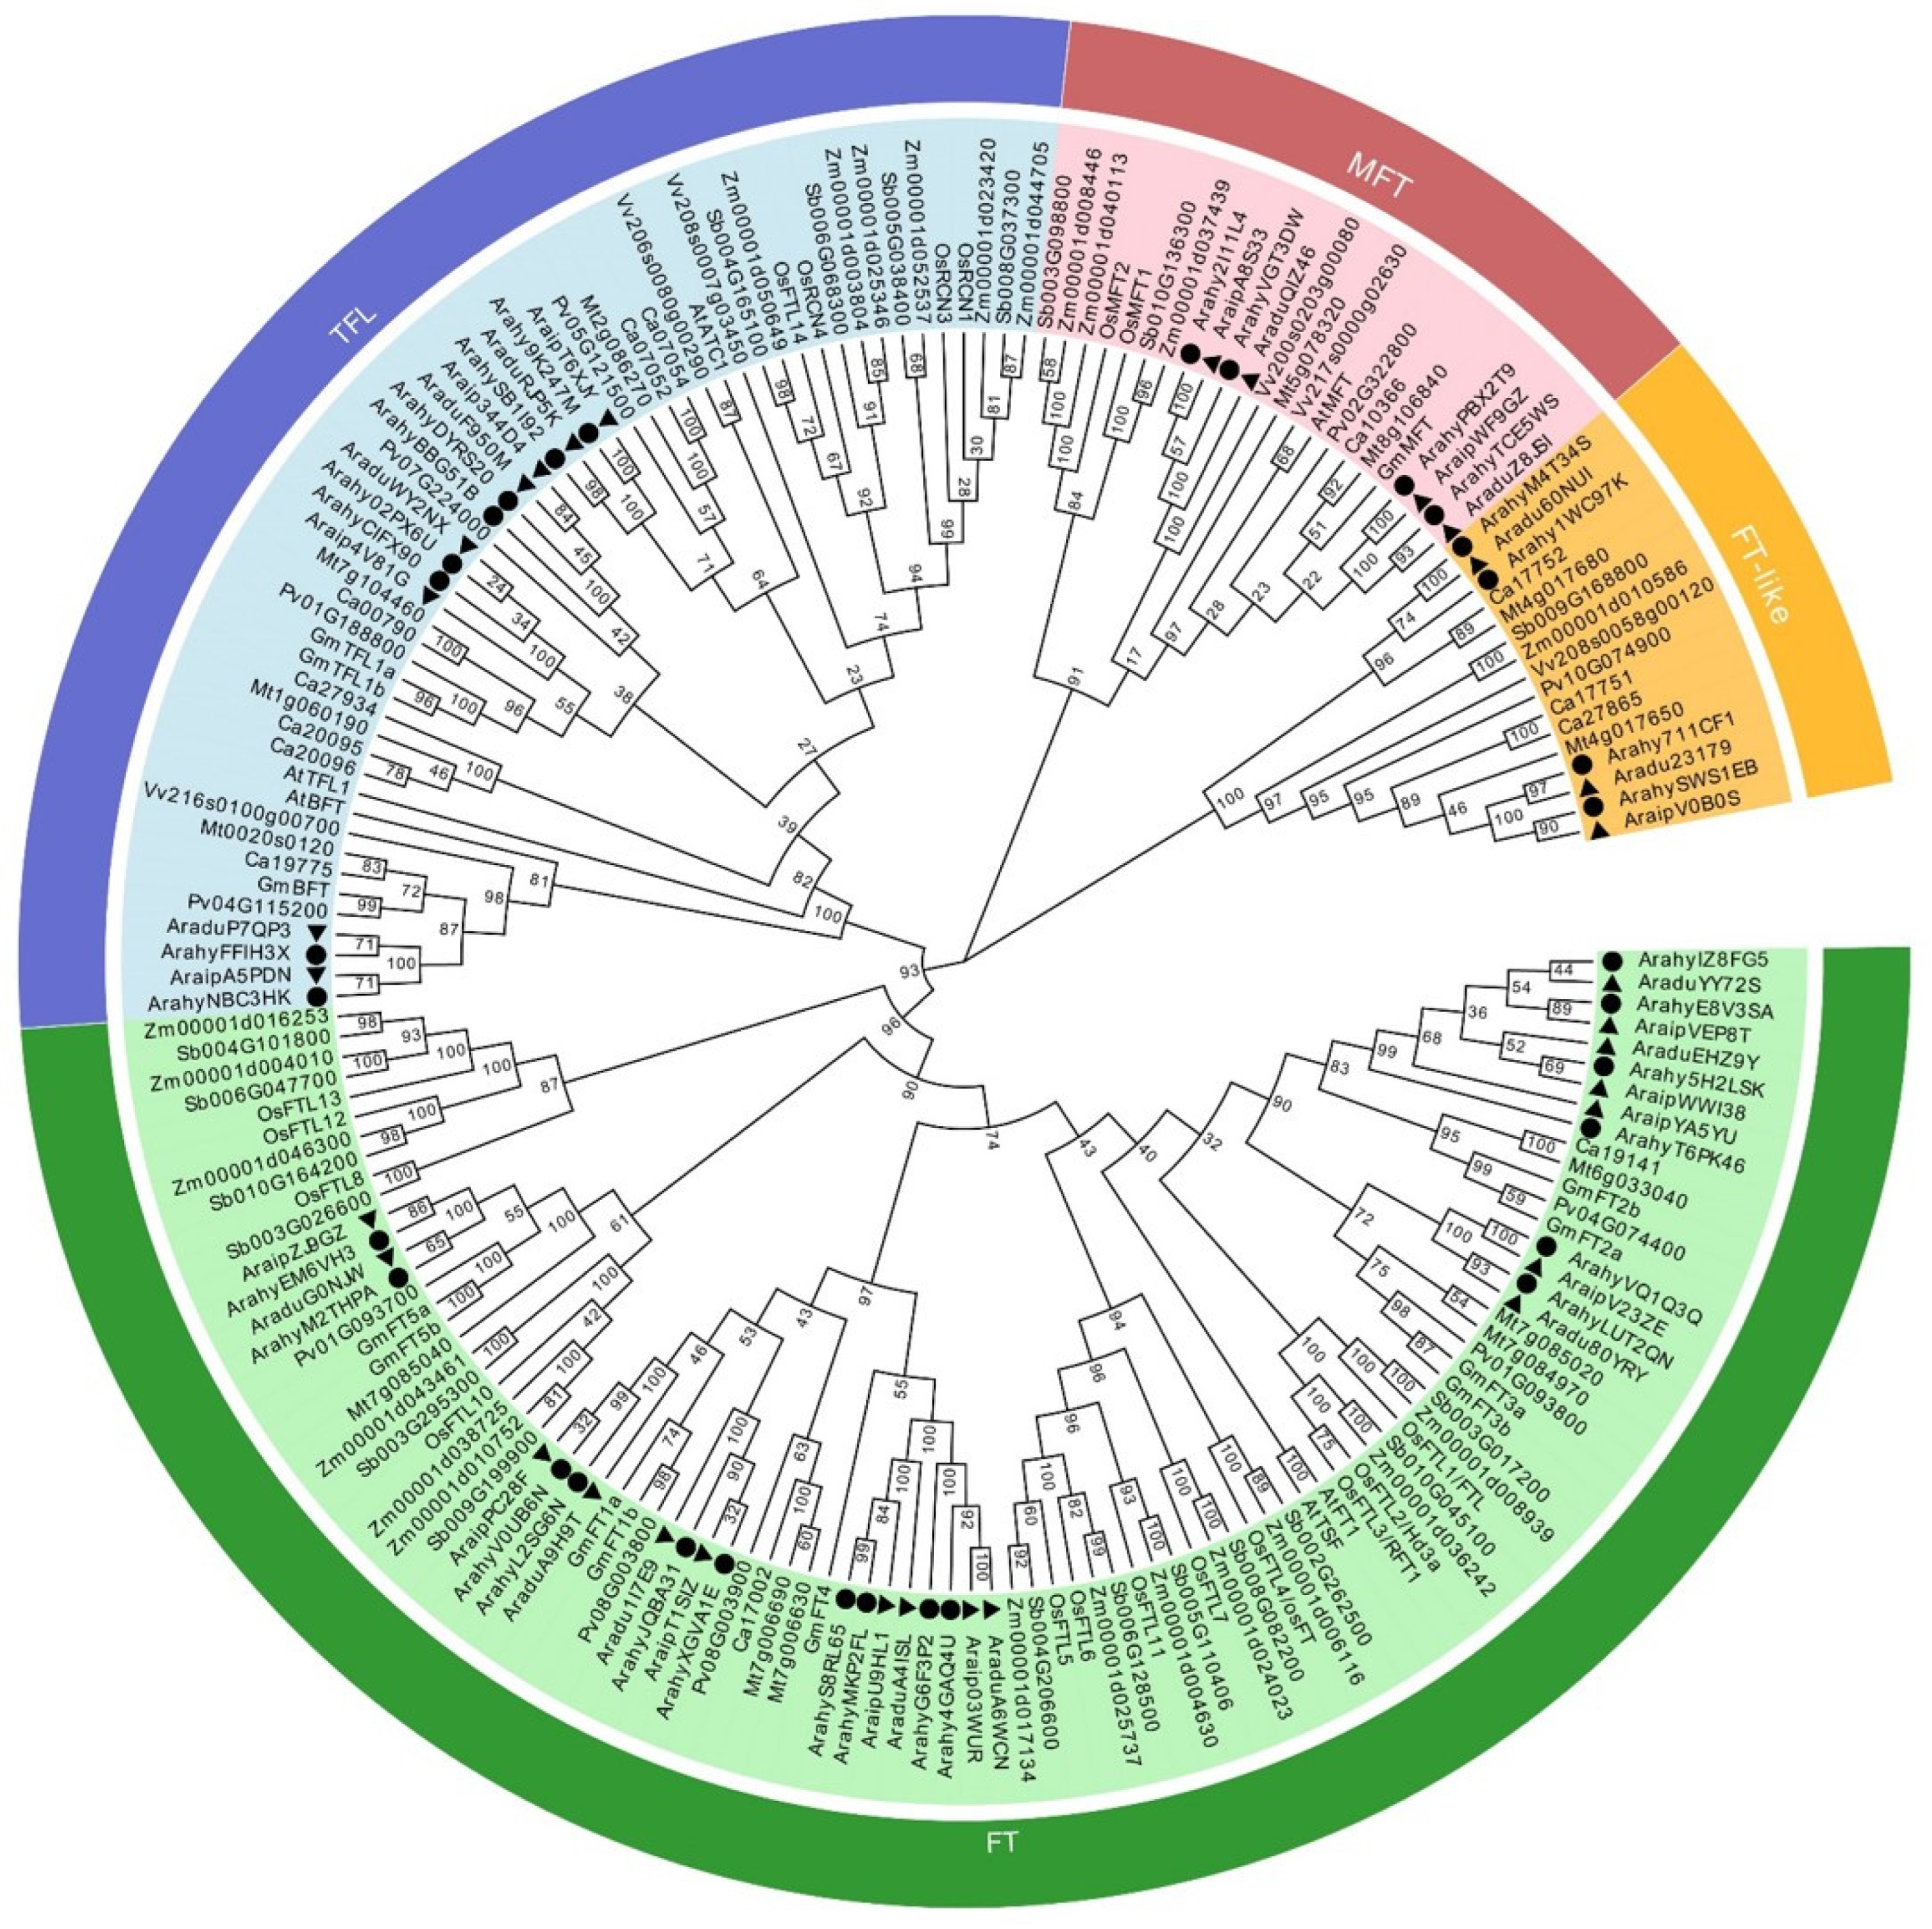
2.4. Phylogenetic Analysis for PEBP Genes among Cultivated Peanust and Other Plant Species

To investigate the phylogenetic relationship between the PEBP genes in the Arachis and other plants, a phylogenetic tree was constructed with the Neighbor-joining method (Figure 5). In total, 188 PEBP protein sequences in wild diploid peanuts, soybean, chickpea, alfalfa, common beans, Arabidopsis, grapes, rice, sorghum and maize were used for multiple sequence alignment to construct a phylogenetic tree. The PEBP sequences of A. ipaensis, A. duranensis and A. hypogaea were classified into four different subgroups, MFT, TFL, FT and FT-like subgroups, respectively. In the four subgroups, the number of PEBP genes in the MFT subgroup is 23. In the TFL subgroup, there are a total of 54 genes, and the FT subgroup contains a total of 95 genes. Most of the two genes in the two diploid Arachis are orthologous to the two genes in the cultivated peanut, A. hypogaea, which is consistent with the distribution of genes on the chromosomes (Figure 3). The phylogenetic analysis showed that the PEBP genes of peanuts have a close genetic distance with other legumes.

2.5. Cis-Element in the Promoter Region of PEBP Genes

Promoter activities play a crucial role in regulating gene functions. To understand the genetic functions, metabolic networks, and regulatory mechanisms of PEBP genes, the cis-elements in their promoter regions are analyzed. In total, 1648 cis-acting elements of 51 types were predicted to contain potential functions (Figure 6). The different types of cis-elements were classified into 14 categories according to the type of function-related and regulatory pathways (Figure 6), and the homologous genes from A and B genomes, respectively, which had similar promoter elements. These cis- elements are functionally involved in growth and development, hormonal regulation and response to stress. Among the 14 different functional categories, the most abundant are 853 light response-related cis-elements, which also indicate that flowering regulation in peanuts is closely related to light response. The next is hormone regulation-related elements, including 177 MeJA, 180 Abscisic acid, 73 Gibberellin and 39 Auxin responsiveness-related elements, indicating that flowering regulation in peanuts may depend on these hormone regulations. In addition, there are some cis-acting elements related to stress response, such as drought and low temperature.

2.6. Phenotypic Identification of Peanut Cultivars with Different Flowering Times in Response to Photoperiod and Temperature

Four peanut genotypes with different flowering times were selected to identify responses to temperature and photoperiod, namely the early-flowering genotypes Silihong (abbreviation: SLH) and Baihua5 (abbreviation: BH5), and the late-flowering genotypes Huayu22 (abbreviation: HY22) and Tifrunner (abbreviation: TIF). The early and late-flowering genotypes were placed in three environments, long day and high temperatures (LDHT), short day and high temperatures (SDHT) and short day and low temperatures (SDLT). The results showed that there was no significant difference in the number of total flowers and the length of the flowering period. The flower initiation time and the whole flowering period showed significant delays under different temperature treatments but did not change significantly between photoperiod treatments (Figure 7, Tables S4 and S5). Under the same environmental treatment, the early-flowering genotypes SLH and BH5 started flowering 9–11 days earlier than the late-flowering genotypes TIF and HY22. Compared with SDHT treatment, the flowering time of the four genotypes did not change significantly under the long-day treatment (LDHT), while the flowering time of the four genotypes under low temperature (SDLT) was delayed by 4–5 days, respectively (Figure 7).

2.7. PEBP Expression Pattern Analysis Responds to Genotypes, Temperature and Photoperiod in Early and Late Flowering Genotypes

To elucidate the involvement of PEBP genes causing differences in flowering time, the early and the late-flowering genotypes were selected for expression analysis of transcripts (Figure 8). Genes with a two-fold difference in gene expression levels between early-flowering and late-flowering genotypes at a time point were considered to have differences in expression patterns. Some genes were expressed at lower levels and showed no significant difference in expression patterns between early and late flowering genotypes, including ArahyV0UB6N, ArahyL2SG6N, ArahyS8RL65, ArahyMKP2FL, ArahyVQ1Q3Q, ArahyE8V3SA, Arahy5H2LSK, ArahyT6PK46, ArahyFFIH3X, ArahyNBC3HK, ArahySB1I92, Arahy9K247M, ArahyPBX2T9 and ArahyTCE5WS. It indicates that these genes may not have the function of regulating flowering time in cultivated peanuts. Some orthologies showed similar expression patterns between A and B subgenomes and significant differences in expression patterns between early-flowering and late-flowering genotypes, including ArahyXGVA1E and ArahyJQBA31, ArahyM2THPA and ArahyEM6VH3, ArahyDYRS20 and ArahyBBG51B and Arahy02PPX6U and ArahyCIFX90. It suggested that these genes may be involved in the regulation of flowering time in cultivated peanuts. Interestingly, some genes showed different expression patterns between A and B subgenomes, including ArahyLUT2QN and ArahyVQ1Q3Q, ArahyIZ8FG5 and ArahyE8V3SA and Arahy2I11L4 and ArahyVGT3DW, which revealed that the mechanism of PEBP genes regulation of flowering time is different between the A and B subgenomes of cultivated peanuts.
The initial flowering time of early and late-flowering genotypes was at 32 d and 42 d under SDHT treatment (Figure 7), respectively, so they were chosen to examine expression level to different photoperiods and temperatures (Figure 9). Although the flowering time of the four genotypes did not change significantly under different photoperiod treatments, however, the expression levels of some genes changed under long-day treatment, a total of 10 genes showed significant differences in expression and 5 genes, Arahy4GAQ4U, ArahyDYRS20, ArahyEM6VH3, ArahyG6F3P2 and ArahyLUT2QN, showed different expression levels in all the 4 genotypes. These genes showed the same change pattern under different photoperiods. For example, ArahyLUT2QN and ArahyG6F3P2 in the FT subfamily were up-regulated under long-day treatment, while ArahyM2THPA, Arahy4GAQ4U, ArahyEM6VH3 and ArahyIZ8FG5 were down-regulated. In the TFL gene family, ArahyDYRS20 and ArahyBBG51B was down-regulated. It indicates that these genes play a role in responding to different photoperiods in cultivated peanuts. A total of 12 genes showed significant differential expression under low temperature treatment, among which 6 genes, ArahyBBG51B, ArahyDYRS20, ArahyG6F3P2, ArahyEM6VH3, ArahyLUT2QN and ArahyM2THPA, showed differences in expression between early-flowering and late-flowering genotypes. The expression levels of ArahyLUT2Q and ArahyG6F3P2 were up-regulated under low temperature treatment, while other genes were down-regulated, indicating that these genes are involved in the regulation mechanism of peanut flowering in response to environmental temperature. These suggested that the elevated expression of ArahyM2THPA, ArahyEM6VH3, Arahy4GAQ4U and ArahyIZ8FG5 in the FT gene family can promote flowering while ArahyG6F3P2 and ArahyLUT2QN inhibits flowering. The elevated expression of ArahyDYRS20 and ArahyBBG51B in the TFL gene family can promote flowering.

3. Discussion

The peanut is a globally important oil crop, and the identification of the peanut PEBP gene contributes to providing insights into the regulation of flowering time in peanuts. As an allotetraploid crop, cultivated peanuts, A. hypogaea, were derived from the hybridization between the diploids A. duranensis (A genome) and A. ipaensis (B genome) [26,27,28]. Although the PEBP gene of cultivated peanuts was searched together with wild peanut, the PEBPs’ function in cultivated peanuts remains unclear [25]. The A. hypogaea genome has evolved through homeologous recombination between A and B subgenomes, and the cultivated peanut has dramatic differences in agronomic traits from their wild ancestors [26,28]. Exploring evolutionary features and expression profiles of PEBPs genes in cultivated peanuts will be beneficial for further understanding the functions of PEBPs in peanuts. Therefore, this study aimed to identify the PEBP gene family in cultivated peanuts, A. hypogaea, which was sequenced recently, to directly explore the evolutionary characteristics of PEBP genes, as well as the expression patterns response to genotypes, temperatures and photoperiods in controlling flowering time.
The two diploid wild species of peanuts are believed to have been hybridized and polyploidized to create the allotetraploid cultivated peanut [25,27,28,29]. In this study, each of the diploid wild peanuts contains 16 PEBP genes, which was confirmed by Jin et al. in 2019; however, a total of 32 PEBP genes identified in this study are inconsistent with the number of previous studies [25]. It may be due to the different parameters we set to identify PEBP proteins. Since ArahyFW8Z6T contains only 78 amino acid residues, it is much shorter than the amino acid length of a typical PEBP protein and could not be identified by HMM-based methods. Therefore, we excluded ArahyFW8Z6T. Arahy1WC97K and ArahyT6PK46, which were not included in Jin’s (2019) study, in gene length, isoelectric point and conserved domains, all fit the parameters of PEBP protein and were therefore retained (Table S1). PEBP proteins in cultivated peanuts can be divided into four different subfamilies: FT, TFL, MFT and FT-like (Figure 1). PEBP genes in angiosperm including wild diploid peanuts are identified as three groups, including FT, TFL and MFT [29]. In this study, two A. duranensis genes, one A. ipaensis gene and four A. hypogaea genes were classified as FT-like. These genes were found to have distinct conserved motifs content compared with other FTs, TFLs and MFTs through identification of conserved domains. Further sequence analysis showed that they were closer to prokaryotes [30]. The PEBP genes, which are atypical in eukaryotes, are also present in other plants including wheat, cotton and potato [31,32,33]. Whether these genes are involved in flowering and other biological functions of cultivated peanuts requires further study. An alignment of homologous genes from cultivated peanut A and B subgenomes with those of wild peanuts revealed that the similarity between A and B subgenomes of cultivated peanut was higher than that between the two wild peanut species, probably due to extensive homologous recombination between the A and B subgenomes [27]. In addition, different PEBP genes have subgenomic dominance between the A and B genomes. For example, ArahyLUT2QN and ArahyIZX8FG5, which are highly homologous to A. duranensis, have significant changes in response to different flowering-time genotypes, photoperiods and temperatures, while the homologous genes ArahyJQBA31 and ArahyE8V3SA from the B subgenome did not show significant expression changes. These results show that the PEBP genes of cultivated peanuts have a high sequence similarity with that of wild peanuts, however, there may be novel mechanisms from wild peanuts in terms of gene sequence structure and expression pattern.
The initial flowering date of peanuts directly determines their growth duration, which is closely related to peanut yield and planting region, and photoperiod and temperature are two important factors that affect flowering. The PEBP gene’s response to genotypes, photoperiod and temperature was characterized in this study. Integrating the expression patterns of the PEBP gene under different treatments found that the MFT subfamily had no significant changes in expression patterns under different genotypes, photoperiods and temperature treatments, and only Arahy2I11L4 detected a higher expression level in the late flowering genotypes than early flowering genotypes. It indicated that MFTs may not have a role in peanut flowering induction. Although MFT genes have been shown to be involved in flowering regulation in Arabidopsis, the function of MFT genes is mainly involved in the development of plant seeds [9,34,35,36]. In the transcriptomes of 22 cultivated peanut tissues, MFT-type genes were found to be significantly increased in pod tissues, which also indicated that MFT genes were involved in the development of peanut pods in cultivated peanuts [25,37]. The MFT promoter region of cultivated peanuts contains more ABRE cis-elements that respond to ABA regulatory pathways. This indicates that the MFT gene may regulate the seed development of cultivated peanuts through the ABA signaling pathway [38].
Six TFL genes, Arahy02PX6U, ArahyCIFX90, ArahySB1I92, Arahy9K247M, ArahyDYRS20 and ArahyBBG51B exhibit the most homologous gene pairs with other species identified through synteny analysis. Although Arahy02PX6U, ArahyCIFX90, ArahySB1I92 and Arahy9K247M did not show significant expression differences among genotypes with different flowering time and under different photoperiod and temperature treatments, these genes may be involved in other biological processes of peanut growth and development. TFL genes not only control flowering but also play a key role in plant architecture. AraduF950M, AraduWY2NX, Araip344D4 and Araip4V81G are predicted to control wild peanut plant architecture and are orthologous genes of Arahy02PX6U, ArahyCIFX90, ArahyDYRS20 and ArahyBBG51B [25]. ArahyBBG51B has been shown to be a key gene controlling peanut flowering patterns, and it accumulates on the main stem of alternate flowering type peanut to repress flowering [39]. In this study, low temperature inhibited flowering, and the expression of ArahyBBG51B and its ortholog ArahyDYRS20 decreased under long-day and low-temperature treatments, which may be because the distribution of gene transcripts in leaves was different from that of flowering tips.
In the FT subfamily, the expression level of FT genes in the early-flowering genotype was higher than that in the late-flowering genotype, which may mean that their increased expression promotes flowering. However, under SDLT and LDHT conditions, the expression levels of ArahyLUT2QN and ArahyG6F3P2 were increased, while the expression levels of ArahyM2THPA, ArahyEM6VH3, Arahy4GAQ4U and ArahyIZ8FG5 were lower than those of SDHT. It indicates that the FT genes may have opposite functions under different photoperiod and temperature treatments, which has been confirmed in soybeans [17,18,40,41]. The increased expression of GmFT2a and GmFT5a promoted flowering under short-day and high-temperature conditions [17,18,42]. ArahyM2THPA and ArahyEM6VH3 are located on the same branch as GmFT5a in phylogenetic analyses, and their responses to photoperiod and temperature are similar to GmFT5a, while ArahyIZ8FG5 and GmFT2a are closer in phylogenetic analyses, and both genes respond to photoperiods. ArahyLUT2QN and ArahyG6F3P2 lie in the same phylogenetic clade as GmFT3a/3b and GmFT4, respectively, and elevated ArahyLUT2QN inhibits flowering, and GmFT3a/3b was shown to respond to long-day light, consistent with the expression patterns of ArahyLUT2QN and ArahyG6F3P2. In addition, collinearity analysis of multiple species found that cultivated peanuts and soybeans have the most collinear gene pairs, indicating that the PEBP gene of the cultivated peanut has the closest genetic distance to soybeans, which was also confirmed in a phylogenetic analysis. It means that the PEBP genes in peanuts may have high homology and similar functions to those in soybeans.
The four genotypes with different flowering times did not show early or delayed flowering under long days, which may be that the genotypes used in this study were insensitive to photoperiods. A previous study revealed that photoperiods had little influence on the time to flowering in peanuts but affects their reproductive development in many ways by influencing the processes that occur mainly after flowering [22,43]. The flowering time of peanuts is sensitive to temperature [44]. In this study, four peanut genotypes showed delayed flowering time under low-temperature treatments. Compared with photoperiod treatments, more PEBP genes showed significant changes in low-temperature treatments, indicating that cultivated peanuts are more sensitive to temperature than photoperiod. Regardless of different photoperiods, temperatures or genotypes with different flowering times, ArahyM2THPA, ArahyEM6VH3, Arahy4GAQ4U, ArahyIZ8FG5, ArahyG6F3P2, ArahyLUT2QN, ArahyDYRS20 and ArahyBBG51B showed significant changes in expression level, indicating that they are the key genes controlling flowering in cultivated peanuts. However, the flowering induction of plants in response to different genotypes, temperatures and photoperiods is a complex regulatory network, and the functions of all PEBPs require in-depth functional studies of individual genes to explain their environmental and genetic molecular mechanisms.

4. Materials and Methods

4.1. Plant Materials and Growth Conditions

All plant materials were provided by the Peanut Research Institute of Shenyang Agricultural University. All seeds were sown in pots and transferred to an artificial climate chamber (PGC-40L2, Percival, Hong Kong, China) with a photosynthetic photon flux density of 700 µmol m−2 s−1 and relative humidity of 30%, 20 days after emergence.
Three different environmental conditions were set, and long days and high temperatures (LDHT) were represented by 16 h 30 °C light/8 h 25 °C dark cycles, short days and high temperatures (SDHT) by 10 h 30 °C light/14 h 25 °C dark cycles and short days and low temperatures (SDLT) by 10 h 25 °C light/14 h 20 °C dark cycles. The flowering time of each flower of different genotypes is recorded.

4.2. Download for Genome Data

Genomic data of cultivated peanuts and their two ancestors were obtained at the website PeanutBase (https://peanutbase.org/ (accessed on 1 April 2022)), including genome sequence, annotation and transcript files. The whole-genome data including DNA, CDS, protein sequence and genome annotation files of Arabidopsis, rice and soybean were downloaded from the Phytozome database (https://phytozome-next.jgi.doe.gov/ (accessed on 5 April 2022)).

4.3. Genome-Wide Identification of PEBP Proteins

To identify the target genes, we used two methods to identify members of the PEBP gene family. Firstly, the Hidden Markov Model PF01161 of PEBP domain from the Pfam database (https://pfam.xfam.org (accessed on 15 April 2022)) was downloaded and searched in the peanut protein database as a query using the Simple HMM Search module in TBtools software [27]. The genes with E-value < 10−3 were selected as the candidate PEBP proteins. The second method is to apply the BLAST search for PEBPs in the peanut protein database using the amino acid sequence of PEBP proteins AtFT (AT1G65480), AtTSF (AT4G20370.1), AtBFT (AT5G62040.1), AtTFL1 (AT5G03840.1), AtATC (AT2G27550.1) and AtMFT (AT1G18100.1) in Arabidopsis as queries, and then the newly searched proteins in which E-values < 10−5 are used to perform a BLAST search again to determine all the orthologs. To further confirm PEBP proteins, all the identified proteins were submitted to databases CDD (https://www.ncbi.nlm.nih.gov/cdd (accessed on 25 April 2022)), Pfam (http://pfam.xfam.org/ (accessed on 1 May 2022)) and SMART (http://smart.embl-heidelberg.de/ (accessed on 1 May 2022)) to verify whether they contained complete PEBP domain. Molecular weight (MW) and theoretical isoelectric point (PI) for the obtained PEBP protein sequences were calculated using ExPASy (https://web.expasy.org/protparam/ (accessed on 5 May 2022)). The same process above was applied to the diploid ancestors A. duranensis and A. ipaensis.

4.4. Chromosome Location, Phylogenetic Analysis

The distribution map of PEBP family genes of cultivated peanut and its two ancestors on each chromosome was constructed with TBtools based on genome annotation files (GTF/GFF). To further understand the phylogenetic relationship of PEBP proteins in three Arachis species and other plant species, the phylogenetic tree was constructed using all PEBP protein sequences obtained from wild diploid peanuts, soybean, chickpea, alfalfa, common beans, Arabidopsis, grapes, rice, sorghum and maize. The PEBP protein sequences were aligned using the MUSCLE algorithm in MEGA-X (https://www.megasoftware.net/ (accessed on 5 May 2022)), and the neighbor-joining (NJ) tree was built with the bootstrap value set at 1000 repetitions [45].

4.5. Gene Structure and Conserved Motifs Characterization of PEBP Genes

The TBtools software was used to analyze the gene structure of the PEBP genes on chromosomes based on the genome annotation files (GTF/GFF) of peanuts and their diploid ancestors, A. duranensis and A. ipaensis. The MEME program (http://meme-suite.org/ (accessed on 15 May 2022)) was used to detect conserved motifs of the PEBP family proteins with the following parameters: the width of the motif ranged from 6 to 50 amino acids, with a maximum of 20 [46]. Only motifs with an E-value < 10−10 were retained for further analysis. Other options used the default values. Gene cluster analysis, gene structure and conserved domain maps were integrated using TBtools.

4.6. Gene Collinearity and Selection Pressure Analysis

The MCScanX was used to examine duplication genes [47]. The PEBP homoeologs between cultivated peanuts and its two diploid ancestors were analyzed. To investigate selection pressure, we estimated the non-synonymous to synonymous mutation rate (Ka/Ks) of homologous genes. The Ka (non-synonymous substitution rate) and Ks (synonymous substitution rate) values of repetitive genes were calculated using the Ka/Ks Calculator 2.0 program to determine selection pressure [48].

4.7. Cis-Element Analysis of the PEBP Genes

We extracted the 2000 bp upstream area of the start codon (ATG) and submitted the sequences to the PlantCARE (http://bioinformatics.psb.ugent.be/webtools/plantcare/html/ (accessed on 20 May 2022)) database to see if the cis-regulatory model of PEBP genes was conserved [49].

4.8. Quantitative RT-PCR Analysis for Gene Expression

To study the expression patterns of PEBP gene in early and late flowering genotypes, mature leaves of peanut plants were collected at 20 d, 25 d, 30 d, 35 d and 40 d after sowing. For studies of growth temperature and photoperiod, mature leaves under three environmental conditions (LDHT, SDHT and SDLT) were collected at two key flowering periods, 32 d and 42 d after sowing. All leaf tissues were collected 2 h after the light was turned on and stored at −80 °C for detection of PEBP gene expression.
Total plant RNA was extracted using the Plant Total RNA Extraction Kit (Centrifugal Column) (Tiangen Biotech, Beijing, China). cDNA was synthesized using the Reverse Transcription Kit PrimeScriptTM RT Reagent Kit (TaKaRa, Dalian China), and the procedure was based on its instructions. Primer design for detecting differential expression of PEBP genes was performed using PrimerBlast (https://www.ncbi.nlm.nih.gov/tools/primer-blast/ (accessed on 25 May 2022)) (Table S6). The Actin11 gene was used as the internal control. The reaction system for gene expression analysis was prepared with the kit SYBR Premix Ex TaqII (TliRNaseH Plus) (TaKaRa, Dalian China), and the instrument for fluorescence quantitative reaction detection was ABI 7500 (Applied Biosystems, Shanghai China). Relative expression analysis was calculated using the 2−ΔΔCT method [50].

Supplementary Materials

The following supporting information can be downloaded at: https://www.mdpi.com/article/10.3390/ijms232012429/s1.

Author Contributions

Conceptualization, C.Z. and Z.L.; Data curation, X.W. and J.W.; Formal analysis, C.Z.; Funding acquisition, X.L. and H.Y.; Investigation, C.Z. and Z.L.; Methodology, C.Z. and H.Z. (Haina Zhang); Project administration, X.L. and H.Y.; Resources, S.Z. and H.Z. (He Zhang); Software, C.Z. and Z.L.; Supervision, X.L.; Validation, Z.L., Y.C. and Y.L.; Visualization, C.Z.; Writing—original draft, Z.L., X.W., C.J. and X.Z.; Writing—review and editing, C.Z. All authors have read and agreed to the published version of the manuscript.

Funding

This research was funded by the Liaoning Revitalization Talents Program, grant number XLYC1902002 and the earmarked fund China Agricultural Research System (CARS-13).

Institutional Review Board Statement

Not applicable.

Informed Consent Statement

Not applicable.

Data Availability Statement

Not applicable.

Conflicts of Interest

The authors declare no conflict of interest.

References

  1. Fornara, F.; de Montaigu, A.; Coupland, G. SnapShot: Control of Flowering in Arabidopsis. Cell 2010, 141, 550. [Google Scholar] [CrossRef] [Green Version]
  2. Kinoshita, A.; Richter, R. Genetic and molecular basis of floral induction in Arabidopsis thaliana. J. Exp. Bot. 2020, 71, 2490–2504. [Google Scholar] [CrossRef]
  3. Zhu, Y.; Klasfeld, S.; Wagner, D. Molecular regulation of plant developmental transitions and plant architecture via PEPB family proteins: An update on mechanism of action. J. Exp. Bot. 2021, 72, 2301–2311. [Google Scholar] [CrossRef] [PubMed]
  4. Jin, S.; Nasim, Z.; Susila, H.; Ahn, J.H. Evolution and functional diversification of FLOWERING LOCUS T/TERMINAL FLOWER 1 family genes in plants. Semin. Cell Dev. Biol. 2021, 109, 20–30. [Google Scholar] [CrossRef] [PubMed]
  5. Putterill, J.; Varkonyi-Gasic, E. FT and florigen long-distance flowering control in plants. Curr. Opin. Plant Biol. 2016, 33, 77–82. [Google Scholar] [CrossRef] [PubMed]
  6. Luo, X.; Chen, T.; Zeng, X.; He, D.; He, Y. Feedback Regulation of FLC by FLOWERING LOCUS T (FT) and FD through a 5’ FLC Promoter Region in Arabidopsis. Mol. Plant 2019, 12, 285–288. [Google Scholar] [CrossRef] [Green Version]
  7. Yamaguchi, A.; Kobayashi, Y.; Goto, K.; Abe, M.; Araki, T. TWIN SISTER OF FT (TSF) Acts as a Floral Pathway Integrator Redundantly with FT. Plant Cell Physiol. 2005, 46, 1175–1189. [Google Scholar] [CrossRef] [Green Version]
  8. Huang, N.-C.; Jane, W.-N.; Chen, J.; Yu, T.-S. Arabidopsis thaliana CENTRORADIALIS homologue (ATC) acts systemically to inhibit floral initiation in Arabidopsis. Plant J. 2012, 72, 175–184. [Google Scholar] [CrossRef] [PubMed]
  9. Yoo, S.J.; Chung, K.S.; Jung, S.H.; Yoo, S.Y.; Lee, J.S.; Ahn, J.H. BROTHER OF FT AND TFL1 (BFT) has TFL1-like activity and functions redundantly with TFL1 in inflorescence meristem development in Arabidopsis. Plant J. 2010, 63, 241–253. [Google Scholar] [CrossRef] [PubMed]
  10. Wang, Z.; Yang, R.; Devisetty, U.K.; Maloof, J.N.; Zuo, Y.; Li, J.; Shen, Y.; Zhao, J.; Bao, M.; Ning, G. The Divergence of Flowering Time Modulated by FT/TFL1 Is Independent to Their Interaction and Binding Activities. Front Plant Sci. 2017, 8, 697. [Google Scholar] [CrossRef] [PubMed]
  11. Ryu, J.Y.; Lee, H.-J.; Seo, P.J.; Jung, J.-H.; Ahn, J.H.; Park, C.-M. The Arabidopsis Floral Repressor BFT Delays Flowering by Competing with FT for FD Binding under High Salinity. Mol. Plant 2014, 7, 377–387. [Google Scholar] [CrossRef] [Green Version]
  12. Vaistij, F.E.; Barros-Galvão, T.; Cole, A.F.; Gilday, A.D.; He, Z.; Li, Y.; Harvey, D.; Larson, T.R.; Graham, I.A. MOTHER-OF-FT-AND-TFL1 represses seed germination under far-red light by modulating phytohormone responses in Arabidopsis thaliana. Proc. Natl. Acad. Sci. USA 2018, 115, 8442–8447. [Google Scholar] [CrossRef] [Green Version]
  13. Yu, X.; Liu, H.; Sang, N.; Li, Y.; Zhang, T.; Sun, J.; Huang, X. Identification of cotton MOTHER OF FT AND TFL1 homologs, GhMFT1 and GhMFT2, involved in seed germination. PLoS ONE 2019, 14, e0215771. [Google Scholar] [CrossRef] [Green Version]
  14. Chardon, F.; Damerval, C. Phylogenomic Analysis of the PEBP Gene Family in Cereals. J. Mol. Evol. 2005, 61, 579–590. [Google Scholar] [CrossRef]
  15. Chen, C.; Chen, H.; Zhang, Y.; Thomas, H.R.; Frank, M.H.; He, Y.; Xia, R. TBtools: An Integrative Toolkit Developed for Interactive Analyses of Big Biological Data. Mol. Plant 2020, 13, 1194–1202. [Google Scholar] [CrossRef]
  16. Tamaki, S.; Matsuo, S.; Wong, H.L.; Yokoi, S.; Shimamoto, K. Hd3a protein is a mobile flowering signal in rice. Science 2007, 316, 1033–1036. [Google Scholar] [CrossRef]
  17. Kong, F.; Liu, B.; Xia, Z.; Sato, S.; Kim, B.M.; Watanabe, S.; Yamada, T.; Tabata, S.; Kanazawa, A.; Harada, K.; et al. Two Coordinately Regulated Homologs of FLOWERING LOCUS T Are Involved in the Control of Photoperiodic Flowering in Soybean. Plant Physiol. 2010, 154, 1220–1231. [Google Scholar] [CrossRef] [Green Version]
  18. Liu, W.; Jiang, B.; Ma, L.; Zhang, S.; Zhai, H.; Xu, X.; Hou, W.; Xia, Z.; Wu, C.; Sun, S.; et al. Functional diversification of Flowering Locus T homologs in soybean: GmFT1a and GmFT2a/5a have opposite roles in controlling flowering and maturation. New Phytol. 2018, 217, 1335–1345. [Google Scholar] [CrossRef] [Green Version]
  19. Meng, X.; Muszynski, M.G.; Danilevskaya, O.N. The FT-Like ZCN8 Gene Functions as a Floral Activator and Is Involved in Photoperiod Sensitivity in Maize. Plant Cell 2011, 23, 942–960. [Google Scholar] [CrossRef] [Green Version]
  20. Kaba, J.S.; Kumaga, F.; Ofori, K. Effect of flower production and time of flowering on pod yield of peanut (Arachis hypogaea L) genotypes. IOSR J. Agric. Vet. Sci. 2014, 7, 44–49. [Google Scholar] [CrossRef]
  21. Bell, M.J.; Bagnall, D.J.; Harch, G. Effects of photoperiod on reproductive development of peanut (Arachis hypogaea L.) in a cool subtropical environment. II. Temperature interactions. Aust. J. Agric. Res. 1991, 42, 1151–1161. [Google Scholar] [CrossRef]
  22. Nigam, S.N.; Dwivedi, S.L.; Ramraj, V.M.; Chandra, S. Combining Ability of Response to Photoperiod in Peanut. Crop Sci. 1997, 37, 1159–1162. [Google Scholar] [CrossRef]
  23. Moretzsohn, M.C.; Gouvea, E.G.; Inglis, P.W.; Leal-Bertioli, S.C.M.; Valls, J.F.M.; Bertioli, D.J. A study of the relationships of cultivated peanut (Arachis hypogaea) and its most closely related wild species using intron sequences and microsatellite markers. Ann. Bot. 2013, 111, 113–126. [Google Scholar] [CrossRef] [Green Version]
  24. Wang, P.; Gao, C.; Bian, X.; Zhao, S.; Zhao, C.; Xia, H.; Song, H.; Hou, L.; Wan, S.; Wang, X. Genome-Wide Identification and Comparative Analysis of Cytosine-5 DNA Methyltransferase and Demethylase Families in Wild and Cultivated Peanut. Front Plant Sci. 2016, 7, 7. [Google Scholar] [CrossRef] [Green Version]
  25. Jin, H.; Tang, X.; Xing, M.; Zhu, H.; Sui, J.; Cai, C.; Li, S. Molecular and transcriptional characterization of phosphatidyl ethanolamine-binding proteins in wild peanuts Arachis duranensis and Arachis ipaensis. BMC Plant Biol. 2019, 19, 484. [Google Scholar] [CrossRef] [Green Version]
  26. Bertioli, D.J.; Jenkins, J.; Clevenger, J.; Dudchenko, O.; Gao, D.; Seijo, G.; Leal-Bertioli, S.C.M.; Ren, L.; Farmer, A.D.; Pandey, M.K.; et al. The genome sequence of segmental allotetraploid peanut Arachis hypogaea. Nat. Genet. 2019, 51, 877–884. [Google Scholar] [CrossRef] [Green Version]
  27. Chen, X.; Lu, Q.; Liu, H.; Zhang, J.; Hong, Y.; Lan, H.; Li, H.; Wang, J.; Liu, H.; Li, S.; et al. Sequencing of Cultivated Peanut, Arachis hypogaea, Yields Insights into Genome Evolution and Oil Improvement. Mol. Plant 2019, 12, 920–934. [Google Scholar] [CrossRef] [Green Version]
  28. Zhuang, W.; Chen, H.; Yang, M.; Wang, J.; Pandey, M.K.; Zhang, C.; Chang, W.-C.; Zhang, L.; Zhang, X.; Tang, R.; et al. The genome of cultivated peanut provides insight into legume karyotypes, polyploid evolution and crop domestication. Nat. Genet. 2019, 51, 865–876. [Google Scholar] [CrossRef] [Green Version]
  29. Karlgren, A.; Gyllenstrand, N.; Källman, T.; Sundström, J.F.; Moore, D.; Lascoux, M.; Lagercrantz, U. Evolution of the PEBP Gene Family in Plants: Functional Diversification in Seed Plant Evolution. Plant Physiol. 2011, 156, 1967–1977. [Google Scholar] [CrossRef] [Green Version]
  30. Tsoy, O.; Mushegian, A. Florigen and its homologs of FT/CETS/PEBP/RKIP/YbhB family may be the enzymes of small molecule metabolism: Review of the evidence. BMC Plant Biol. 2022, 22, 56. [Google Scholar] [CrossRef]
  31. Wang, M.; Tan, Y.; Cai, C.; Zhang, B. Identification and expression analysis of phosphatidy ethanolamine-binding protein (PEBP) gene family in cotton. Genomics 2019, 111, 1373–1380. [Google Scholar] [CrossRef]
  32. Dong, L.; Lu, Y.; Liu, S. Genome-wide member identification, phylogeny and expression analysis of PEBP gene family in wheat and its progenitors. PeerJ 2020, 8, e10483. [Google Scholar] [CrossRef]
  33. Zhang, G.; Jin, X.; Li, X.; Zhang, N.; Li, S.; Si, H.; Rajora, O.P.; Li, X.-Q. Genome-wide identification of PEBP gene family members in potato, their phylogenetic relationships, and expression patterns under heat stress. Mol. Biol. Rep. 2022, 49, 4683–4697. [Google Scholar] [CrossRef]
  34. Danilevskaya, O.N.; Meng, X.; Hou, Z.; Ananiev, E.V.; Simmons, C.R. A Genomic and Expression Compendium of the Expanded PEBP Gene Family from Maize. Plant Physiol. 2007, 146, 250–264. [Google Scholar] [CrossRef] [PubMed] [Green Version]
  35. Nakamura, S.; Abe, F.; Kawahigashi, H.; Nakazono, K.; Tagiri, A.; Matsumoto, T.; Utsugi, S.; Ogawa, T.; Handa, H.; Ishida, H.; et al. A wheat homolog of MOTHER OF FT AND TFL1 acts in the regulation of germination. Plant Cell 2011, 23, 3215–3229. [Google Scholar] [CrossRef] [PubMed] [Green Version]
  36. Tao, Y.-B.; Luo, L.; He, L.-L.; Ni, J.; Xu, Z.-F. A promoter analysis of MOTHER OF FT AND TFL11 (JcMFT1), a seed-preferential gene from the biofuel plant Jatropha curcas. J. Plant Res. 2014, 127, 513–524. [Google Scholar] [CrossRef]
  37. Clevenger, J.; Chu, Y.; Scheffler, B.; Ozias-Akins, P. A Developmental Transcriptome Map for Allotetraploid Arachis hypogaea. Front. Plant Sci. 2016, 7, 1446. [Google Scholar] [CrossRef] [Green Version]
  38. Xi, W.; Liu, C.; Hou, X.; Yu, H. MOTHER OF FT AND TFL1 regulates seed germination through a negative feedback loop modulating ABA signaling in Arabidopsis. Plant Cell 2010, 22, 1733–1748. [Google Scholar] [CrossRef] [PubMed] [Green Version]
  39. Kunta, S.; Chu, Y.; Levy, Y.; Harel, A.; Abbo, S.; Ozias-Akins, P.; Hovav, R. Identification of a major locus for flowering pattern sheds light on plant architecture diversification in cultivated peanut. Theor. Appl. Genet. 2022, 135, 1767–1777. [Google Scholar] [CrossRef]
  40. Guo, G.; Xu, K.; Zhang, X.; Zhu, J.; Lu, M.; Chen, F.; Liu, L.; Xi, Z.-Y.; Bachmair, A.; Chen, Q.; et al. Extensive Analysis of GmFTL and GmCOL Expression in Northern Soybean Cultivars in Field Conditions. PLoS ONE 2015, 10, e0136601. [Google Scholar] [CrossRef]
  41. Zhai, H.; Lü, S.; Liang, S.; Wu, H.; Zhang, X.; Liu, B.; Kong, F.; Yuan, X.; Li, J.; Xia, Z. GmFT4, a Homolog of FLOWERING LOCUS T, Is Positively Regulated by E1 and Functions as a Flowering Repressor in Soybean. PLoS ONE 2014, 9, e89030. [Google Scholar] [CrossRef] [PubMed] [Green Version]
  42. No, D.H.; Baek, D.; Lee, S.H.; Cheong, M.S.; Chun, H.J.; Park, M.S.; Cho, H.M.; Jin, B.J.; Lim, L.H.; Lee, Y.B.; et al. High-Temperature Conditions Promote Soybean Flowering through the Transcriptional Reprograming of Flowering Genes in the Photoperiod Pathway. Int. J. Mol. Sci. 2021, 22, 1314. [Google Scholar] [CrossRef]
  43. Nigam, S.N.; Rao, R.C.N.; Wynne, J.C.; Williams, J.H.; Fitzner, M.; Nagabhushanam, G.V.S. Effect and interaction of temperature and photoperiod on growth and partitioning in three groundnut (Arachis hypogaea L.) genotypes1. Ann. Appl. Biol. 1994, 125, 541–552. [Google Scholar] [CrossRef] [Green Version]
  44. Bagnall, D.J.; King, R.W. Response of peanut (Arachis hypogaea) to temperature, photoperiod and irradiance 1. Effect on flowering. Field Crops Res. 1991, 26, 263–277. [Google Scholar] [CrossRef]
  45. Kumar, S.; Stecher, G.; Li, M.; Knyaz, C.; Tamura, K. MEGA X: Molecular Evolutionary Genetics Analysis across Computing Platforms. Mol Biol Evol 2018, 35, 1547–1549. [Google Scholar] [CrossRef] [PubMed]
  46. Bailey, T.L.; Williams, N.; Misleh, C.; Li, W.W. MEME: Discovering and analyzing DNA and protein sequence motifs. Nucleic Acids Res. 2006, 34, W369–W373. [Google Scholar] [CrossRef] [PubMed]
  47. Wang, Y.; Tang, H.; DeBarry, J.D.; Tan, X.; Li, J.; Wang, X.; Lee, T.-h.; Jin, H.; Marler, B.; Guo, H.; et al. MCScanX: A toolkit for detection and evolutionary analysis of gene synteny and collinearity. Nucleic Acids Res. 2012, 40, e49. [Google Scholar] [CrossRef] [Green Version]
  48. Wang, D.; Zhang, Y.; Zhang, Z.; Zhu, J.; Yu, J. KaKs_Calculator 2.0: A Toolkit Incorporating Gamma-Series Methods and Sliding Window Strategies. Genom. Proteom. Bioinform. 2010, 8, 77–80. [Google Scholar] [CrossRef] [Green Version]
  49. Lescot, M.; Déhais, P.; Thijs, G.; Marchal, K.; Moreau, Y.; Van de Peer, Y.; Rouzé, P.; Rombauts, S. PlantCARE, a database of plant cis-acting regulatory elements and a portal to tools for in silico analysis of promoter sequences. Nucleic Acids Res. 2002, 30, 325–327. [Google Scholar] [CrossRef] [PubMed]
  50. Livak, K.J.; Schmittgen, T.D. Analysis of Relative Gene Expression Data Using Real-Time Quantitative PCR and the 2−ΔΔCT Method. Methods 2001, 25, 402–408. [Google Scholar] [CrossRef] [PubMed]
Figure 1. The phylogenetic tree, motifs and gene intron/exon structure of 64 PEBP genes in cultivated peanuts. (a) Phylogenetic tree based on PEBP protein sequence using Neigbour-joining Tree method. (b) The motif compositions of PEBP proteins. Specific motifs were indicated using different colors. (c) The exon and intron distribution of PEBP genes. Exons and intron regions are represented by yellow rectangles and grey lines, respectively.
Ijms 23 12429 g001
Figure 2. Orthologous gene identification and its protein sequence-based similarity analysis. Three different peanut genomes are marked with different background colors. Yellow, blue and orange represent the genomes of diploid wild peanut A. duranensis and A. ipaensis and tetraploid cultivated peanut A. hypogaea, respectively. Protein sequences from high to low similarity are marked with different depths of green background. The red font represents a pair with high similarity between orthologous genes.
Ijms 23 12429 g002
Figure 3. Chromosomal distribution of PEBP genes in peanut genome and its two ancestors. The green, red and blue rectangles represent the three Arachis genomes of two diploid A. ipaensis, A. duranensis and the tetraploid A. hypogaea, respectively. The blue bars represent the chromosomes, and the PEBP genes were marked on different chromosomes. Red frame means that gene is absent in the corresponding position of cultivated peanuts. Yellow frames mean that genes have undergone homologous recombination between the A and B subgenomes. Blue frames mean that genes have transposed in wild peanuts.
Ijms 23 12429 g003
Figure 4. Syntenic analysis of PEBP genes between cultivated peanuts and other plants, including wild diploid peanuts, soybean, chickpea, alfalfa, common beans, Arabidopsis, grapes, rice, sorghum and maize. The gray lines at the bottom represent the collinear regions in rice and other genomes. The red lines represent the pairs of PEBP genes.
Ijms 23 12429 g004
Figure 5. Neighbor-joining phylogenetic tree constructed based on 188 PEBP proteins of soybean, chickpea, alfalfa, common beans, Arabidopsis, grapes, rice, sorghum and maize as well as three Arachis species. The PEBP genes were divided MFT, FT and TFL and FT-like subgroups. PEBP proteins in cultivated and wild peanuts are marked by black dots and triangles, respectively. The phylogenetic tree is built using the complete amino acid sequences of the PEBP proteins by MEGAX with the Neighbor-joining method (Bootstrap = 1000).
Ijms 23 12429 g005
Figure 6. Analysis of cis-acting elements based on 2 kb upstream of PEBP genes. The number of cis-acting elements with various functions were counted. The number of cis-acting elements from 1 to 9 are marked with different depths of yellow back-ground.
Ijms 23 12429 g006
Figure 7. Responses of early and late-flowering genotypes under different temperature and photoperiod treatments; the horizontal axis represents the treatments, respectively, the vertical axis represents time (days) and each point represents the flowering time of each flower. The Kruskal-Wallis test was used to compare the distribution of flowering period under different treatments. Three different environmental conditions were set, long days and high temperatures (LDHT), short days and high temperatures (SDHT) and short days and low temperatures (SDLT).
Ijms 23 12429 g007
Figure 8. The relative expression patterns of early and late-flowering peanut genotypes. Three biological replicates with their respective three technical replicates were performed.
Ijms 23 12429 g008
Figure 9. PEBP gene expression patterns in different peanut genotypes with different flowering times. The short-day high temperature group (SDHT) was compared with the long-day high temperature group (LDHT) and the short-day low temperature group (SDLT) by Student’s t-test. Bars indicated standard error of the mean. The genes marked in red have significant changes in expression level under both long-day and low-temperature conditions, while the genes marked in blue are significantly different in expression level only under low-temperature conditions.
Ijms 23 12429 g009
Publisher’s Note: MDPI stays neutral with regard to jurisdictional claims in published maps and institutional affiliations.

