
Association of NGF and Mitochondrial Respiration with Autism Spectrum Disorder

Abstract
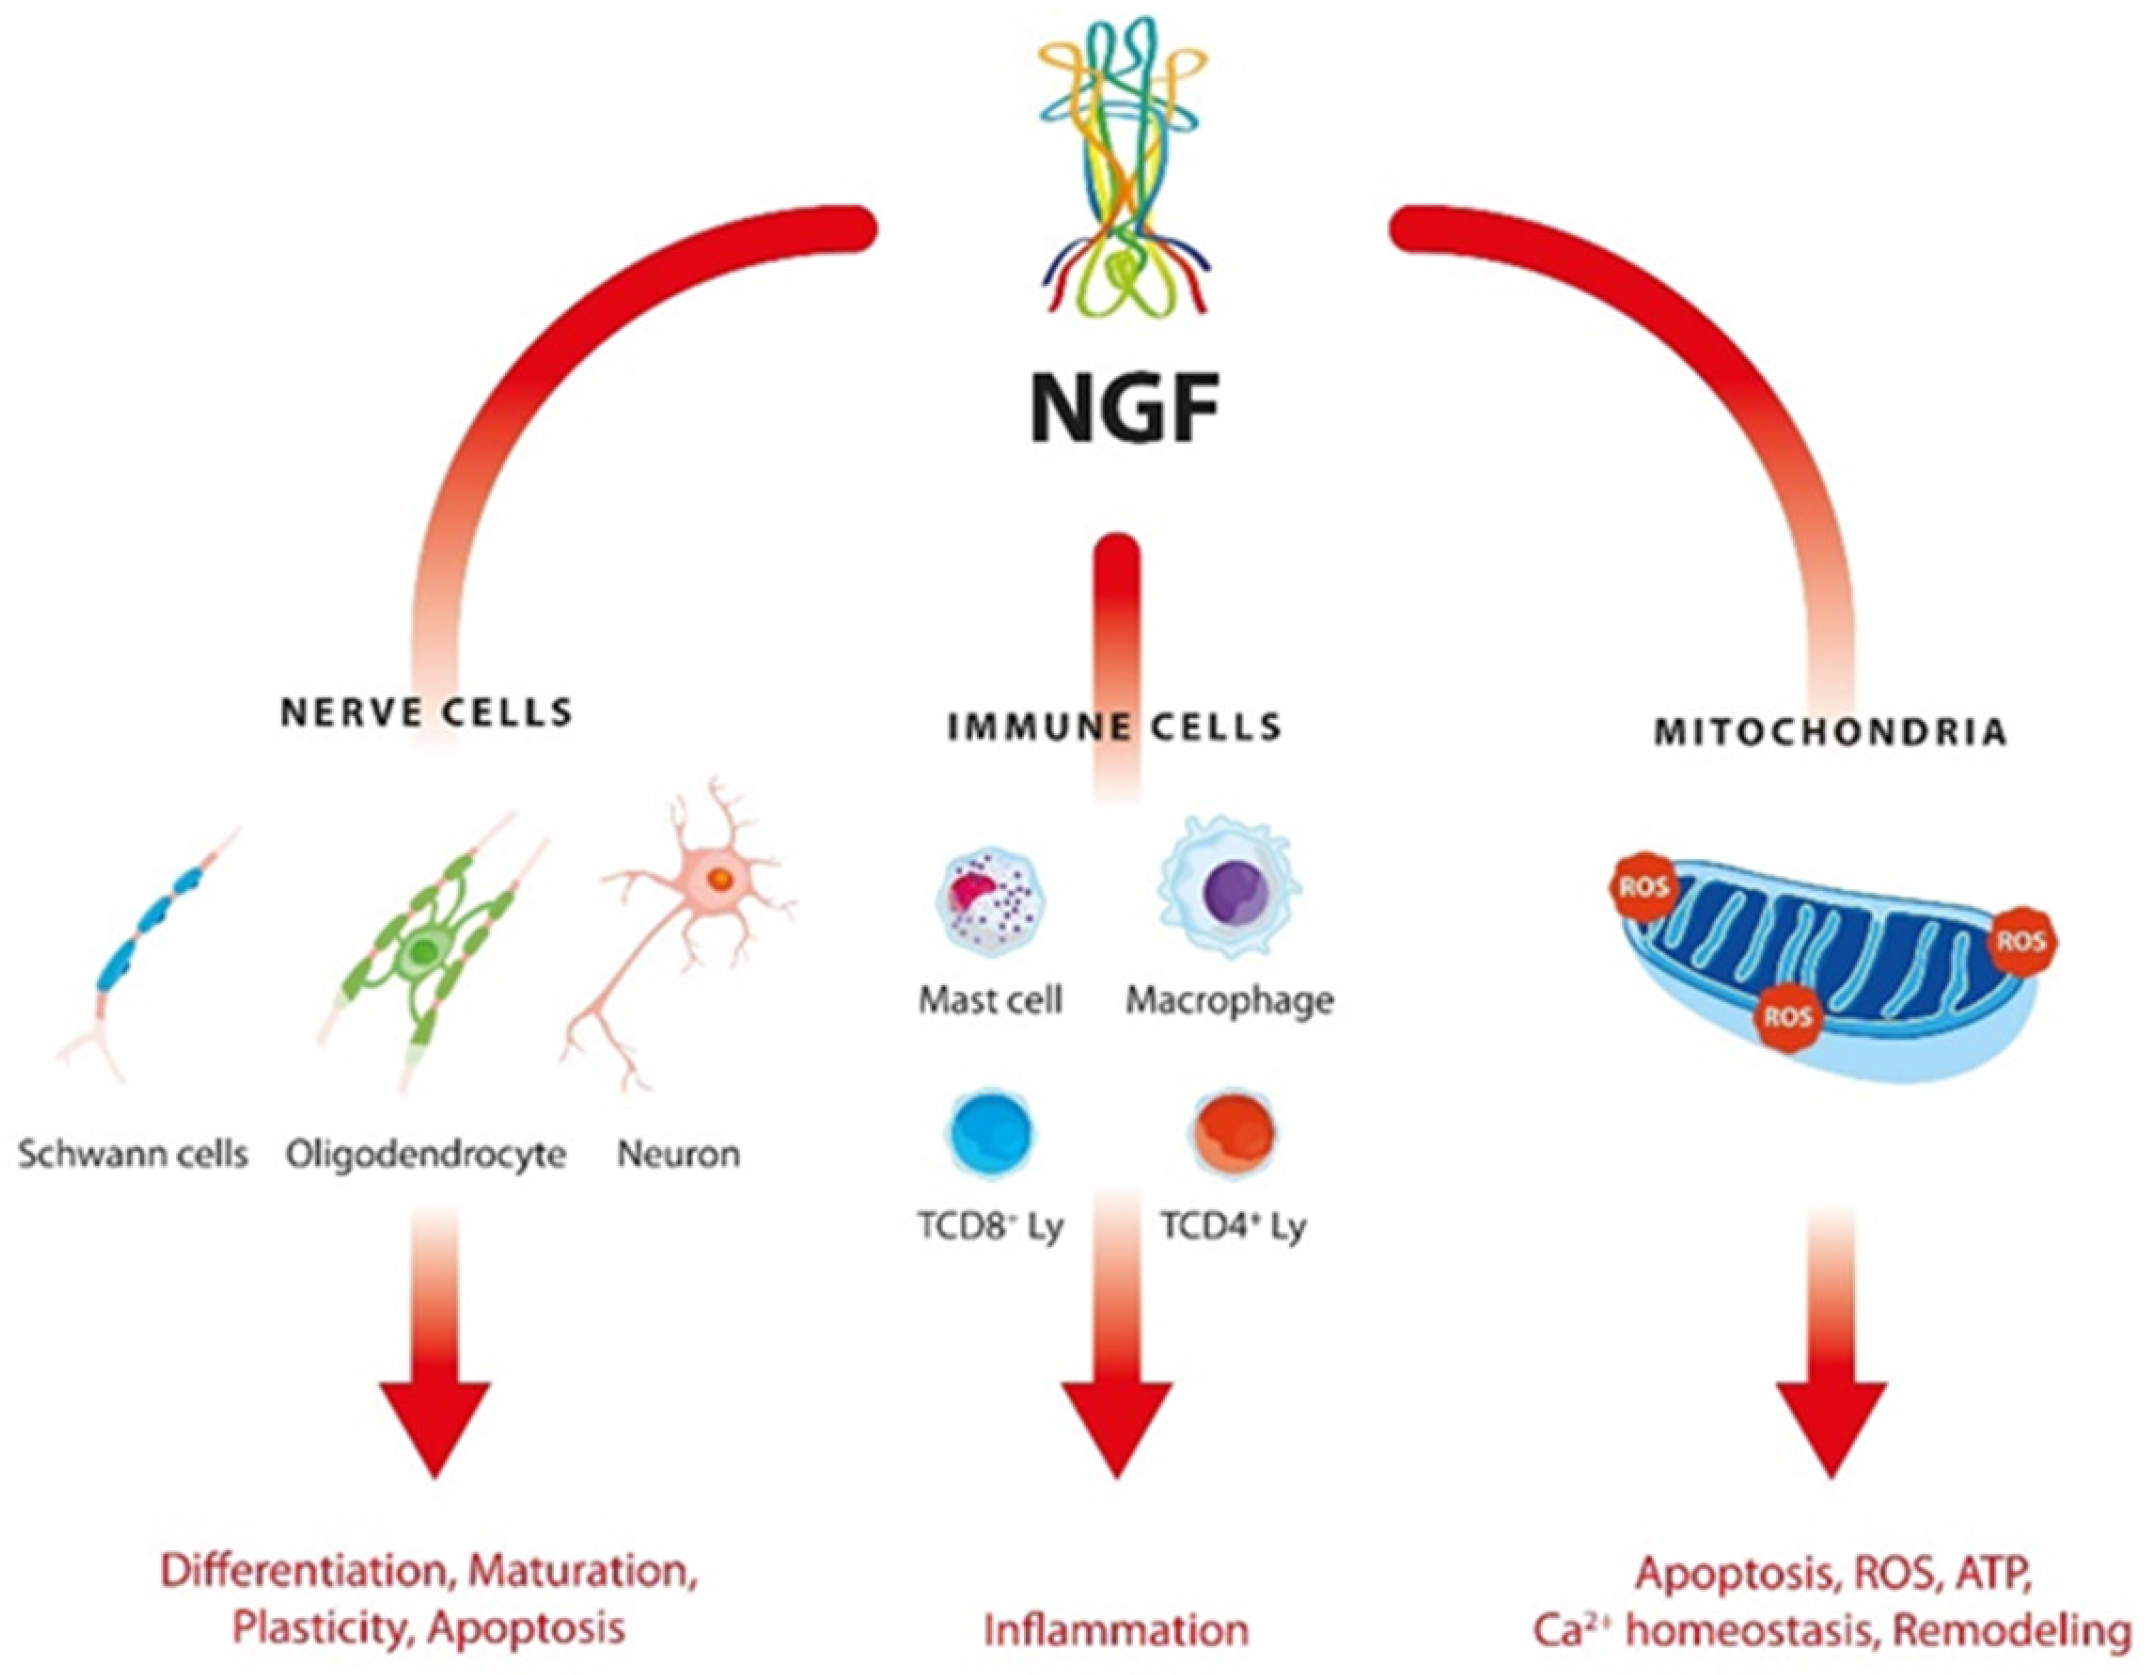
:1. Introduction
2. Results
2.1. Clinical Data
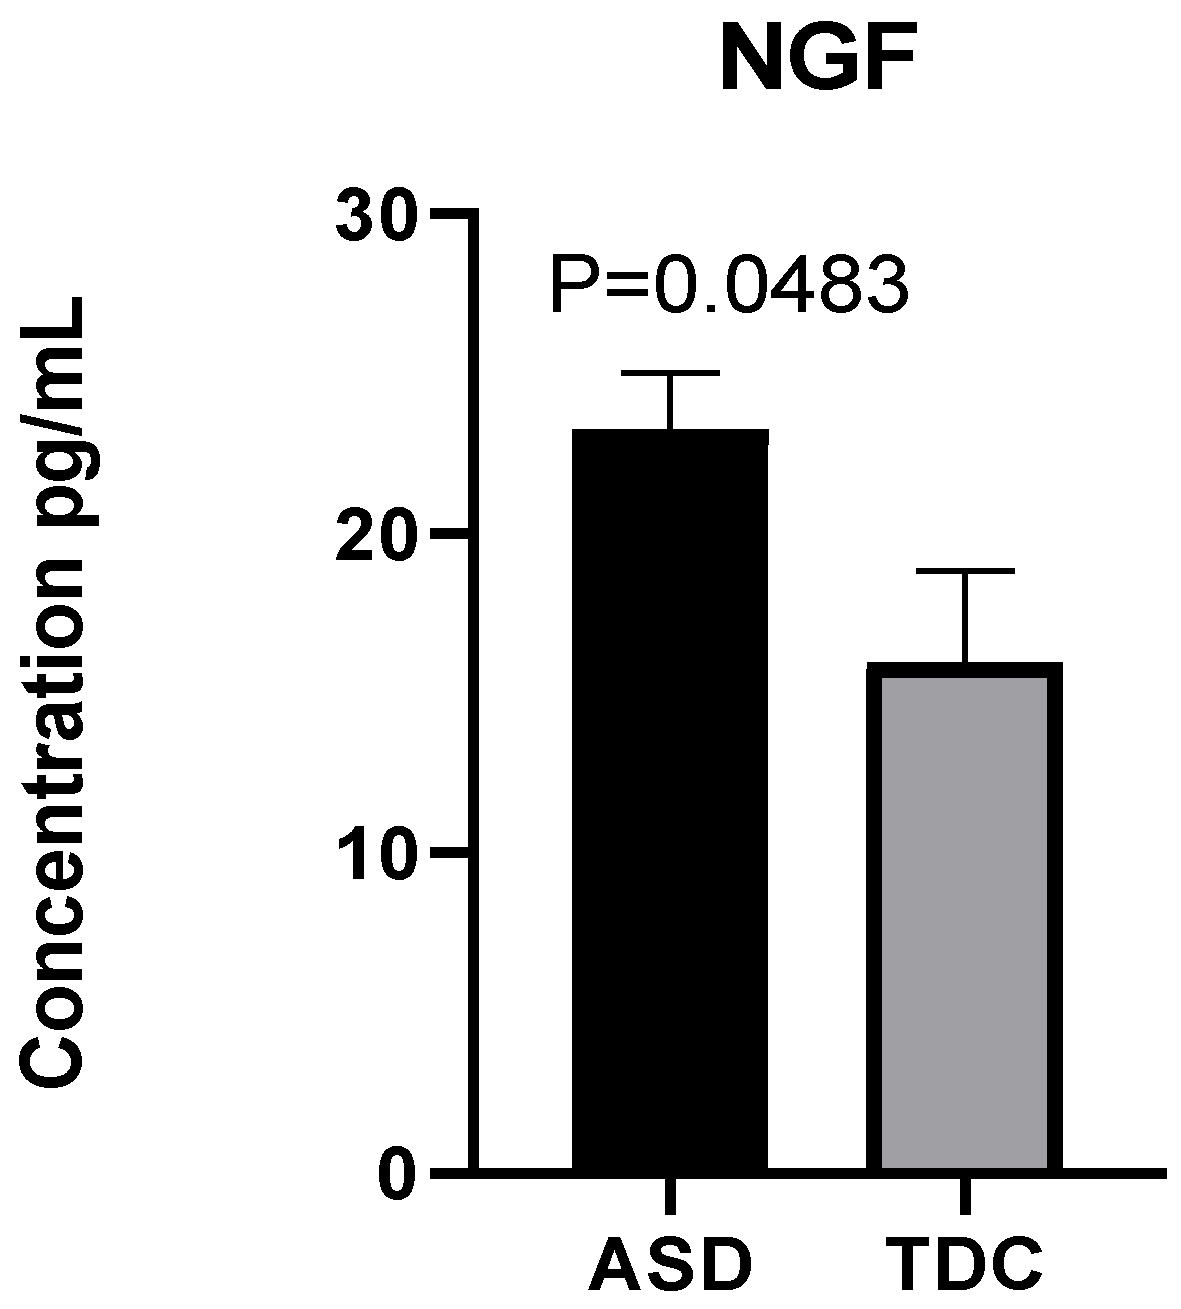
2.2. Detection of NGF Plasma Levels
2.3. Respiratory Profile in Children with ASD and Healthy Controls
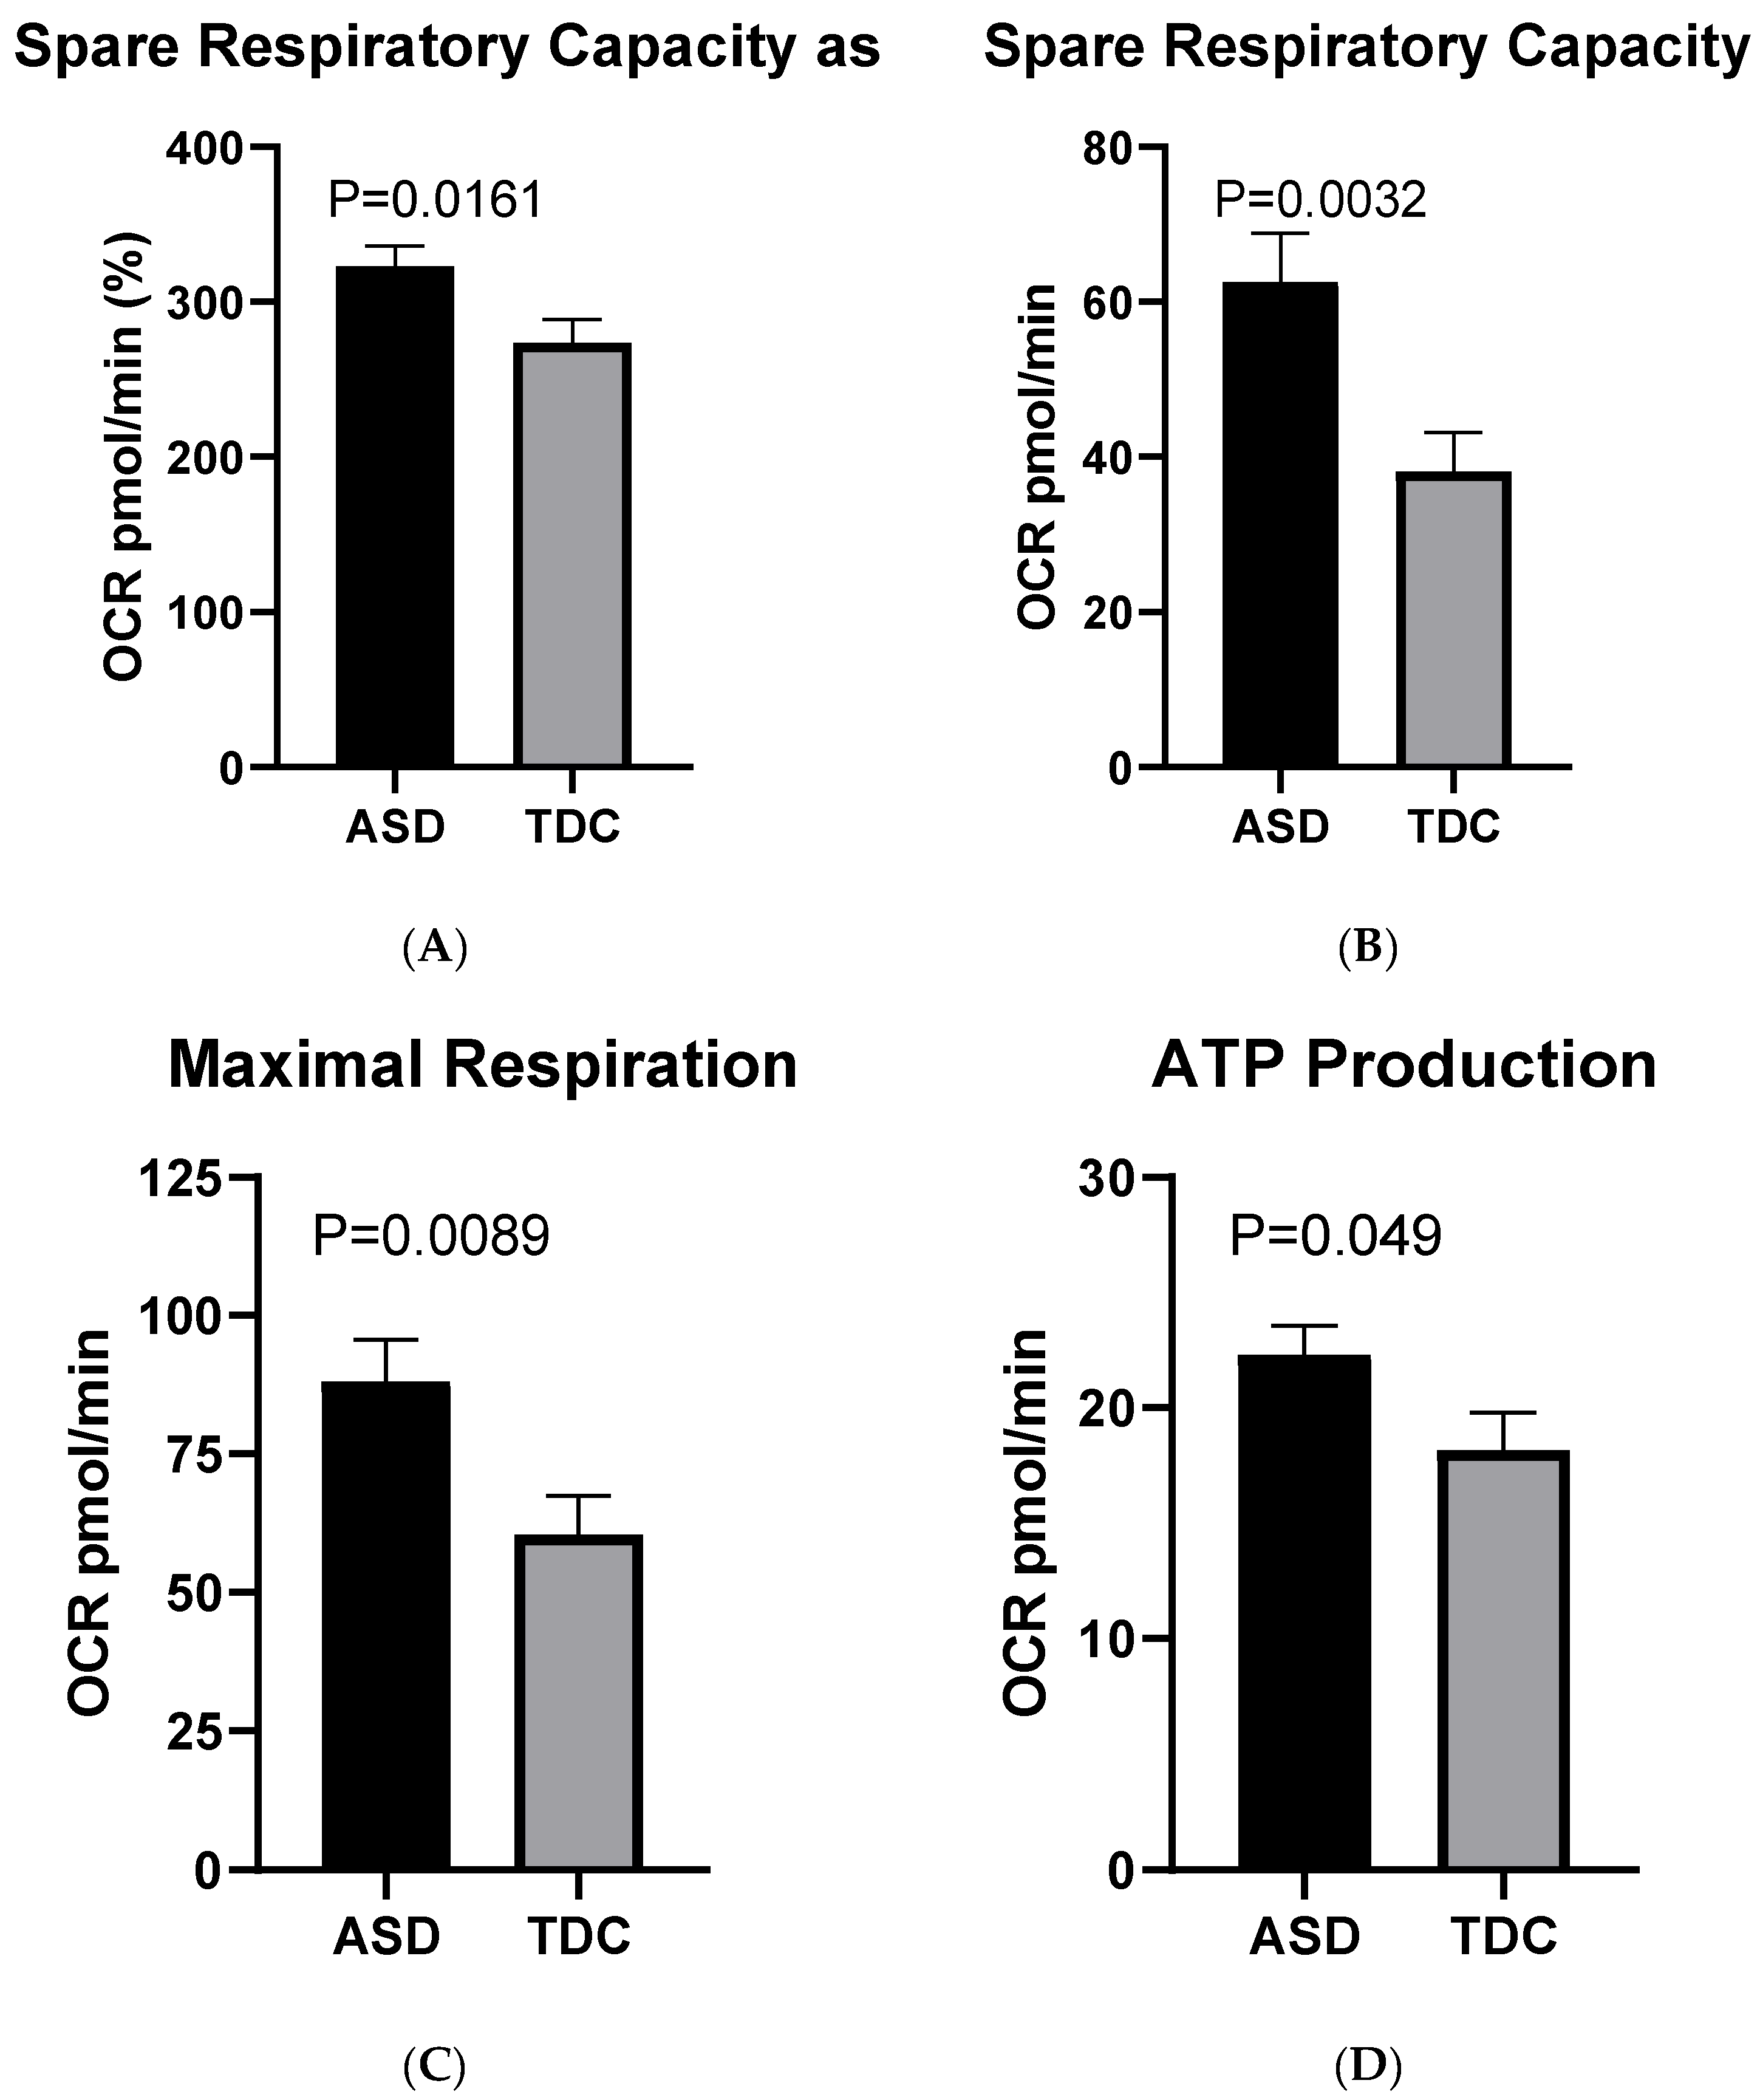
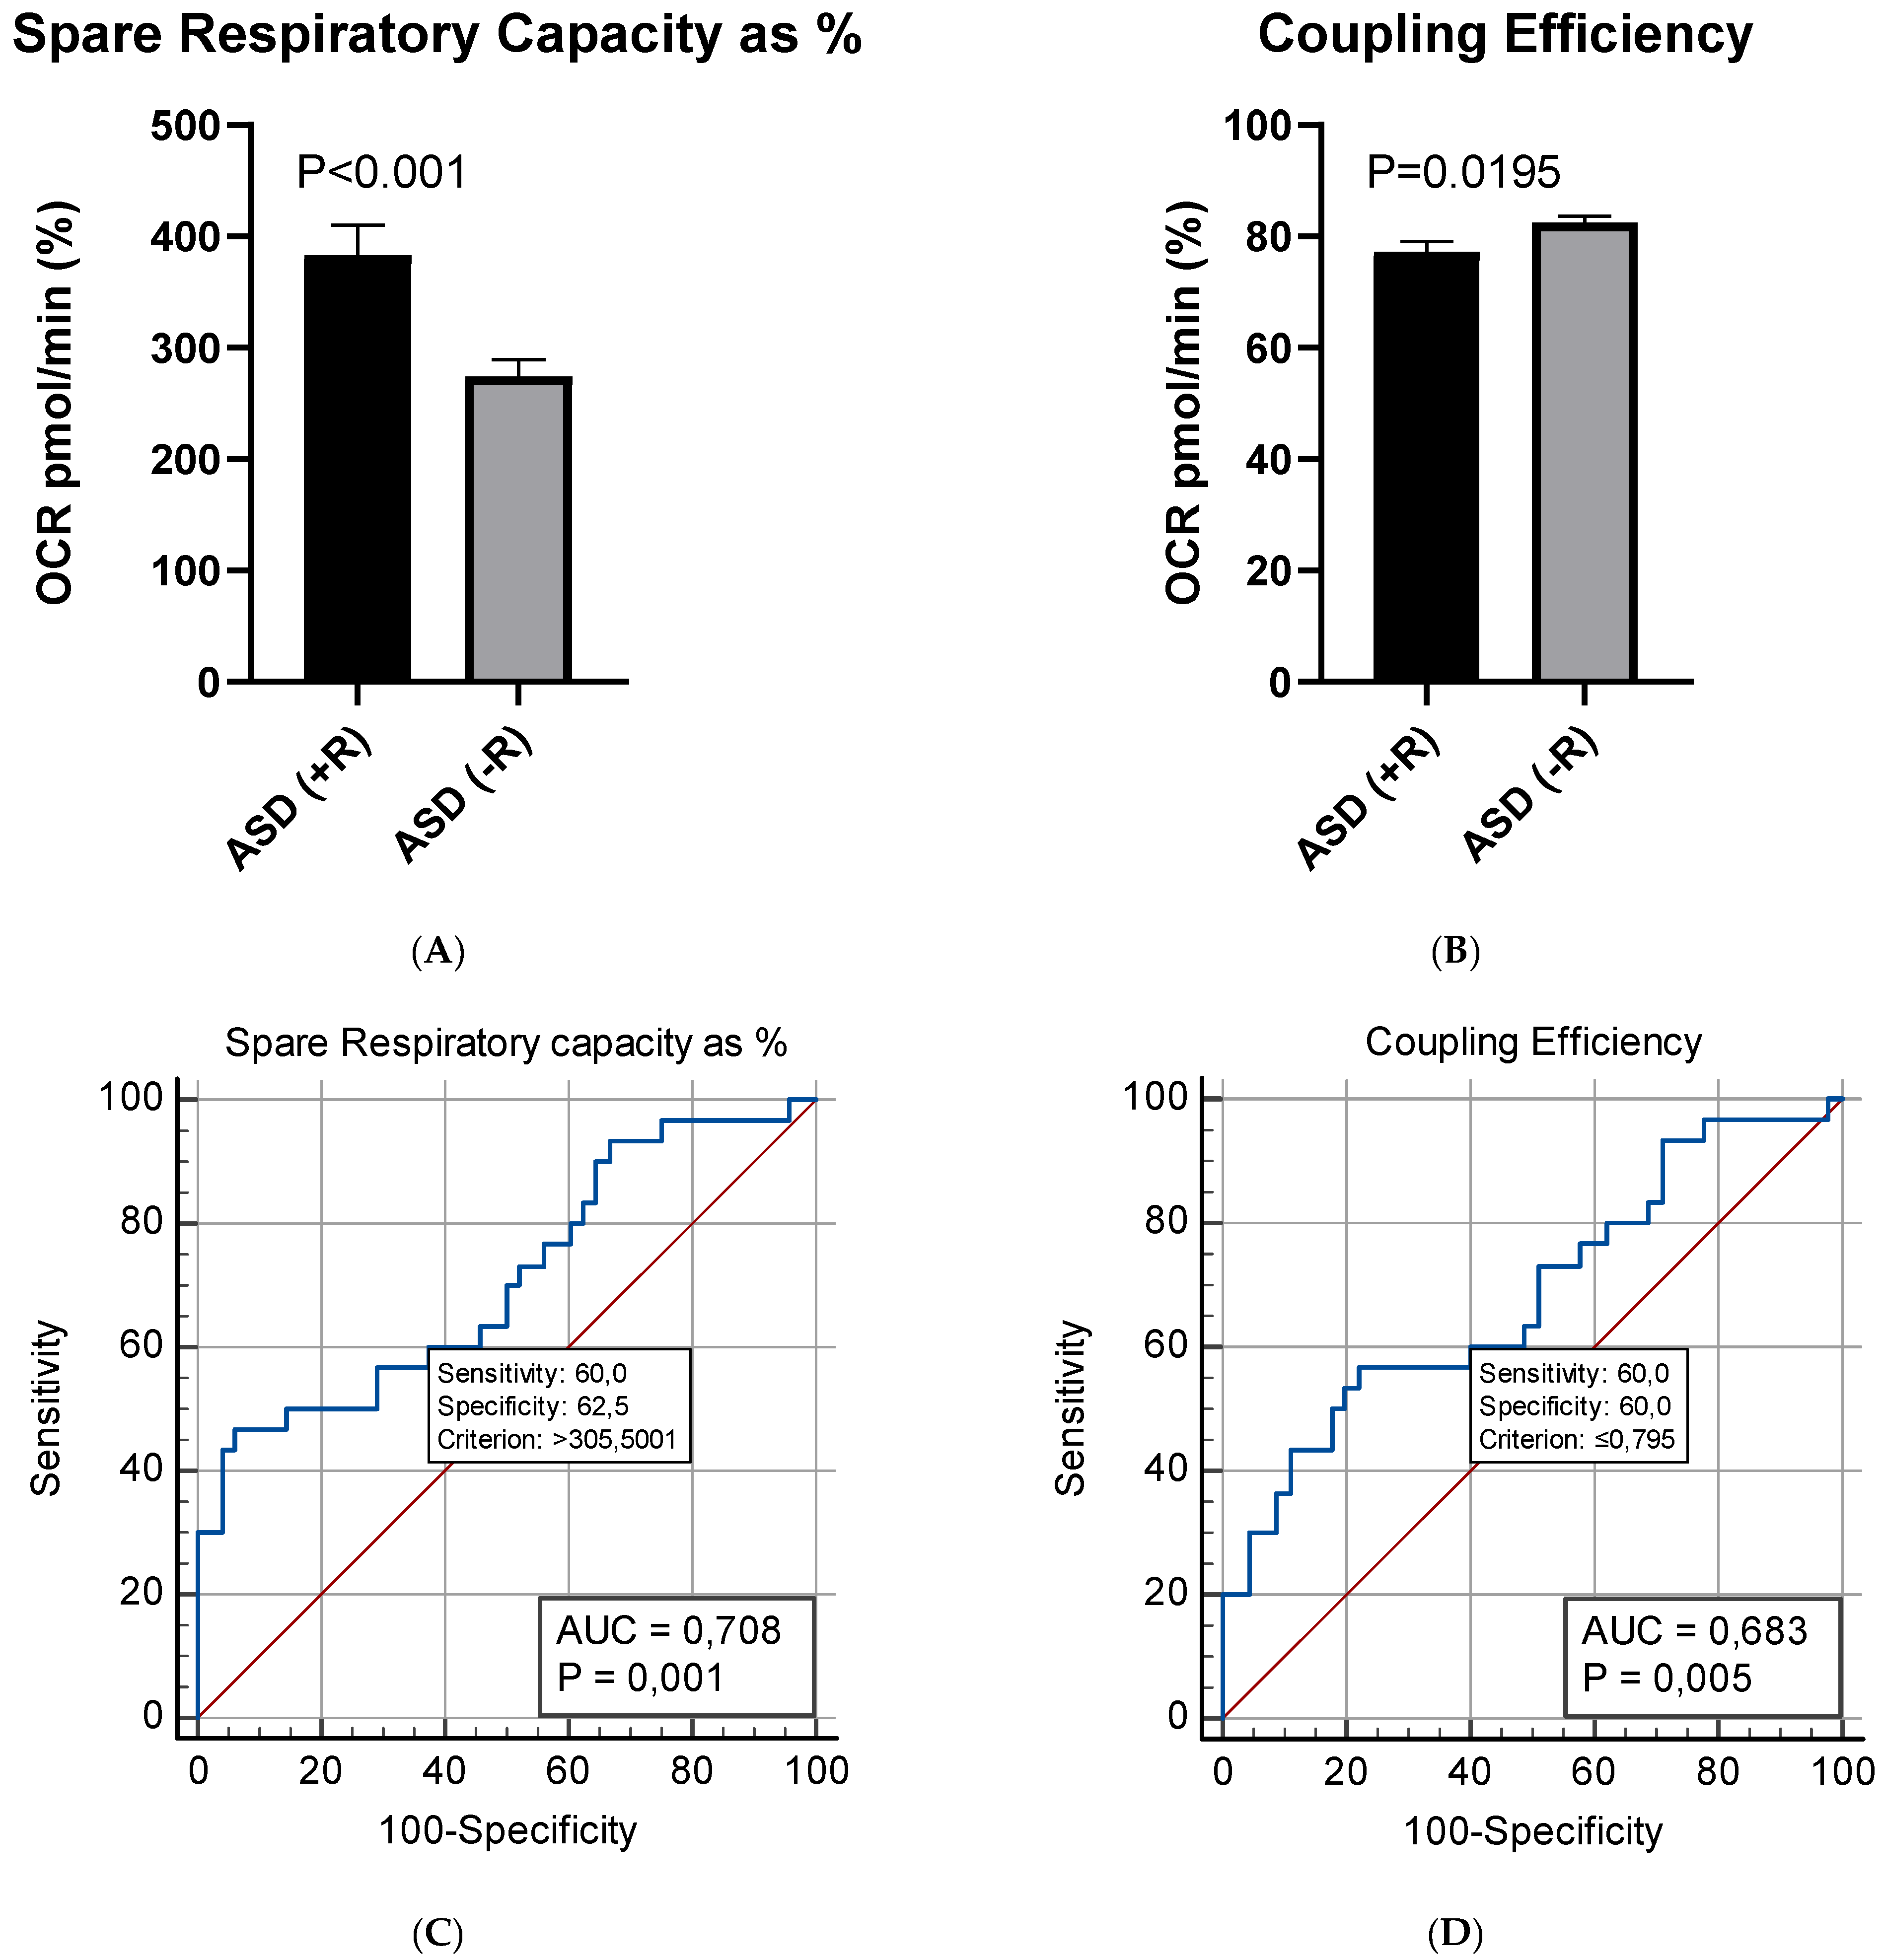
2.3.1. Mito Stress Test–Oxygen Consumption (OCR)
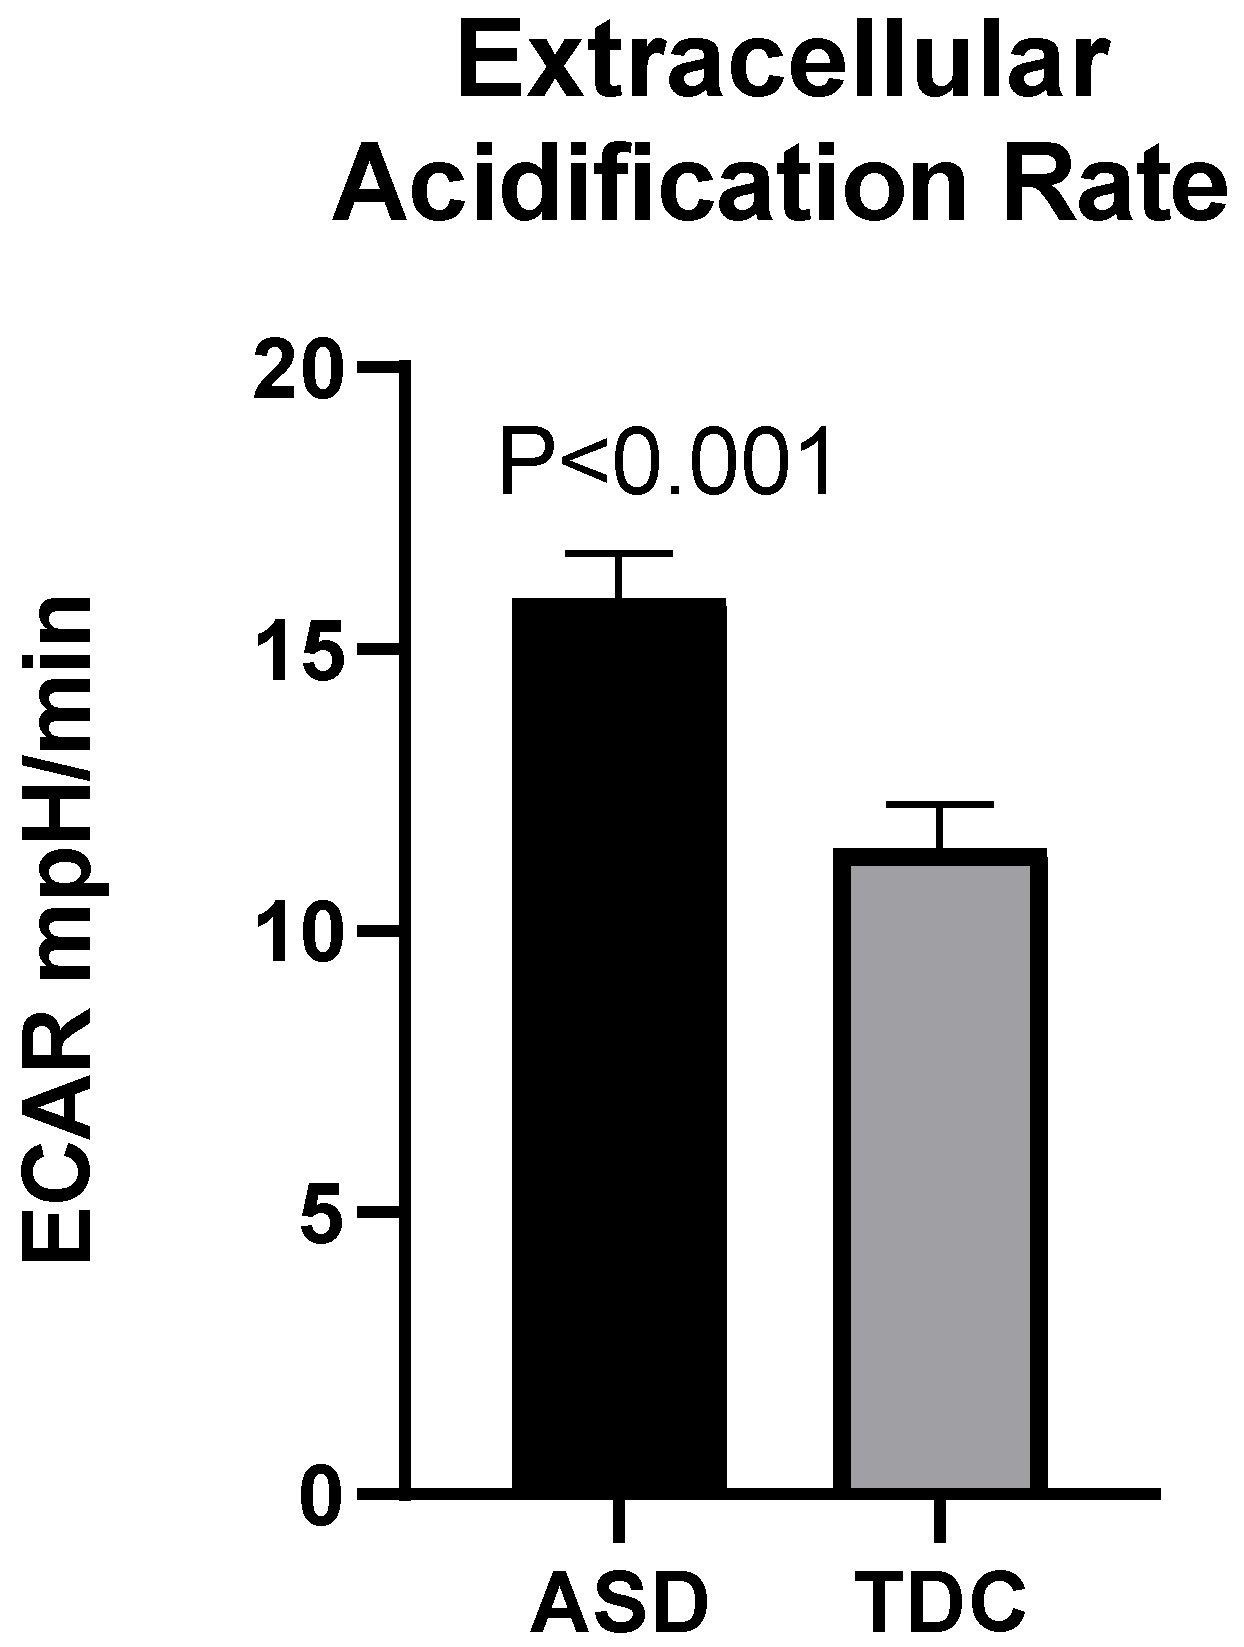
2.3.2. Mito Stress Test-Extracellular Acidification (ECAR)
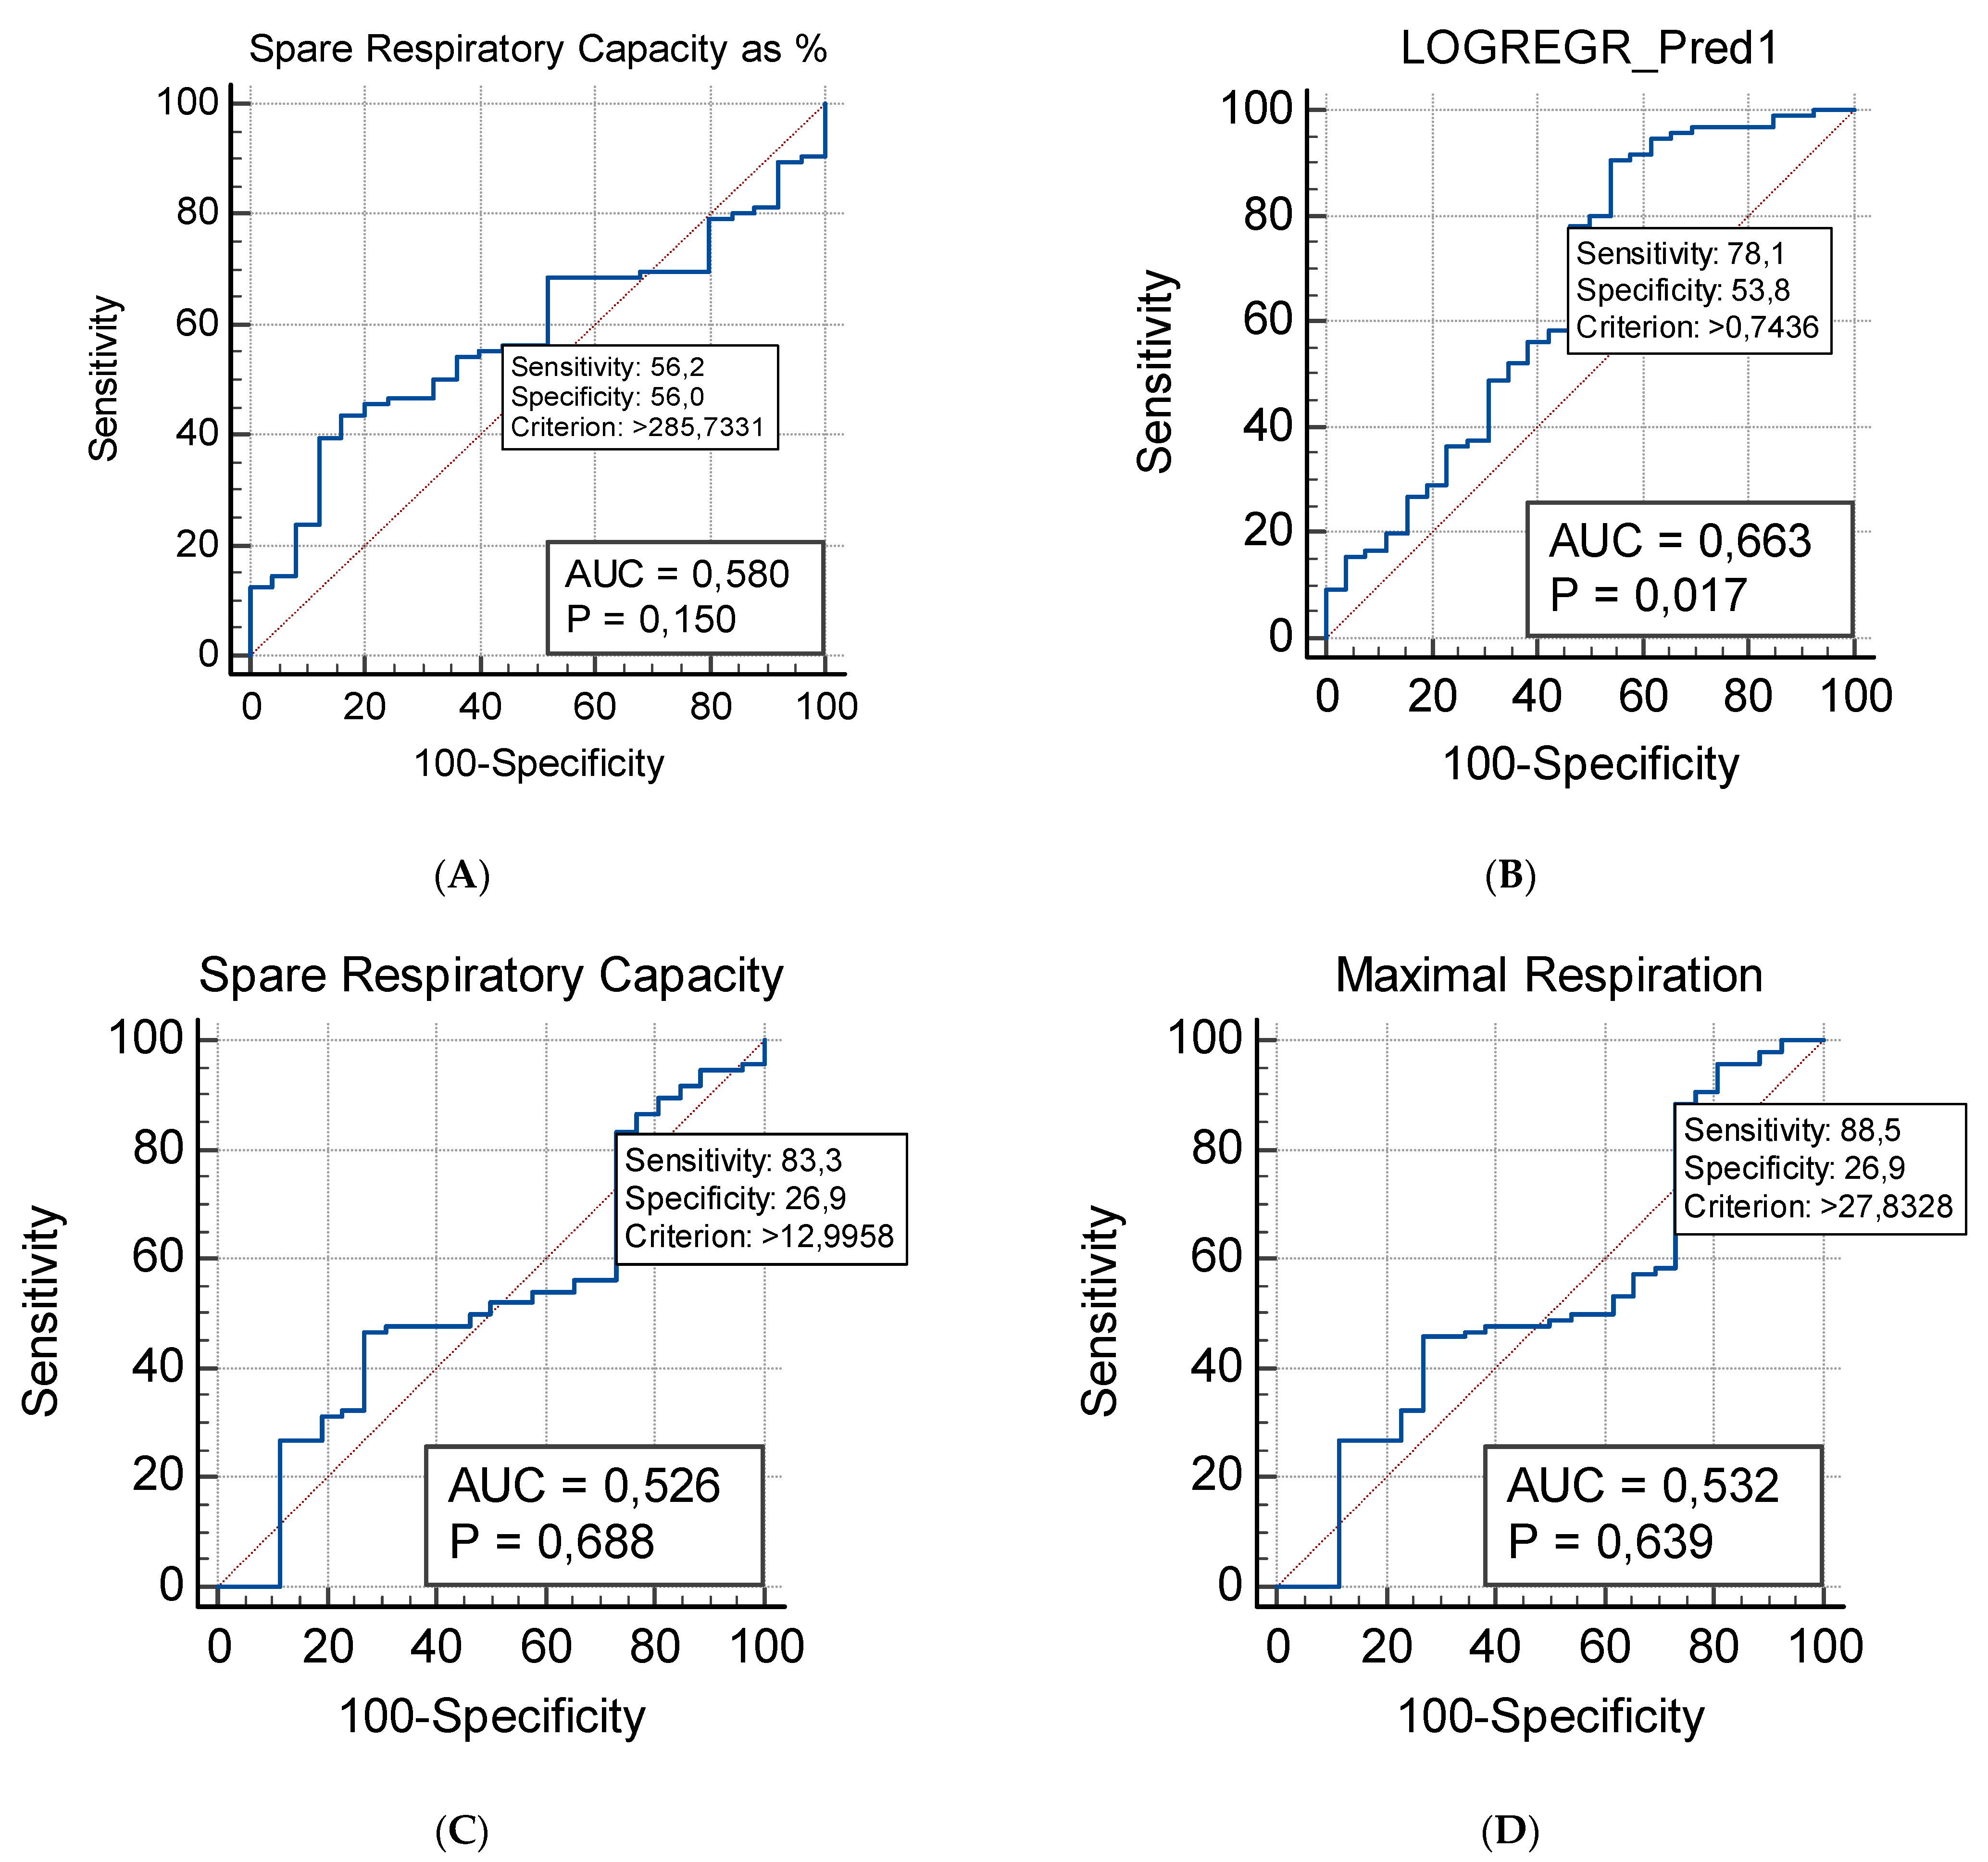
2.4. Correlation between Plasma Levels of NGF and Mitochondrial Respiration
3. Discussion
4. Materials and Methods
4.1. Subjects
4.2. Isolation of Plasma
4.3. Isolation of Peripheral Blood Mononuclear Cells (PBMCs)
4.4. NGF Detection by ELISA
4.5. Mito Stress Test
4.6. Statistics
5. Conclusions
Supplementary Materials
Author Contributions
Funding
Institutional Review Board Statement
Informed Consent Statement
Data Availability Statement
Acknowledgments
Conflicts of Interest
References
- Gevezova, M.; Sarafian, V.; Anderson, G.; Maes, M. Inflammation and mitochondrial dysfunction in autism spectrum disorder. CNS Neurol. Disord. Drug Targets 2020, 19, 320–333. [Google Scholar] [CrossRef] [PubMed]
- Frye, R.E.; Rossignol, D.A. Mitochondrial dysfunction can connect the diverse medical symptoms associated with autism spectrum disorders. Pediatr. Res. 2011, 69, 41R–47R. [Google Scholar] [CrossRef] [PubMed]
- Legido, A.; Jethva, R.; Goldenthal, M.J. Mitochondrial dysfunction in autism. Semin. Pediatr. Neurol. 2013, 20, 163–175. [Google Scholar] [CrossRef] [PubMed]
- Giulivi, C.; Zhang, Y.F.; Omanska-Klusek, A.; Ross-Inta, C.; Wong, S.; Hertz-Picciotto, I.; Tassone, F.; Pessah, I.N. Mitochondrial dysfunction in autism. JAMA 2010, 304, 2389–2396. [Google Scholar] [CrossRef] [PubMed] [Green Version]
- Rossignol, D.A.; Frye, R.E. Mitochondrial dysfunction in autism spectrum disorders: A systematic review and meta-analysis. Mol. Psychiatry 2012, 17, 290–314. [Google Scholar] [CrossRef] [Green Version]
- Palmieri, L.; Persico, A.M. Mitochondrial dysfunction in autism spectrum disorders: Cause or effect? Biochim. Biophys. Acta 2010, 1797, 1130–1137. [Google Scholar] [CrossRef] [Green Version]
- Liu, S.H.; Shi, X.J.; Fan, F.C.; Cheng, Y. Peripheral blood neurotrophic factor levels in children with autism spectrum disorder: A meta-analysis. Sci. Rep. 2021, 11, 15. [Google Scholar] [CrossRef]
- Mostafa, G.A.; Meguid, N.A.; Shehab, A.A.S.; Elsaeid, A.; Maher, M. Plasma levels of nerve growth factor in Egyptian autistic children: Relation to hyperserotonemia and autoimmunity. J. Neuroimmunol. 2021, 358, 577638. [Google Scholar] [CrossRef] [PubMed]
- Aloe, L.; Bracci-Laudiero, L.; Bonini, S.; Manni, L. The expanding role of nerve growth factor: From neurotrophic activity to immunologic diseases. Allergy 1997, 52, 883–894. [Google Scholar] [CrossRef] [PubMed]
- Albert-Gasco, H.; Ros-Bernal, F.; Castillo-Gomez, E.; Olucha-Bordonau, F.E. MAP/ERK Signaling in Developing Cognitive and Emotional Function and Its Effect on Pathological and Neurodegenerative Processes. Int. J. Mol. Sci. 2020, 21, 4471. [Google Scholar] [CrossRef]
- Kropf, E.; Fahnestock, M. Effects of Reactive Oxygen and Nitrogen Species on TrkA Expression and Signalling: Implications for proNGF in Aging and Alzheimer’s Disease. Cells 2021, 10, 1983. [Google Scholar] [CrossRef] [PubMed]
- Martorana, F.; Gaglio, D.; Bianco, M.R.; Aprea, F.; Virtuoso, A.; Bonanomi, M.; Alberghina, L.; Papa, M.; Colangelo, A.M. Differentiation by nerve growth factor (NGF) involves mechanisms of crosstalk between energy homeostasis and mitochondrial remodeling. Cell Death Dis. 2018, 9, 391. [Google Scholar] [CrossRef] [PubMed]
- Chu, C.; Levine, E.; Gear, R.W.; Bogen, O.; Levine, J.D. Mitochondrial dependence of nerve growth factor-induced mechanical hyperalgesia. Pain 2011, 152, 1832–1837. [Google Scholar] [CrossRef] [Green Version]
- Carito, V.; Pingitore, A.; Cione, E.; Perrotta, I.; Mancuso, D.; Russo, A.; Genchi, G.; Caroleo, M.C. Localization of nerve growth factor (NGF) receptors in the mitochondrial compartment: Characterization and putative role. Biochim. Biophys. Acta 2012, 1820, 96–103. [Google Scholar] [CrossRef] [PubMed]
- Armijo-Weingart, L.; Ketschek, A.; Sainath, R.; Pacheco, A.; Smith, G.M.; Gallo, G. Neurotrophins induce fission of mitochondria along embryonic sensory axons. elife 2019, 8, e49494. [Google Scholar] [CrossRef] [PubMed]
- Galvez-Contreras, A.Y.; Campos-Ordonez, T.; Gonzalez-Castaneda, R.E.; Gonzalez-Perez, O. Alterations of Growth Factors in Autism and Attention-Deficit/Hyperactivity Disorder. Front. Psychiatry 2017, 8, 126. [Google Scholar] [CrossRef] [PubMed] [Green Version]
- Homberg, J.R.; Kyzar, E.J.; Nguyen, M.; Norton, W.H.; Pittman, J.; Poudel, M.K.; Gaikwad, S.; Nakamura, S.; Koshiba, M.; Yamanouchi, H.; et al. Understanding autism and other neurodevelopmental disorders through experimental translational neurobehavioral models. Neurosci. Biobehav. Rev. 2016, 65, 292–312. [Google Scholar] [CrossRef] [Green Version]
- Courchesne, E.; Carper, R.; Akshoomoff, N. Evidence of brain overgrowth in the first year of life in autism. JAMA 2003, 290, 337–344. [Google Scholar] [CrossRef] [PubMed] [Green Version]
- Hazlett, H.C.; Poe, M.; Gerig, G.; Smith, R.G.; Provenzale, J.; Ross, A.; Gilmore, J.; Piven, J. Magnetic resonance imaging and head circumference study of brain size in autism: Birth through age 2 years. Arch. Gen. Psychiatry 2005, 62, 1366–1376. [Google Scholar] [CrossRef] [PubMed] [Green Version]
- Dementieva, Y.A.; Vance, D.D.; Donnelly, S.L.; Elston, L.A.; Wolpert, C.M.; Ravan, S.A.; DeLong, G.R.; Abramson, R.K.; Wright, H.H.; Cuccaro, M.L. Accelerated head growth in early development of individuals with autism. Pediatr. Neurol. 2005, 32, 102–108. [Google Scholar] [CrossRef]
- Dissanayake, C.; Bui, Q.M.; Huggins, R.; Loesch, D.Z. Growth in stature and head circumference in high-functioning autism and Asperger disorder during the first 3 years of life. Dev. Psychopathol. 2006, 18, 381–393. [Google Scholar] [CrossRef] [PubMed] [Green Version]
- Dawson, G.; Munson, J.; Webb, S.J.; Nalty, T.; Abbott, R.; Toth, K. Rate of head growth decelerates and symptoms worsen in the second year of life in autism. Biol. Psychiatry 2007, 61, 458–464. [Google Scholar] [CrossRef] [Green Version]
- Kern, J.K.; Geier, D.A.; Sykes, L.K.; Geier, M.R. Evidence of neurodegeneration in autism spectrum disorder. Transl. Neurodegener. 2013, 2, 17. [Google Scholar] [CrossRef] [PubMed] [Green Version]
- Stefanatos, G.A. Regression in autistic spectrum disorders. Neuropsychol. Rev. 2008, 18, 305–319. [Google Scholar] [CrossRef] [PubMed]
- Bailey, A.; Luthert, P.; Dean, A.; Harding, B.; Janota, I.; Montgomery, M.; Rutter, M.; Lantos, P. A clinicopathological study of autism. Brain 1998, 121 Pt 5, 889–905. [Google Scholar] [CrossRef] [PubMed] [Green Version]
- Kemper, T.L.; Bauman, M. Neuropathology of infantile autism. J. Neuropathol. Exp. Neurol. 1998, 57, 645–652. [Google Scholar] [CrossRef] [Green Version]
- Kemper, T.L.; Bauman, M.L. Neuropathology of infantile autism. Mol. Psychiatry 2002, 7 (Suppl. S2), S12–S13. [Google Scholar] [CrossRef] [Green Version]
- Lee, M.; Martin-Ruiz, C.; Graham, A.; Court, J.; Jaros, E.; Perry, R.; Iversen, P.; Bauman, M.; Perry, E. Nicotinic receptor abnormalities in the cerebellar cortex in autism. Brain 2002, 125, 1483–1495. [Google Scholar] [CrossRef] [Green Version]
- Rodriguez, J.I.; Kern, J.K. Evidence of microglial activation in autism and its possible role in brain underconnectivity. Neuron Glia Biol. 2011, 7, 205–213. [Google Scholar] [CrossRef] [Green Version]
- Toscano, C.V.A.; Barros, L.; Lima, A.B.; Nunes, T.; Carvalho, H.M.; Gaspar, J.M. Neuroinflammation in autism spectrum disorders: Exercise as a “pharmacological” tool. Neurosci. Biobehav. Rev. 2021, 129, 63–74. [Google Scholar] [CrossRef]
- Mattson, M.P.; Gleichmann, M.; Cheng, A. Mitochondria in neuroplasticity and neurological disorders. Neuron 2008, 60, 748–766. [Google Scholar] [CrossRef] [PubMed] [Green Version]
- Rojas-Charry, L.; Nardi, L.; Methner, A.; Schmeisser, M.J. Abnormalities of synaptic mitochondria in autism spectrum disorder and related neurodevelopmental disorders. J. Mol. Med. 2021, 99, 161–178. [Google Scholar] [CrossRef] [PubMed]
- Agostini, M.; Romeo, F.; Inoue, S.; Niklison-Chirou, M.V.; Elia, A.J.; Dinsdale, D.; Morone, N.; Knight, R.A.; Mak, T.W.; Melino, G. Metabolic reprogramming during neuronal differentiation. Cell Death Differ. 2016, 23, 1502–1514. [Google Scholar] [CrossRef] [PubMed] [Green Version]
- Esteban-Martinez, L.; Sierra-Filardi, E.; McGreal, R.S.; Salazar-Roa, M.; Marino, G.; Seco, E.; Durand, S.; Enot, D.; Grana, O.; Malumbres, M.; et al. Programmed mitophagy is essential for the glycolytic switch during cell differentiation. EMBO J. 2017, 36, 1688–1706. [Google Scholar] [CrossRef]
- Herrero-Mendez, A.; Almeida, A.; Fernandez, E.; Maestre, C.; Moncada, S.; Bolanos, J.P. The bioenergetic and antioxidant status of neurons is controlled by continuous degradation of a key glycolytic enzyme by APC/C-Cdh1. Nat. Cell Biol. 2009, 11, 747–752. [Google Scholar] [CrossRef]
- Zheng, X.; Boyer, L.; Jin, M.; Mertens, J.; Kim, Y.; Ma, L.; Ma, L.; Hamm, M.; Gage, F.H.; Hunter, T. Metabolic reprogramming during neuronal differentiation from aerobic glycolysis to neuronal oxidative phosphorylation. eLife 2016, 5, e13374. [Google Scholar] [CrossRef]
- Sin, J.; Andres, A.M.; Taylor, D.J.; Weston, T.; Hiraumi, Y.; Stotland, A.; Kim, B.J.; Huang, C.; Doran, K.S.; Gottlieb, R.A. Mitophagy is required for mitochondrial biogenesis and myogenic differentiation of C2C12 myoblasts. Autophagy 2016, 12, 369–380. [Google Scholar] [CrossRef] [Green Version]
- Balachandar, V.; Rajagopalan, K.; Jayaramayya, K.; Jeevanandam, M.; Iyer, M. Mitochondrial dysfunction: A hidden trigger of autism? Genes Dis. 2021, 8, 629–639. [Google Scholar] [CrossRef]
- Bjorklund, G.; Meguid, N.A.; El-Bana, M.A.; Tinkov, A.A.; Saad, K.; Dadar, M.; Hemimi, M.; Skalny, A.V.; Hosnedlova, B.; Kizek, R.; et al. Oxidative Stress in Autism Spectrum Disorder. Mol. Neurobiol. 2020, 57, 2314–2332. [Google Scholar] [CrossRef]
- Wang, X.; Michaelis, E.K. Selective neuronal vulnerability to oxidative stress in the brain. Front. Aging Neurosci. 2010, 2, 12. [Google Scholar] [CrossRef]
- Jheng, H.F.; Tsai, P.J.; Guo, S.M.; Kuo, L.H.; Chang, C.S.; Su, I.J.; Chang, C.R.; Tsai, Y.S. Mitochondrial fission contributes to mitochondrial dysfunction and insulin resistance in skeletal muscle. Mol. Cell Biol. 2012, 32, 309–319. [Google Scholar] [CrossRef] [Green Version]
- Amiri, M.; Hollenbeck, P.J. Mitochondrial biogenesis in the axons of vertebrate peripheral neurons. Dev. Neurobiol. 2008, 68, 1348–1361. [Google Scholar] [CrossRef] [PubMed] [Green Version]
- Saxton, W.M.; Hollenbeck, P.J. The axonal transport of mitochondria. J. Cell Sci. 2012, 125, 2095–2104. [Google Scholar] [CrossRef] [PubMed] [Green Version]
- Smith, G.M.; Gallo, G. The role of mitochondria in axon development and regeneration. Dev. Neurobiol. 2018, 78, 221–237. [Google Scholar] [CrossRef] [PubMed]
- Rossignol, D.A.; Frye, R.E. Evidence linking oxidative stress, mitochondrial dysfunction, and inflammation in the brain of individuals with autism. Front. Physiol. 2014, 5, 150. [Google Scholar] [CrossRef] [PubMed] [Green Version]
- Frye, R.E.; Rose, S.; Wynne, R.; Bennuri, S.C.; Blossom, S.; Gilbert, K.M.; Heilbrun, L.; Palmer, R.F. Oxidative Stress Challenge Uncovers Trichloroacetaldehyde Hydrate-Induced Mitoplasticity in Autistic and Control Lymphoblastoid Cell Lines. Sci. Rep. 2017, 7, 4478. [Google Scholar] [CrossRef] [PubMed] [Green Version]
- Anitha, A.; Nakamura, K.; Thanseem, I.; Matsuzaki, H.; Miyachi, T.; Tsujii, M.; Iwata, Y.; Suzuki, K.; Sugiyama, T.; Mori, N. Downregulation of the expression of mitochondrial electron transport complex genes in autism brains. Brain Pathol. 2013, 23, 294–302. [Google Scholar] [CrossRef]
- Tang, G.; Gutierrez Rios, P.; Kuo, S.H.; Akman, H.O.; Rosoklija, G.; Tanji, K.; Dwork, A.; Schon, E.A.; Dimauro, S.; Goldman, J.; et al. Mitochondrial abnormalities in temporal lobe of autistic brain. Neurobiol. Dis. 2013, 54, 349–361. [Google Scholar] [CrossRef] [PubMed] [Green Version]
- Chauhan, A.; Gu, F.; Essa, M.M.; Wegiel, J.; Kaur, K.; Brown, W.T.; Chauhan, V. Brain region-specific deficit in mitochondrial electron transport chain complexes in children with autism. J. Neurochem. 2011, 117, 209–220. [Google Scholar] [CrossRef] [Green Version]
- Rossignol, D.A.; Frye, R.E. A review of research trends in physiological abnormalities in autism spectrum disorders: Immune dysregulation, inflammation, oxidative stress, mitochondrial dysfunction and environmental toxicant exposures. Mol. Psychiatry 2012, 17, 389–401. [Google Scholar] [CrossRef] [PubMed]
- Sparks, B.F.; Friedman, S.D.; Shaw, D.W.; Aylward, E.H.; Echelard, D.; Artru, A.A.; Maravilla, K.R.; Giedd, J.N.; Munson, J.; Dawson, G.; et al. Brain structural abnormalities in young children with autism spectrum disorder. Neurology 2002, 59, 184–192. [Google Scholar] [CrossRef]
- Goss, J.R.; Taffe, K.M.; Kochanek, P.M.; DeKosky, S.T. The antioxidant enzymes glutathione peroxidase and catalase increase following traumatic brain injury in the rat. Exp. Neurol. 1997, 146, 291–294. [Google Scholar] [CrossRef]
- Tabakman, R.; Lecht, S.; Sephanova, S.; Arien-Zakay, H.; Lazarovici, P. Interactions between the cells of the immune and nervous system: Neurotrophins as neuroprotection mediators in CNS injury. Prog. Brain Res. 2004, 146, 387–401. [Google Scholar] [CrossRef]
- Dugan, L.L.; Creedon, D.J.; Johnson, E.M., Jr.; Holtzman, D.M. Rapid suppression of free radical formation by nerve growth factor involves the mitogen-activated protein kinase pathway. Proc. Natl. Acad. Sci. USA 1997, 94, 4086–4091. [Google Scholar] [CrossRef] [Green Version]
- Enns, G.M. The contribution of mitochondria to common disorders. Mol. Genet. Metab. 2003, 80, 11–26. [Google Scholar] [CrossRef] [PubMed]
- Kaplan, D.R.; Martin-Zanca, D.; Parada, L.F. Tyrosine phosphorylation and tyrosine kinase activity of the trk proto-oncogene product induced by NGF. Nature 1991, 350, 158–160. [Google Scholar] [CrossRef] [PubMed]
- Otten, U.; Ehrhard, P.; Peck, R. Nerve growth factor induces growth and differentiation of human B lymphocytes. Proc. Natl. Acad. Sci. USA 1989, 86, 10059–10063. [Google Scholar] [CrossRef] [Green Version]
- Johnson, J.; Mercado-Ayon, E.; Mercado-Ayon, Y.; Dong, Y.N.; Halawani, S.; Ngaba, L.; Lynch, D.R. Mitochondrial dysfunction in the development and progression of neurodegenerative diseases. Arch. Biochem. Biophys 2021, 702, 108698. [Google Scholar] [CrossRef] [PubMed]
- Bennuri, S.C.; Rose, S.; Frye, R.E. Mitochondrial Dysfunction Is Inducible in Lymphoblastoid Cell Lines from Children With Autism and May Involve the TORC1 Pathway. Front. Psychiatry 2019, 10, 269. [Google Scholar] [CrossRef] [Green Version]
- Yui, K.; Tanuma, N.; Yamada, H.; Kawasaki, Y. Decreased total antioxidant capacity has a larger effect size than increased oxidant levels in urine in individuals with autism spectrum disorder. Environ. Sci. Pollut. Res. Int. 2017, 24, 9635–9644. [Google Scholar] [CrossRef] [PubMed]
- Rose, S.; Melnyk, S.; Pavliv, O.; Bai, S.; Nick, T.G.; Frye, R.E.; James, S.J. Evidence of oxidative damage and inflammation associated with low glutathione redox status in the autism brain. Transl. Psychiatry 2012, 2, e134. [Google Scholar] [CrossRef] [PubMed] [Green Version]
- James, S.J.; Melnyk, S.; Jernigan, S.; Cleves, M.A.; Halsted, C.H.; Wong, D.H.; Cutler, P.; Bock, K.; Boris, M.; Bradstreet, J.J.; et al. Metabolic endophenotype and related genotypes are associated with oxidative stress in children with autism. Am. J. Med. Genet. B Neuropsychiatr. Genet. 2006, 141B, 947–956. [Google Scholar] [CrossRef] [Green Version]
- Rose, S.; Bennuri, S.C.; Wynne, R.; Melnyk, S.; James, S.J.; Frye, R.E. Mitochondrial and redox abnormalities in autism lymphoblastoid cells: A sibling control study. FASEB J. 2017, 31, 904–909. [Google Scholar] [CrossRef] [Green Version]
- Pan, Z.; Perez-Polo, R. Role of nerve growth factor in oxidant homeostasis: Glutathione metabolism. J. Neurochem. 1993, 61, 1713–1721. [Google Scholar] [CrossRef]
- Gallo, G. The cytoskeletal and signaling mechanisms of axon collateral branching. Dev. Neurobiol. 2011, 71, 201–220. [Google Scholar] [CrossRef]
- Spillane, M.; Ketschek, A.; Merianda, T.T.; Twiss, J.L.; Gallo, G. Mitochondria coordinate sites of axon branching through localized intra-axonal protein synthesis. Cell Rep. 2013, 5, 1564–1575. [Google Scholar] [CrossRef] [PubMed] [Green Version]
- Martorana, F.; Guidotti, G.; Brambilla, L.; Rossi, D. Withaferin A Inhibits Nuclear Factor-kappaB-Dependent Pro-Inflammatory and Stress Response Pathways in the Astrocytes. Neural Plast. 2015, 2015, 381964. [Google Scholar] [CrossRef] [Green Version]
- Ohja, K.; Gozal, E.; Fahnestock, M.; Cai, L.; Cai, J.; Freedman, J.H.; Switala, A.; El-Baz, A.; Barnes, G.N. Neuroimmunologic and Neurotrophic Interactions in Autism Spectrum Disorders: Relationship to Neuroinflammation. Neuromolecular Med. 2018, 20, 161–173. [Google Scholar] [CrossRef] [PubMed] [Green Version]
- Gomez-Fernandez, A.; de la Torre-Aguilar, M.J.; Gil-Campos, M.; Flores-Rojas, K.; Cruz-Rico, M.D.; Martin-Borreguero, P.; Perez-Navero, J.L. Children With Autism Spectrum Disorder With Regression Exhibit a Different Profile in Plasma Cytokines and Adhesion Molecules Compared to Children Without Such Regression. Front. Pediatr. 2018, 6, 264. [Google Scholar] [CrossRef] [Green Version]
- Cheng, N.; Rho, J.M.; Masino, S.A. Metabolic Dysfunction Underlying Autism Spectrum Disorder and Potential Treatment Approaches. Front. Mol. Neurosci. 2017, 10, 34. [Google Scholar] [CrossRef]
- Manglunia, A.S.; Puranik, A.D. FDG PET/CT findings in a clinically diagnosed case of childhood autism. Indian J. Nucl. Med. 2016, 31, 138–140. [Google Scholar] [CrossRef] [PubMed] [Green Version]
- Bolton, P.F.; Griffiths, P.D. Association of tuberous sclerosis of temporal lobes with autism and atypical autism. Lancet 1997, 349, 392–395. [Google Scholar] [CrossRef]
- Chugani, H.T.; Juhasz, C.; Behen, M.E.; Ondersma, R.; Muzik, O. Autism with facial port-wine stain: A new syndrome? Pediatr. Neurol. 2007, 37, 192–199. [Google Scholar] [CrossRef]
- Sharma, R.P. Blood chromatin as a biosensor of the epigenetic milieu: A tool for studies in living psychiatric patients. Epigenomics 2012, 4, 551–559. [Google Scholar] [CrossRef] [Green Version]
- Shimojo, M.; Imai, Y.; Nakajima, K.; Mizushima, S.; Uemura, A.; Kohsaka, S. Interleukin-2 enhances the viability of primary cultured rat neocortical neurons. Neurosci. Lett. 1993, 151, 170–173. [Google Scholar] [CrossRef] [PubMed]
- Gladkevich, A.; Kauffman, H.F.; Korf, J. Lymphocytes as a neural probe: Potential for studying psychiatric disorders. Prog. Neuro-Psychopharmacol. Biol. Psychiatry 2004, 28, 559–576. [Google Scholar] [CrossRef]
- Pariante, C.M.; Miller, A.H. Glucocorticoid receptors in major depression: Relevance to pathophysiology and treatment. Biol. Psychiatry 2001, 49, 391–404. [Google Scholar] [CrossRef]
- Yi, Z.; Li, Z.; Yu, S.; Yuan, C.; Hong, W.; Wang, Z.; Cui, J.; Shi, T.; Fang, Y. Blood-based gene expression profiles models for classification of subsyndromal symptomatic depression and major depressive disorder. PLoS ONE 2012, 7, e31283. [Google Scholar] [CrossRef]
- Annesley, S.J.; Lay, S.T.; De Piazza, S.W.; Sanislav, O.; Hammersley, E.; Allan, C.Y.; Francione, L.M.; Bui, M.Q.; Chen, Z.P.; Ngoei, K.R.; et al. Immortalized Parkinson’s disease lymphocytes have enhanced mitochondrial respiratory activity. Dis. Model. Mech. 2016, 9, 1295–1305. [Google Scholar] [CrossRef] [Green Version]
- Bordoni, M.; Pansarasa, O.; Scarian, E.; Cristofani, R.; Leone, R.; Fantini, V.; Garofalo, M.; Diamanti, L.; Bernuzzi, S.; Gagliardi, S.; et al. Lysosomes Dysfunction Causes Mitophagy Impairment in PBMCs of Sporadic ALS Patients. Cells 2022, 11, 1272. [Google Scholar] [CrossRef]
- Ehinger, J.K.; Morota, S.; Hansson, M.J.; Paul, G.; Elmer, E. Mitochondrial Respiratory Function in Peripheral Blood Cells from Huntington’s Disease Patients. Mov. Disord. Clin. Pr. 2016, 3, 472–482. [Google Scholar] [CrossRef] [PubMed] [Green Version]
- Karabatsiakis, A.; Bock, C.; Salinas-Manrique, J.; Kolassa, S.; Calzia, E.; Dietrich, D.E.; Kolassa, I.T. Mitochondrial respiration in peripheral blood mononuclear cells correlates with depressive subsymptoms and severity of major depression. Transl. Psychiatry 2014, 4, e397. [Google Scholar] [CrossRef] [PubMed] [Green Version]
- Rose, S.; Frye, R.E.; Slattery, J.; Wynne, R.; Tippett, M.; Pavliv, O.; Melnyk, S.; James, S.J. Oxidative stress induces mitochondrial dysfunction in a subset of autism lymphoblastoid cell lines in a well-matched case control cohort. PLoS ONE 2014, 9, e85436. [Google Scholar] [CrossRef] [PubMed]
- Licznerski, P.; Park, H.A.; Rolyan, H.; Chen, R.; Mnatsakanyan, N.; Miranda, P.; Graham, M.; Wu, J.; Cruz-Reyes, N.; Mehta, N.; et al. ATP Synthase c-Subunit Leak Causes Aberrant Cellular Metabolism in Fragile X Syndrome. Cell 2020, 182, 1170–1185.e9. [Google Scholar] [CrossRef] [PubMed]
- Hanley, H.G.; Stahl, S.M.; Freedman, D.X. Hyperserotonemia and amine metabolites in autistic and retarded children. Arch. Gen. Psychiatry 1977, 34, 521–531. [Google Scholar] [CrossRef]
- Maes, M.; Anderson, G.; Betancort Medina, S.R.; Seo, M.; Ojala, J.O. Integrating Autism Spectrum Disorder Pathophysiology: Mitochondria, Vitamin A, CD38, Oxytocin, Serotonin and Melatonergic Alterations in the Placenta and Gut. Curr. Pharm. Des. 2019, 25, 4405–4420. [Google Scholar] [CrossRef]
- Pagan, C.; Goubran-Botros, H.; Delorme, R.; Benabou, M.; Lemiere, N.; Murray, K.; Amsellem, F.; Callebert, J.; Chaste, P.; Jamain, S.; et al. Disruption of melatonin synthesis is associated with impaired 14-3-3 and miR-451 levels in patients with autism spectrum disorders. Sci. Rep. 2017, 7, 2096. [Google Scholar] [CrossRef] [Green Version]
- Taniya, M.A.; Chung, H.J.; Al Mamun, A.; Alam, S.; Aziz, M.A.; Emon, N.U.; Islam, M.M.; Hong, S.S.; Podder, B.R.; Ara Mimi, A.; et al. Role of Gut Microbiome in Autism Spectrum Disorder and Its Therapeutic Regulation. Front. Cell Infect. Microbiol. 2022, 12, 915701. [Google Scholar] [CrossRef]
- Wong, C.B.; Tanaka, A.; Kuhara, T.; Xiao, J.Z. Potential Effects of Indole-3-Lactic Acid, a Metabolite of Human Bifidobacteria, on NGF-induced Neurite Outgrowth in PC12 Cells. Microorganisms 2020, 8, 398. [Google Scholar] [CrossRef] [Green Version]
- Jang, S.W.; Liu, X.; Pradoldej, S.; Tosini, G.; Chang, Q.; Iuvone, P.M.; Ye, K. N-acetylserotonin activates TrkB receptor in a circadian rhythm. Proc. Natl. Acad. Sci. USA 2010, 107, 3876–3881. [Google Scholar] [CrossRef]
- Joshi, R.; Salton, S.R.J. Neurotrophin Crosstalk in the Etiology and Treatment of Neuropsychiatric and Neurodegenerative Disease. Front. Mol. Neurosci. 2022, 15, 932497. [Google Scholar] [CrossRef] [PubMed]
- Anderson, G.; Maes, M. Gut Dysbiosis Dysregulates Central and Systemic Homeostasis via Suboptimal Mitochondrial Function: Assessment, Treatment and Classification Implications. Curr. Top. Med. Chem. 2020, 20, 524–539. [Google Scholar] [CrossRef] [PubMed]
- Lord, C.; Rutter, M.; DiLavore, P.; Risi, S.; Gotham, K.; Bishop, S. Autism Diagnostic Observation Schedule, Second Edition (ADOS-2) Manual (Part I). Modules. Torrance, CA: West. Psychol. Serv. 2012, 32, 88–92. [Google Scholar]
- Wechsler, D. Wechsler Intelligence Scale for Children Fourth Edition (WISC IV) for Children; Pearson Assessment Inc.: London, UK, 2003. [Google Scholar]
- Alpern, D. Developmental Profile-3 (DP-3). West. Psychol. Serv. 2007, 1–11. [Google Scholar]


| Mitochondrial Parameters | Pearson’s r | Pearson’s p |
|---|---|---|
| Maximal Respiration | r (35) = 0.30 | p = 0.075 |
| Proton Leak | r (36) = 0.34 | p = 0.038 |
| Inhibitor | Final Concentration | Function |
|---|---|---|
| Oligomycin | 1.5 µM | ATP synthase inhibitor |
| FCCP | 2 µM | Stimulated OCR |
| Rotenone | 0.5 µM | ETC complex I inhibitor |
Publisher’s Note: MDPI stays neutral with regard to jurisdictional claims in published maps and institutional affiliations. |
© 2022 by the authors. Licensee MDPI, Basel, Switzerland. This article is an open access article distributed under the terms and conditions of the Creative Commons Attribution (CC BY) license (https://creativecommons.org/licenses/by/4.0/).
Share and Cite
Gevezova, M.; Minchev, D.; Pacheva, I.; Todorova, T.; Yordanova, R.; Timova, E.; Ivanov, I.; Sarafian, V. Association of NGF and Mitochondrial Respiration with Autism Spectrum Disorder. Int. J. Mol. Sci. 2022, 23, 11917. https://doi.org/10.3390/ijms231911917
Gevezova M, Minchev D, Pacheva I, Todorova T, Yordanova R, Timova E, Ivanov I, Sarafian V. Association of NGF and Mitochondrial Respiration with Autism Spectrum Disorder. International Journal of Molecular Sciences. 2022; 23(19):11917. https://doi.org/10.3390/ijms231911917
Chicago/Turabian StyleGevezova, Maria, Danail Minchev, Iliana Pacheva, Tatyana Todorova, Ralitsa Yordanova, Elena Timova, Ivan Ivanov, and Victoria Sarafian. 2022. "Association of NGF and Mitochondrial Respiration with Autism Spectrum Disorder" International Journal of Molecular Sciences 23, no. 19: 11917. https://doi.org/10.3390/ijms231911917