
Acute Systemic White Blood Cell Changes following Degenerative Cervical Myelopathy (DCM) in a Mouse Model
 , , and
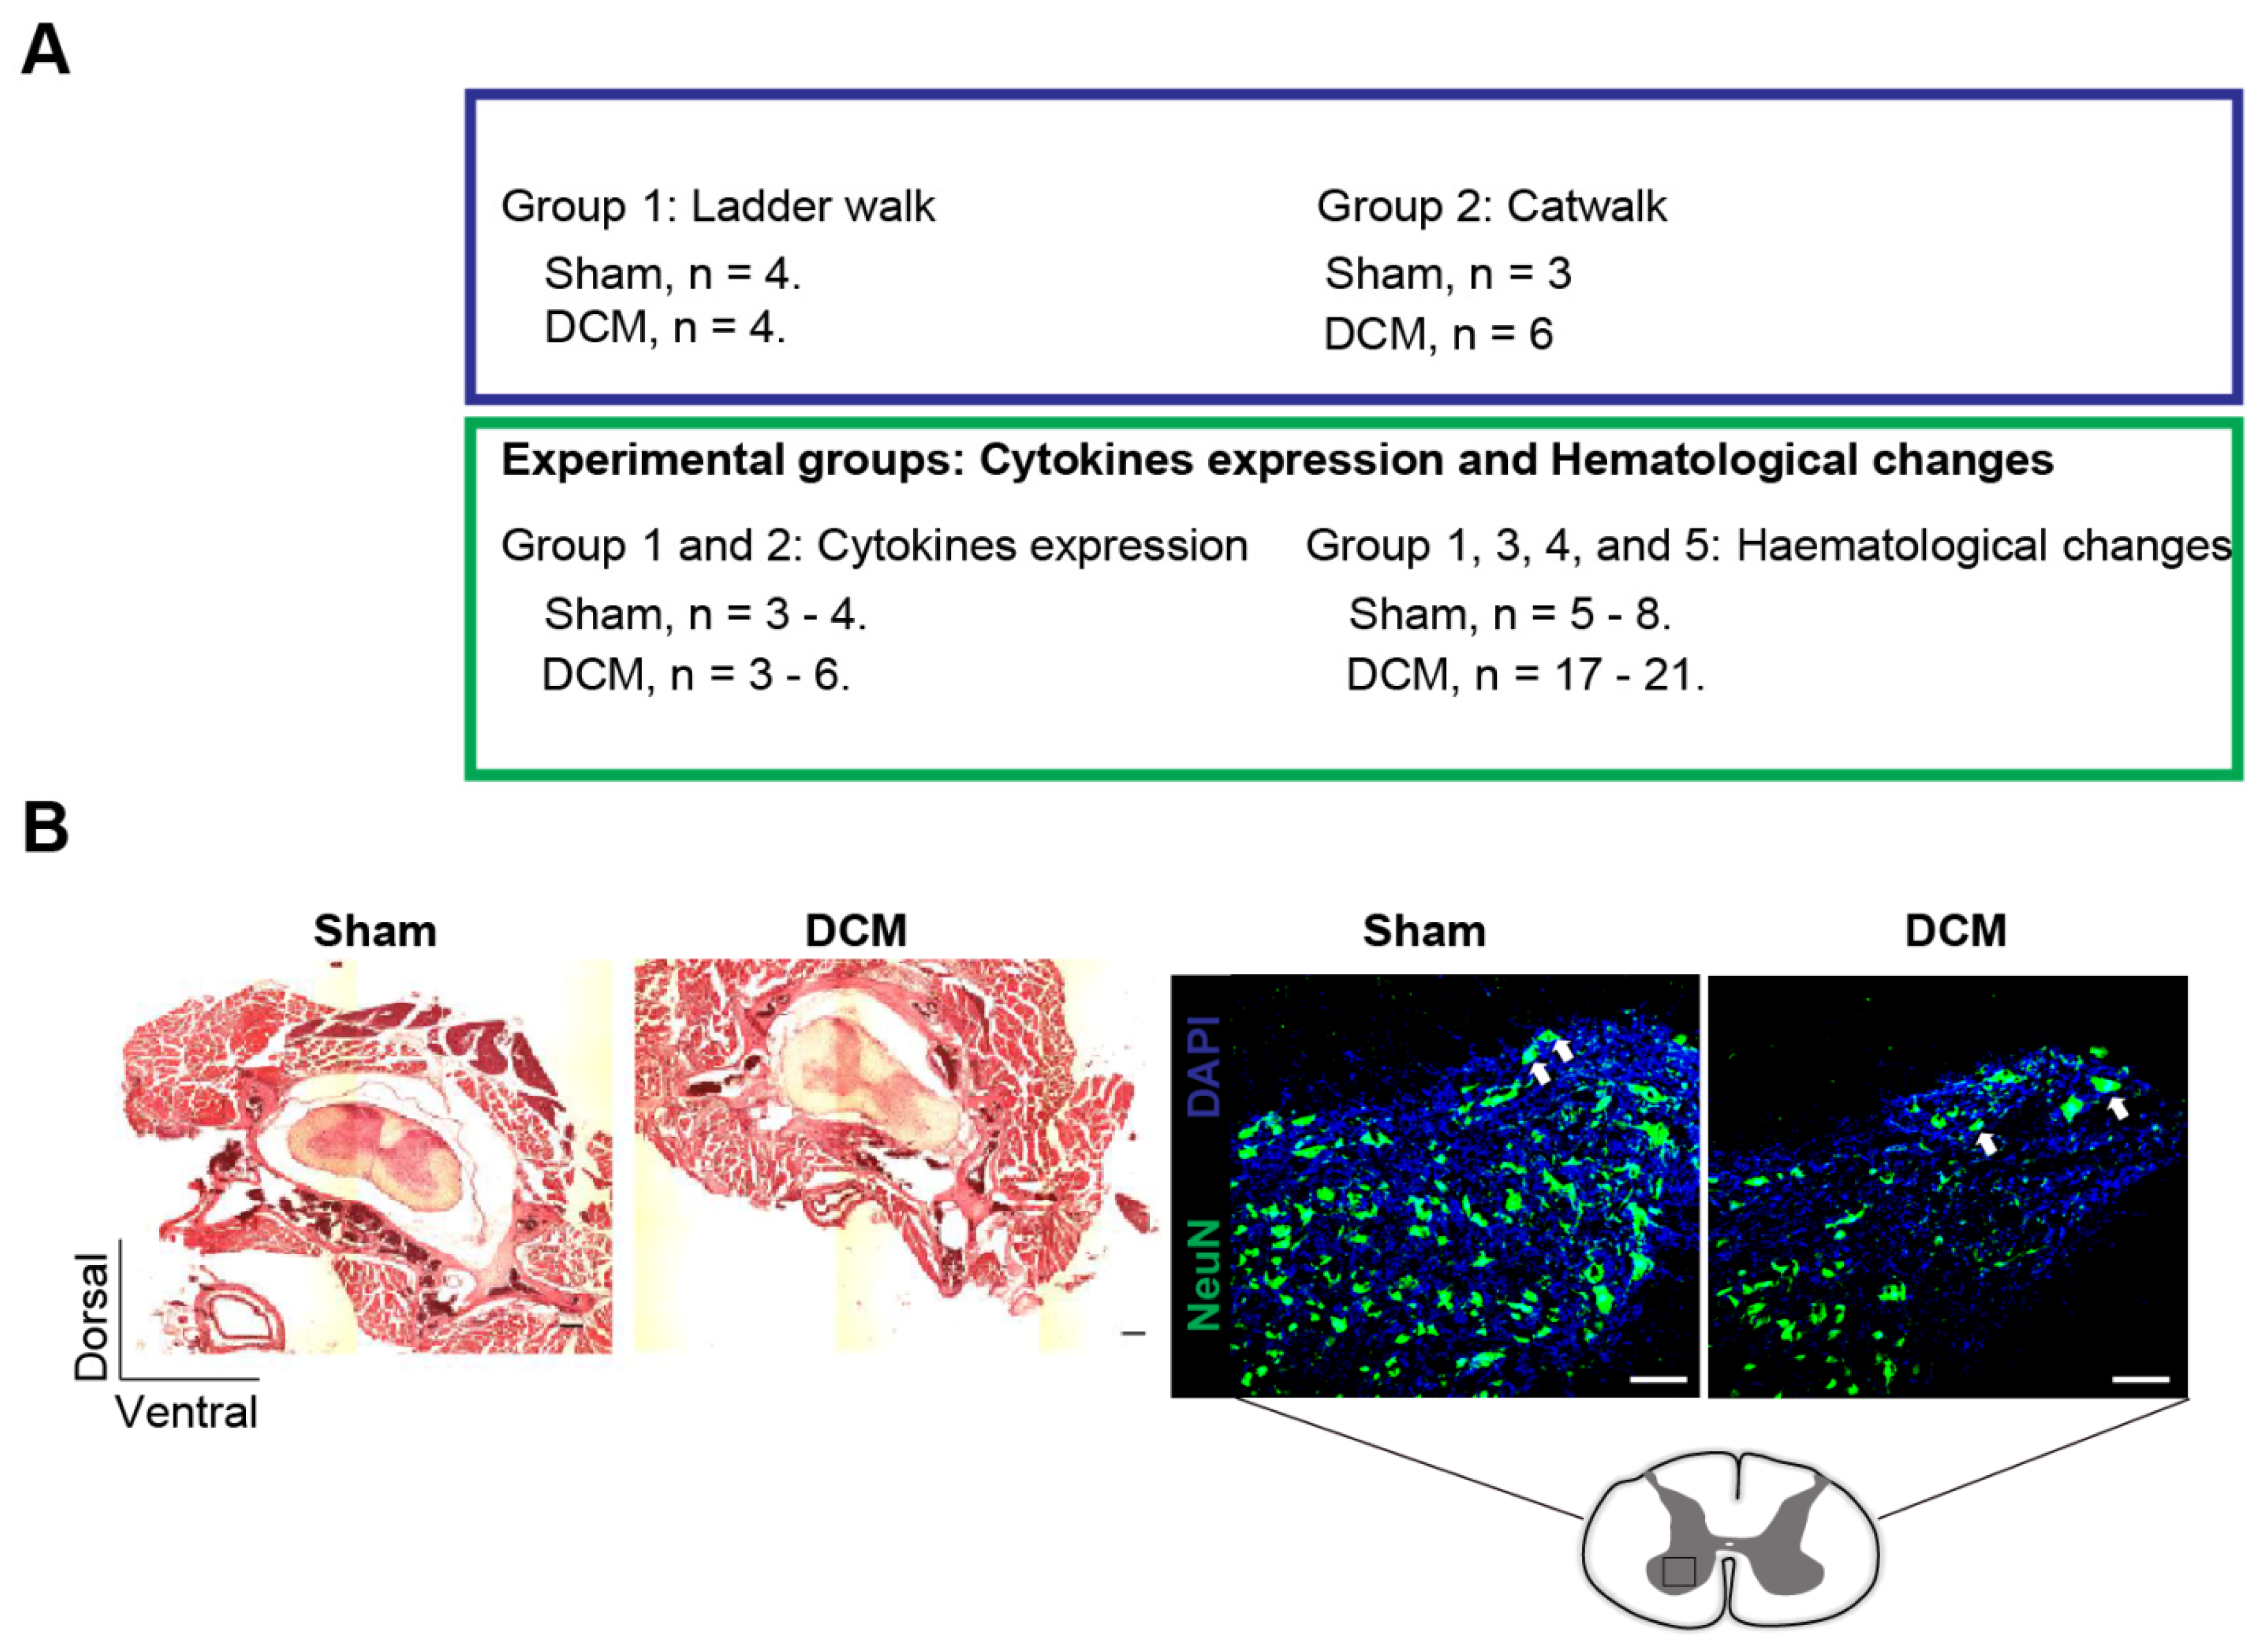
Abstract
:1. Introduction
2. Results
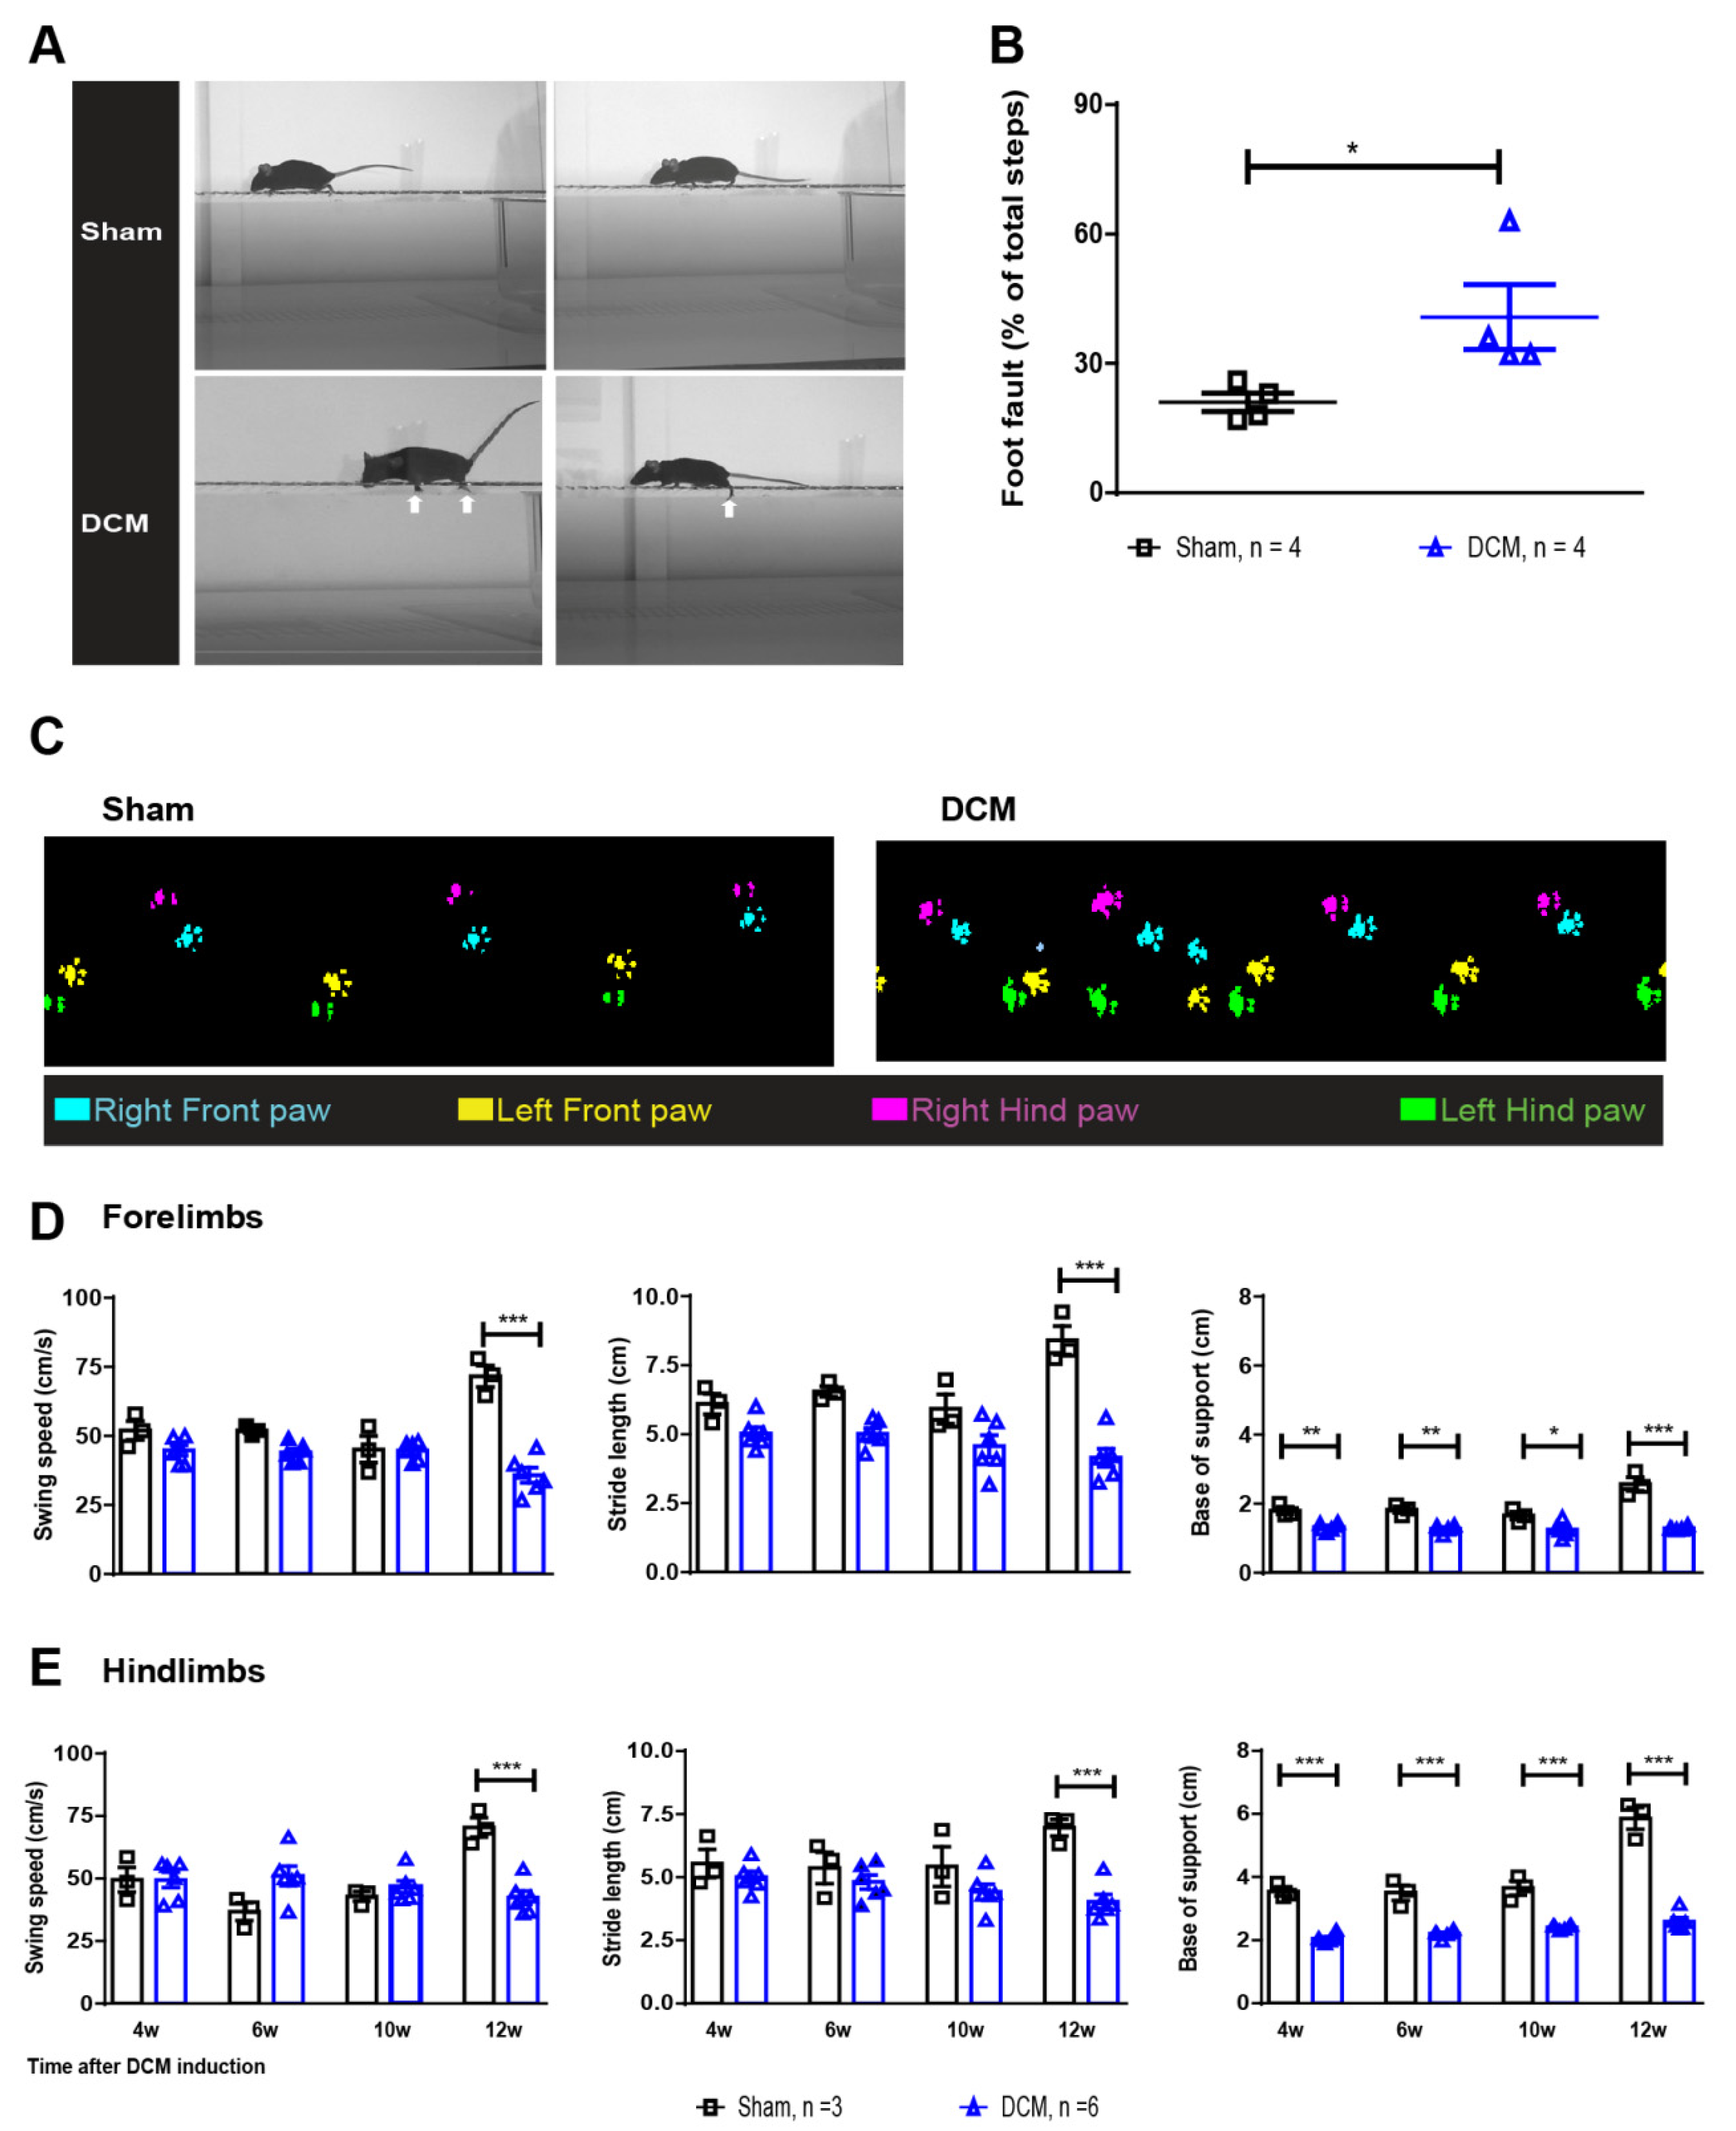
2.1. The DCM Model Presents with Detectable Clinically Relevant Neurological Deficits
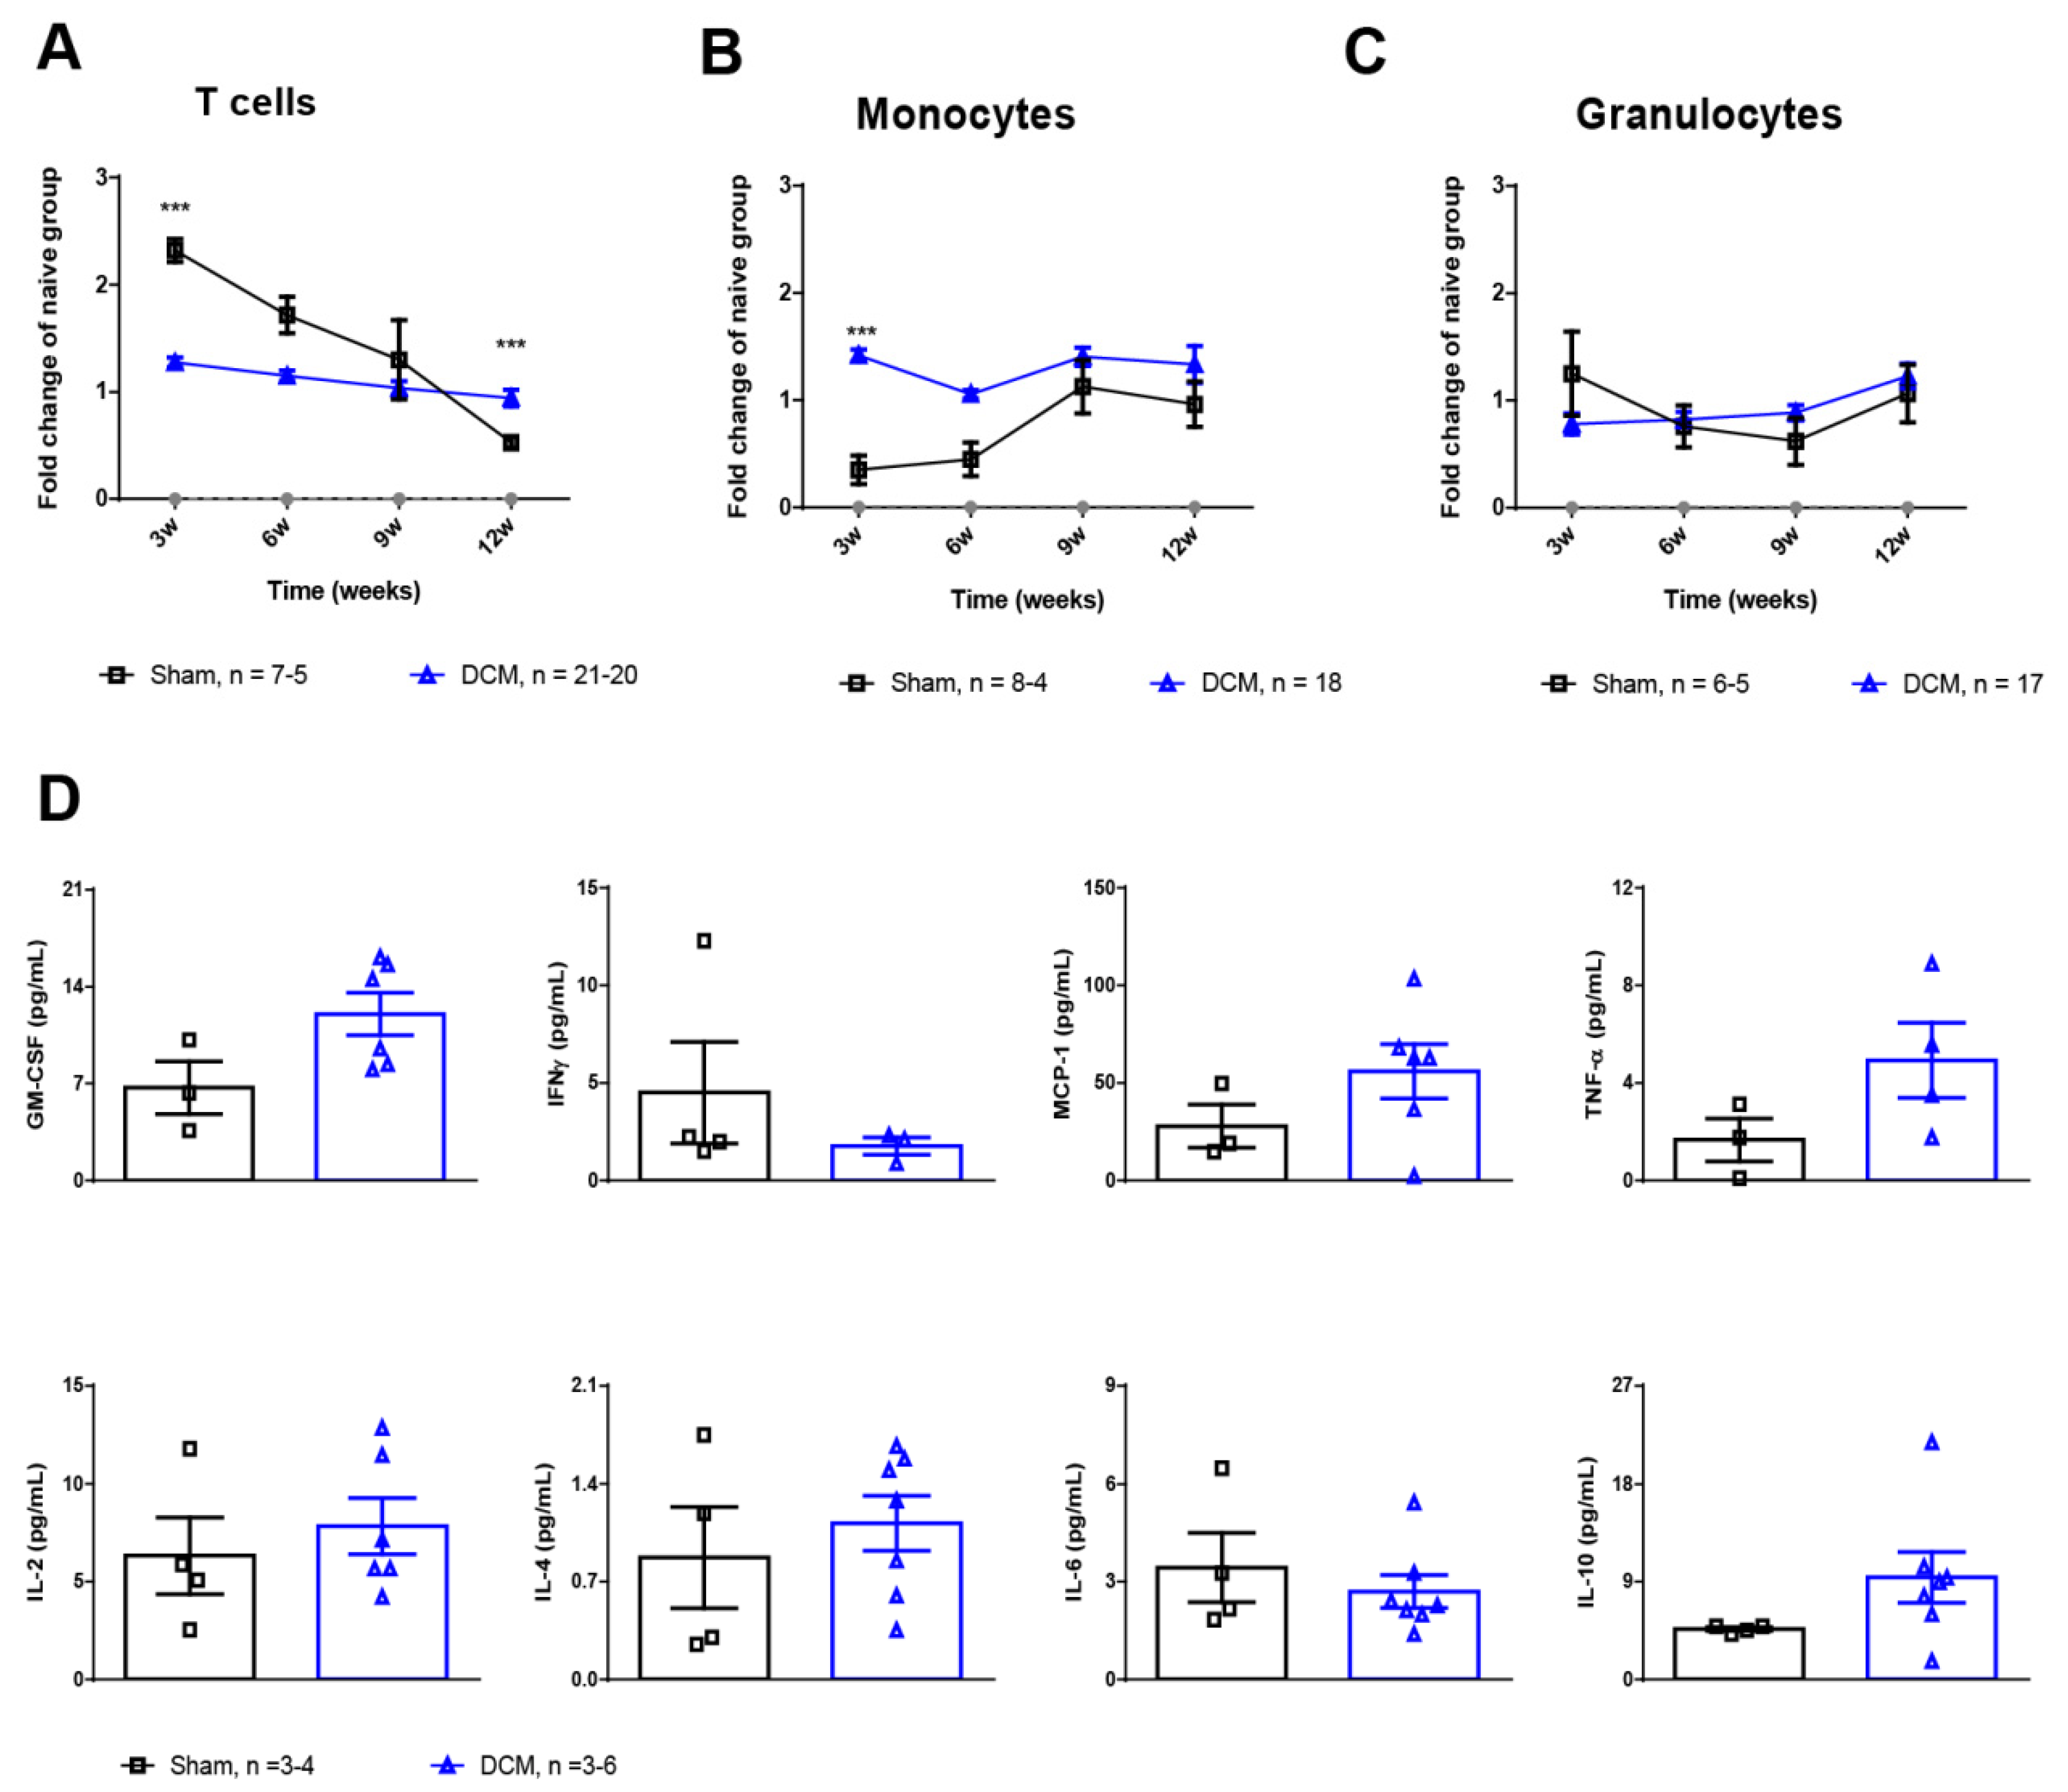
2.2. Monocytes and T Cells Are Affected during the First Weeks Post-DCM Induction
3. Discussion
4. Materials and Methods
4.1. Induction of DCM
4.2. Flow Cytometric Analysis of Hematological Changes
4.3. Luminex xMAP Assay for the Quantitation of Cytokines in Serum
4.4. Histological Assessment
4.5. Horizontal Ladder Walk to Assess Neurological Deficits
4.6. Catwalk to Assess Overground Locomotor Behavioral
4.7. Statistical Analysis
Author Contributions
Funding
Institutional Review Board Statement
Informed Consent Statement
Data Availability Statement
Acknowledgments
Conflicts of Interest
Abbreviations
References
- Kopp, M.A.; Druschel, C.; Meisel, C.; Liebscher, T.; Prilipp, E.; Watzlawick, R.; Cinelli, P.; Niedeggen, A.; Schaser, K.D.; Wanner, G.A.; et al. The SCIentinel study—Prospective multicenter study to define the spinal cord injury-induced immune depression syndrome (SCI-IDS)—Study protocol and interim feasibility data. BMC Neurol. 2013, 13, 168. [Google Scholar] [CrossRef] [PubMed]
- Nouri, A.; Tetreault, L.; Singh, A.; Karadimas, S.K.; Fehlings, M.G. Degenerative Cervical Myelopathy: Epidemiology, Genetics, and Pathogenesis. Spine 2015, 40, E675–E693. [Google Scholar] [CrossRef] [PubMed]
- Tetreault, L.; Goldstein, C.L.; Arnold, P.; Harrop, J.; Hilibrand, A.; Nouri, A.; Fehlings, M.G. Degenerative Cervical Myelopathy: A Spectrum of Related Disorders Affecting the Aging Spine. Neurosurgery 2015, 77 (Suppl. S4), S51–S67. [Google Scholar] [CrossRef] [PubMed]
- Fehlings, M.G.; Wilson, J.R.; Kopjar, B.; Yoon, S.T.; Arnold, P.M.; Massicotte, E.M.; Vaccaro, A.R.; Brodke, D.S.; Shaffrey, C.I.; Smith, J.S.; et al. Efficacy and safety of surgical decompression in patients with cervical spondylotic myelopathy: Results of the AOSpine North America prospective multi-center study. J. Bone Jt. Surg. Am. 2013, 95, 1651–1658. [Google Scholar] [CrossRef]
- Ahuja, C.S.; Wilson, J.R.; Nori, S.; Kotter, M.R.N.; Druschel, C.; Curt, A.; Fehlings, M.G. Traumatic spinal cord injury. Nat. Rev. Dis. Prim. 2017, 3, 17018. [Google Scholar] [CrossRef]
- Sun, X.; Jones, Z.B.; Chen, X.M.; Zhou, L.; So, K.F.; Ren, Y. Multiple organ dysfunction and systemic inflammation after spinal cord injury: A complex relationship. J. Neuroinflamm. 2016, 13, 260. [Google Scholar] [CrossRef]
- Brommer, B.; Engel, O.; Kopp, M.A.; Watzlawick, R.; Muller, S.; Pruss, H.; Chen, Y.; DeVivo, M.J.; Finkenstaedt, F.W.; Dirnagl, U.; et al. Spinal cord injury-induced immune deficiency syndrome enhances infection susceptibility dependent on lesion level. Brain 2016, 139, 692–707. [Google Scholar] [CrossRef]
- Ulndreaj, A.; Tzekou, A.; Siddiqui, A.M.; Fehlings, M.G. Effects of experimental cervical spinal cord injury on peripheral adaptive immunity. PLoS ONE 2020, 15, e0241285. [Google Scholar] [CrossRef]
- Yu, W.R.; Liu, T.; Kiehl, T.R.; Fehlings, M.G. Human neuropathological and animal model evidence supporting a role for Fas-mediated apoptosis and inflammation in cervical spondylotic myelopathy. Brain 2011, 134, 1277–1292. [Google Scholar] [CrossRef]
- Hirai, T.; Uchida, K.; Nakajima, H.; Guerrero, A.R.; Takeura, N.; Watanabe, S.; Sugita, D.; Yoshida, A.; Johnson, W.E.; Baba, H. The prevalence and phenotype of activated microglia/macrophages within the spinal cord of the hyperostotic mouse (twy/twy) changes in response to chronic progressive spinal cord compression: Implications for human cervical compressive myelopathy. PLoS ONE 2013, 8, e64528. [Google Scholar] [CrossRef] [Green Version]
- Vidal, P.M.; Karadimas, S.K.; Ulndreaj, A.; Laliberte, A.M.; Tetreault, L.; Forner, S.; Wang, J.; Foltz, W.D.; Fehlings, M.G. Delayed decompression exacerbates ischemia-reperfusion injury in cervical compressive myelopathy. JCI Insight 2017, 2, e92512. [Google Scholar] [CrossRef] [PubMed]
- Romme Christensen, J.; Bornsen, L.; Ratzer, R.; Piehl, F.; Khademi, M.; Olsson, T.; Sorensen, P.S.; Sellebjerg, F. Systemic inflammation in progressive multiple sclerosis involves follicular T-helper, Th17- and activated B-cells and correlates with progression. PLoS ONE 2013, 8, e57820. [Google Scholar] [CrossRef] [PubMed]
- Chio, J.C.T.; Xu, K.J.; Popovich, P.; David, S.; Fehlings, M.G. Neuroimmunological therapies for treating spinal cord injury: Evidence and future perspectives. Exp. Neurol. 2021, 341, 113704. [Google Scholar] [CrossRef]
- Fehlings, M.G.; Badhiwala, J.H.; Ahn, H.; Farhadi, H.F.; Shaffrey, C.I.; Nassr, A.; Mummaneni, P.; Arnold, P.M.; Jacobs, W.B.; Riew, K.D.; et al. Safety and efficacy of riluzole in patients undergoing decompressive surgery for degenerative cervical myelopathy (CSM-Protect): A multicentre, double-blind, placebo-controlled, randomised, phase 3 trial. Lancet Neurol. 2021, 20, 98–106. [Google Scholar] [CrossRef]
- Vidal, P.M.; Ulndreaj, A.; Badner, A.; Hong, J.; Fehlings, M.G. Methylprednisolone treatment enhances early recovery following surgical decompression for degenerative cervical myelopathy without compromise to the systemic immune system. J. Neuroinflamm. 2018, 15, 222. [Google Scholar] [CrossRef] [PubMed]
- Schwab, J.M.; Zhang, Y.; Kopp, M.A.; Brommer, B.; Popovich, P.G. The paradox of chronic neuroinflammation, systemic immune suppression, autoimmunity after traumatic chronic spinal cord injury. Exp. Neurol. 2014, 258, 121–129. [Google Scholar] [CrossRef] [PubMed]
- Karadimas, S.K.; Moon, E.S.; Yu, W.R.; Satkunendrarajah, K.; Kallitsis, J.K.; Gatzounis, G.; Fehlings, M.G. A novel experimental model of cervical spondylotic myelopathy (CSM) to facilitate translational research. Neurobiol. Dis. 2013, 54, 43–58. [Google Scholar] [CrossRef]
- Karadimas, S.K.; Laliberte, A.M.; Tetreault, L.; Chung, Y.S.; Arnold, P.; Foltz, W.D.; Fehlings, M.G. Riluzole blocks perioperative ischemia-reperfusion injury and enhances postdecompression outcomes in cervical spondylotic myelopathy. Sci. Transl. Med. 2015, 7, 316ra194. [Google Scholar] [CrossRef]
- Desimone, A.; Hong, J.; Brockie, S.T.; Yu, W.; Laliberte, A.M.; Fehlings, M.G. The influence of ApoE4 on the clinical outcomes and pathophysiology of degenerative cervical myelopathy. JCI Insight 2021, 6, e149227. [Google Scholar] [CrossRef]
- Kohl, B.A.; Deutschman, C.S. The inflammatory response to surgery and trauma. Curr. Opin. Crit. Care 2006, 12, 325–332. [Google Scholar] [CrossRef]
- Gaudilliere, B.; Fragiadakis, G.K.; Bruggner, R.V.; Nicolau, M.; Finck, R.; Tingle, M.; Silva, J.; Ganio, E.A.; Yeh, C.G.; Maloney, W.J.; et al. Clinical recovery from surgery correlates with single-cell immune signatures. Sci. Transl. Med. 2014, 6, 255ra131. [Google Scholar] [CrossRef] [PubMed]
- Vidal, P.M.; Ulndreaj, A.; Tetreault, L.; Hong, J.; Fehlings, M.G. The changes in systemic monocytes in humans undergoing surgical decompression for degenerative cervical myelopathy may influence clinical neurological recovery. J. Neuroimmunol. 2019, 336, 577024. [Google Scholar] [CrossRef] [PubMed]
- Haeusler, K.G.; Schmidt, W.U.; Fohring, F.; Meisel, C.; Helms, T.; Jungehulsing, G.J.; Nolte, C.H.; Schmolke, K.; Wegner, B.; Meisel, A.; et al. Cellular immunodepression preceding infectious complications after acute ischemic stroke in humans. Cereb. Dis. 2008, 25, 50–58. [Google Scholar] [CrossRef] [PubMed]
- Prass, K.; Meisel, C.; Hoflich, C.; Braun, J.; Halle, E.; Wolf, T.; Ruscher, K.; Victorov, I.V.; Priller, J.; Dirnagl, U.; et al. Stroke-induced immunodeficiency promotes spontaneous bacterial infections and is mediated by sympathetic activation reversal by poststroke T helper cell type 1-like immunostimulation. J. Exp. Med. 2003, 198, 725–736. [Google Scholar] [CrossRef]
- Riegger, T.; Conrad, S.; Schluesener, H.J.; Kaps, H.P.; Badke, A.; Baron, C.; Gerstein, J.; Dietz, K.; Abdizahdeh, M.; Schwab, J.M. Immune depression syndrome following human spinal cord injury (SCI): A pilot study. Neuroscience 2009, 158, 1194–1199. [Google Scholar] [CrossRef] [PubMed]
- Meisel, C.; Schwab, J.M.; Prass, K.; Meisel, A.; Dirnagl, U. Central nervous system injury-induced immune deficiency syndrome. Nat. Rev. Neurosci. 2005, 6, 775–786. [Google Scholar] [CrossRef]
- Slade, M.S.; Simmons, R.L.; Yunis, E.; Greenberg, L.J. Immunodepression after major surgery in normal patients. Surgery 1975, 78, 363–372. [Google Scholar]
- Furlan, J.C.; Krassioukov, A.V.; Fehlings, M.G. Hematologic abnormalities within the first week after acute isolated traumatic cervical spinal cord injury: A case-control cohort study. Spine 2006, 31, 2674–2683. [Google Scholar] [CrossRef]
- Pavlicek, D.; Krebs, J.; Capossela, S.; Bertolo, A.; Engelhardt, B.; Pannek, J.; Stoyanov, J. Immunosenescence in persons with spinal cord injury in relation to urinary tract infections -a cross-sectional study. Immun. Ageing 2017, 14, 22. [Google Scholar] [CrossRef]
- Broux, B.; Markovic-Plese, S.; Stinissen, P.; Hellings, N. Pathogenic features of CD4+CD28− T cells in immune disorders. Trends Mol. Med. 2012, 18, 446–453. [Google Scholar] [CrossRef]
- Bronge, M.; Hogelin, K.A.; Thomas, O.G.; Ruhrmann, S.; Carvalho-Queiroz, C.; Nilsson, O.B.; Kaiser, A.; Zeitelhofer, M.; Holmgren, E.; Linnerbauer, M.; et al. Identification of four novel T cell autoantigens and personal autoreactive profiles in multiple sclerosis. Sci. Adv. 2022, 8, eabn1823. [Google Scholar] [CrossRef] [PubMed]
- Du, S.; Sun, Y.; Zhao, B. Interleukin-6 Serum Levels Are Elevated in Individuals with Degenerative Cervical Myelopathy and Are Correlated with Symptom Severity. Med. Sci. Monit. 2018, 24, 7405–7413. [Google Scholar] [CrossRef] [PubMed]
- Lages, C.S.; Suffia, I.; Velilla, P.A.; Huang, B.; Warshaw, G.; Hildeman, D.A.; Belkaid, Y.; Chougnet, C. Functional regulatory T cells accumulate in aged hosts and promote chronic infectious disease reactivation. J. Immunol. 2008, 181, 1835–1848. [Google Scholar] [CrossRef]
- Raynor, J.; Sholl, A.; Plas, D.R.; Bouillet, P.; Chougnet, C.A.; Hildeman, D.A. IL-15 Fosters Age-Driven Regulatory T Cell Accrual in the Face of Declining IL-2 Levels. Front. Immunol. 2013, 4, 161. [Google Scholar] [CrossRef]
- Almanan, M.A.; Raynor, J.; Chougnet, C.; Salamonis, N.; Amarachintha, S.; Steinbrecher, K.; Hildeman, D.A. Type 1 regulatory T cells (Tr1) homeostasis and function in aging. J. Immunol. 2017, 198, 154.10. [Google Scholar]
- Yonkers, N.L.; Sieg, S.; Rodriguez, B.; Anthony, D.D. Reduced naive CD4 T cell numbers and impaired induction of CD27 in response to T cell receptor stimulation reflect a state of immune activation in chronic hepatitis C virus infection. J. Infect. Dis. 2011, 203, 635–645. [Google Scholar] [CrossRef]
- Haas, J.; Fritzsching, B.; Trubswetter, P.; Korporal, M.; Milkova, L.; Fritz, B.; Vobis, D.; Krammer, P.H.; Suri-Payer, E.; Wildemann, B. Prevalence of newly generated naive regulatory T cells (Treg) is critical for Treg suppressive function and determines Treg dysfunction in multiple sclerosis. J. Immunol. 2007, 179, 1322–1330. [Google Scholar] [CrossRef]
- Kohler, S.; Thiel, A. Life after the thymus: CD31+ and CD31− human naive CD4+ T-cell subsets. Blood 2009, 113, 769–774. [Google Scholar] [CrossRef] [PubMed]
- Hem, A.; Smith, A.J.; Solberg, P. Saphenous vein puncture for blood sampling of the mouse, rat, hamster, gerbil, guinea pig, ferret and mink. Lab. Anim. 1998, 32, 364–368. [Google Scholar] [CrossRef]
- Ulndreaj, A.; Tzekou, A.; Mothe, A.J.; Siddiqui, A.M.; Dragas, R.; Tator, C.H.; Torlakovic, E.E.; Fehlings, M.G. Characterization of the Antibody Response After Cervical Spinal Cord Injury. J. Neurotrauma 2016, 34, 1209–1226. [Google Scholar] [CrossRef]
- Parasuraman, S.; Raveendran, R.; Kesavan, R. Blood sample collection in small laboratory animals. J. Pharm. Pharm. 2010, 1, 87–93. [Google Scholar]
- Farr, T.D.; Liu, L.; Colwell, K.L.; Whishaw, I.Q.; Metz, G.A. Bilateral alteration in stepping pattern after unilateral motor cortex injury: A new test strategy for analysis of skilled limb movements in neurological mouse models. J. Neurosci. Methods 2006, 153, 104–113. [Google Scholar] [CrossRef] [PubMed]


Publisher’s Note: MDPI stays neutral with regard to jurisdictional claims in published maps and institutional affiliations. |
© 2022 by the authors. Licensee MDPI, Basel, Switzerland. This article is an open access article distributed under the terms and conditions of the Creative Commons Attribution (CC BY) license (https://creativecommons.org/licenses/by/4.0/).
Share and Cite
Ulndreaj, A.; Ávila, A.; Hong, J.; Zhou, C.; Fehlings, M.G.; Vidal, P.M. Acute Systemic White Blood Cell Changes following Degenerative Cervical Myelopathy (DCM) in a Mouse Model. Int. J. Mol. Sci. 2022, 23, 11496. https://doi.org/10.3390/ijms231911496
Ulndreaj A, Ávila A, Hong J, Zhou C, Fehlings MG, Vidal PM. Acute Systemic White Blood Cell Changes following Degenerative Cervical Myelopathy (DCM) in a Mouse Model. International Journal of Molecular Sciences. 2022; 23(19):11496. https://doi.org/10.3390/ijms231911496
Chicago/Turabian StyleUlndreaj, Antigona, Ariel Ávila, James Hong, Cindy Zhou, Michael G. Fehlings, and Pia M. Vidal. 2022. "Acute Systemic White Blood Cell Changes following Degenerative Cervical Myelopathy (DCM) in a Mouse Model" International Journal of Molecular Sciences 23, no. 19: 11496. https://doi.org/10.3390/ijms231911496