
Role of the WNT/β-catenin/ZKSCAN3 Pathway in Regulating Chromosomal Instability in Colon Cancer Cell lines and Tissues

 , , and
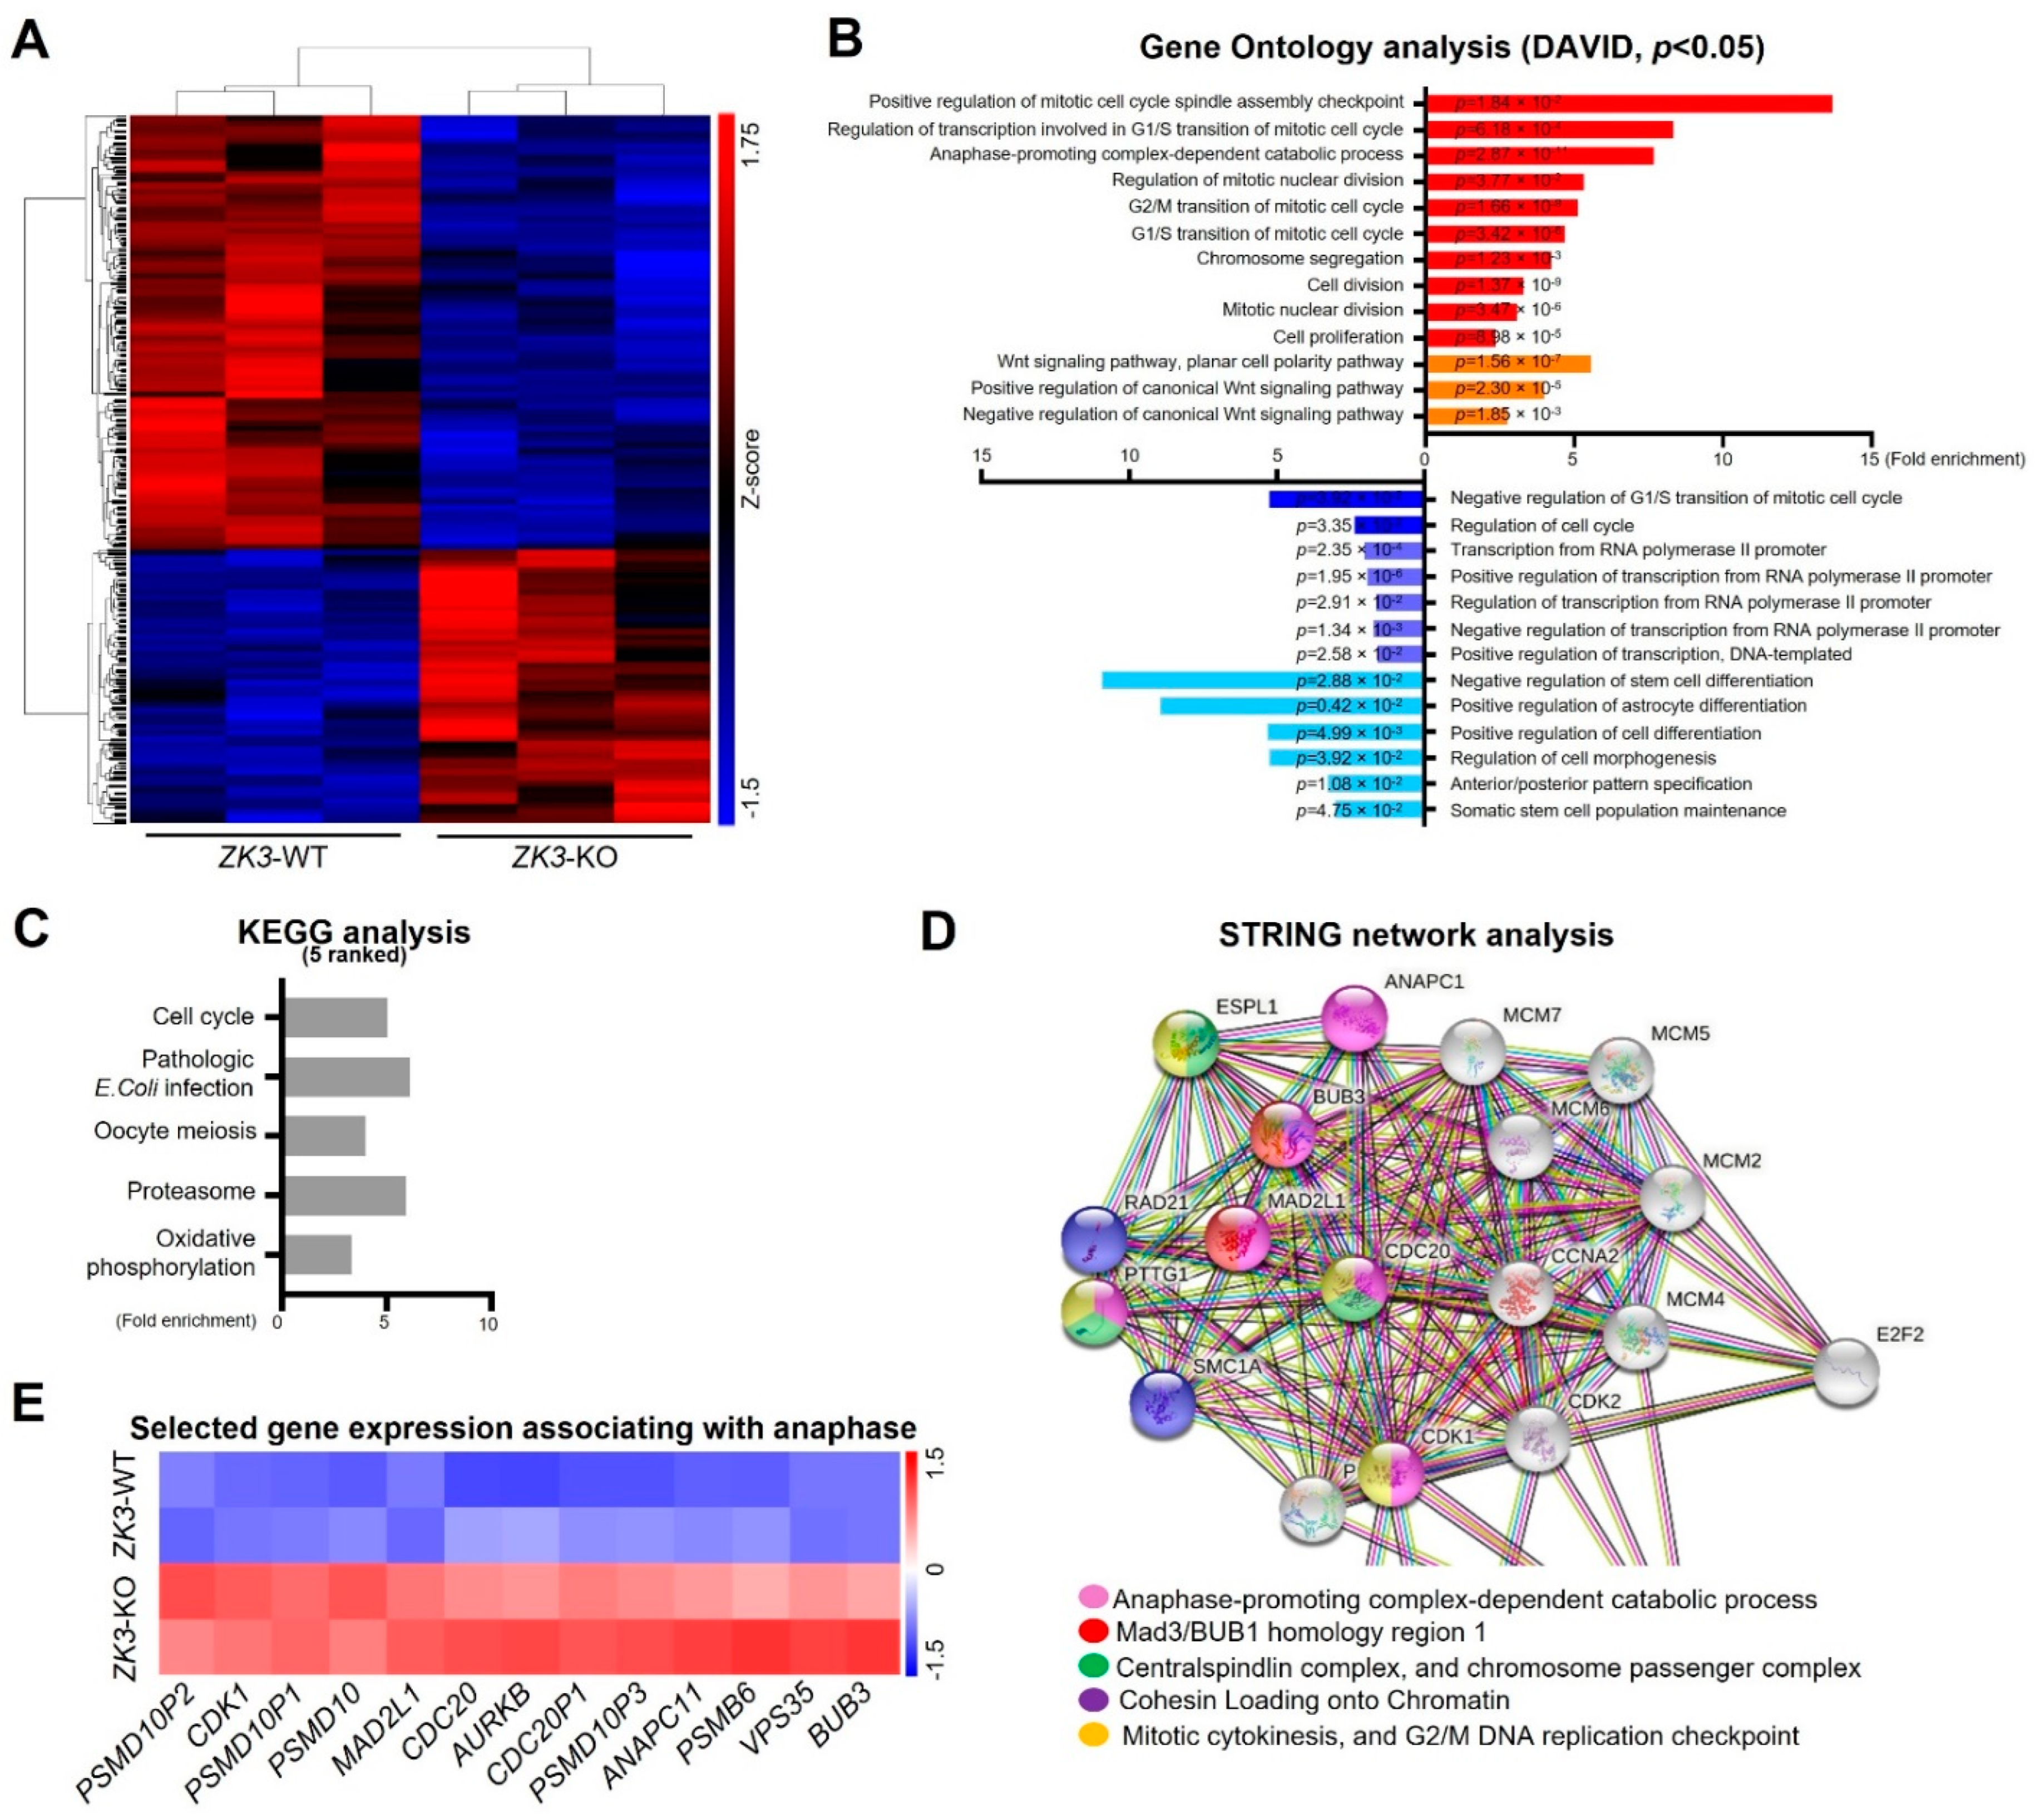
Abstract
:1. Introduction
2. Results
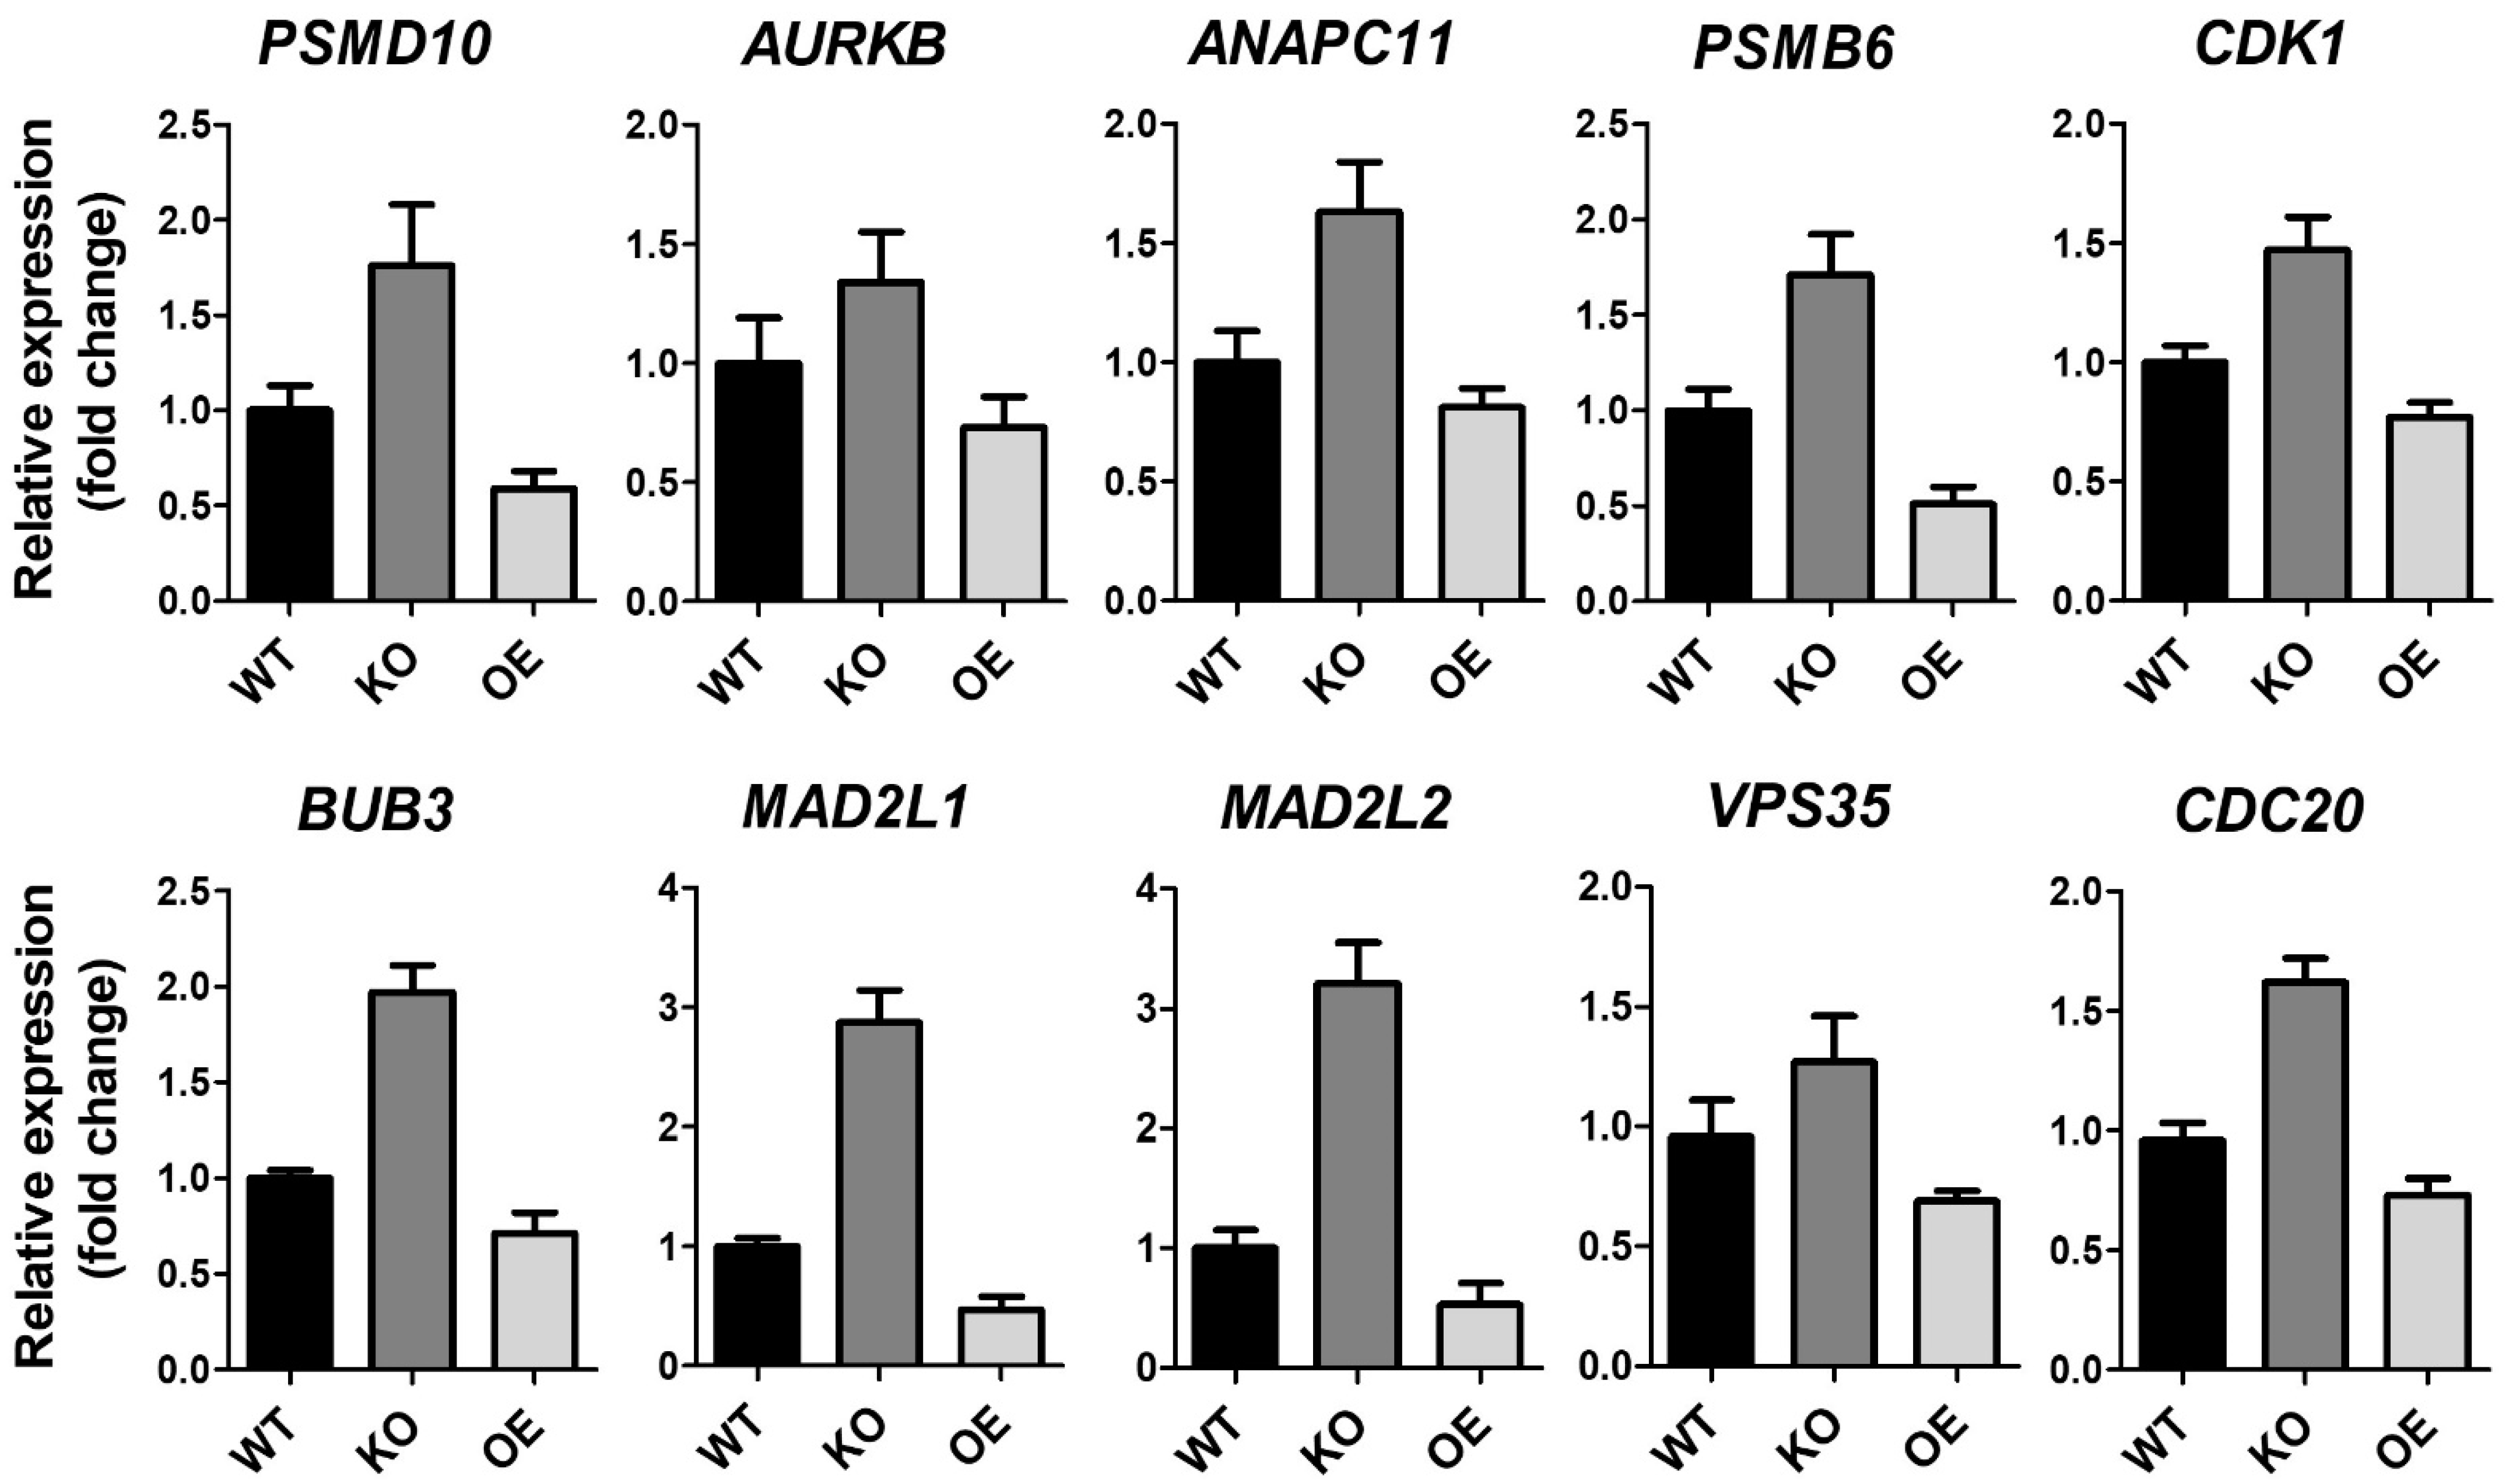
2.1. Identification of the ZKSCAN3 Target Gene Pathway through Transcriptome Analysis
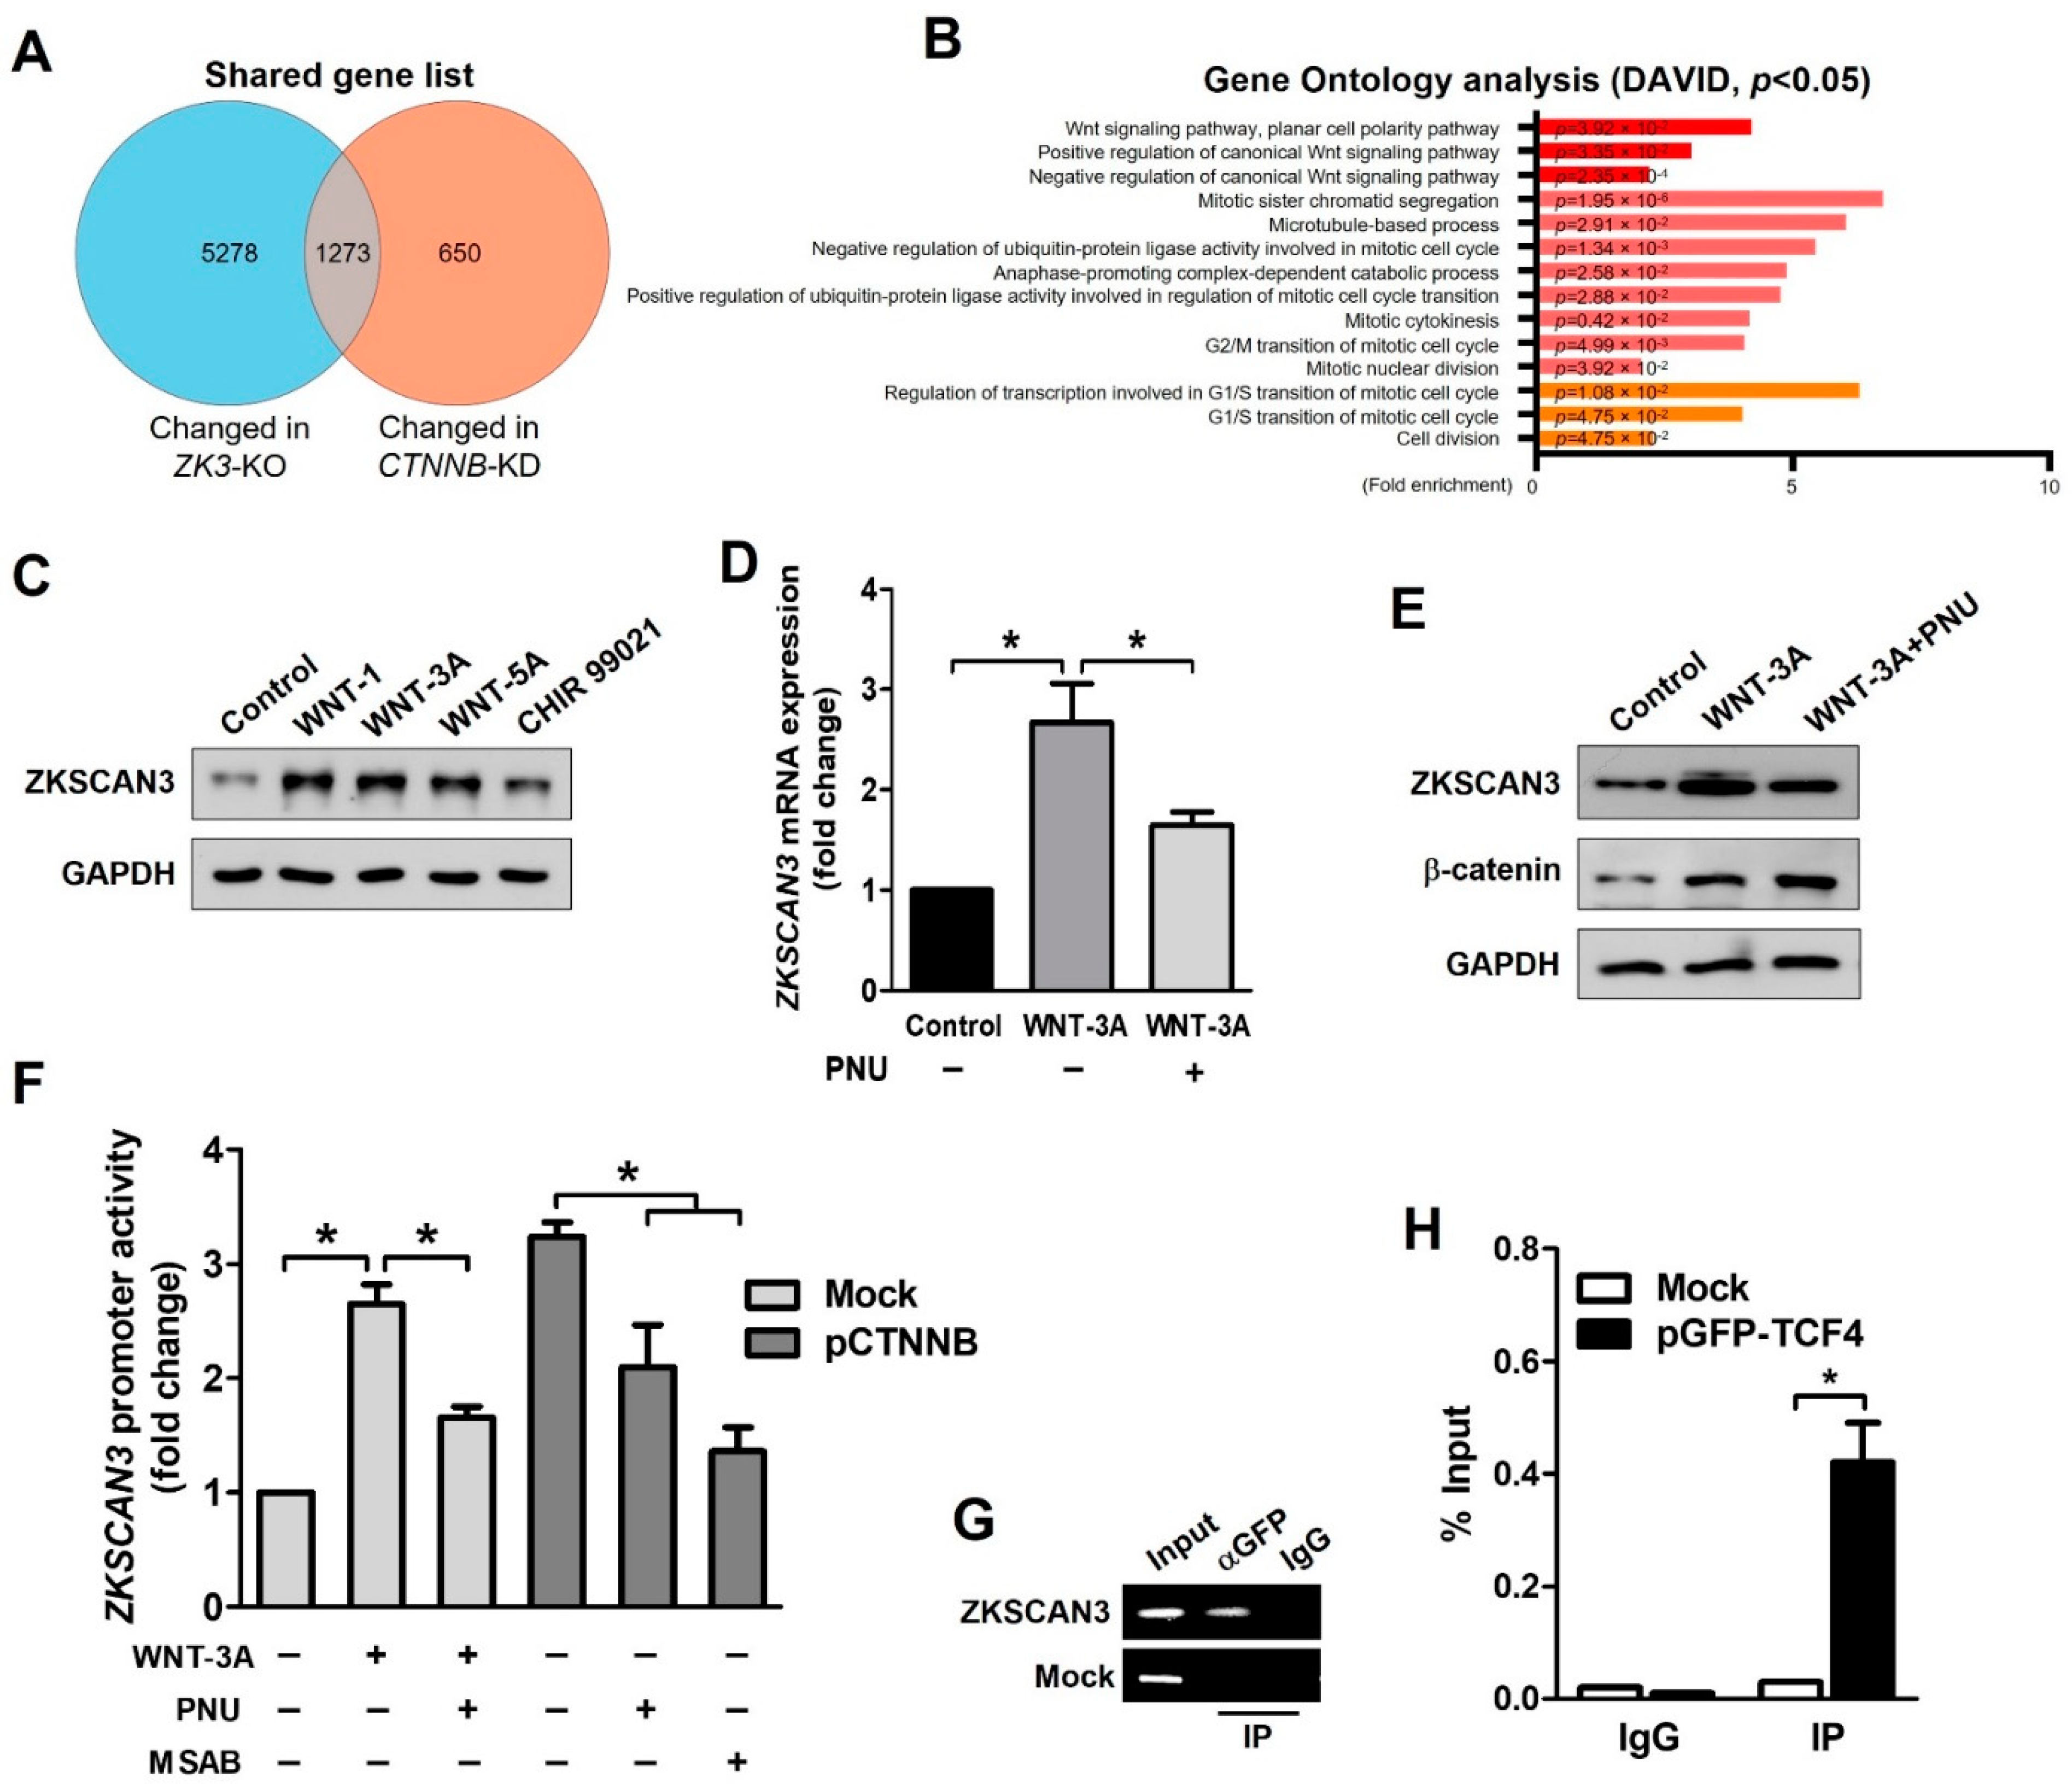
2.2. Activation of the WNT Pathway Induces ZKSCAN3 Upregulation
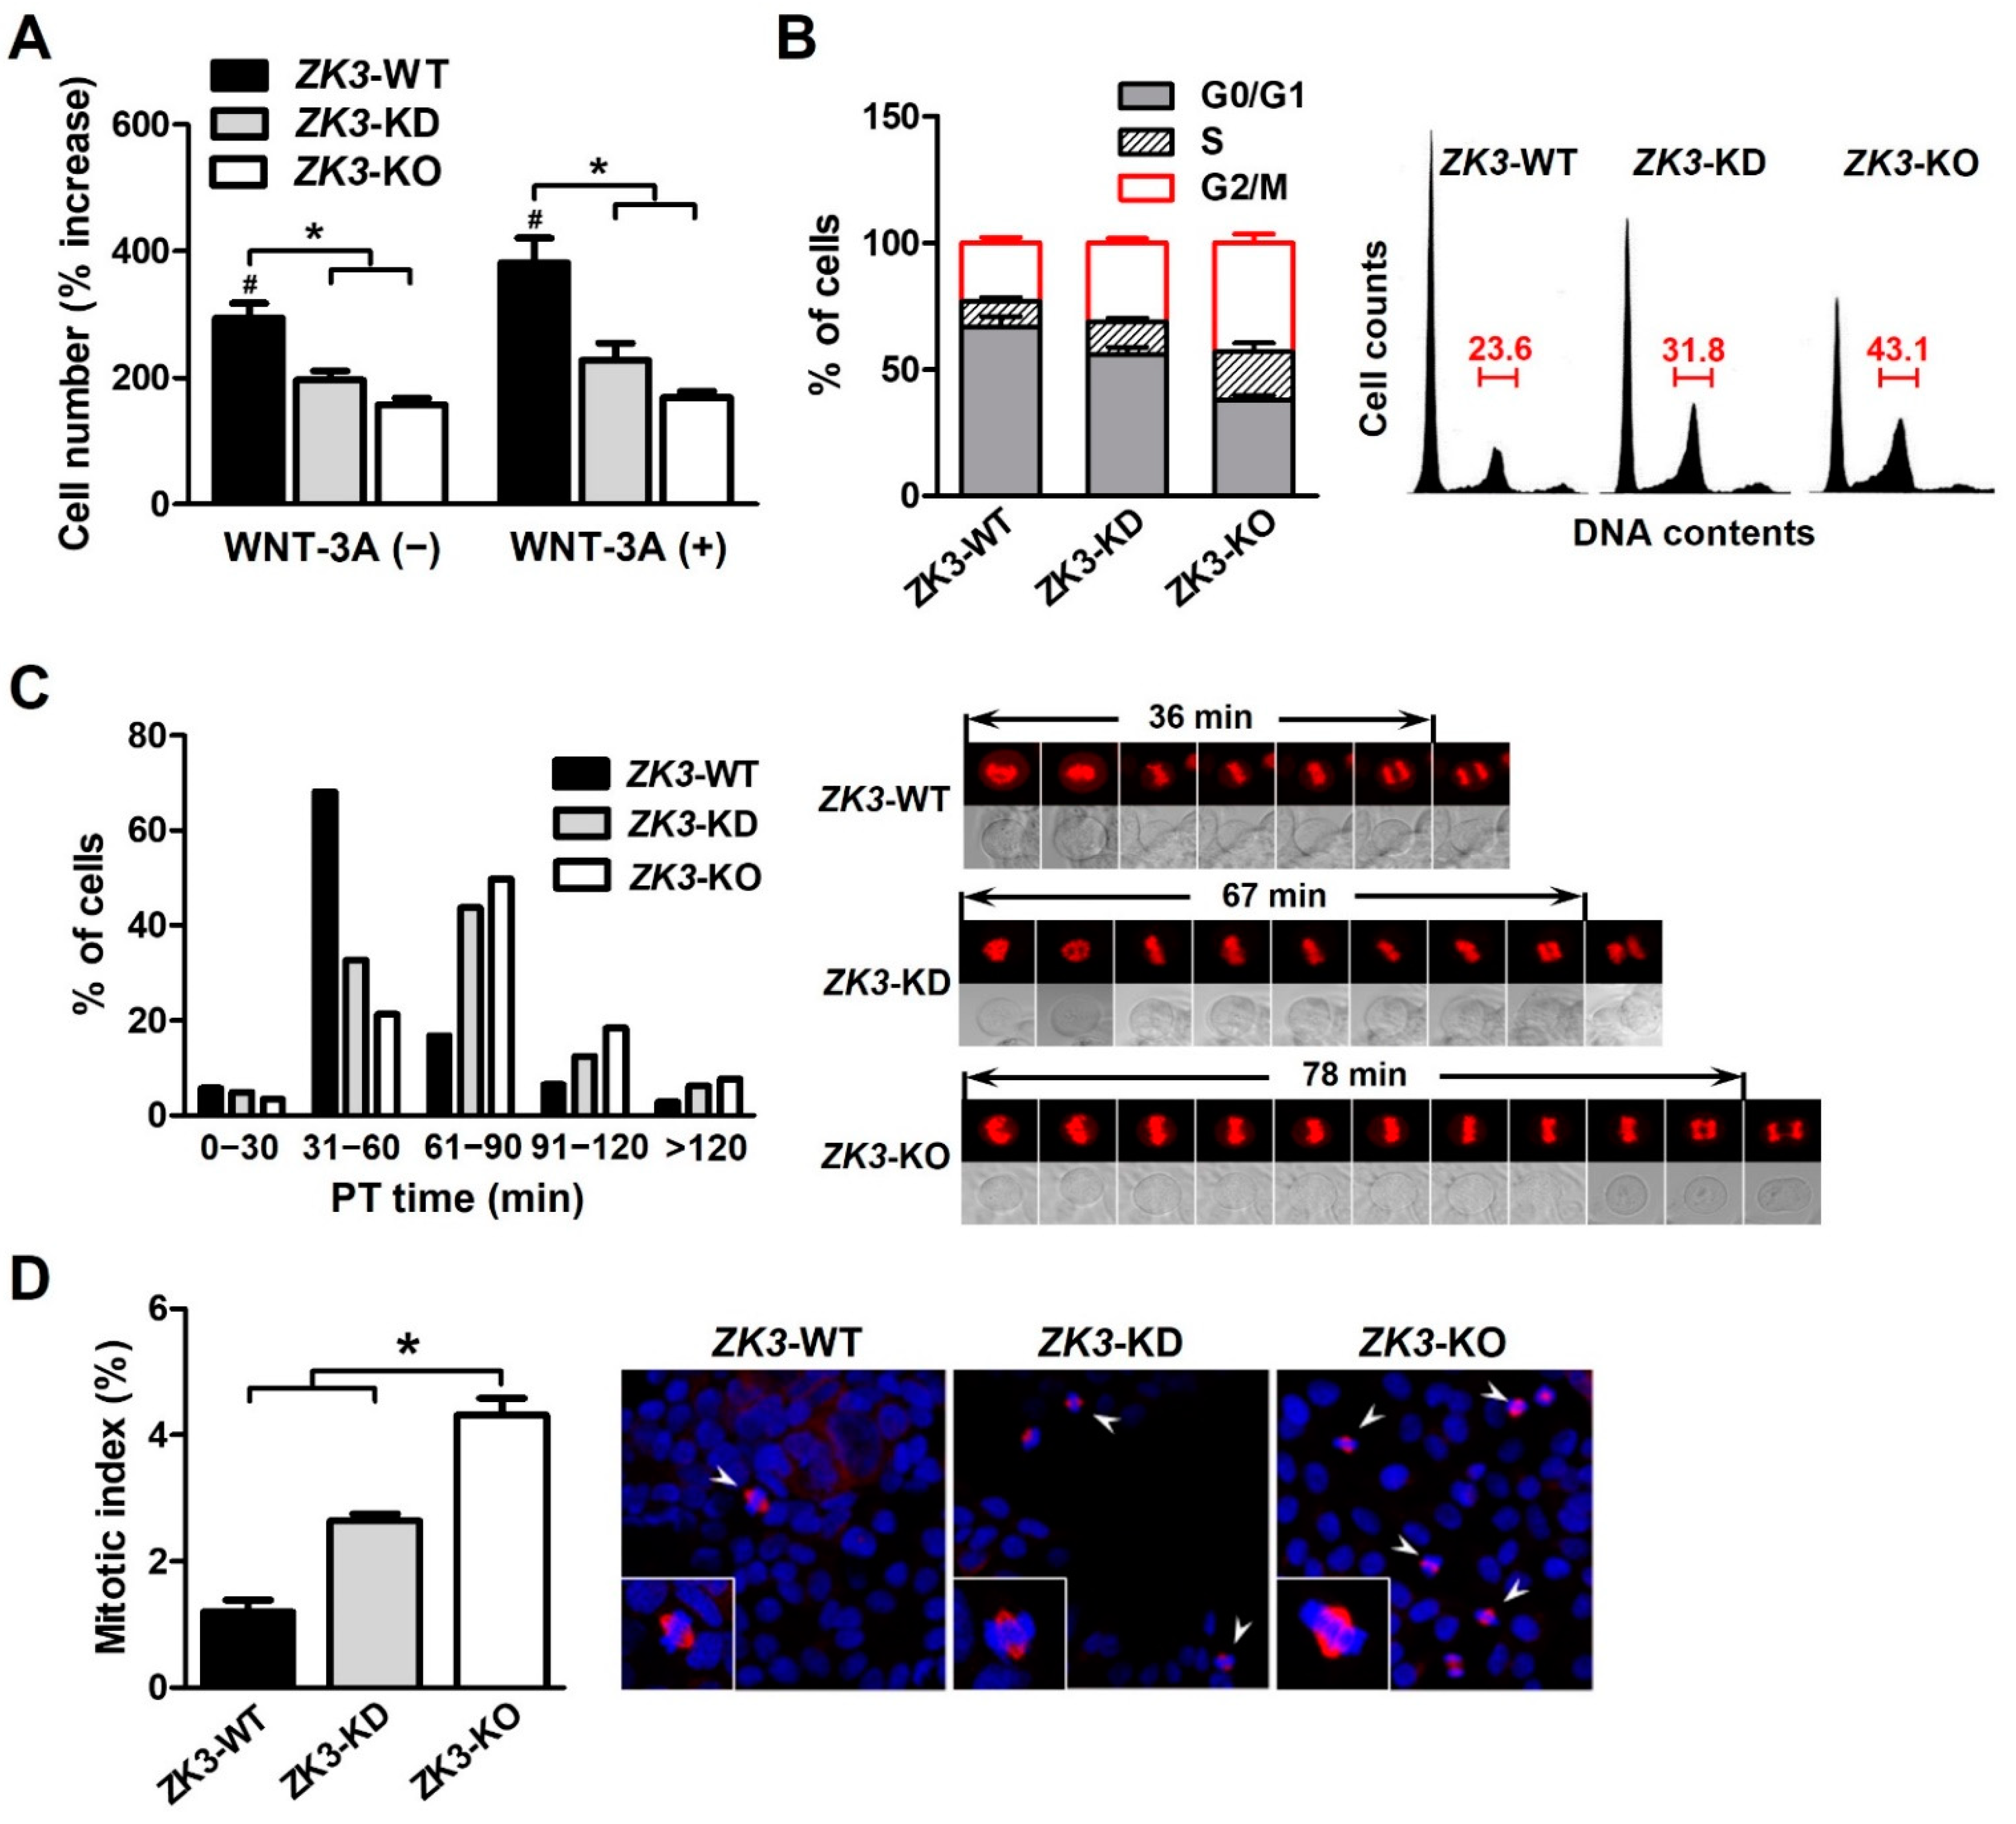
2.3. ZKSCAN3 Deficiency Delays Mitosis Progression
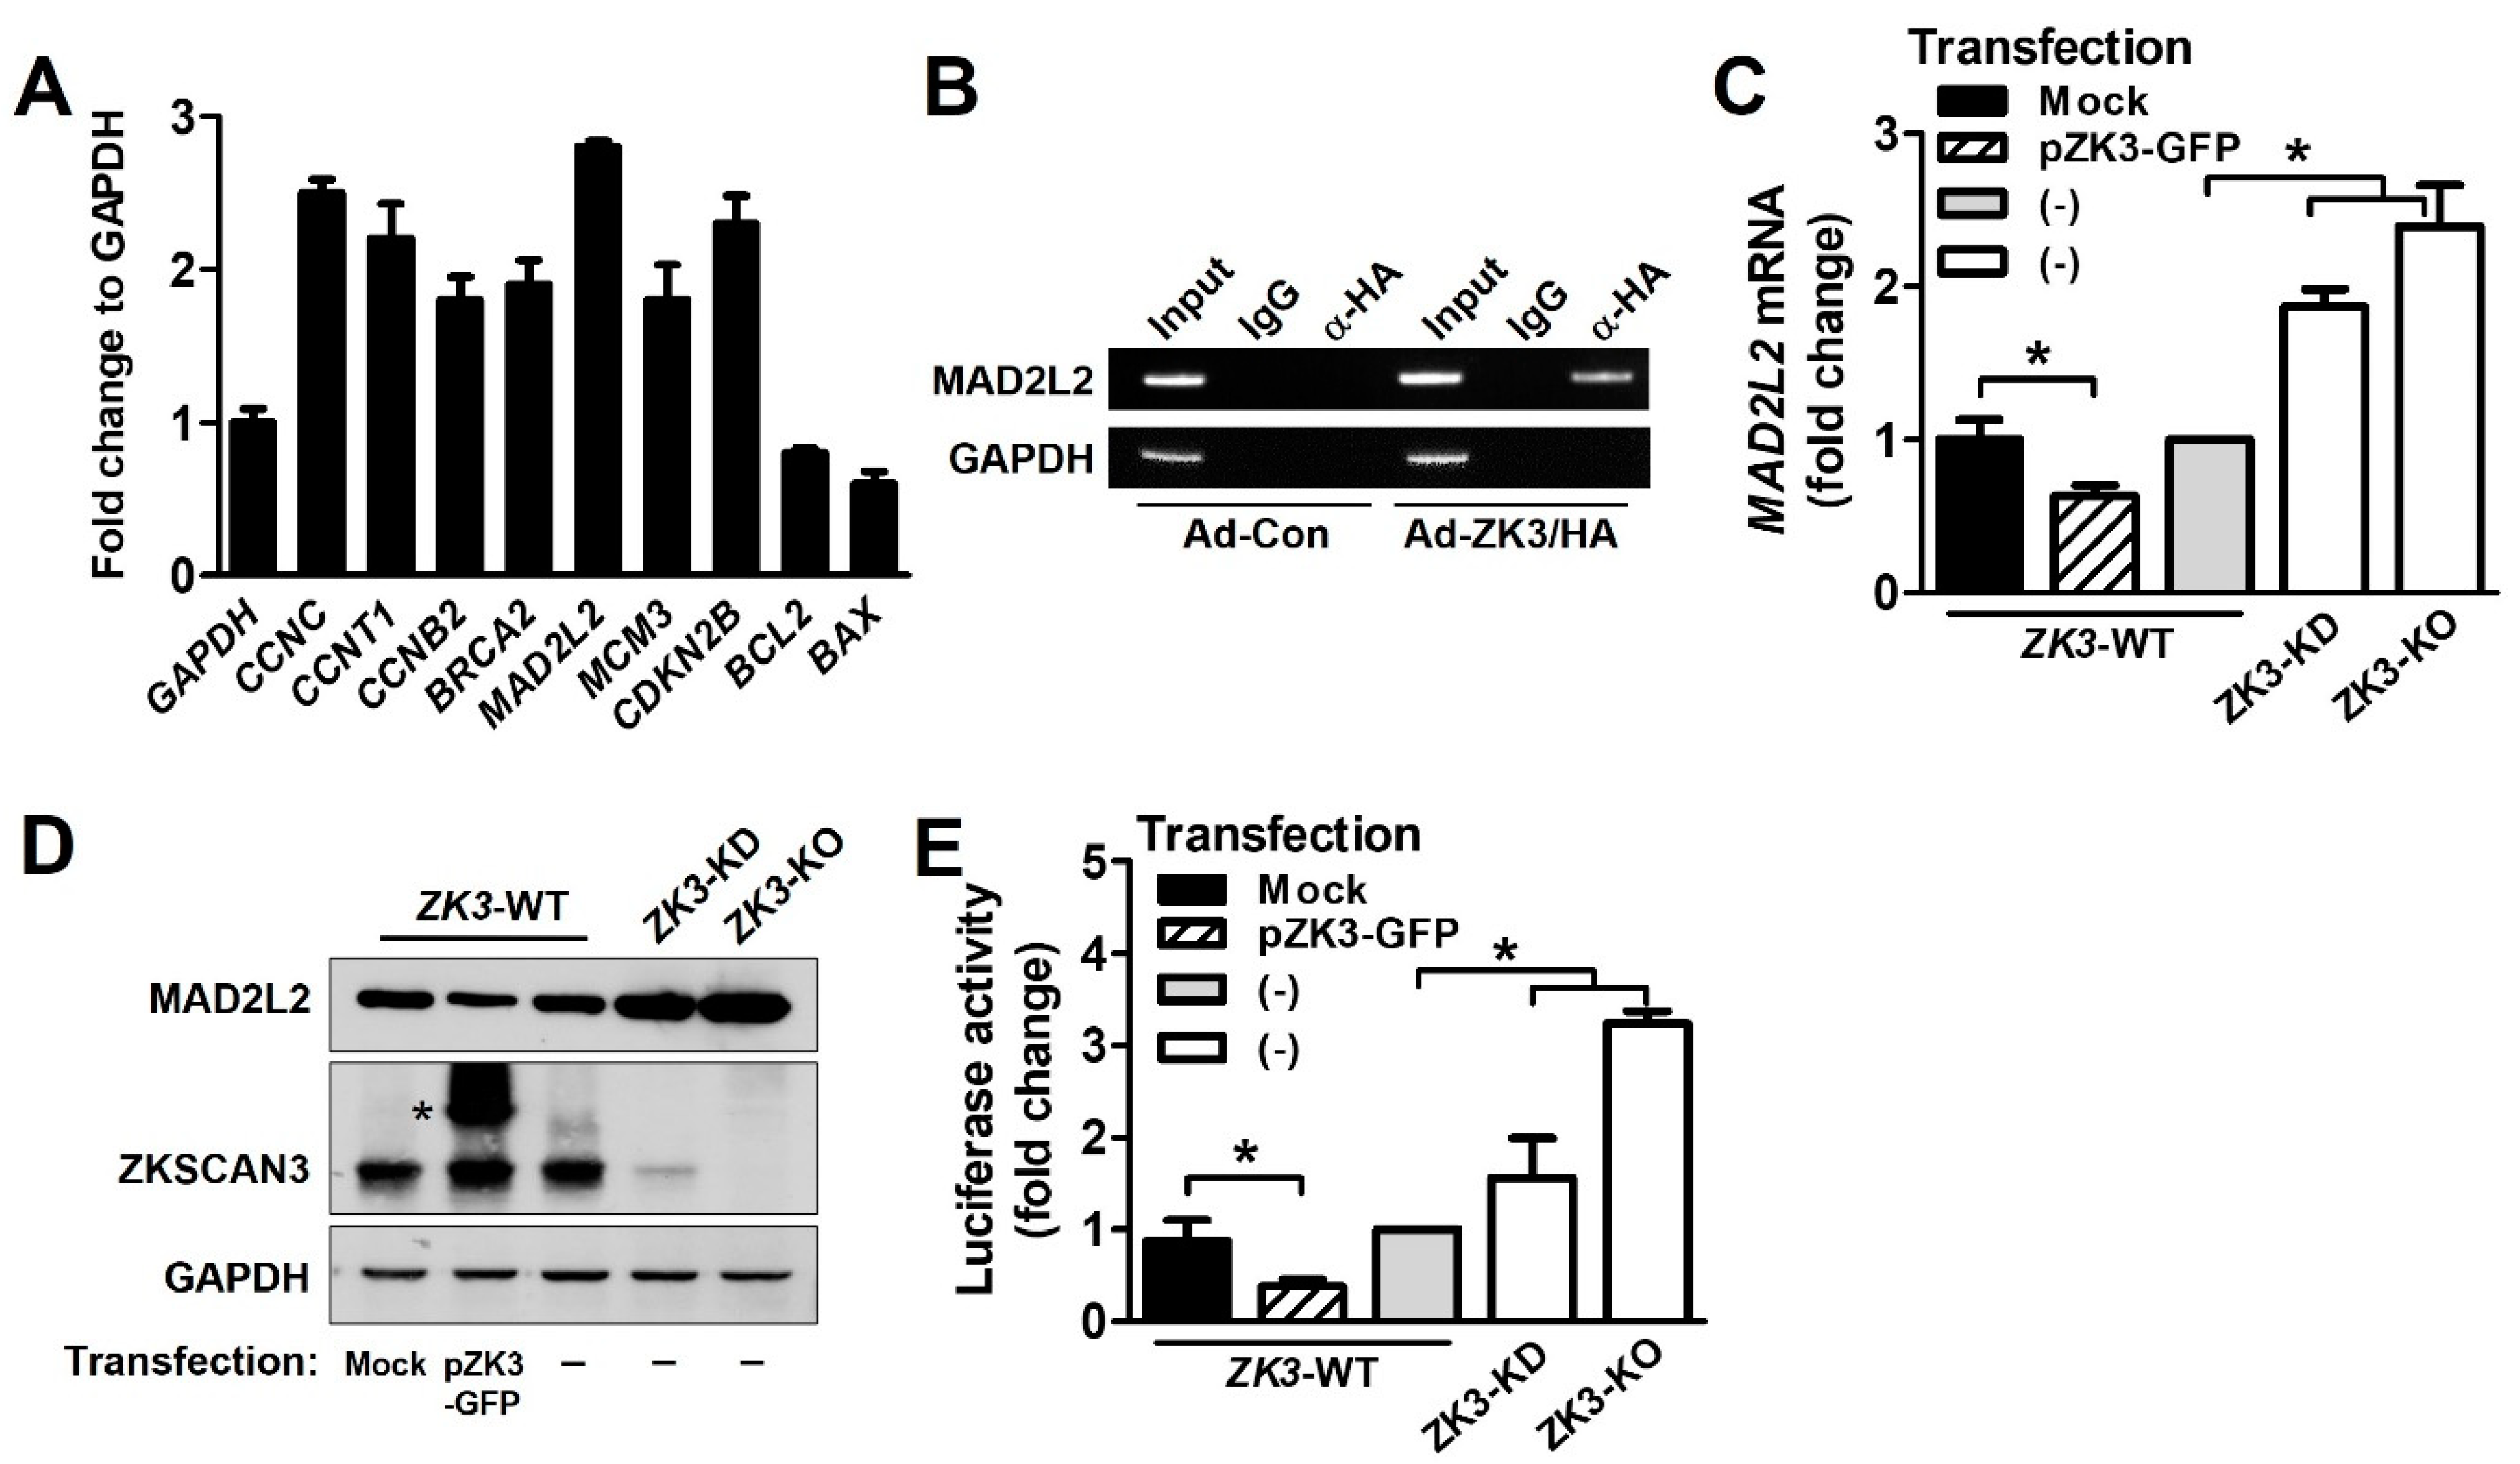
2.4. ZKSCAN3 Acts as a Transcriptional Repressor of Spindle Checkpoint Protein MAD2L2
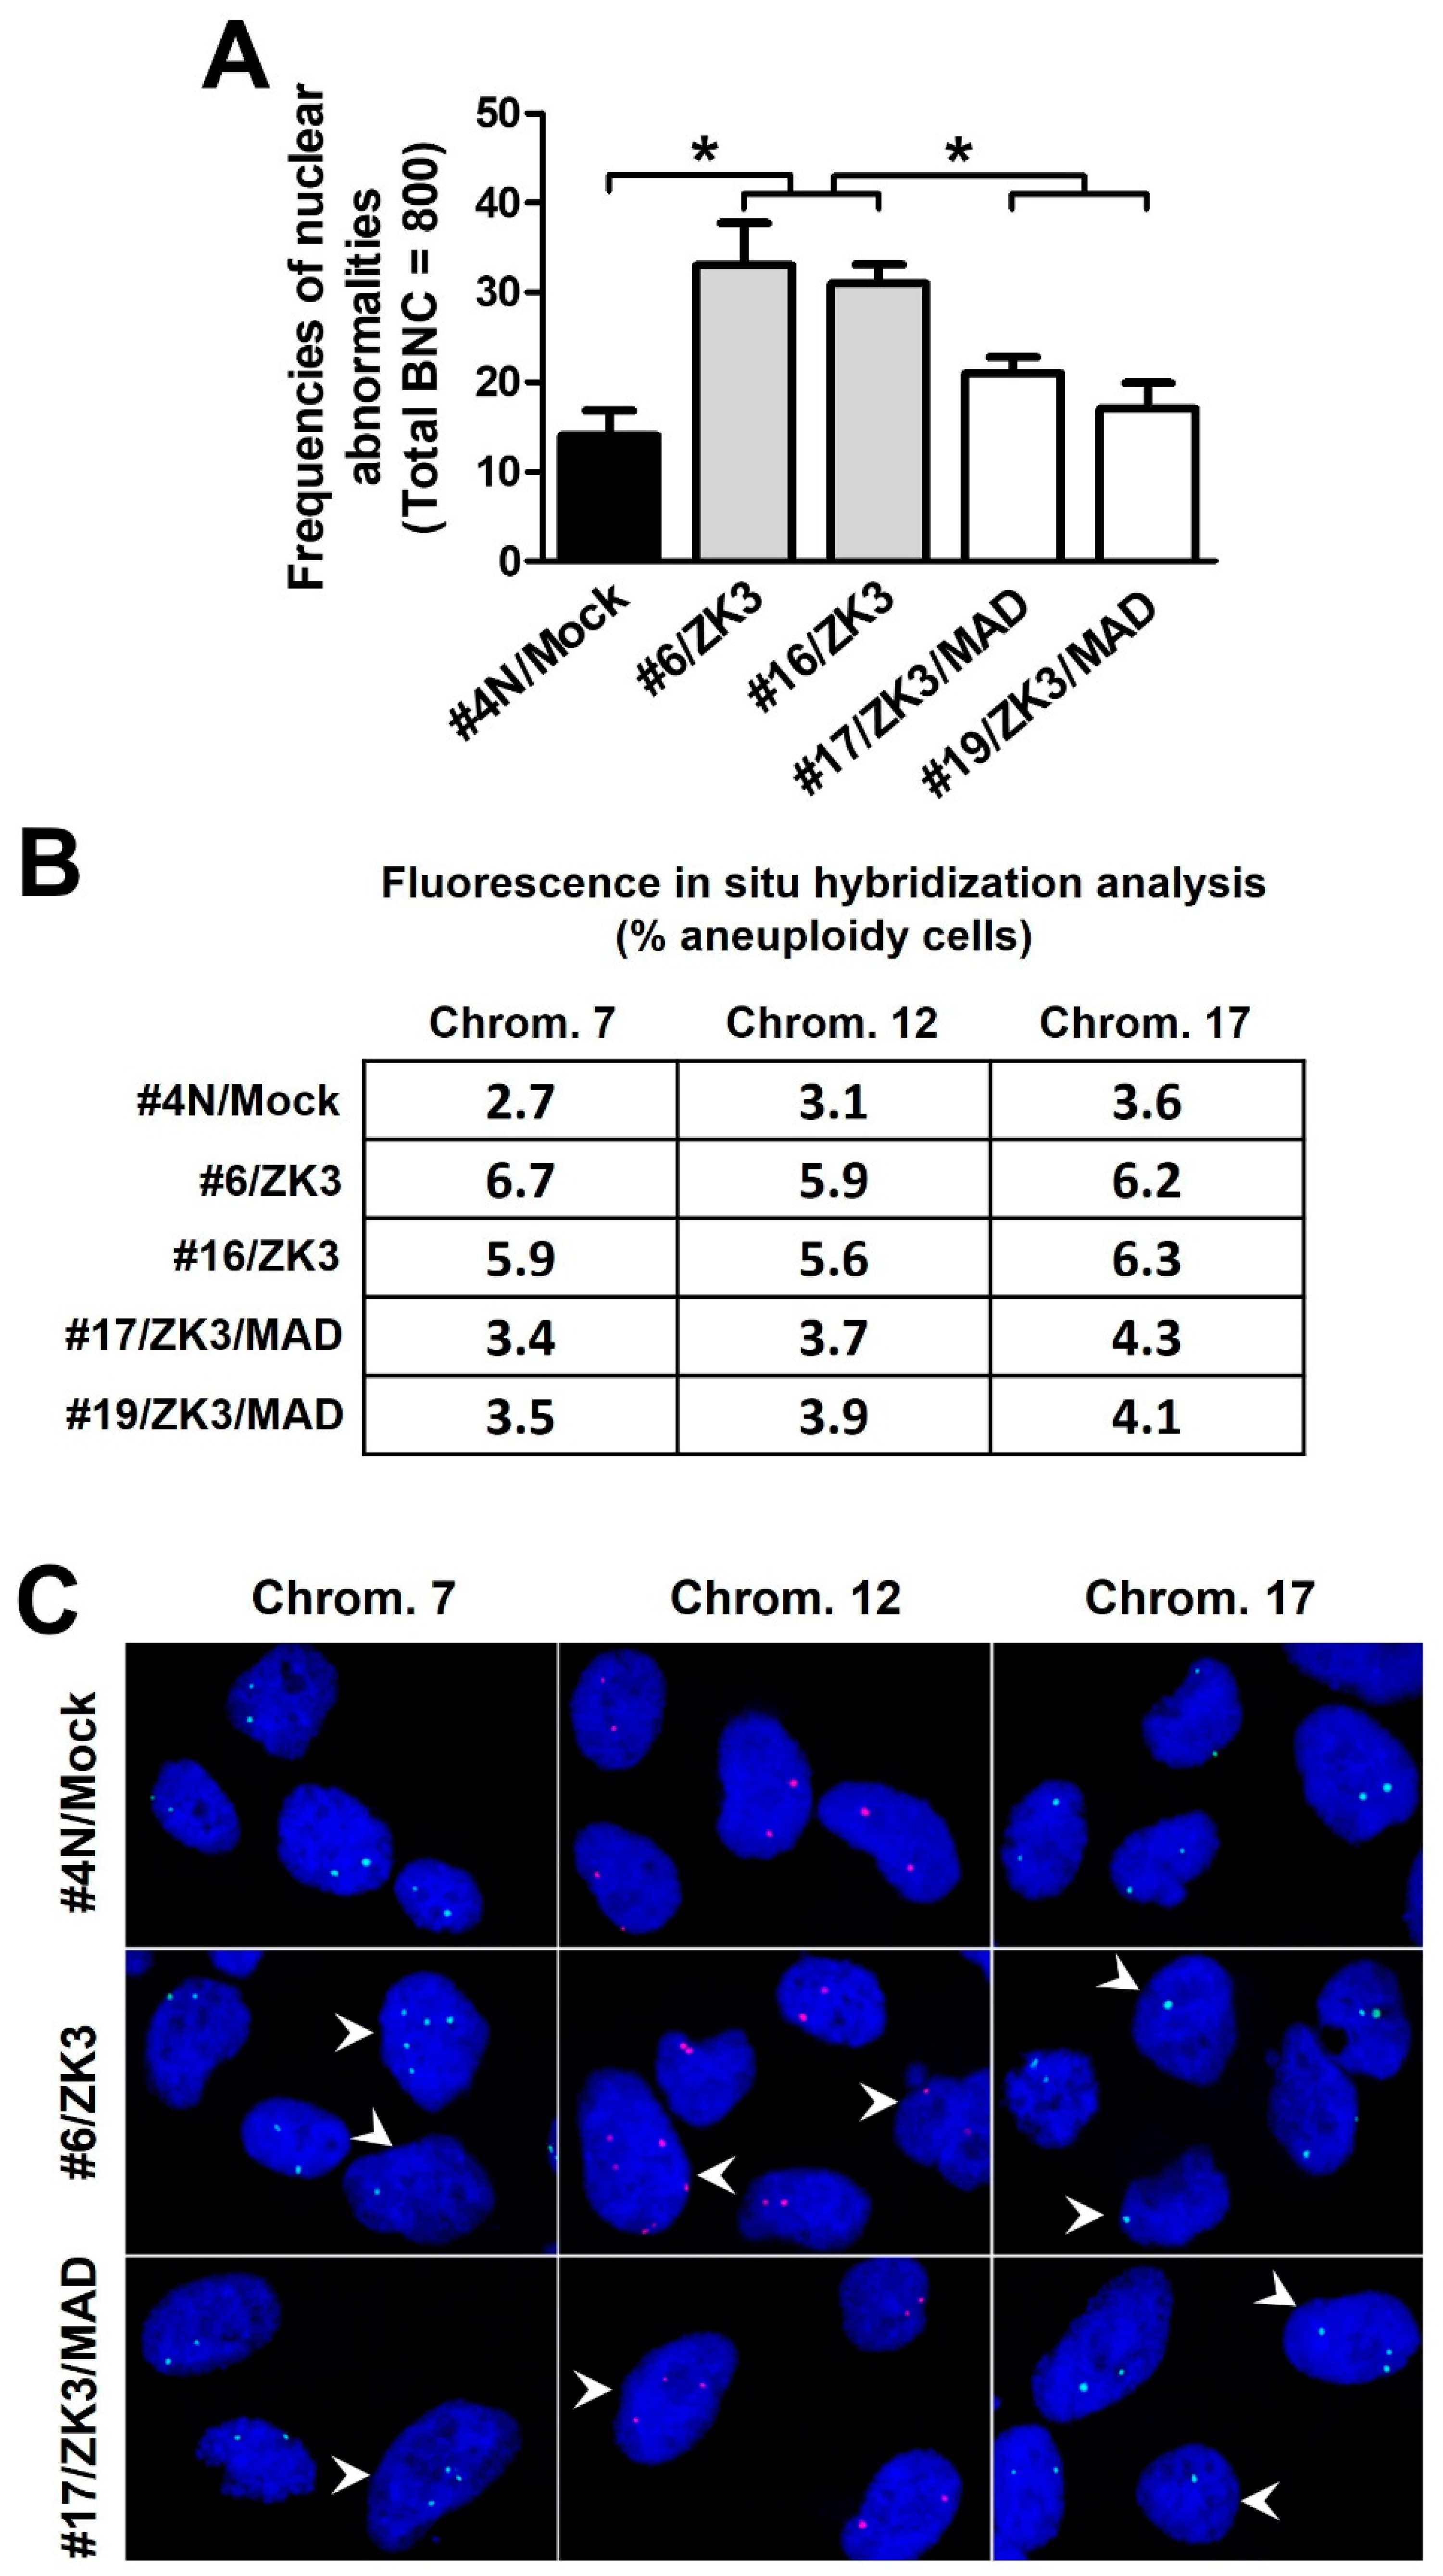
2.5. Upregulation of ZKSCAN3 Induces Chromosomal Instability by Suppressing MAD2L2
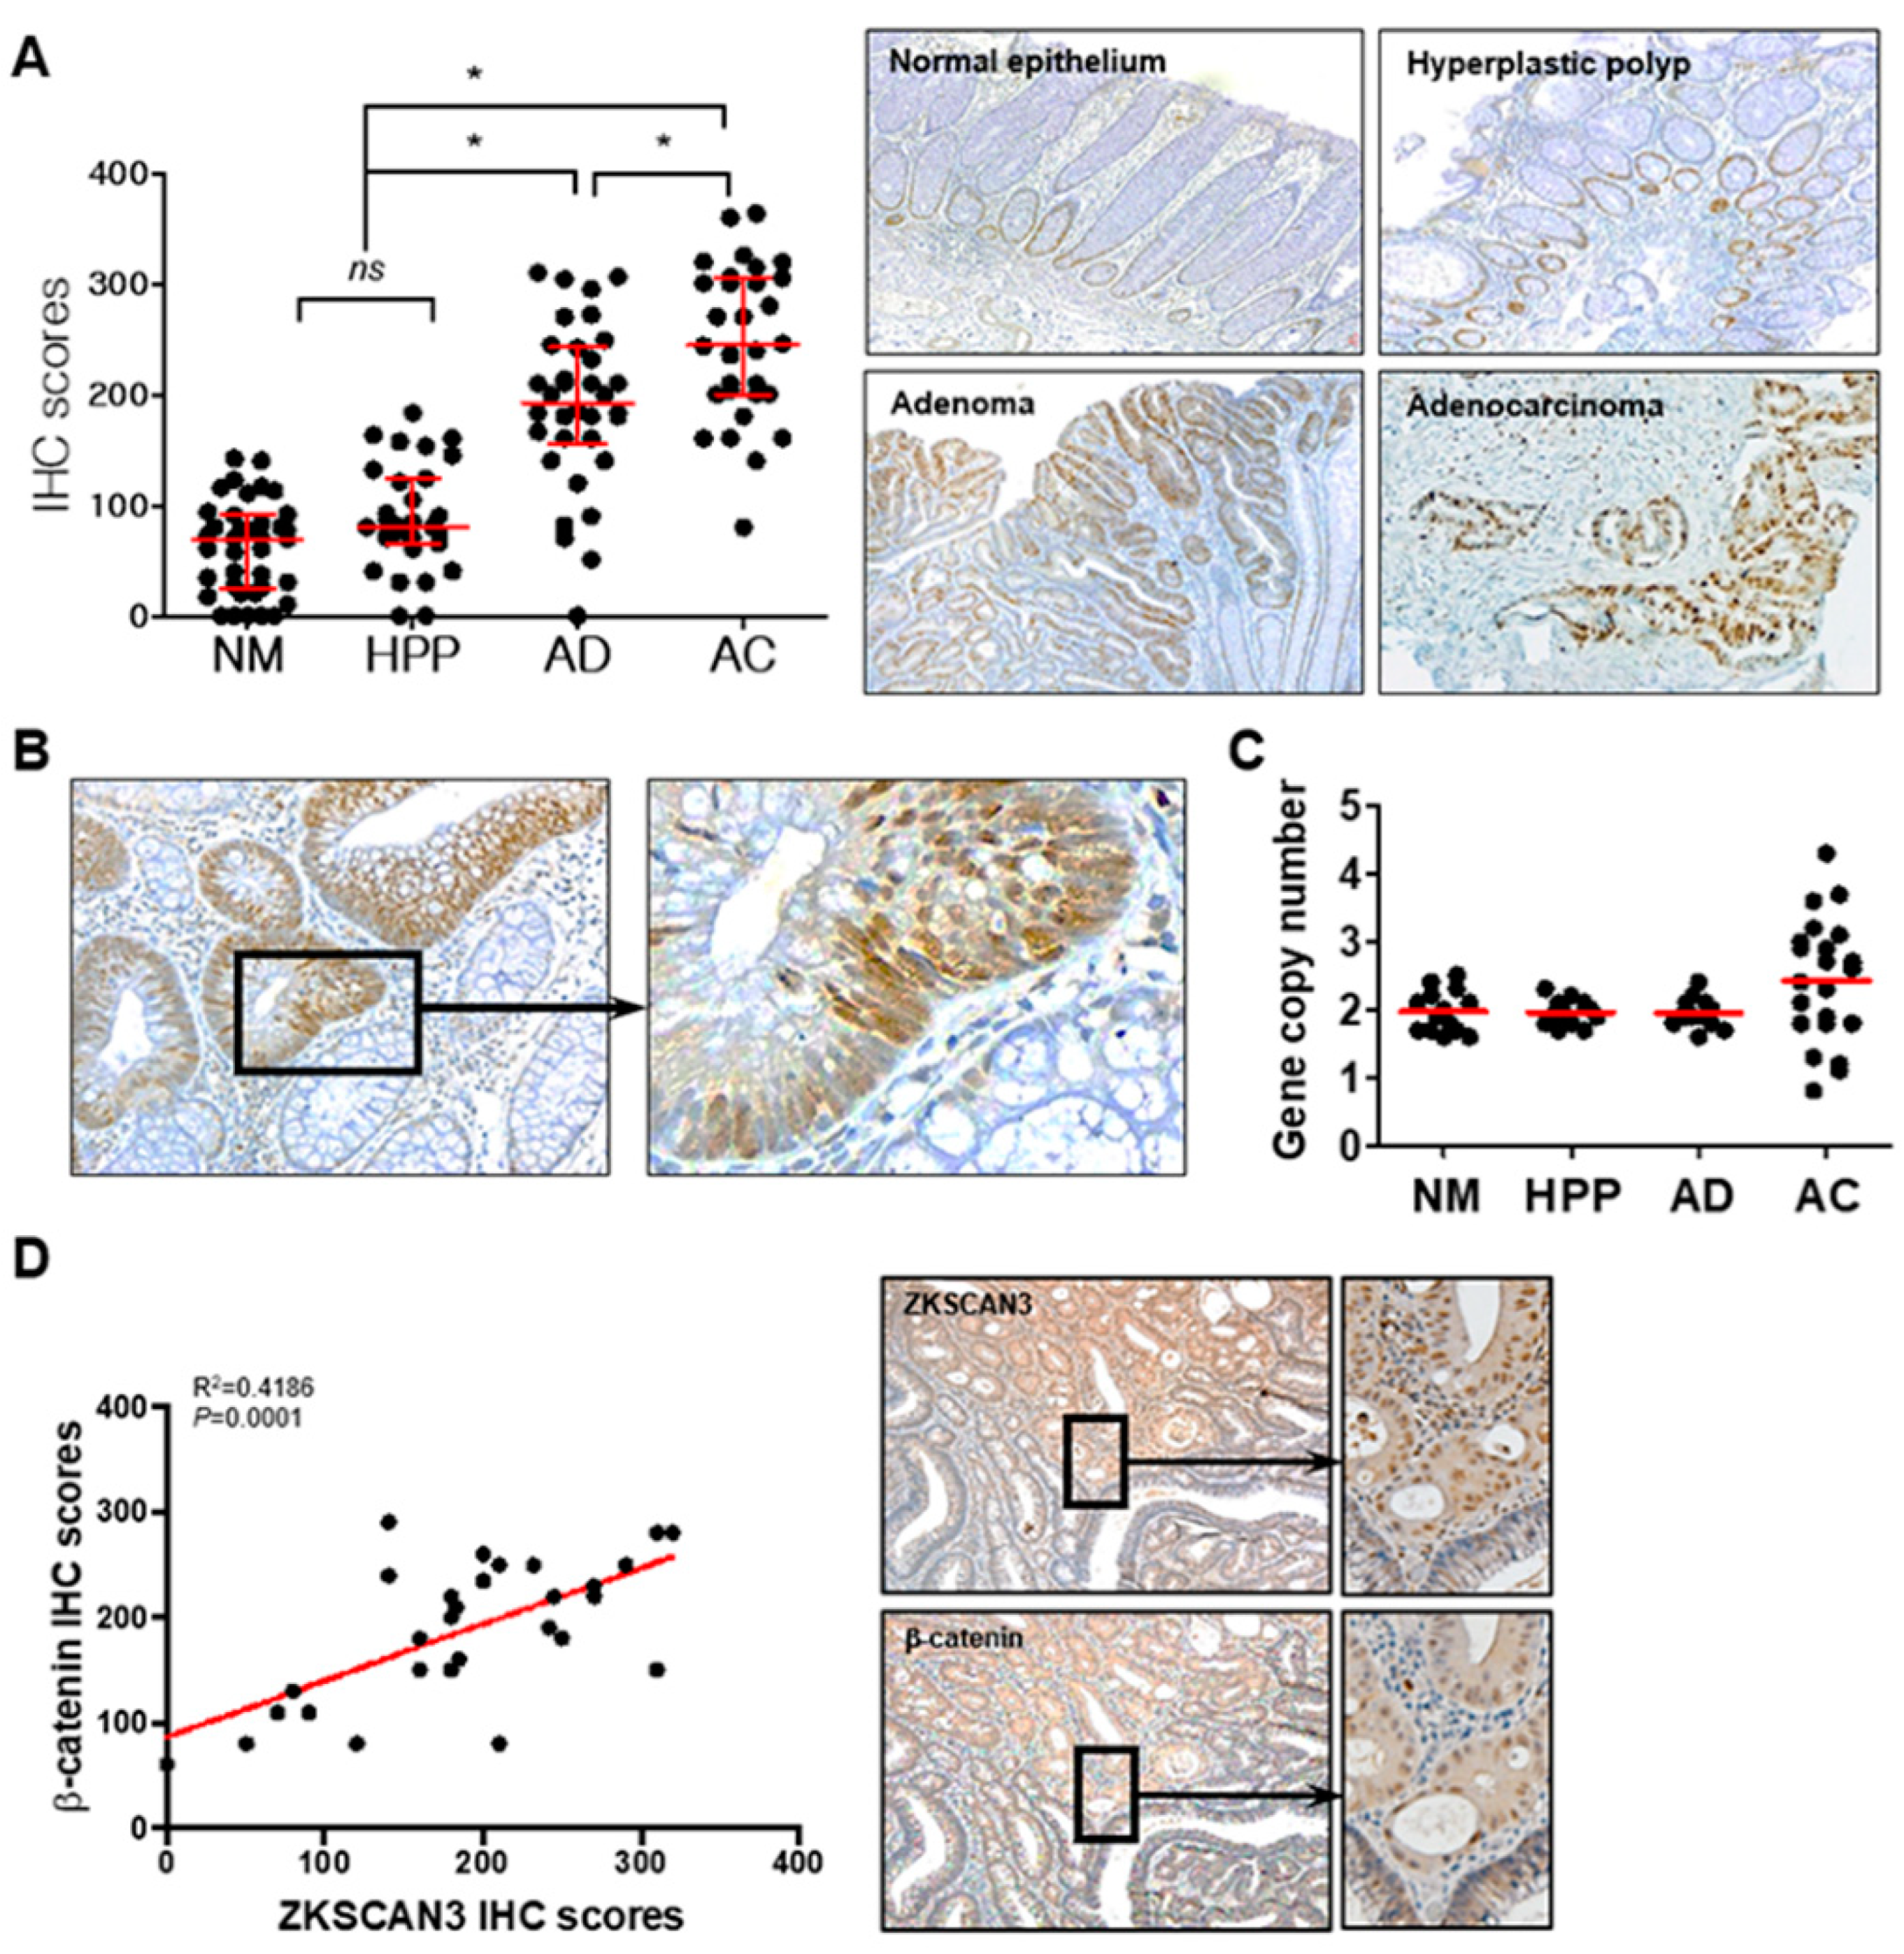
2.6. The WNT/β-Catenin/ZKSCAN3 Axis Acts during the Early Stages of Colon Cancer Development
3. Discussion
4. Materials and Methods
4.1. Cell Culture and Reagents
4.2. Constructions of ZKSCAN3 Knockout Cell Lines
4.3. RNA Sequencing and Informatics Analysis
4.4. Plasmids, Viruses, and Transfection
4.5. RNA Isolation and Real-Time qPCR Analysis
4.6. Luciferase Assay
4.7. Live Cell Imaging
4.8. Chromatin Immunoprecipitation (ChIP) Assay and EpiTect® ChIP qPCR Array–Human Cell Cycle
4.9. Cell Cycle Analysis, CBMN Assays, and Mitotic Index
4.10. Western Blotting and Immunofluorescence
4.11. Tissue Samples, Immunohistochemistry (IHC), and Evaluation
4.12. Quantitative PCR for Copy Number Aberration Detection
4.13. Fluorescence In Situ Hybridization
5. Statistics
Supplementary Materials
Author Contributions
Funding
Institutional Review Board Statement
Informed Consent Statement
Acknowledgments
Conflicts of Interest
References
- MacDonald, B.T.; Tamai, K.; He, X. Wnt/beta-catenin signaling: Components, mechanisms, and diseases. Dev. Cell. 2009, 17, 9–26. [Google Scholar] [CrossRef] [PubMed]
- Behrens, J.; Jerchow, B.A.; Würtele, M.; Grimm, J.; Asbrand, C.; Wirtz, R.; Kühl, M.; Wedlich, D.; Birchmeier, W. Functional interaction of an axin homolog, conductin, with beta-catenin, APC, and GSK3beta. Science 1998, 280, 596–599. [Google Scholar] [CrossRef] [PubMed]
- Ikeda, S.; Kishida, S.; Yamamoto, H.; Murai, H.; Koyama, S.; Kikuchi, A. Axin, a negative regulator of the Wnt signaling pathway, forms a complex with GSK-3beta and beta-catenin and promotes GSK-3beta-dependent phosphorylation of beta-catenin. EMBO J. 1998, 17, 1371–1384. [Google Scholar] [CrossRef] [PubMed]
- Behrens, J.; von Kries, J.P.; Kühl, M.; Bruhn, L.; Wedlich, D.; Grosschedl, R.; Birchmeier, W. Functional interaction of beta-catenin with the transcription factor LEF-1. Nature 1996, 382, 638–642. [Google Scholar] [CrossRef] [PubMed]
- Sancho, E.; Batlle, E.; Clevers, H. Signaling pathways in intestinal development and cancer. Annu. Rev. Cell Dev. Biol. 2004, 20, 695–723. [Google Scholar] [CrossRef]
- Lengauer, C.; Kinzler, K.W.; Vogelstein, B. Genetic instabilities in human cancers. Nature 1998, 396, 643–649. [Google Scholar] [CrossRef]
- Levine, M.S.; Holland, A.J. The impact of mitotic errors on cell proliferation and tumorigenesis. Genes Dev. 2018, 32, 620–638. [Google Scholar] [CrossRef]
- Tighe, A.; Johnson, V.L.; Taylor, S.S. Truncating APC mutations have dominant effects on proliferation, spindle checkpoint control, survival and chromosome stability. J. Cell Sci. 2004, 117, 6339–6353. [Google Scholar] [CrossRef]
- Dewhurst, S.M.; McGranahan, N.; Burrell, R.A.; Rowan, A.J.; Gronroos, E.; Endesfelder, D.; Joshi, T.; Mouradov, D.; Gibbs, P.; Ward, R.L.; et al. Tolerance of whole-genome doubling propagates chromosomal instability and accelerates cancer genome evolution. Cancer Discov. 2014, 4, 175–185. [Google Scholar] [CrossRef]
- McGranahan, N.; Swanton, C. Clonal heterogeneity and tumor evolution: Past, present, and the future. Cell 2017, 168, 613–628. [Google Scholar] [CrossRef]
- Mouradov, D.; Domingo, E.; Gibbs, P.; Jorissen, R.N.; Li, S.; Soo, P.Y.; Lipton, L.; Desai, J.; Danielsen, H.E.; Oukrif, D.; et al. Survival in stage II/III colorectal cancer is independently predicted by chromosomal and microsatellite instability, but not by specific driver mutations. Am. J. Gastroenterol. 2013, 108, 1785–1793. [Google Scholar] [CrossRef] [PubMed]
- Hadjihannas, M.V.; Brückner, M.; Jerchow, B.; Birchmeier, W.; Dietmaier, W.; Behrens, J. Aberrant Wnt/beta-catenin signaling can induce chromosomal instability in colon cancer. Proc. Natl. Acad. Sci. USA 2006, 103, 10747–10752. [Google Scholar] [CrossRef] [PubMed]
- Zhan, T.; Rindtorff, N.; Boutros, M. Wnt signaling in cancer. Oncogene 2017, 36, 1461–1473. [Google Scholar] [CrossRef]
- Aoki, K.; Aoki, M.; Sugai, M.; Harada, N.; Miyoshi, H.; Tsukamoto, T.; Mizoshita, T.; Tatematsu, M.; Seno, H.; Chiba, T.; et al. Chromosomal instability by beta-catenin/TCF transcription in APC or beta-catenin mutant cells. Oncogene 2007, 26, 3511–3520. [Google Scholar] [CrossRef] [PubMed]
- Kaplan, K.B.; Burds, A.A.; Swedlow, J.R.; Bekir, S.S.; Sorger, P.K.; Näthke, I.S. A role for the Adenomatous Polyposis Coli protein in chromosome segregation. Nat. Cell Biol. 2001, 3, 429–432. [Google Scholar] [CrossRef] [PubMed]
- Baba, Y.; Nosho, K.; Shima, K.; Irahara, N.; Kure, S.; Toyoda, S.; Kirkner, G.J.; Goel, A.; Fuchs, C.S.; Ogino, S. Aurora-A expression is independently associated with chromosomal instability in colorectal cancer. Neoplasia 2009, 11, 418–425. [Google Scholar] [CrossRef]
- Fodde, R.; Kuipers, J.; Rosenberg, C.; Smits, R.; Kielman, M.; Gaspar, C.; van Es, J.H.; Breukel, C.; Wiegant, J.; Giles, R.H.; et al. Mutations in the APC tumour suppressor gene cause chromosomal instability. Nat. Cell Biol. 2001, 3, 433–438. [Google Scholar] [CrossRef]
- Chauhan, S.; Goodwin, J.G.; Chauhan, S.; Manyam, G.; Wang, J.; Kamat, A.M.; Boyd, D.D. ZKSCAN3 is a master transcriptional repressor of autophagy. Mol. Cell 2013, 50, 16–28. [Google Scholar] [CrossRef]
- Chi, Y.; Xu, H.; Wang, F.; Chen, X.; Shan, Z.; Sun, Y.; Fan, Q. ZKSCAN3 promotes breast cancer cell proliferation, migration and invasion. Biochem. Biophys. Res. Commun. 2018, 503, 2583–2589. [Google Scholar] [CrossRef]
- Ma, X.; Wang, X.; Gao, X.; Wang, L.; Lu, Y.; Gao, P.; Deng, W.; Yu, P.; Ma, J.; Guo, J.; et al. Identification of five human novel genes associated with cell proliferation by cell-based screening from an expressed cDNA ORF library. Life Sci. 2007, 81, 1141–1151. [Google Scholar] [CrossRef]
- Yang, L.; Hamilton, S.R.; Sood, A.; Kuwai, T.; Ellis, L.; Sanguino, A.; Berenstein, G.L.; Boyd, D.D. The previously undescribed ZKSCAN3 (ZNF306) is a novel “driver” of colorectal cancer progression. Cancer Res. 2008, 68, 4321–4330. [Google Scholar] [CrossRef] [PubMed]
- Kim, C.W.; Roh, S.A.; Tak, K.H.; Koh, B.M.; Ha, Y.J.; Cho, D.-H.; Kim, S.-Y.; Kim, Y.S.; Kim, J.C. ZKSCAN3 facilitates liver metastasis of colorectal cancer associated with CEA-expressing tumor. Anticancer Res. 2016, 36, 2397–2406. [Google Scholar] [PubMed]
- Yang, L.; Wang, H.; Kornblau, S.M.; Graber, D.A.; Zhang, N.; Matthews, J.A.; Wang, M.; Weber, D.M.; Thomas, S.K.; Shah, J.J.; et al. Evidence of a role for the novel zinc-finger transcription factor ZKSCAN3 in modulating cyclin D2 expression in multiple myeloma. Oncogene 2011, 30, 1329–1340. [Google Scholar] [CrossRef]
- Zhang, X.; Jing, Y.; Qin, Y.; Hunsucker, S.; Meng, H.; Sui, J.; Jiang, Y.; Gao, L.; An, G.; Yang, N.; et al. The zinc finger transcription factor ZKSCAN3 promotes prostate cancer cell migration. Int. J. Biochem. Cell Biol. 2012, 44, 1166–1173. [Google Scholar] [CrossRef] [PubMed]
- Kawahara, T.; Inoue, S.; Ide, H.; Kashiwagi, E.; Ohtake, S.; Mizushima, T.; Li, P.; Zheng, Y.; Uemura, H.; Netto, G.J.; et al. ZKSCAN3 promotes bladder cancer cell proliferation, migration, and invasion. Oncotarget 2016, 7, 53599–53610. [Google Scholar] [CrossRef] [PubMed]
- Lee, S.; Cho, Y.E.; Kim, J.Y.; Park, J.H. ZKSCAN3 upregulation and its poor clinical outcome in uterine cervical cancer. Int. J. Mol. Sci. 2018, 19, 2859. [Google Scholar] [CrossRef]
- Yang, L.; Zhang, L.; Wu, Q.; Boyd, D.D. Unbiased screening for transcriptional targets of ZKSCAN3 identifies integrin beta 4 and vascular endothelial growth factor as downstream targets. J. Biol. Chem. 2008, 283, 35295–35304. [Google Scholar] [CrossRef]
- Trosset, J.Y.; Dalvit, C.; Knapp, S.; Fasolini, M.; Veronesi, M.; Mantegani, S.; Gianellini, L.M.; Catana, C.; Sundstrom, M.; Stouten, P.F.W.; et al. Inhibition of protein–protein interactions: The discovery of druglike β-catenin inhibitors by combining virtual and biophysical screening. Proteins Struct. Funct. Bioinform. 2006, 64, 60–67. [Google Scholar] [CrossRef]
- Hwang, S.Y.; Deng, X.; Byun, S.; Lee, C.; Lee, S.J.; Suh, H.; Zhang, J.; Kang, Q.; Zhang, T.; Westover, K.D.; et al. Direct Targeting of beta-Catenin by a Small Molecule Stimulates Proteasomal Degradation and Suppresses Oncogenic Wnt/beta-Catenin Signaling. Cell Rep. 2016, 16, 28–36. [Google Scholar] [CrossRef]
- Bottomly, D.; Kyler, S.L.; McWeeney, S.K.; Yochum, G.S. Identification of β-catenin binding regions in colon cancer cells using ChIP-Seq. Nucleic Acids Res. 2010, 38, 5735–5745. [Google Scholar] [CrossRef]
- Guttinger, S.; Laurell, E.; Kutay, U. Orchestrating nuclear envelope disassembly and reassembly during mitosis. Nat. Rev. Mol. Cell Biol. 2009, 10, 178–191. [Google Scholar] [CrossRef]
- Hart, M.J.; de los Santos, R.; Albert, I.N.; Rubinfeld, B.; Polakis, P. Downregulation of beta-catenin by human Axin and its association with the APC tumor suppressor, beta-catenin and GSK3 beta. Curr. Biol. 1998, 8, 573–581. [Google Scholar] [CrossRef]
- Takayama, T.; Miyanishi, K.; Hayashi, T.; Sato, Y.; Niitsu, Y. Colorectal cancer: Genetics of development and metastasis. J. Gastroenterol. 2006, 41, 185–192. [Google Scholar] [CrossRef] [PubMed]
- Wong, N.A.; Pignatelli, M. Beta-catenin—A linchpin in colorectal carcinogenesis? Am. J. Pathol. 2002, 160, 389–401. [Google Scholar] [CrossRef]
- Munemitsu, S.; Albert, I.; Souza, B.; Rubinfeld, B.; Polakis, P. Regulation of intracellular beta-catenin levels by the adenomatous polyposis coli (APC) tumor-suppressor protein. Proc. Natl. Acad. Sci. USA 1995, 92, 3046–3050. [Google Scholar] [CrossRef]
- Nishisho, I.; Nakamura, Y.; Miyoshi, Y.; Miki, Y.; Ando, H.; Horii, A.; Koyama, K.; Utsunomiya, J.; Baba, S.; Hedge, P. Mutations of chromosome 5q21 genes in FAP and colorectal cancer patients. Science 1991, 253, 665–669. [Google Scholar] [CrossRef] [PubMed]
- He, T.C.; Sparks, A.B.; Rago, C.; Hermeking, H.; Zawel, L.; da Costa, L.T.; Morin, P.J.; Vogelstein, B.; Kinzler, K.W. Identification of c-MYC as a target of the APC pathway. Science 1998, 281, 1509–1512. [Google Scholar] [CrossRef]
- Shtutman, M.; Zhurinsky, J.; Simcha, I.; Albanese, C.; D’Amico, M.; Pestell, R.; Ben-Ze’ev, A. The cyclin D1 gene is a target of the beta-catenin/LEF-1 pathway. Proc. Natl. Acad. Sci. USA 1999, 96, 5522–5527. [Google Scholar] [CrossRef]
- Takano, Y.; Shida, A.; Fujisaki, M.; Mitsumori, N.; Yanaga, K. Prognostic significance of ZKSCAN3 (ZNF306) expression in gastric carcinoma. Anticancer Res. 2020, 40, 81–86. [Google Scholar] [CrossRef]
- Krausova, M.; Korinek, V. Wnt signaling in adult intestinal stem cells and cancer. Cell. Signal. 2014, 26, 570–579. [Google Scholar] [CrossRef]
- Vishwakarma, R.; McManus, K.J. Chromosome instability; implications in cancer development, progression, and clinical outcomes. Cancers 2020, 12, 824. [Google Scholar] [CrossRef] [PubMed]
- Caldwell, C.M.; Kaplan, K.B. The role of APC in mitosis and in chromosome instability. Adv. Exp. Med. Biol. 2009, 656, 51–64. [Google Scholar] [PubMed]
- Green, R.A.; Kaplan, K.B. Chromosome instability in colorectal tumor cells is associated with defects in microtubule plus-end attachments caused by a dominant mutation in APC. J. Cell Biol. 2003, 163, 949–961. [Google Scholar] [CrossRef] [PubMed]
- Bakhoum, S.F.; Kabeche, L.; Murnane, J.P.; Zaki, B.I.; Compton, D.A. DNA-damage response during mitosis induces whole-chromosome missegregation. Cancer Discov. 2014, 4, 1281–1289. [Google Scholar] [CrossRef]
- Boersma, V.; Moatti, N.; Segura-Bayona, S.; Pseuscher, M.H.; van der Torre, J.; Wevers, B.A.; Orthwein, A.; Durocher, D.; Jacobs, J.J.L. MAD2L2 controls DNA repair at telomeres and DNA breaks by inhibiting 5′ end resection. Nature 2015, 521, 537–540. [Google Scholar] [CrossRef]
- Listovsky, T.; Sale, J.E. Sequestration of CDH1 by MAD2L2 prevents premature APC/C activation prior to anaphase onset. J. Cell Biol. 2013, 203, 87–100. [Google Scholar] [CrossRef]
- Li, Y.; Li, L.; Chen, M.; Yu, X.; Gu, Z.; Qiu, H.; Qin, G.; Long, Q.; Fu, X.; Liu, T.; et al. MAD2L2 inhibits colorectal cancer growth by promoting NCOA3 ubiquitination and degradation. Mol. Oncol. 2018, 12, 391–405. [Google Scholar] [CrossRef]
- Rimkus, C.; Friederichs, J.; Rosenberg, R.; Holzmann, B.; Siewert, J.R.; Janssen, K.P. Expression of the mitotic checkpoint gene MAD2L2 has prognostic significance in colon cancer. Int. J. Cancer 2007, 120, 207–211. [Google Scholar] [CrossRef]
- Li, Y.; Benezra, R. Identification of a human mitotic checkpoint gene: hsMAD2. Science 1996, 274, 246–248. [Google Scholar] [CrossRef]
- Hernando, E.; Orlow, I.; Liberal, V.; Nohales, G.; Benezra, R.; Cordon-Cardo, C. Molecular analyses of the mitotic checkpoint components hsMAD2, hBUB1 and hBUB3 in human cancer. Int. J. Cancer 2001, 95, 223–227. [Google Scholar] [CrossRef]
- Wang, X.; Jin, D.Y.; Wong, Y.C.; Cheung, A.L.M.; Chun, A.C.S.; Lo, A.K.F.; Liu, Y.; Tsao, S.W. Correlation of defective mitotic checkpoint with aberrantly reduced expression of MAD2 protein in nasopharyngeal carcinoma cells. Carcinogenesis 2000, 21, 2293–2297. [Google Scholar] [CrossRef]
- Karakashev, S.; Fukumoto, T.; Zhao, B.; Lin, J.; Wu, S.; Fatkhutdinov, N.; Park, P.H.; Semenova, G.; Jean, S.; Cadungog, M.G.; et al. EZH2 inhibition sensitizes CARM1-high, homologous recombination proficient ovarian cancers to PARP inhibition. Cancer Cell 2020, 37, 157–167.e6. [Google Scholar] [CrossRef] [PubMed]
- Yim, J.H.; Kim, Y.J.; Ko, J.H.; Cho, Y.E.; Kim, S.M.; Kim, J.Y.; Lee, S.; Park, J.H. The putative tumor suppressor gene GLTSCR2 induces PTEN-modulated cell death. Cell Death Differ. 2007, 14, 1872–1879. [Google Scholar] [CrossRef]
- Livak, K.J.; Schmittgen, T.D. Analysis of relative gene expression data using real-time quantitative PCR and the 2(-Delta Delta CT) method. Methods 2001, 25, 402–408. [Google Scholar] [CrossRef] [PubMed]
- Cho, Y.E.; Kim, Y.J.; Lee, S.; Park, J.H. NOP53 suppresses autophagy through ZKSCAN3-dependent and -independent pathways. Int. J. Mol. Sci. 2021, 22, 9318. [Google Scholar] [CrossRef]
- Shibamoto, Y.; Strefer, C.; Fuhrmann, C.; Budach, V. Tumor radiosensitivity prediction by the cytokinesis-block micronucleus assay. Radiat. Res. 1991, 128, 293–300. [Google Scholar] [CrossRef] [PubMed]
- Mauri, F.A.; Caffo, O.; Veronese, S.; Verderio, P.; Boracchi, P.; Bonzanini, M.; Rossi, N.; Perrone, G.; Dalla Palma, P.; Barbareschi, M. Tissue carcinoembryonic antigen and oestrogen receptor status in breast carcinoma: An immunohistochemical study of clinical outcome in a series of 252 patients with long-term follow-up. Br. J. Cancer 1998, 77, 1661–1668. [Google Scholar] [CrossRef] [PubMed]
- Mehrotra, M.; Luthra, R.; Abraham, R.; Mishra, B.M.; Virani, S.; Chen, H.; Routbort, M.J.; Patel, K.P.; Medeiros, L.J.; Singh, R.R. Validation of quantitative PCR-based assays for detection of gene copy number aberrations in formalin-fixed, paraffin embedded solid tumor samples. Cancer Genet. 2017, 212–213, 24–31. [Google Scholar] [CrossRef]
- Kim, Y.J.; Cho, Y.E.; Kim, Y.W.; Kim, J.Y.; Lee, S.; Park, J.H. Suppression of putative tumour suppressor gene GLTSCR2 expression in human glioblastomas. J. Pathol. 2008, 216, 218–224. [Google Scholar] [CrossRef]


Publisher’s Note: MDPI stays neutral with regard to jurisdictional claims in published maps and institutional affiliations. |
© 2022 by the authors. Licensee MDPI, Basel, Switzerland. This article is an open access article distributed under the terms and conditions of the Creative Commons Attribution (CC BY) license (https://creativecommons.org/licenses/by/4.0/).
Share and Cite
Cho, Y.-E.; Kim, J.-H.; Che, Y.-H.; Kim, Y.-J.; Sung, J.-Y.; Kim, Y.-W.; Choe, B.-G.; Lee, S.; Park, J.-H. Role of the WNT/β-catenin/ZKSCAN3 Pathway in Regulating Chromosomal Instability in Colon Cancer Cell lines and Tissues. Int. J. Mol. Sci. 2022, 23, 9302. https://doi.org/10.3390/ijms23169302
Cho Y-E, Kim J-H, Che Y-H, Kim Y-J, Sung J-Y, Kim Y-W, Choe B-G, Lee S, Park J-H. Role of the WNT/β-catenin/ZKSCAN3 Pathway in Regulating Chromosomal Instability in Colon Cancer Cell lines and Tissues. International Journal of Molecular Sciences. 2022; 23(16):9302. https://doi.org/10.3390/ijms23169302
Chicago/Turabian StyleCho, Young-Eun, Jeong-Hee Kim, Young-Hyun Che, Yong-Jun Kim, Ji-Youn Sung, Yoon-Wha Kim, Bong-Geun Choe, Sun Lee, and Jae-Hoon Park. 2022. "Role of the WNT/β-catenin/ZKSCAN3 Pathway in Regulating Chromosomal Instability in Colon Cancer Cell lines and Tissues" International Journal of Molecular Sciences 23, no. 16: 9302. https://doi.org/10.3390/ijms23169302