
Differential In Vitro Effects of SGLT2 Inhibitors on Mitochondrial Oxidative Phosphorylation, Glucose Uptake and Cell Metabolism

 , , , and
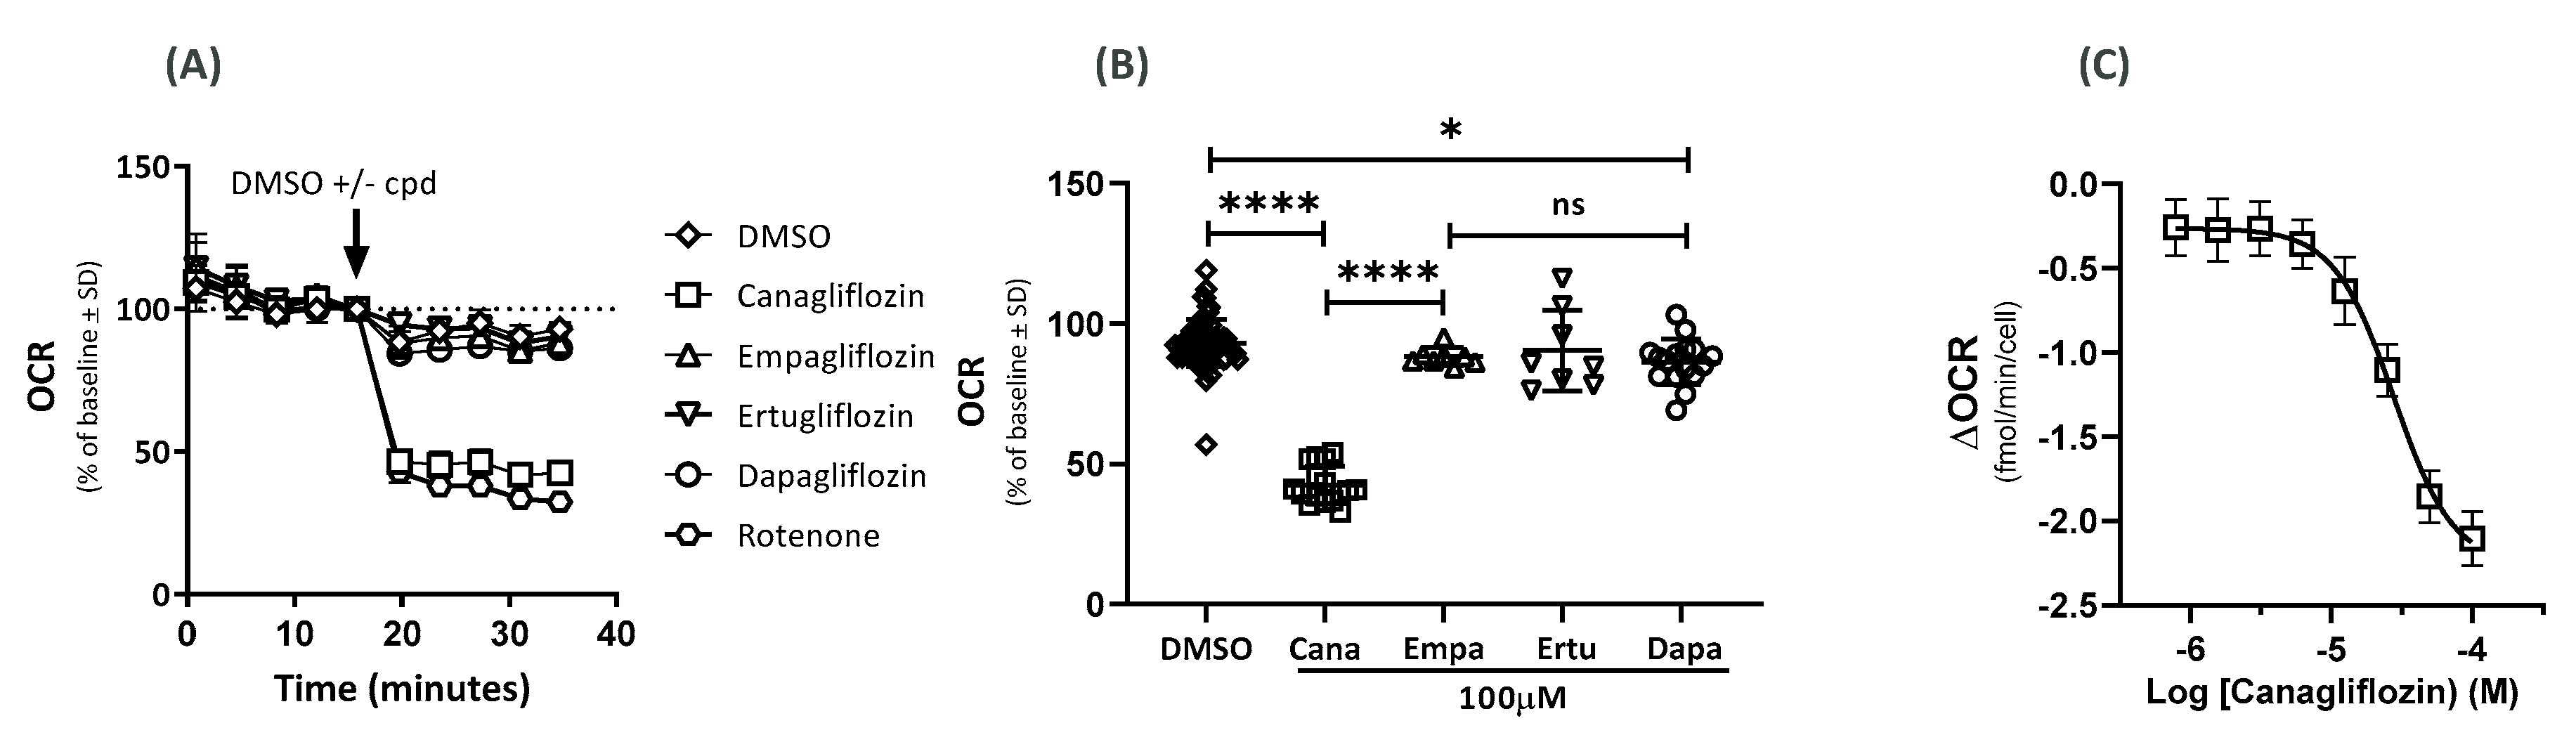
Abstract
:1. Introduction
2. Results
2.1. Effects on the Oxygen-Consumption Rate (OCR)
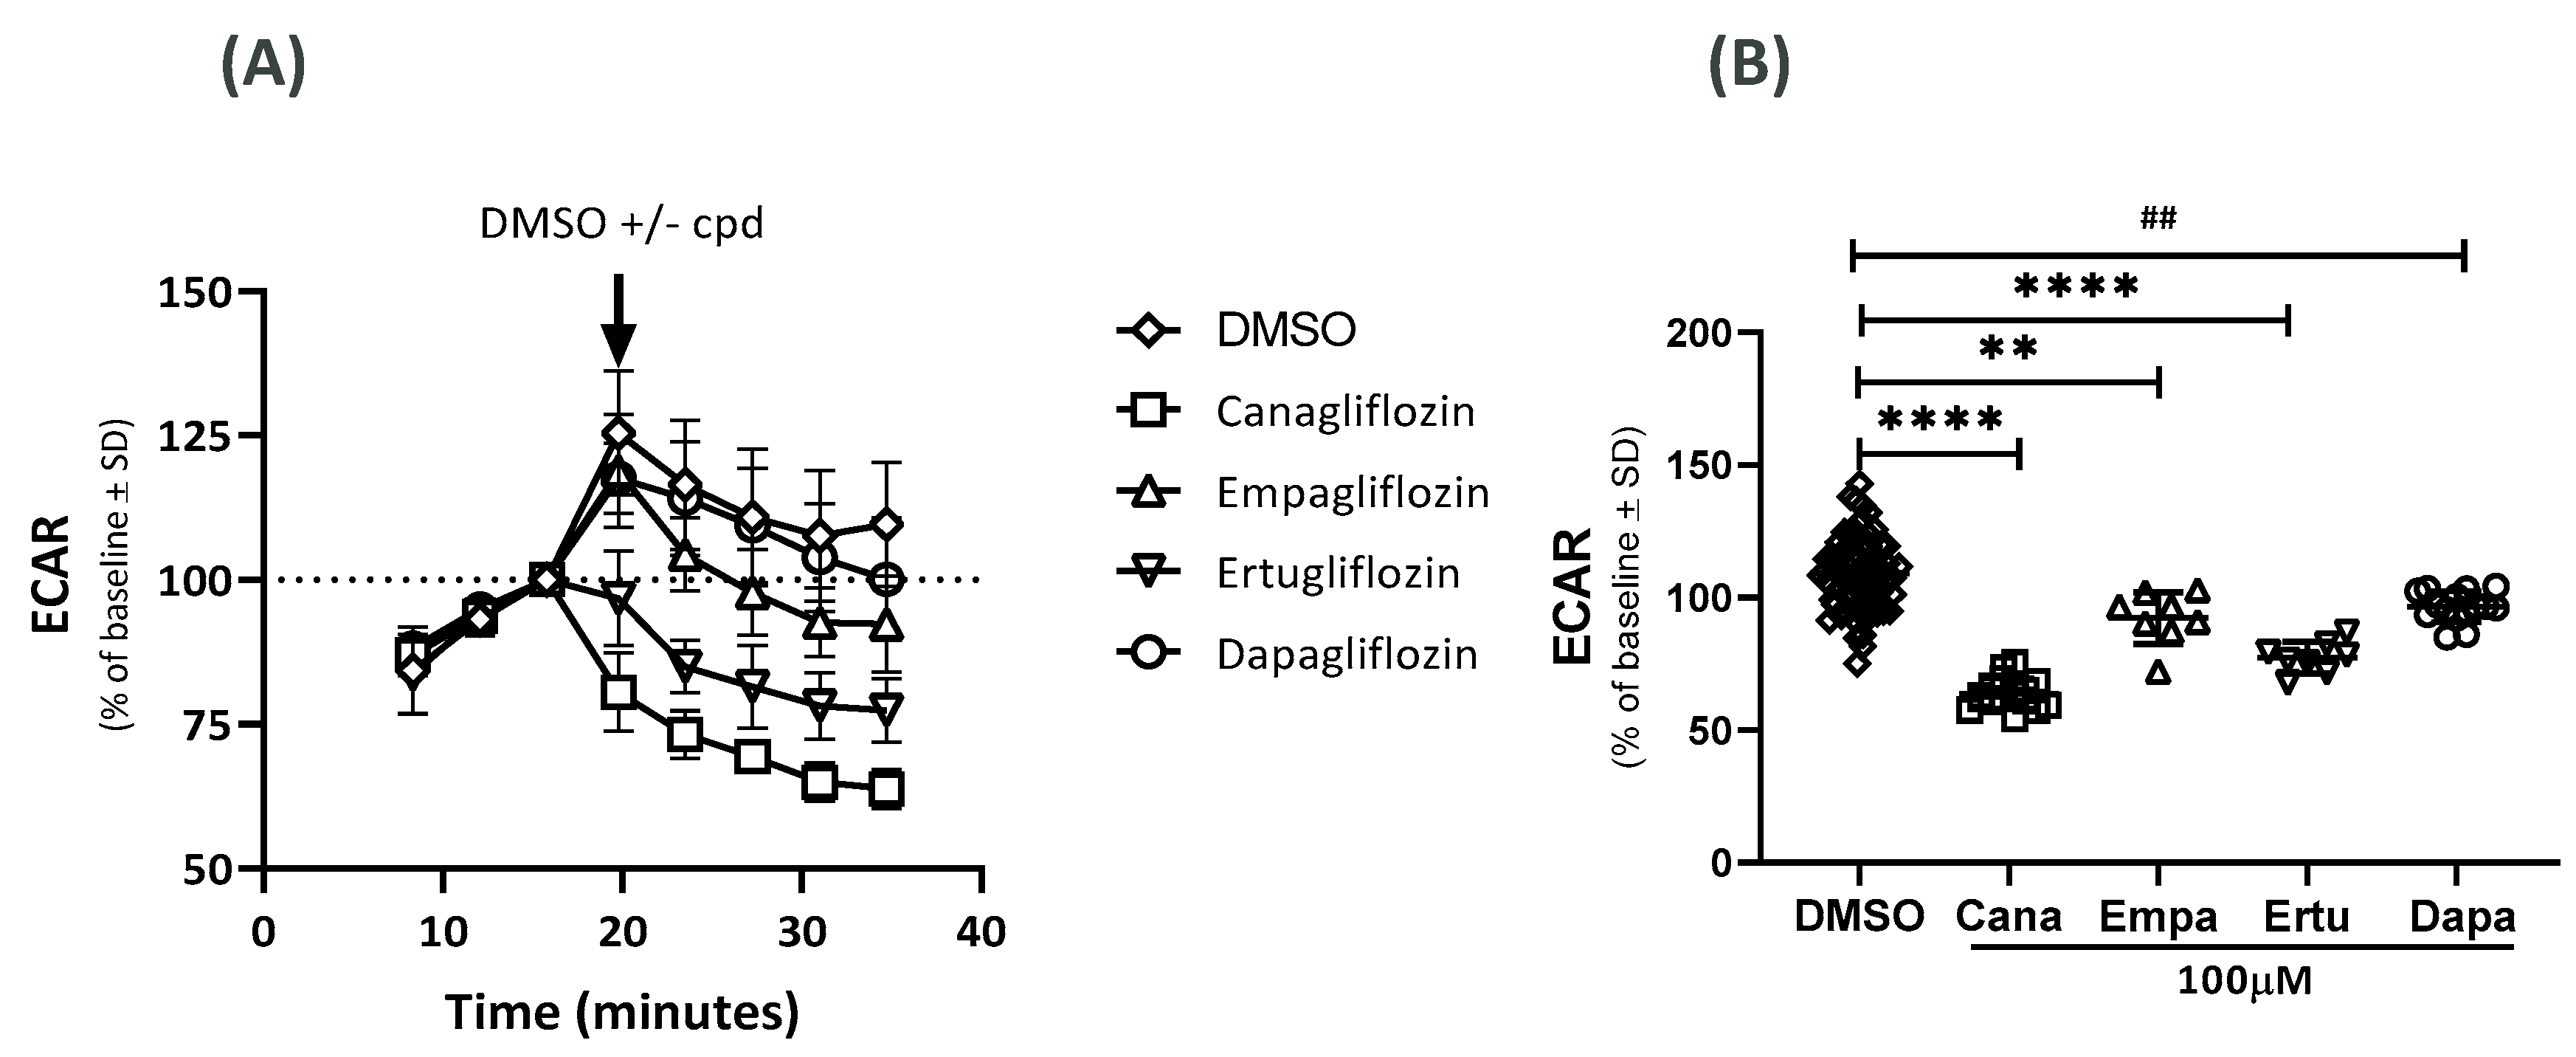
2.2. Effects on the Extracellular Acidification Rate (ECAR)
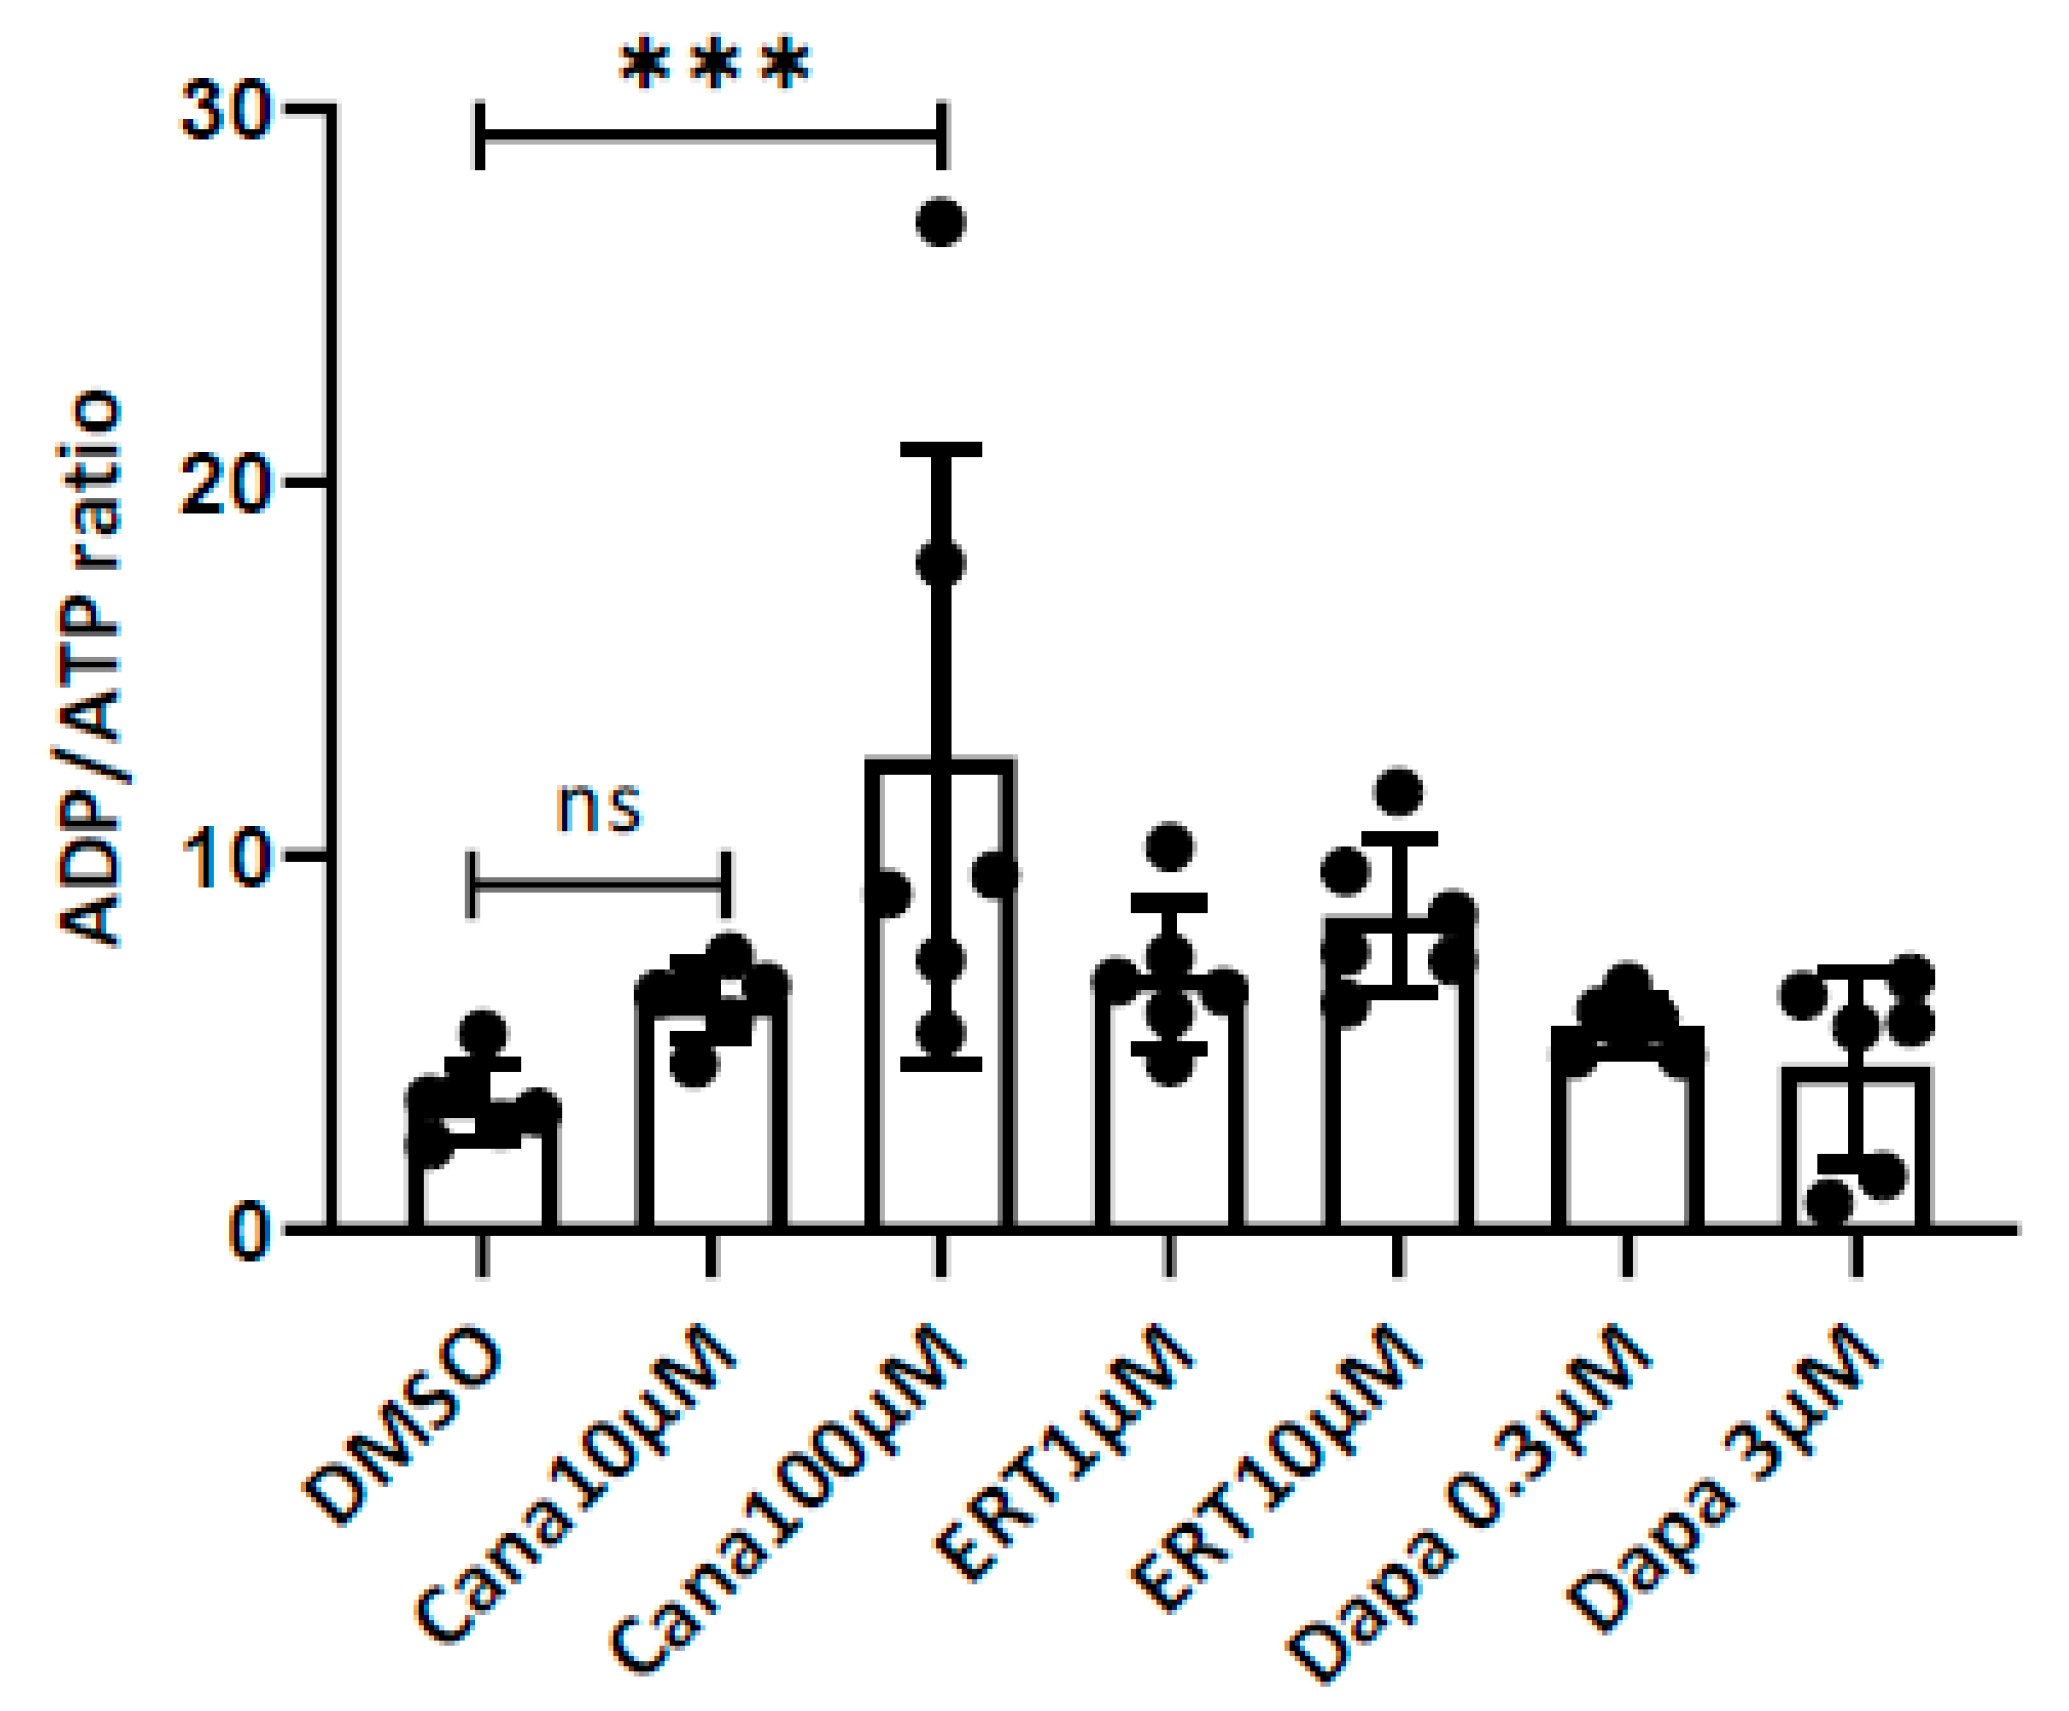
2.3. Effects on the ADP/ATP Ratio
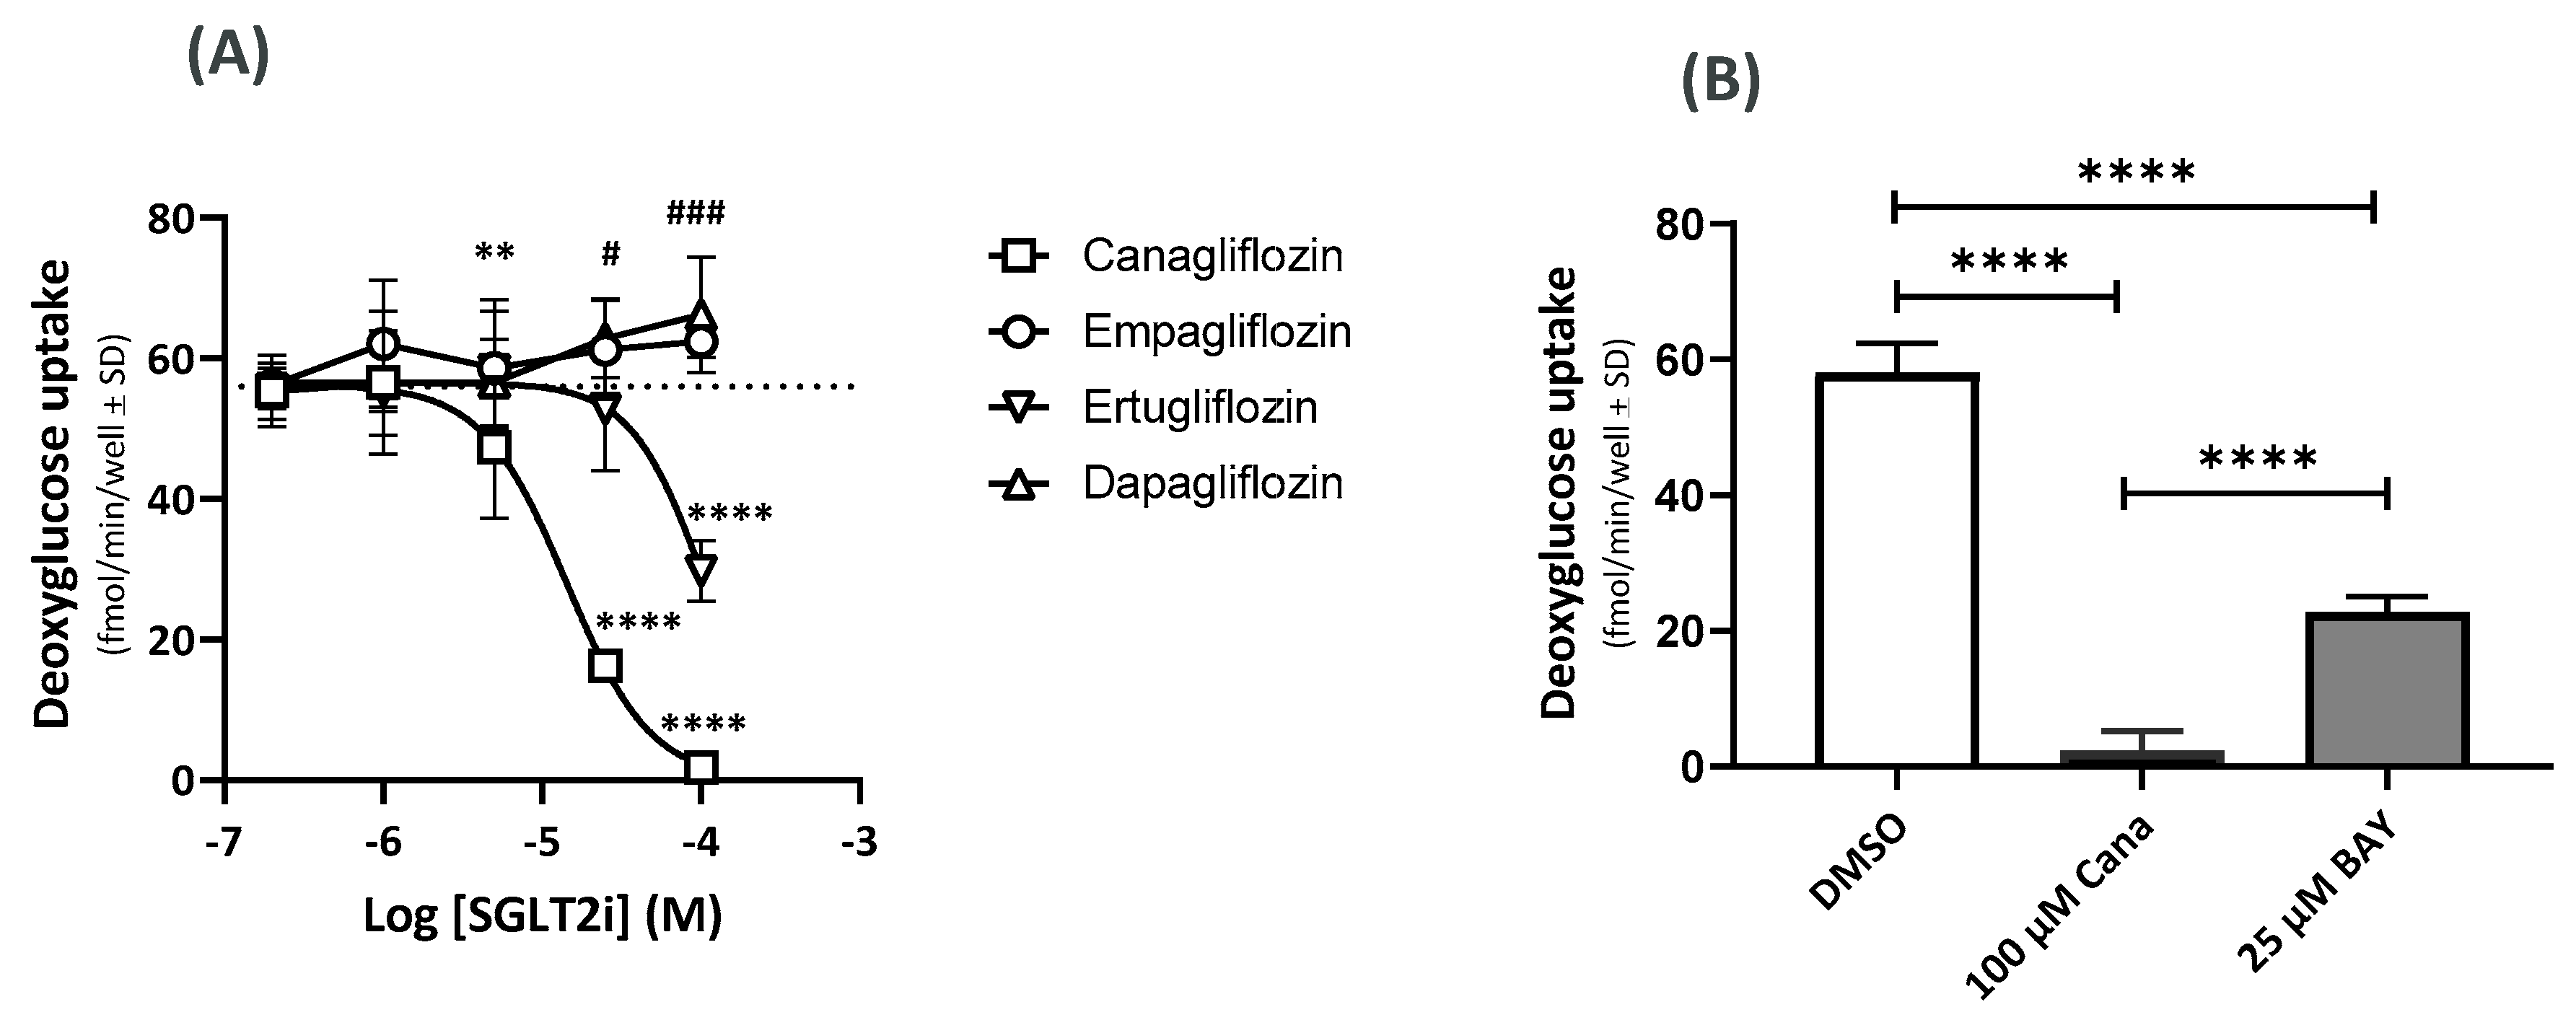
2.4. Effects on the GU Using 14C-Deoxyglucose (14C-DOG)
2.5. Effects of Cana on the GLUT Gene Expression
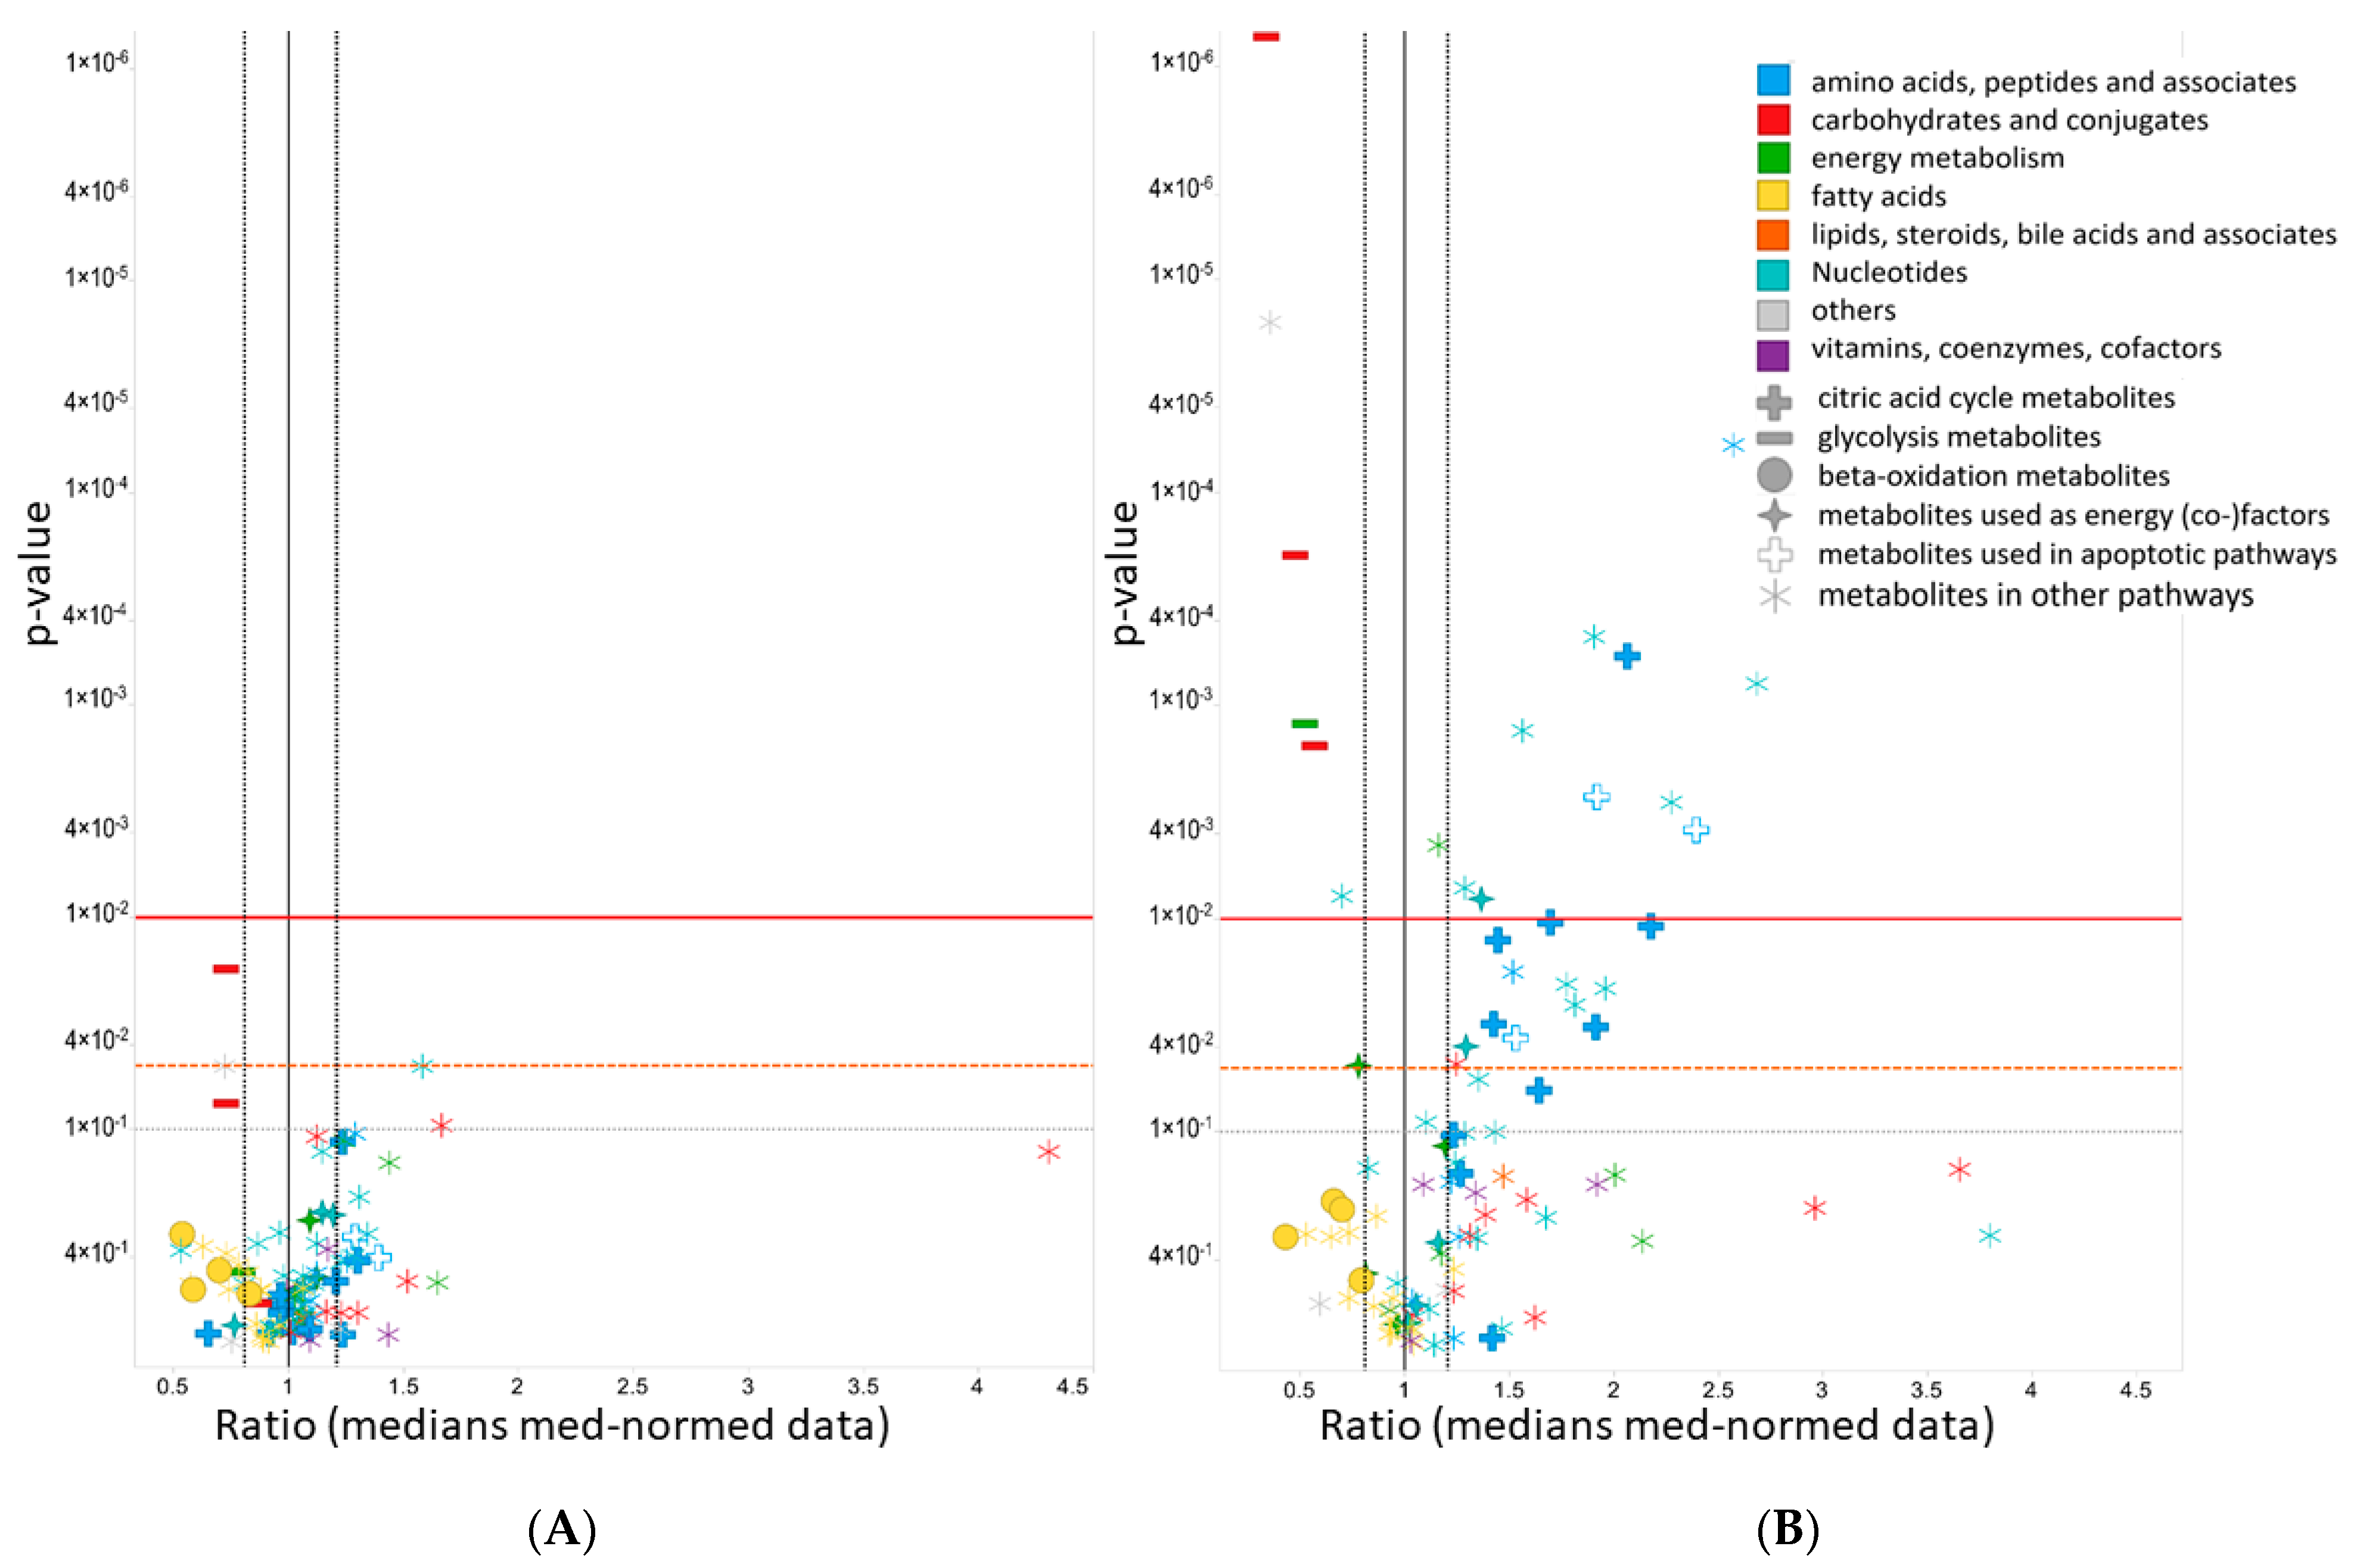
2.6. Metabolomics
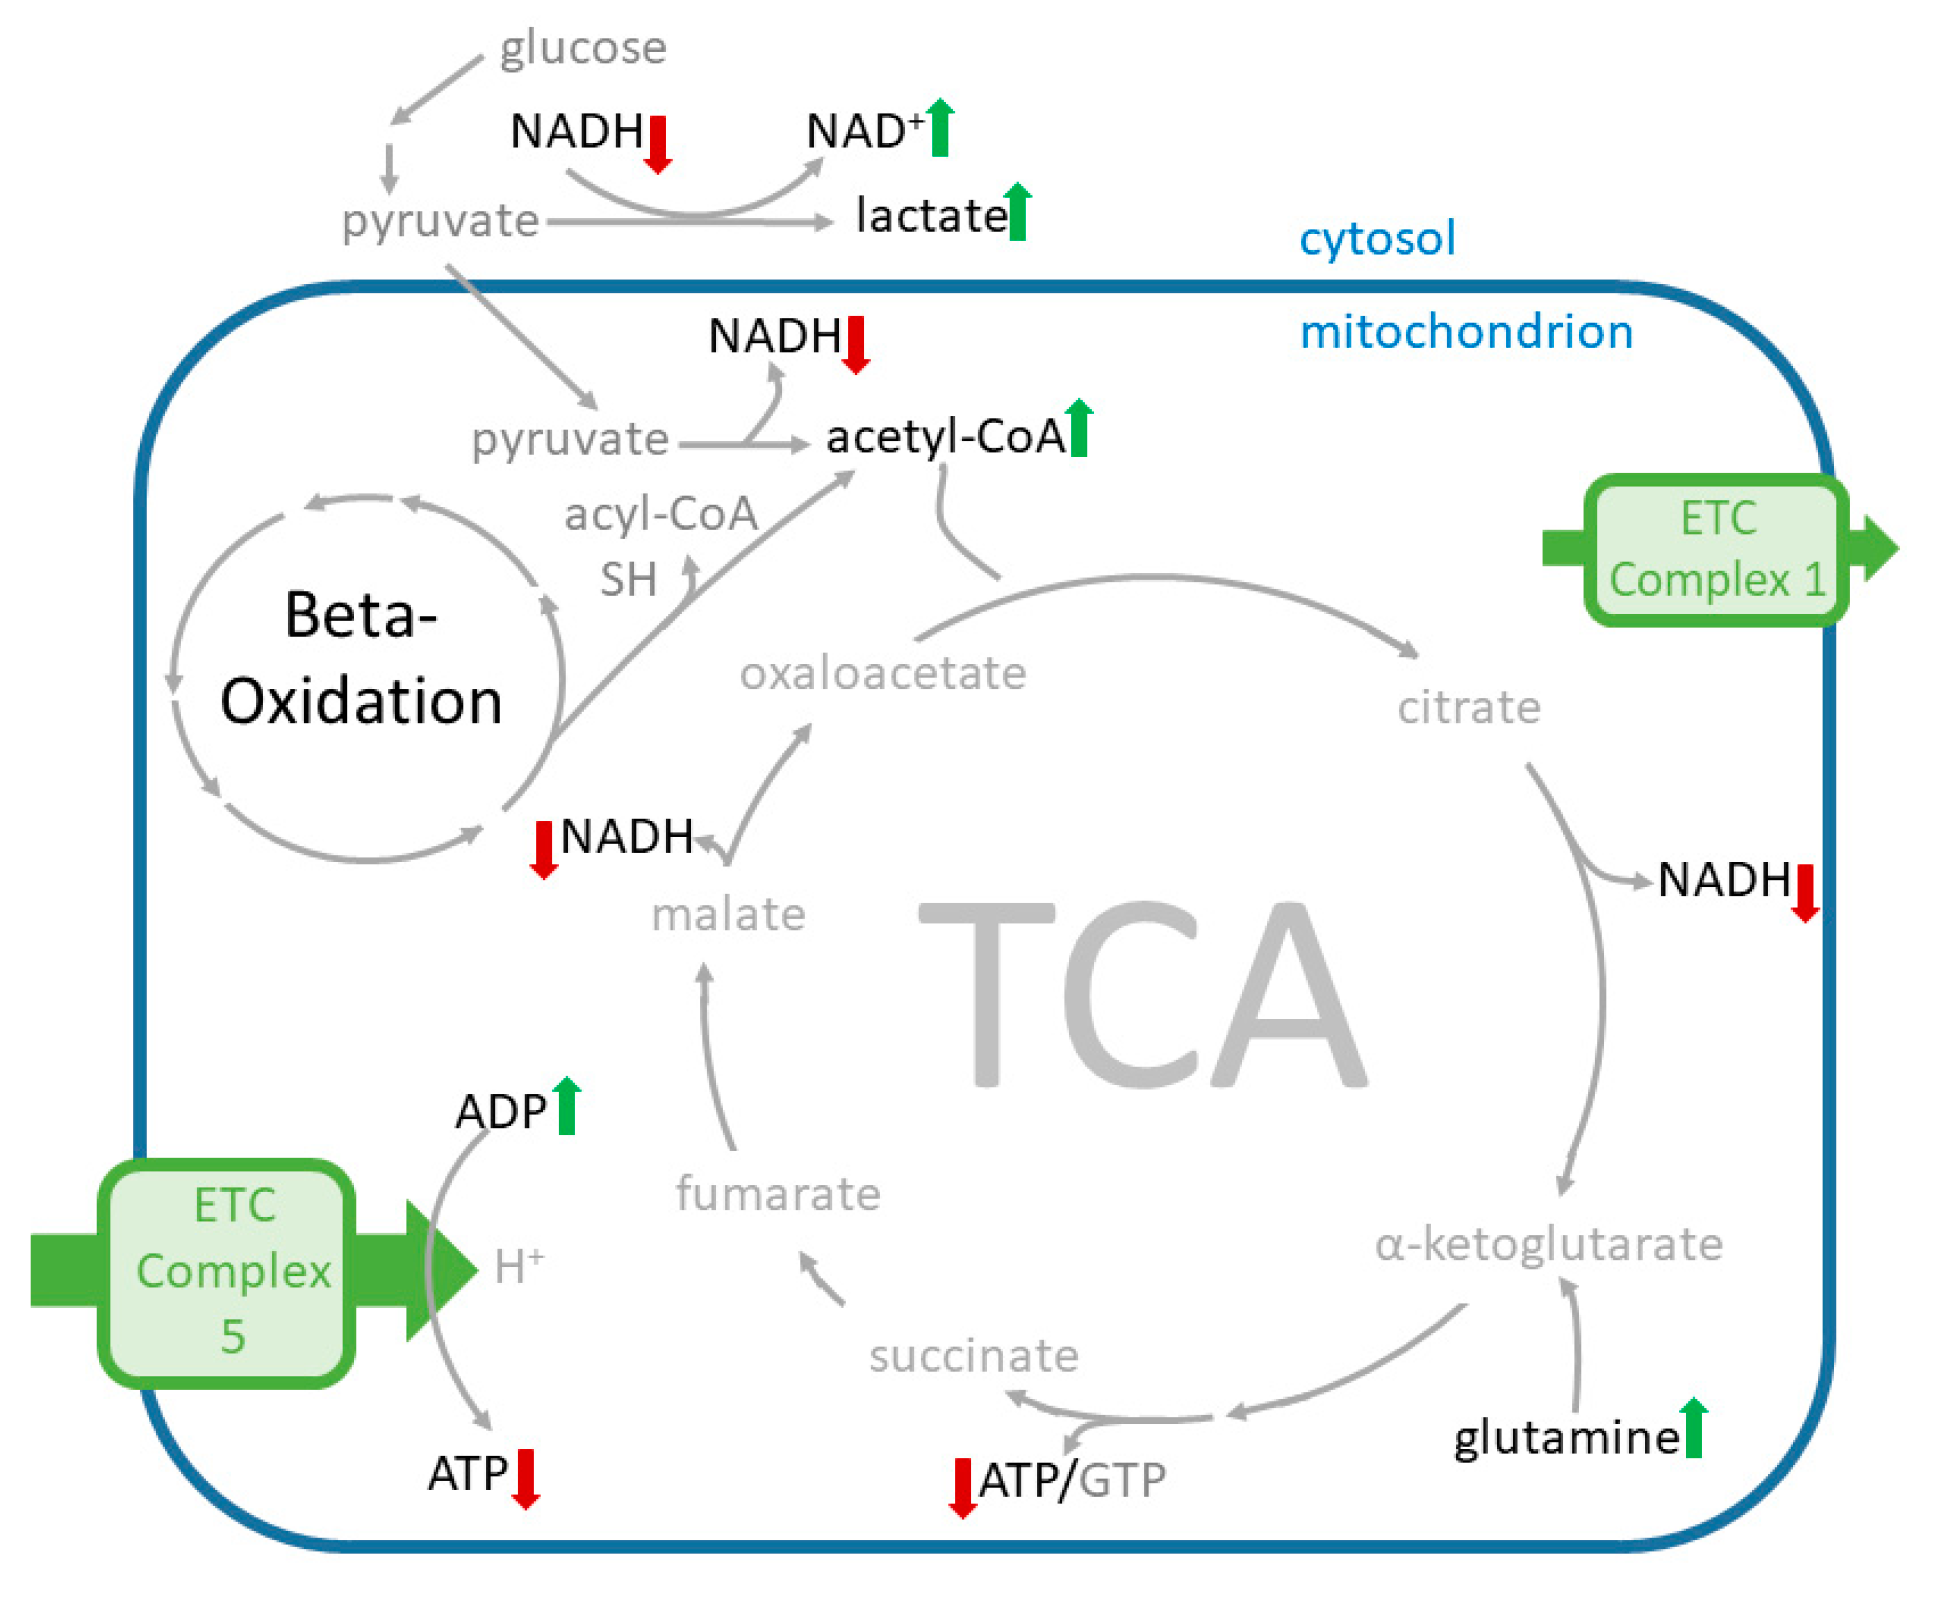
2.6.1. Effects of Cana on the Levels of Amino Acid Supplying the Tricarboxylic Acid Cycle (TCA) Cycle
2.6.2. Effects of Cana on Glycolysis Activity and Beta-Oxidation
2.6.3. Effects on Redox Equivalents
2.6.4. Effects on Metabolites Used in Apoptotic Pathways
2.6.5. Effects on Purine and Pyrimidine Pathway Activity
3. Discussion
4. Materials and Methods
4.1. SGLT2 Inhibitors and GLUT1 Inhibitor
4.2. Cell Lines and Cell Culture Conditions
4.3. Measurement of the OCR and the ECAR
4.4. Measurement of the ADP/ATP Ratio
4.5. Measurement of the GU
4.6. RNA Isolation and cDNA Synthesis
4.7. Metabolomics
4.8. Statistical Analyses
5. Conclusions
Supplementary Materials
Author Contributions
Funding
Institutional Review Board Statement
Informed Consent Statement
Data Availability Statement
Acknowledgments
Conflicts of Interest
References
- Hsia, D.S.; Grove, O.; Cefalu, W.T. An update on sodium-glucose co-transporter-2 inhibitors for the treatment of diabetes mellitus. Curr. Opin. Endocrinol. Diabetes Obes. 2017, 24, 73–79. [Google Scholar] [CrossRef] [PubMed]
- Nguyen, V.K.; White, J.R. Overview of Ertugliflozin. Clin. Diabetes 2019, 37, 176–178. [Google Scholar] [CrossRef] [PubMed]
- Inagaki, N.; Kondo, K.; Yoshinari, T.; Maruyama, N.; Susuta, Y.; Kuki, H. Efficacy and safety of canagliflozin in Japanese patients with type 2 diabetes: A randomized, double-blind, placebo-controlled, 12-week study. Diabetes Obes. Metab. 2013, 15, 1136–1145. [Google Scholar] [CrossRef] [PubMed]
- American Diabetes Association. 9. Pharmacologic Approaches to Glycemic Treatment: Standards of Medical Care in Diabetes-2020. Diabetes Care 2020, 43, S98–S110. [Google Scholar] [CrossRef] [Green Version]
- Davies, M.J.; D’Alessio, D.A.; Fradkin, J.; Kernan, W.N.; Mathieu, C.; Mingrone, G.; Rossing, P.; Tsapas, A.; Wexler, D.J.; Buse, J.B. Management of Hyperglycemia in Type 2 Diabetes, 2018. A Consensus Report by the American Diabetes Association (ADA) and the European Association for the Study of Diabetes (EASD). Diabetes Care 2018, 41, 2669–2701. [Google Scholar] [CrossRef] [PubMed] [Green Version]
- Lupsa, B.C.; Inzucchi, S.E. Use of SGLT2 inhibitors in type 2 diabetes: Weighing the risks and benefits. Diabetologia 2018, 61, 2118–2125. [Google Scholar] [CrossRef] [PubMed] [Green Version]
- Perkovic, V.; Jardine, M.J.; Neal, B.; Bompoint, S.; Heerspink, H.J.L.; Charytan, D.M.; Edwards, R.; Agarwal, R.; Bakris, G.; Bull, S.; et al. Canagliflozin and Renal Outcomes in Type 2 Diabetes and Nephropathy. N. Engl. J. Med. 2019, 380, 2295–2306. [Google Scholar] [CrossRef] [Green Version]
- Wiviott, S.D.; Raz, I.; Bonaca, M.P.; Mosenzon, O.; Kato, E.T.; Cahn, A.; Silverman, M.G.; Zelniker, T.A.; Kuder, J.F.; Murphy, S.A.; et al. Dapagliflozin and Cardiovascular Outcomes in Type 2 Diabetes. N. Engl. J. Med. 2019, 380, 347–357. [Google Scholar] [CrossRef]
- Cinti, F.; Moffa, S.; Impronta, F.; Cefalo, C.M.A.; Sun, V.A.; Sorice, G.P.; Mezza, T.; Giaccari, A. Spotlight on ertugliflozin and its potential in the treatment of type 2 diabetes: Evidence to date. Drug Des. Dev. Ther. 2017, ume 11, 2905–2919. [Google Scholar] [CrossRef] [Green Version]
- Ehrenkranz, J.R.L.; Lewis, N.; Kahn, C.R.; Roth, J. Phlorizin: A review. Diabetes/Metab. Res. Rev. 2005, 21, 31–38. [Google Scholar] [CrossRef]
- Rossetti, L.; Smith, D.; Shulman, G.I.; Papachristou, D.; DeFronzo, R.A. Correction of hyperglycemia with phlorizin normalizes tissue sensitivity to insulin in diabetic rats. J. Clin. Investig. 1987, 79, 1510–1515. [Google Scholar] [CrossRef] [PubMed]
- Fujimori, Y.; Katsuno, K.; Ojima, K.; Nakashima, I.; Nakano, S.; Ishikawa-Takemura, Y.; Kusama, H.; Isaji, M. Sergliflozin etabonate, a selective SGLT2 inhibitor, improves glycemic control in streptozotocin-induced diabetic rats and Zucker fatty rats. Eur. J. Pharmacol. 2009, 609, 148–154. [Google Scholar] [CrossRef] [PubMed]
- Liang, Y.; Arakawa, K.; Ueta, K.; Matsushita, Y.; Kuriyama, C.; Martin, T.; Du, F.; Liu, Y.; Xu, J.; Conway, B.; et al. Effect of Canagliflozin on Renal Threshold for Glucose, Glycemia, and Body Weight in Normal and Diabetic Animal Models. PLoS ONE 2012, 7, e30555. [Google Scholar] [CrossRef] [Green Version]
- Kaushal, S.; Singh, H.; Thangaraju, P.; Singh, J. Canagliflozin: A novel SGLT2 inhibitor for type 2 diabetes mellitus. N. Am. J. Med Sci. 2014, 6, 107–113. [Google Scholar] [CrossRef] [PubMed] [Green Version]
- Ohgaki, R.; Wei, L.; Yamada, K.; Hara, T.; Kuriyama, C.; Okuda, S.; Ueta, K.; Shiotani, M.; Nagamori, S.; Kanai, Y. Interaction of the Sodium/Glucose Cotransporter (SGLT) 2 inhibitor Canagliflozin with SGLT1 and SGLT2. J. Pharmacol. Exp. Ther. 2016, 358, 94–102. [Google Scholar] [CrossRef] [Green Version]
- Lapuerta, P.; Zambrowicz, B.; Strumph, P.; Sands, A. Development of sotagliflozin, a dual sodium-dependent glucose transporter 1/2 inhibitor. Diabetes Vasc. Dis. Res. 2015, 12, 101–110. [Google Scholar] [CrossRef] [Green Version]
- Bhatt, D.L.; Szarek, M.; Steg, P.G.; Cannon, C.P.; Leiter, L.A.; McGuire, D.K.; Lewis, J.B.; Riddle, M.C.; Voors, A.A.; Metra, M.; et al. Sotagliflozin in Patients with Diabetes and Recent Worsening Heart Failure. N. Engl. J. Med. 2021, 384, 117–128. [Google Scholar] [CrossRef]
- Bhatt, D.L.; Szarek, M.; Pitt, B.; Cannon, C.P.; Leiter, L.A.; McGuire, D.K.; Lewis, J.B.; Riddle, M.C.; Inzucchi, S.E.; Kosiborod, M.N.; et al. Sotagliflozin in Patients with Diabetes and Chronic Kidney Disease. N. Engl. J. Med. 2021, 384, 129–139. [Google Scholar] [CrossRef]
- Rieg, T.; Vallon, V. Development of SGLT1 and SGLT2 inhibitors. Diabetologia 2018, 61, 2079–2086. [Google Scholar] [CrossRef] [Green Version]
- Flores, E.; Santos-Gallego, C.G.; Diaz-Mejía, N.; Badimon, J.J. Do the SGLT-2 Inhibitors Offer More than Hypoglycemic Activity? Cardiovasc. Drugs Ther. 2018, 32, 213–222. [Google Scholar] [CrossRef]
- Osataphan, S.; Macchi, C.; Singhal, G.; Chimene-Weiss, J.; Sales, V.; Kozuka, C.; Dreyfuss, J.; Pan, H.; Tangcharoenpaisan, Y.; Morningstar, J.; et al. SGLT2 inhibition reprograms systemic metabolism via FGF21-dependent and -independent mechanisms. JCI Insight 2019, 4, e123130. [Google Scholar] [CrossRef] [PubMed] [Green Version]
- Zinman, B.; E Inzucchi, S.; Lachin, J.M.; Wanner, C.; Ferrari, R.; Fitchett, D.; Bluhmki, E.; Hantel, S.; Kempthorne-Rawson, J.; Newman, J.; et al. Rationale, design, and baseline characteristics of a randomized, placebo-controlled cardiovascular outcome trial of empagliflozin (EMPA-REG OUTCOME™). Cardiovasc. Diabetol. 2014, 13, 102. [Google Scholar] [CrossRef] [Green Version]
- Zinman, B.; Wanner, C.; Lachin, J.M.; Fitchett, D.; Bluhmki, E.; Hantel, S.; Mattheus, M.; Devins, T.; Johansen, O.E.; Woerle, H.J.; et al. Empagliflozin, Cardiovascular Outcomes, and Mortality in Type 2 Diabetes. N. Engl. J. Med. 2015, 373, 2117–2128. [Google Scholar] [CrossRef] [PubMed] [Green Version]
- Europäische Arzneimittelagentur. Zynquista–Zusammenfassung der Merkmale des Arzneimittels. 2021. Available online: https://www.ema.europa.eu/en/documents/product-information/zynquista-epar-product-information_de.pdf. (accessed on 20 April 2022).
- U.S. Food and Drug Administration. Proposal To Refuse To Approve a New Drug Application for Sotagliflozin Oral Tablets, 200 Milligrams and 400 Milligrams; Opportunity for a Hearing. Federal Register. 2021, 86, 12471–12473. [Google Scholar]
- Ferrannini, E.; Solini, A. SGLT2 inhibition in diabetes mellitus: Rationale and clinical prospects. Nat. Rev. Endocrinol. 2012, 8, 495–502. [Google Scholar] [CrossRef]
- Neal, B.; Perkovic, V.; Mahaffey, K.W.; de Zeeuw, D.; Fulcher, G.; Erondu, N.; Shaw, W.; Law, G.; Desai, M.; Matthews, D.R.; et al. Canagliflozin and Cardiovascular and Renal Events in Type 2 Diabetes. N. Engl. J. Med. 2017, 377, 644–657. [Google Scholar] [CrossRef]
- Fadini, G.P.; Avogaro, A. SGLT2 inhibitors and amputations in the US FDA Adverse Event Reporting System. Lancet Diabetes Endocrinol. 2017, 5, 680–681. [Google Scholar] [CrossRef] [Green Version]
- Birkeland, K.I.; Jørgensen, M.E.; Carstensen, B.; Persson, F.; Gulseth, H.L.; Thuresson, M.; Fenici, P.; Nathanson, D.; Nyström, T.; Eriksson, J.W.; et al. Cardiovascular mortality and morbidity in patients with type 2 diabetes following initiation of sodium-glucose co-transporter-2 inhibitors versus other glucose-lowering drugs (CVD-REAL Nordic): A multinational observational analysis. Lancet Diabetes Endocrinol. 2017, 5, 709–717. [Google Scholar] [CrossRef]
- U.S. FDA. FDA Drug Safety Communication: FDA Confirms Increased Risk of Leg and Foot Amputations with the Diabetes Medicine Canagliflozin (Invokana, Invokamet, Invokamet XR). Available online: https://www.fda.gov/media/104870/download (accessed on 20 April 2022).
- Hawley, S.A.; Ford, R.J.; Smith, B.K.; Gowans, G.J.; Mancini, S.J.; Pitt, R.D.; Day, E.A.; Salt, I.P.; Steinberg, G.R.; Hardie, D.G. The Na+/Glucose Cotransporter Inhibitor Canagliflozin Activates AMPK by Inhibiting Mitochondrial Function and Increasing Cellular AMP Levels. Diabetes 2016, 65, 2784–2794. [Google Scholar] [CrossRef] [Green Version]
- Villani, L.A.; Smith, B.K.; Marcinko, K.; Ford, R.J.; Broadfield, L.A.; Green, A.E.; Houde, V.P.; Muti, P.; Tsakiridis, T.; Steinberg, G.R. The diabetes medication Canagliflozin reduces cancer cell proliferation by inhibiting mitochondrial complex-I supported respiration. Mol. Metab. 2016, 5, 1048–1056. [Google Scholar] [CrossRef]
- Secker, P.F.; Beneke, S.; Schlichenmaier, N.; Delp, J.; Gutbier, S.; Leist, M.; Dietrich, D.R. Canagliflozin mediated dual inhibition of mitochondrial glutamate dehydrogenase and complex I: An off-target adverse effect. Cell Death Dis. 2018, 9, 226. [Google Scholar] [CrossRef] [PubMed] [Green Version]
- Uthman, L.; Homayr, A.; Juni, R.P.; Spin, E.L.; Kerindongo, R.; Boomsma, M.; Hollmann, M.W.; Preckel, B.; Koolwijk, P.; Van Hinsbergh, V.W.M.; et al. Empagliflozin and Dapagliflozin Reduce ROS Generation and Restore NO Bioavailability in Tumor Necrosis Factor α-Stimulated Human Coronary Arterial Endothelial Cells. Cell. Physiol. Biochem. 2019, 53, 865–886. [Google Scholar] [CrossRef] [PubMed]
- Behnammanesh, G.; Durante, Z.E.; Peyton, K.J.; Martinez-Lemus, L.A.; Brown, S.M.; Bender, S.B.; Durante, W. Canagliflozin Inhibits Human Endothelial Cell Proliferation and Tube Formation. Front. Pharmacol. 2019, 10, 362. [Google Scholar] [CrossRef] [PubMed]
- Nakano, D.; Kawaguchi, T.; Iwamoto, H.; Hayakawa, M.; Koga, H.; Torimura, T. Effects of canagliflozin on growth and metabolic reprograming in hepatocellular carcinoma cells: Multi-omics analysis of metabolomics and absolute quantification proteomics (iMPAQT). PLoS ONE 2020, 15, e0232283. [Google Scholar] [CrossRef]
- Mulder, S.; Hammarstedt, A.; Nagaraj, S.B.; Nair, V.; Ju, W.; Hedberg, J.; Greasley, P.J.; Eriksson, J.W.; Oscarsson, J.; Heerspink, H.J.L. A metabolomics-based molecular pathway analysis of how the sodium-glucose co-transporter-2 inhibitor dapagliflozin may slow kidney function decline in patients with diabetes. Diabetes Obes. Metab. 2020, 22, 1157–1166. [Google Scholar] [CrossRef]
- Tabit, C.E.; Chung, W.B.; Hamburg, N.M.; Vita, J.A. Endothelial dysfunction in diabetes mellitus: Molecular mechanisms and clinical implications. Rev. Endocr. Metab. Disord. 2010, 11, 61–74. [Google Scholar] [CrossRef] [Green Version]
- Paulus, W.J. Endothelial control of vascular and myocardial function in heart failure. Cardiovasc. Drugs Ther. 1994, 8, 437–446. [Google Scholar] [CrossRef]
- Vita, J.A.; Hamburg, N. Does endothelial dysfunction contribute to the clinical status of patients with peripheral arterial disease? Can. J. Cardiol. 2010, 26, 45A–50A. [Google Scholar] [CrossRef]
- Kopel, T.; Kaufman, J.S.; Hamburg, N.; Sampalis, J.S.; Vita, J.A.; Dember, L.M. Endothelium-Dependent and -Independent Vascular Function in Advanced Chronic Kidney Disease. Clin. J. Am. Soc. Nephrol. 2017, 12, 1588–1594. [Google Scholar] [CrossRef] [Green Version]
- Eelen, G.; De Zeeuw, P.; Treps, L.; Harjes, U.; Wong, B.; Carmeliet, P. Endothelial Cell Metabolism. Physiol. Rev. 2018, 98, 3–58. [Google Scholar] [CrossRef]
- Wishart, D.S.; Feunang, Y.D.; Marcu, A.; Guo, A.C.; Liang, K.; Vázquez-Fresno, R.; Sajed, T.; Johnson, D.; Li, C.; Karu, N.; et al. HMDB 4.0: The human metabolome database for 2018. Nucleic Acids Res. 2018, 46, D608–D617. [Google Scholar] [CrossRef] [PubMed]
- Koziel, A.; Woyda-Ploszczyca, A.; Kicinska, A.; Jarmuszkiewicz, W. The influence of high glucose on the aerobic metabolism of endothelial EA.hy926 cells. Pflügers Arch.-Eur. J. Physiol. 2012, 464, 657–669. [Google Scholar] [CrossRef] [Green Version]
- Davidson, S.M.; Duchen, M.R. Endothelial Mitochondria. Circ. Res. 2007, 100, 1128–1141. [Google Scholar] [CrossRef] [PubMed] [Green Version]
- De Bock, K.; Georgiadou, M.; Schoors, S.; Kuchnio, A.; Wong, B.W.; Cantelmo, A.R.; Quaegebeur, A.; Ghesquière, B.; Cauwenberghs, S.; Eelen, G.; et al. Role of PFKFB3-Driven Glycolysis in Vessel Sprouting. Cell 2013, 154, 651–663. [Google Scholar] [CrossRef] [PubMed] [Green Version]
- Davidson, S.M. Endothelial mitochondria and heart disease. Cardiovasc. Res. 2010, 88, 58–66. [Google Scholar] [CrossRef] [PubMed]
- Ruan, G.-X.; Kazlauskas, A. Lactate Engages Receptor Tyrosine Kinases Axl, Tie2, and Vascular Endothelial Growth Factor Receptor 2 to Activate Phosphoinositide 3-Kinase/Akt and Promote Angiogenesis. J. Biol. Chem. 2013, 288, 21161–21172. [Google Scholar] [CrossRef] [Green Version]
- Shetty, M.; Loeb, J.N.; Ismail-Beigi, F. Enhancement of glucose transport in response to inhibition of oxidative metabolism: Pre- and posttranslational mechanisms. Am. J. Physiol. Physiol. 1992, 262, C527–C532. [Google Scholar] [CrossRef]
- Zhou, L.; Cryan, E.V.; D’Andrea, M.R.; Belkowski, S.; Conway, B.R.; Demarest, K.T. Human cardiomyocytes express high level of Na+/glucose cotransporter 1 (SGLT1). J. Cell. Biochem. 2003, 90, 339–346. [Google Scholar] [CrossRef]
- Shetty, M.; Loeb, J.N.; Vikstrom, K.; Ismail-Beigi, F. Rapid activation of GLUT-1 glucose transporter following inhibition of oxidative phosphorylation in Clone 9 cells. J. Biol. Chem. 1993, 268, 17225–17232. [Google Scholar] [CrossRef]
- Hou, W.-L.; Yin, J.; Alimujiang, M.; Yu, X.-Y.; Ai, L.-G.; Bao, Y.-Q.; Liu, F.; Jia, W.-P. Inhibition of mitochondrial complex I improves glucose metabolism independently of AMPK activation. J. Cell. Mol. Med. 2018, 22, 1316–1328. [Google Scholar] [CrossRef] [Green Version]
- Krützfeldt, A.; Spahr, R.; Mertens, S.; Siegmund, B.; Piper, H. Metabolism of exogenous substrates by coronary endothelial cells in culture. J. Mol. Cell. Cardiol. 1990, 22, 1393–1404. [Google Scholar] [CrossRef]
- Vanova, K.H.; Kraus, M.; Neuzil, J.; Rohlena, J. Mitochondrial complex II and reactive oxygen species in disease and therapy. Redox Rep. 2020, 25, 26–32. [Google Scholar] [CrossRef] [PubMed] [Green Version]
- Pfleger, J.; He, M.; Abdellatif, M. Mitochondrial complex II is a source of the reserve respiratory capacity that is regulated by metabolic sensors and promotes cell survival. Cell Death Dis. 2015, 6, e1835. [Google Scholar] [CrossRef] [PubMed] [Green Version]
- Sen, S.; Roy, S.; Bandyopadhyay, G.; Scott, B.; Xiao, D.; Ramadoss, S.; Mahata, S.K.; Chaudhuri, G. γ-Aminobutyric Acid Is Synthesized and Released by the Endothelium. Circ. Res. 2016, 119, 621–634. [Google Scholar] [CrossRef] [PubMed]
- Unterluggauer, H.; Mazurek, S.; Lener, B.; Hütter, E.; Eigenbrodt, E.; Zwerschke, W.; Jansen-Dürr, P. Premature senescence of human endothelial cells induced by inhibition of glutaminase. Biogerontology 2008, 9, 247–259. [Google Scholar] [CrossRef] [PubMed]
- Yetkin-Arik, B.; Vogels, I.M.C.; Neyazi, N.; Van Duinen, V.; Houtkooper, R.H.; Van Noorden, C.J.F.; Klaassen, I.; Schlingemann, R.O. Endothelial tip cells in vitro are less glycolytic and have a more flexible response to metabolic stress than non-tip cells. Sci. Rep. 2019, 9, 10414. [Google Scholar] [CrossRef] [Green Version]
- Leopold, J.A.; Cap, A.; Scribner, A.W.; Stanton, R.C.; Loscalzo, J. Glucose-6-phosphate dehydrogenase deficiency promotes endothelial oxidant stress and decreases endothelial nitric oxide bioavailability. FASEB J. 2001, 15, 1771–1773. [Google Scholar] [CrossRef] [Green Version]
- Stack, A.G.; Han, D.; Goldwater, R.; Johansson, S.; Dronamraju, N.; Oscarsson, J.; Johnsson, E.; Parkinson, J.; Erlandsson, F. Dapagliflozin Added to Verinurad Plus Febuxostat Further Reduces Serum Uric Acid in Hyperuricemia: The QUARTZ Study. J. Clin. Endocrinol. Metab. 2021, 106, e2347–e2356. [Google Scholar] [CrossRef]
- Devineni, D.; Curtin, C.R.; Polidori, D.; Gutierrez, M.J.; Murphy, J.; Rusch, S.; Rothenberg, P.L. Pharmacokinetics and Pharmacodynamics of Canagliflozin, a Sodium Glucose Co-Transporter 2 Inhibitor, in Subjects With Type 2 Diabetes Mellitus. J. Clin. Pharmacol. 2013, 53, 601–610. [Google Scholar] [CrossRef]
- Iijima, H.; Kifuji, T.; Maruyama, N.; Inagaki, N. Pharmacokinetics, Pharmacodynamics, and Safety of Canagliflozin in Japanese Patients with Type 2 Diabetes Mellitus. Adv. Ther. 2015, 32, 768–782. [Google Scholar] [CrossRef] [Green Version]
- Komoroski, B.; Vachharajani, N.; Boulton, D.; Kornhauser, D.; Geraldes, M.; Li, L.; Pfister, M. Dapagliflozin, a Novel SGLT2 Inhibitor, Induces Dose-Dependent Glucosuria in Healthy Subjects. Clin. Pharmacol. Ther. 2009, 85, 520–526. [Google Scholar] [CrossRef] [PubMed]
- Sahasrabudhe, V.; Terra, S.G.; Hickman, A.; Saur, D.; Shi, H.; O’Gorman, M.; Zhou, Z.; Cutler, D.L. The Effect of Renal Impairment on the Pharmacokinetics and Pharmacodynamics of Ertugliflozin in Subjects With Type 2 Diabetes Mellitus. J. Clin. Pharmacol. 2017, 57, 1432–1443. [Google Scholar] [CrossRef] [PubMed] [Green Version]
- Heise, T.; Seman, L.J.; Macha, S.; Jones, P.; Marquart, A.; Pinnetti, S.; Woerle, H.J.; Dugi, K. Safety, Tolerability, Pharmacokinetics, and Pharmacodynamics of Multiple Rising Doses of Empagliflozin in Patients with Type 2 Diabetes Mellitus. Diabetes Ther. 2013, 4, 331–345. [Google Scholar] [CrossRef] [Green Version]
- Fu, X.; Zhang, G.; Liu, R.; Wei, J.; Zhang-Negrerie, D.; Jian, X.; Gao, Q. Mechanistic Study of Human Glucose Transport Mediated by GLUT1. J. Chem. Inf. Model. 2016, 56, 517–526. [Google Scholar] [CrossRef] [PubMed]
- Medina, R.A.; Owen, G.I. Glucose transporters: Expression, regulation and cancer. Biol. Res. 2002, 35, 9–26. [Google Scholar] [CrossRef] [PubMed]
- Siebeneicher, H.; Cleve, A.; Rehwinkel, H.; Neuhaus, R.; Heisler, I.; Müller, T.; Bauser, M.; Buchmann, B. Identification and Optimization of the First Highly Selective GLUT1 Inhibitor BAY-876. ChemMedChem 2016, 11, 2261–2271. [Google Scholar] [CrossRef] [Green Version]
- Bordag, N.; Rennfahrt, U.; Nachtigall, J.; Maldonado, S.; Reszka, R.; Ramirez-Hernandez, T.; Kamp, H.; Fux, E.; Van Ravenzwaay, B. Fast Sampling of Adherent Cell Cultures for Optimal Metabolomics Results. Metabolomics 2016, 6, 1–4. [Google Scholar] [CrossRef] [Green Version]
- Vogel, F.C.; Bordag, N.; Zügner, E.; Trajkovic-Arsic, M.; Chauvistré, H.; Shannan, B.; Váraljai, R.; Horn, S.; Magnes, C.; Siveke, J.T.; et al. Targeting the H3K4 Demethylase KDM5B Reprograms the Metabolome and Phenotype of Melanoma Cells. J. Investig. Dermatol. 2019, 139, 2506–2516.e10. [Google Scholar] [CrossRef]
- Buescher, J.M.; Moco, S.; Sauer, U.; Zamboni, N. Ultrahigh Performance Liquid Chromatography−Tandem Mass Spectrometry Method for Fast and Robust Quantification of Anionic and Aromatic Metabolites. Anal. Chem. 2010, 82, 4403–4412. [Google Scholar] [CrossRef]
- Trausinger, G.; Gruber, C.; Krahulec, S.; Magnes, C.; Nidetzky, B.; Klimacek, M. Identification of novel metabolic interactions controlling carbon flux from xylose to ethanol in natural and recombinant yeasts. Biotechnol. Biofuels 2015, 8, 157. [Google Scholar] [CrossRef] [Green Version]
- Chambers, M.C.; Maclean, B.; Burke, R.; Amodei, D.; Ruderman, D.L.; Neumann, S.; Gatto, L.; Fischer, B.; Pratt, B.; Egertson, J.; et al. A cross-platform toolkit for mass spectrometry and proteomics. Nat. Biotechnol. 2012, 30, 918–920. [Google Scholar] [CrossRef] [PubMed]
- Fröhlich, E.E.; Farzi, A.; Mayerhofer, R.; Reichmann, F.; Jačan, A.; Wagner, B.; Zinser, E.; Bordag, N.; Magnes, C.; Fröhlich, E.; et al. Cognitive impairment by antibiotic-induced gut dysbiosis: Analysis of gut microbiota-brain communication. Brain, Behav. Immun. 2016, 56, 140–155. [Google Scholar] [CrossRef] [PubMed] [Green Version]
- Mueller, K.M.; Hartmann, K.; Kaltenecker, D.; Vettorazzi, S.; Bauer, M.; Mauser, L.; Amann, S.; Jall, S.; Fischer, K.; Esterbauer, H.; et al. Adipocyte glucocorticoid receptor deficiency attenuates aging- and HFD-induced obesity, and impairs the feeding-fasting transition. Diabetes 2017, 66, 272–286. [Google Scholar] [CrossRef] [PubMed] [Green Version]


Publisher’s Note: MDPI stays neutral with regard to jurisdictional claims in published maps and institutional affiliations. |
© 2022 by the authors. Licensee MDPI, Basel, Switzerland. This article is an open access article distributed under the terms and conditions of the Creative Commons Attribution (CC BY) license (https://creativecommons.org/licenses/by/4.0/).
Share and Cite
Zügner, E.; Yang, H.-C.; Kotzbeck, P.; Boulgaropoulos, B.; Sourij, H.; Hagvall, S.; Elmore, C.S.; Esterline, R.; Moosmang, S.; Oscarsson, J.; et al. Differential In Vitro Effects of SGLT2 Inhibitors on Mitochondrial Oxidative Phosphorylation, Glucose Uptake and Cell Metabolism. Int. J. Mol. Sci. 2022, 23, 7966. https://doi.org/10.3390/ijms23147966
Zügner E, Yang H-C, Kotzbeck P, Boulgaropoulos B, Sourij H, Hagvall S, Elmore CS, Esterline R, Moosmang S, Oscarsson J, et al. Differential In Vitro Effects of SGLT2 Inhibitors on Mitochondrial Oxidative Phosphorylation, Glucose Uptake and Cell Metabolism. International Journal of Molecular Sciences. 2022; 23(14):7966. https://doi.org/10.3390/ijms23147966
Chicago/Turabian StyleZügner, Elmar, Hsiu-Chiung Yang, Petra Kotzbeck, Beate Boulgaropoulos, Harald Sourij, Sepideh Hagvall, Charles S. Elmore, Russell Esterline, Sven Moosmang, Jan Oscarsson, and et al. 2022. "Differential In Vitro Effects of SGLT2 Inhibitors on Mitochondrial Oxidative Phosphorylation, Glucose Uptake and Cell Metabolism" International Journal of Molecular Sciences 23, no. 14: 7966. https://doi.org/10.3390/ijms23147966