
Layer-by-Layer Investigation of Ultrastructures and Biomechanics of Human Cornea

 and
and 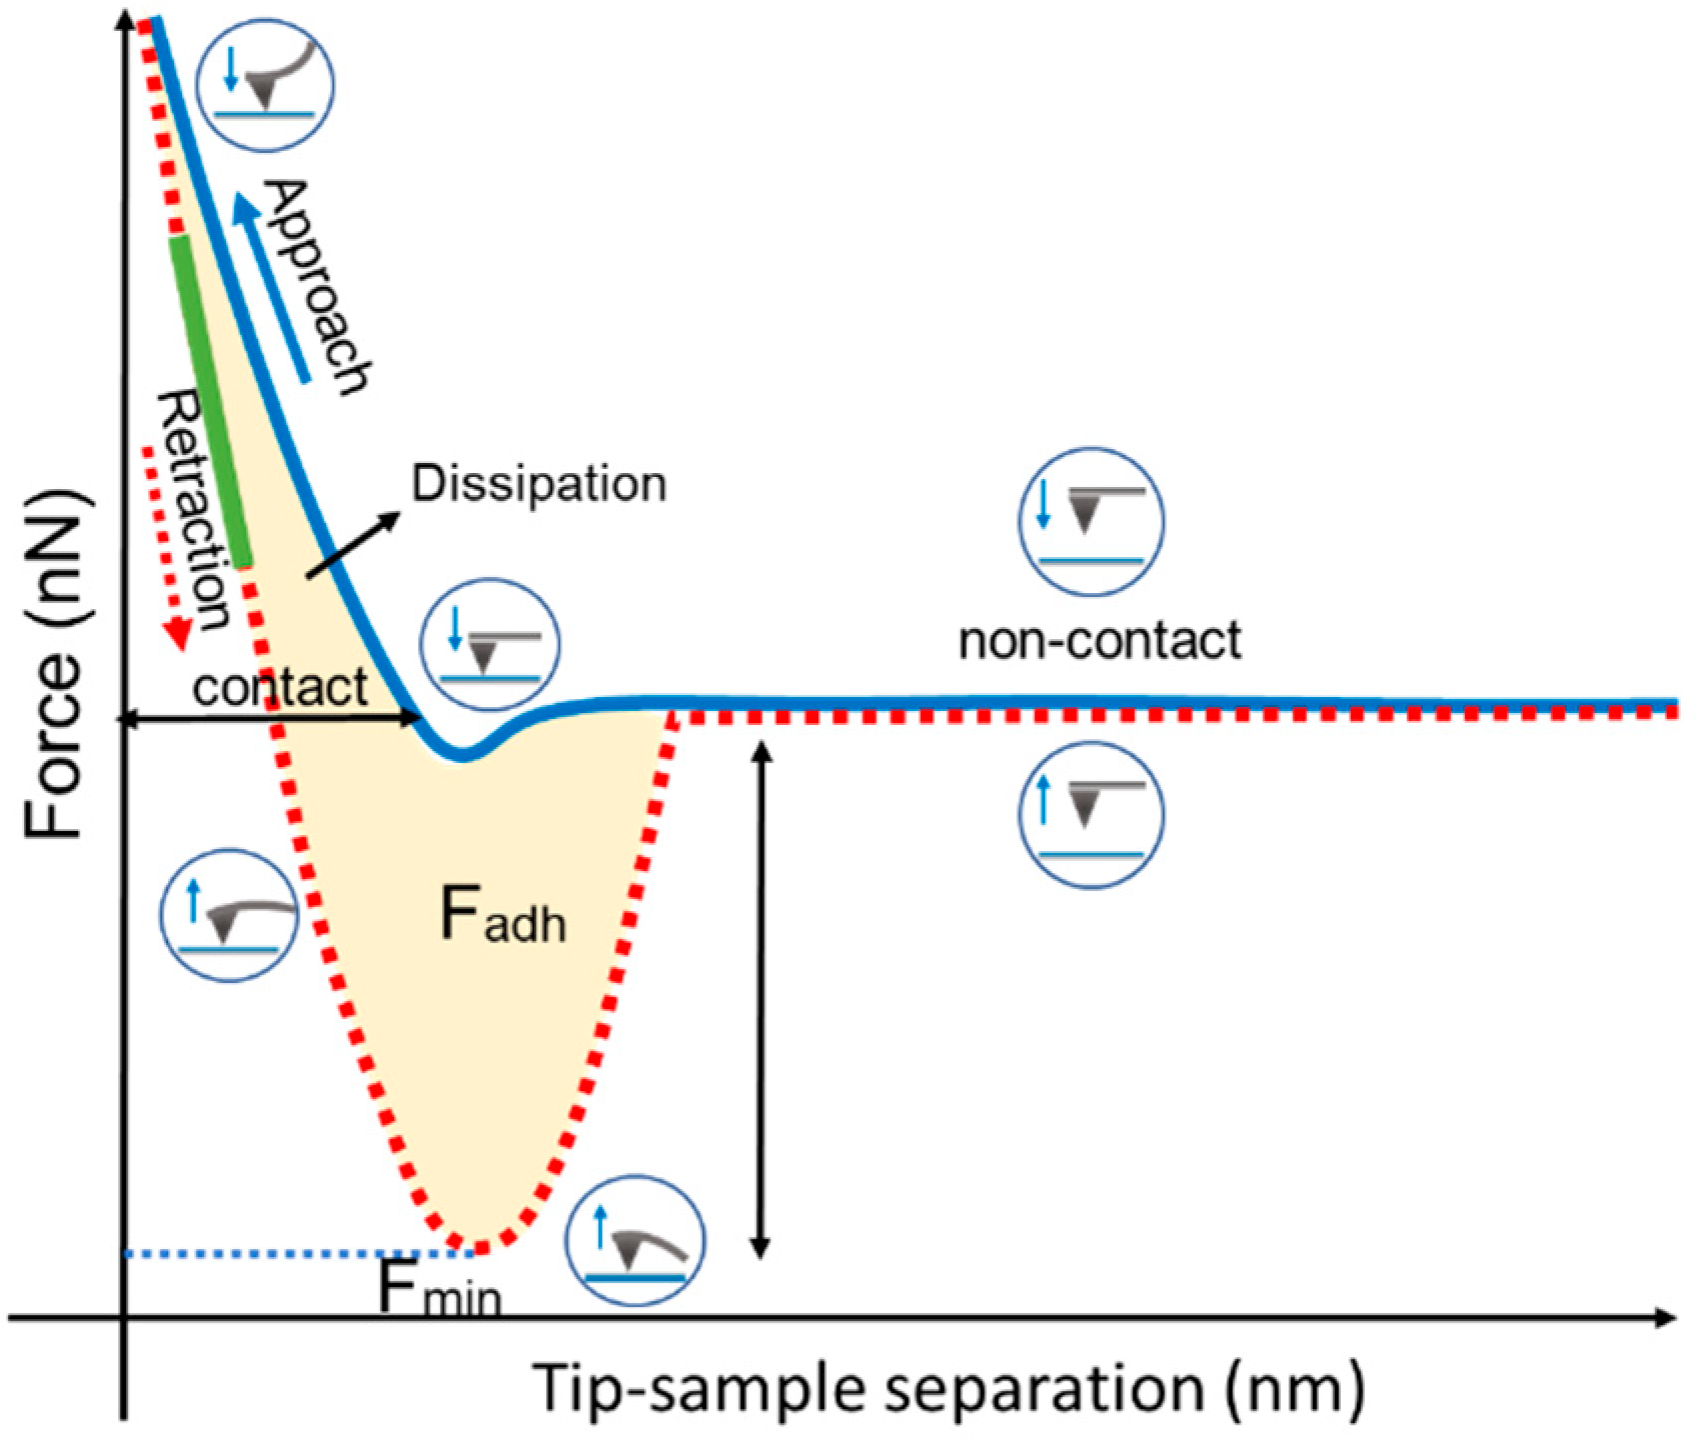
Abstract
:1. Introduction
2. Materials and Methods
2.1. Ethical
2.2. Sample Acquisition and Preparation
2.3. Atomic Force Microscopy (AFM) Ultrastructural and Nanomechanical Experiments
2.3.1. AFM Setup
2.3.2. Ultrastructure Analysis
Diameter Analysis
2.3.3. Nanomechanical Analysis
2.3.4. Statistical Analysis
3. Results
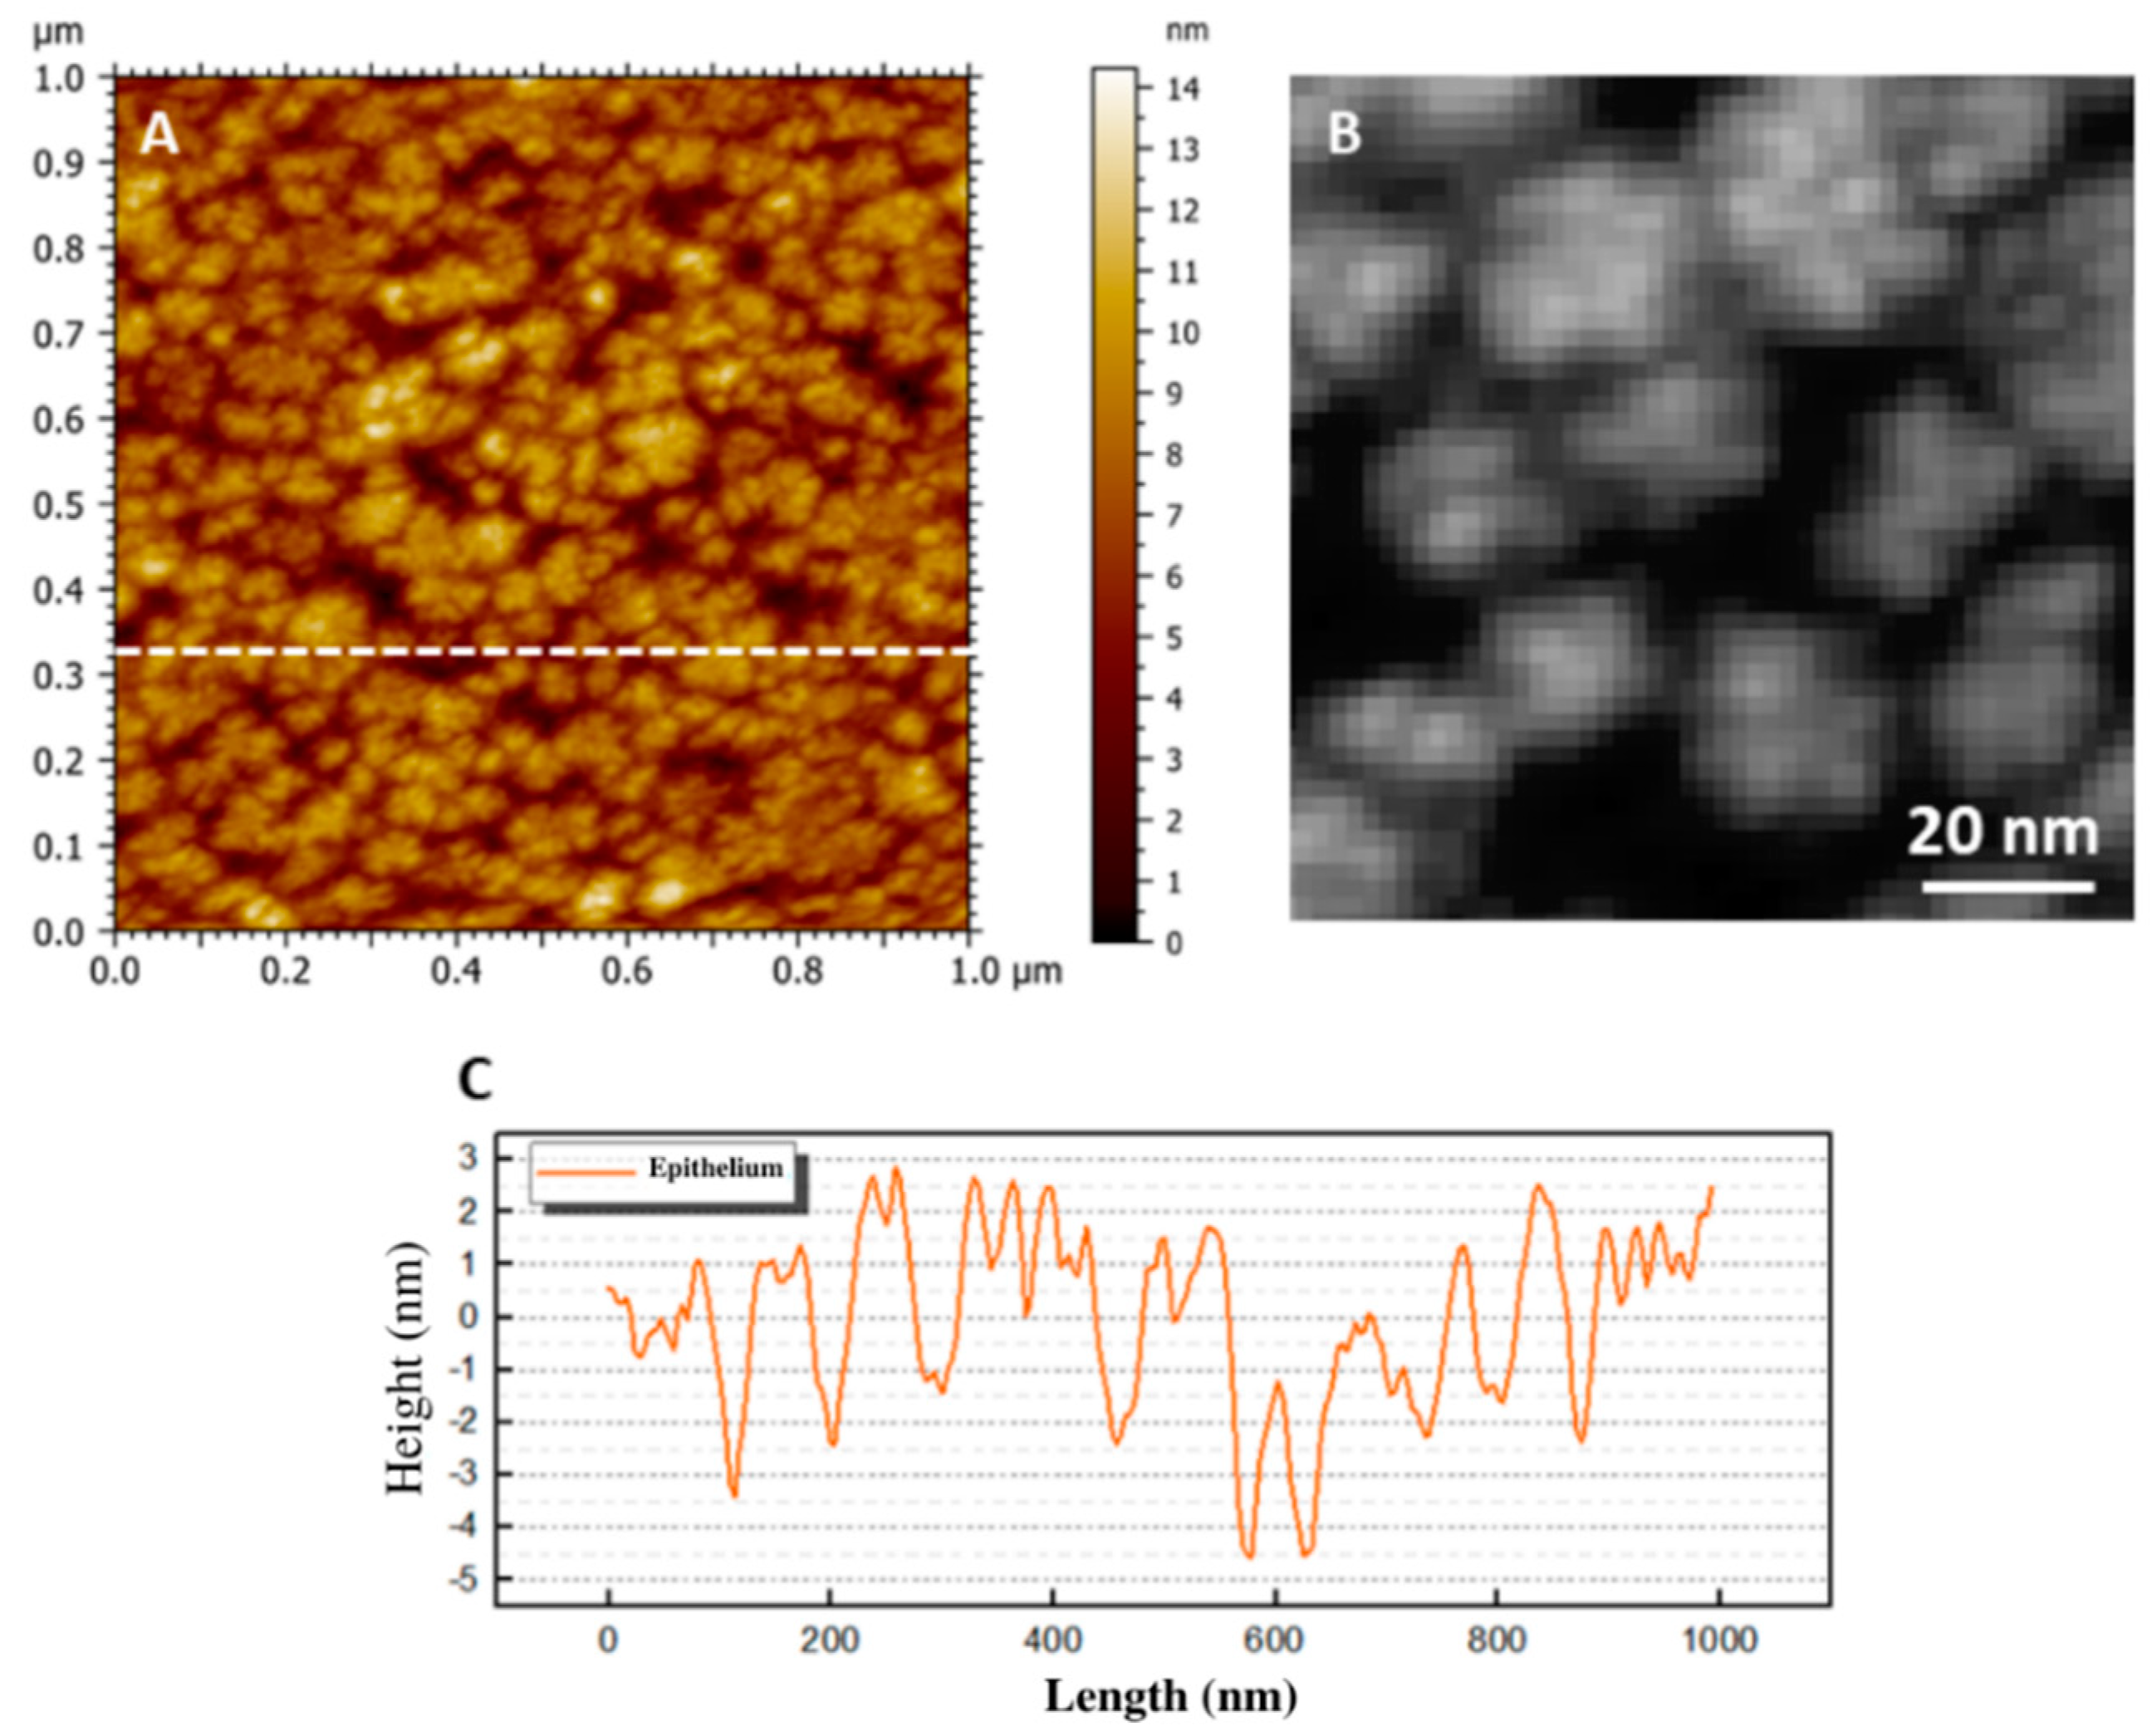
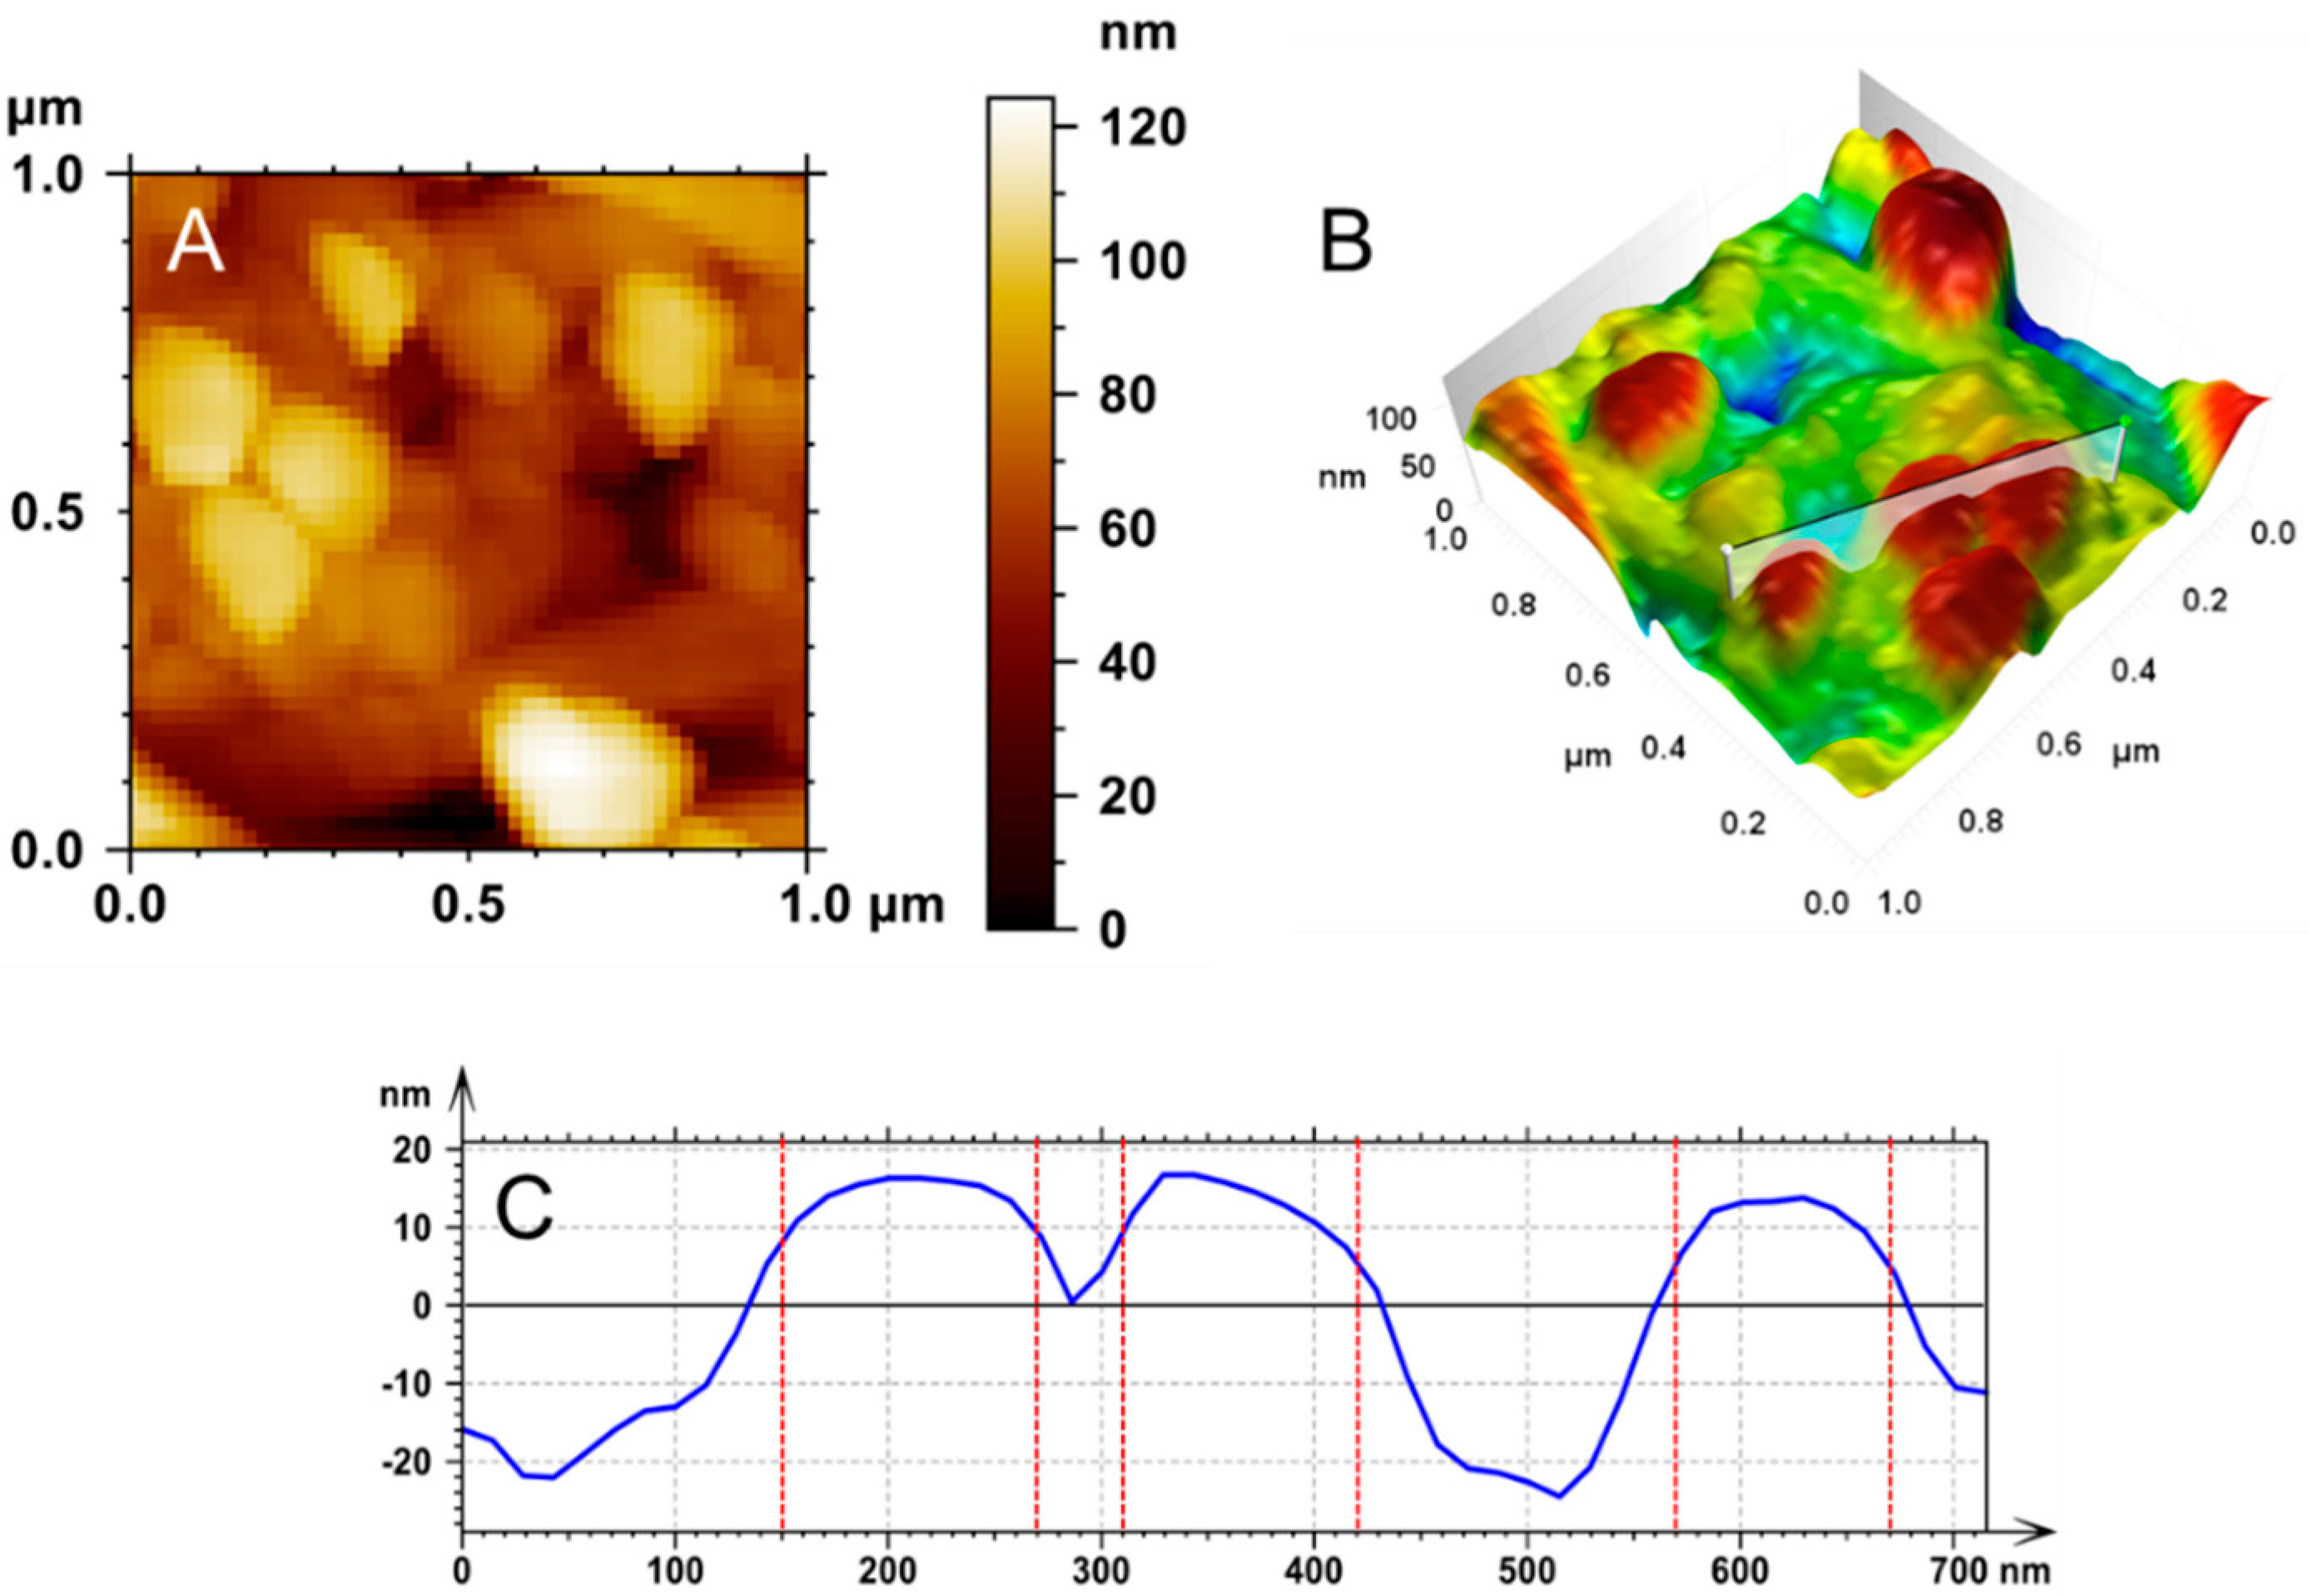
3.1. Epithelial Layer
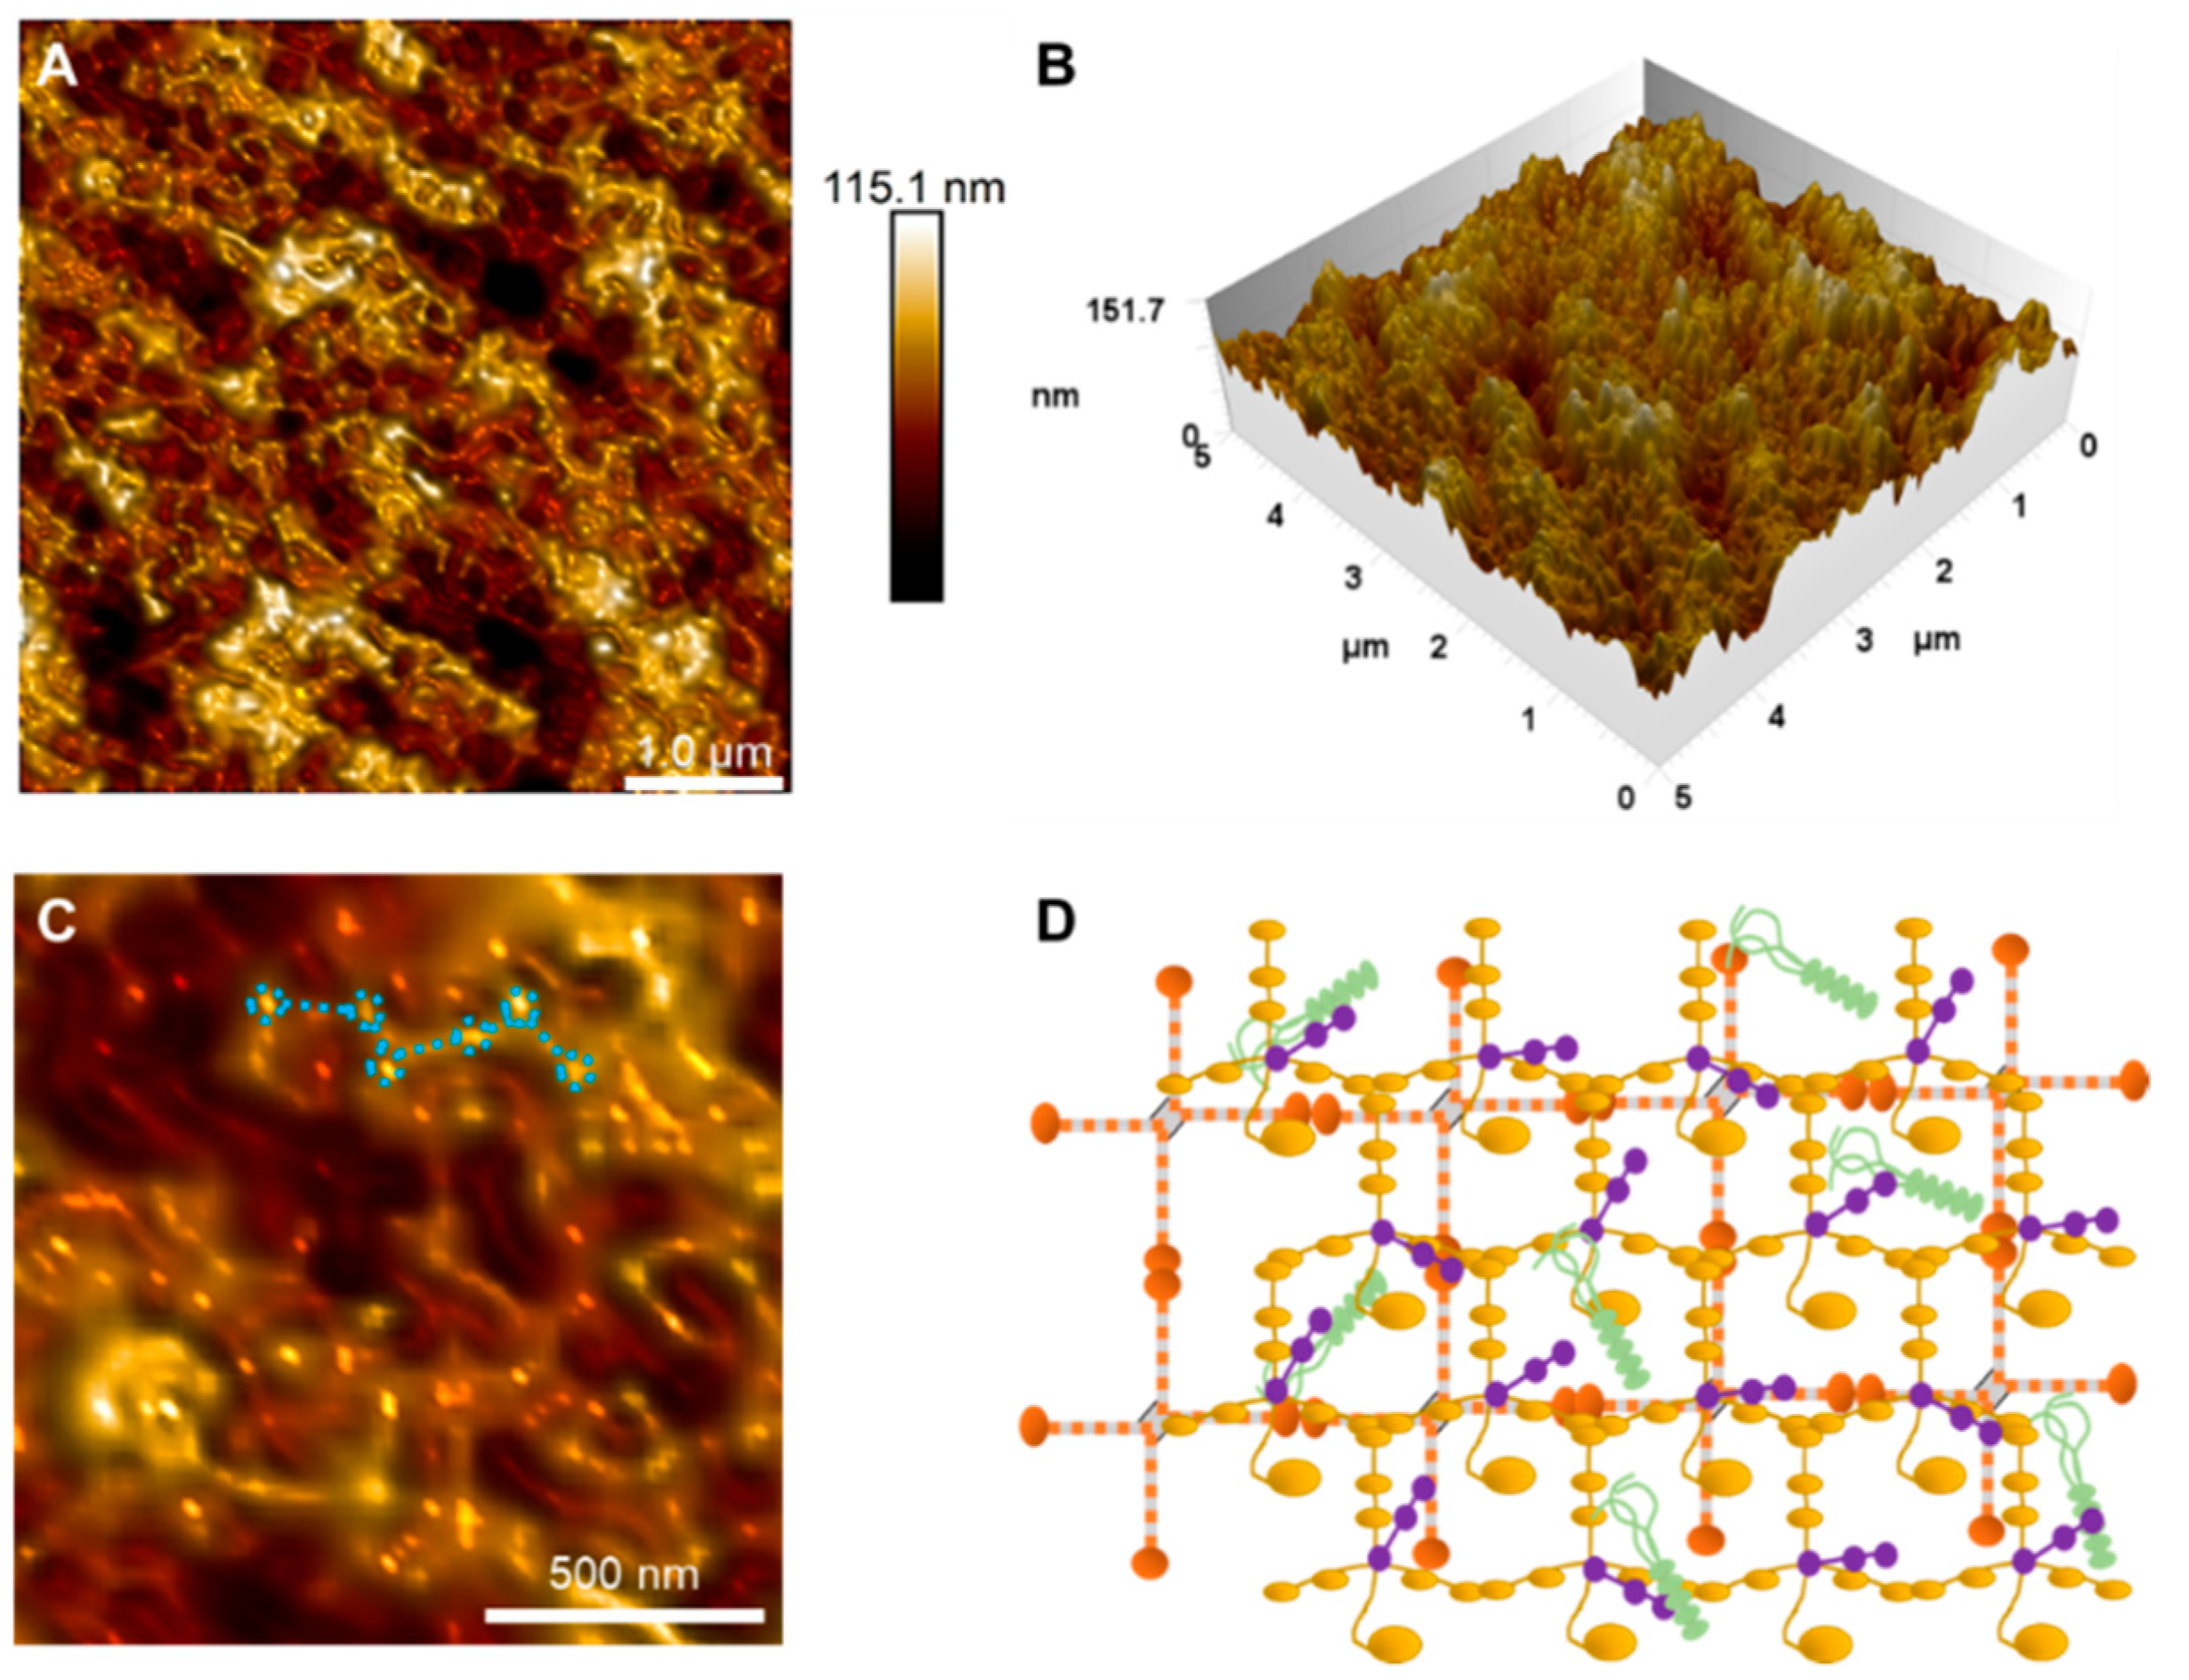
Epithelial Basement Membrane
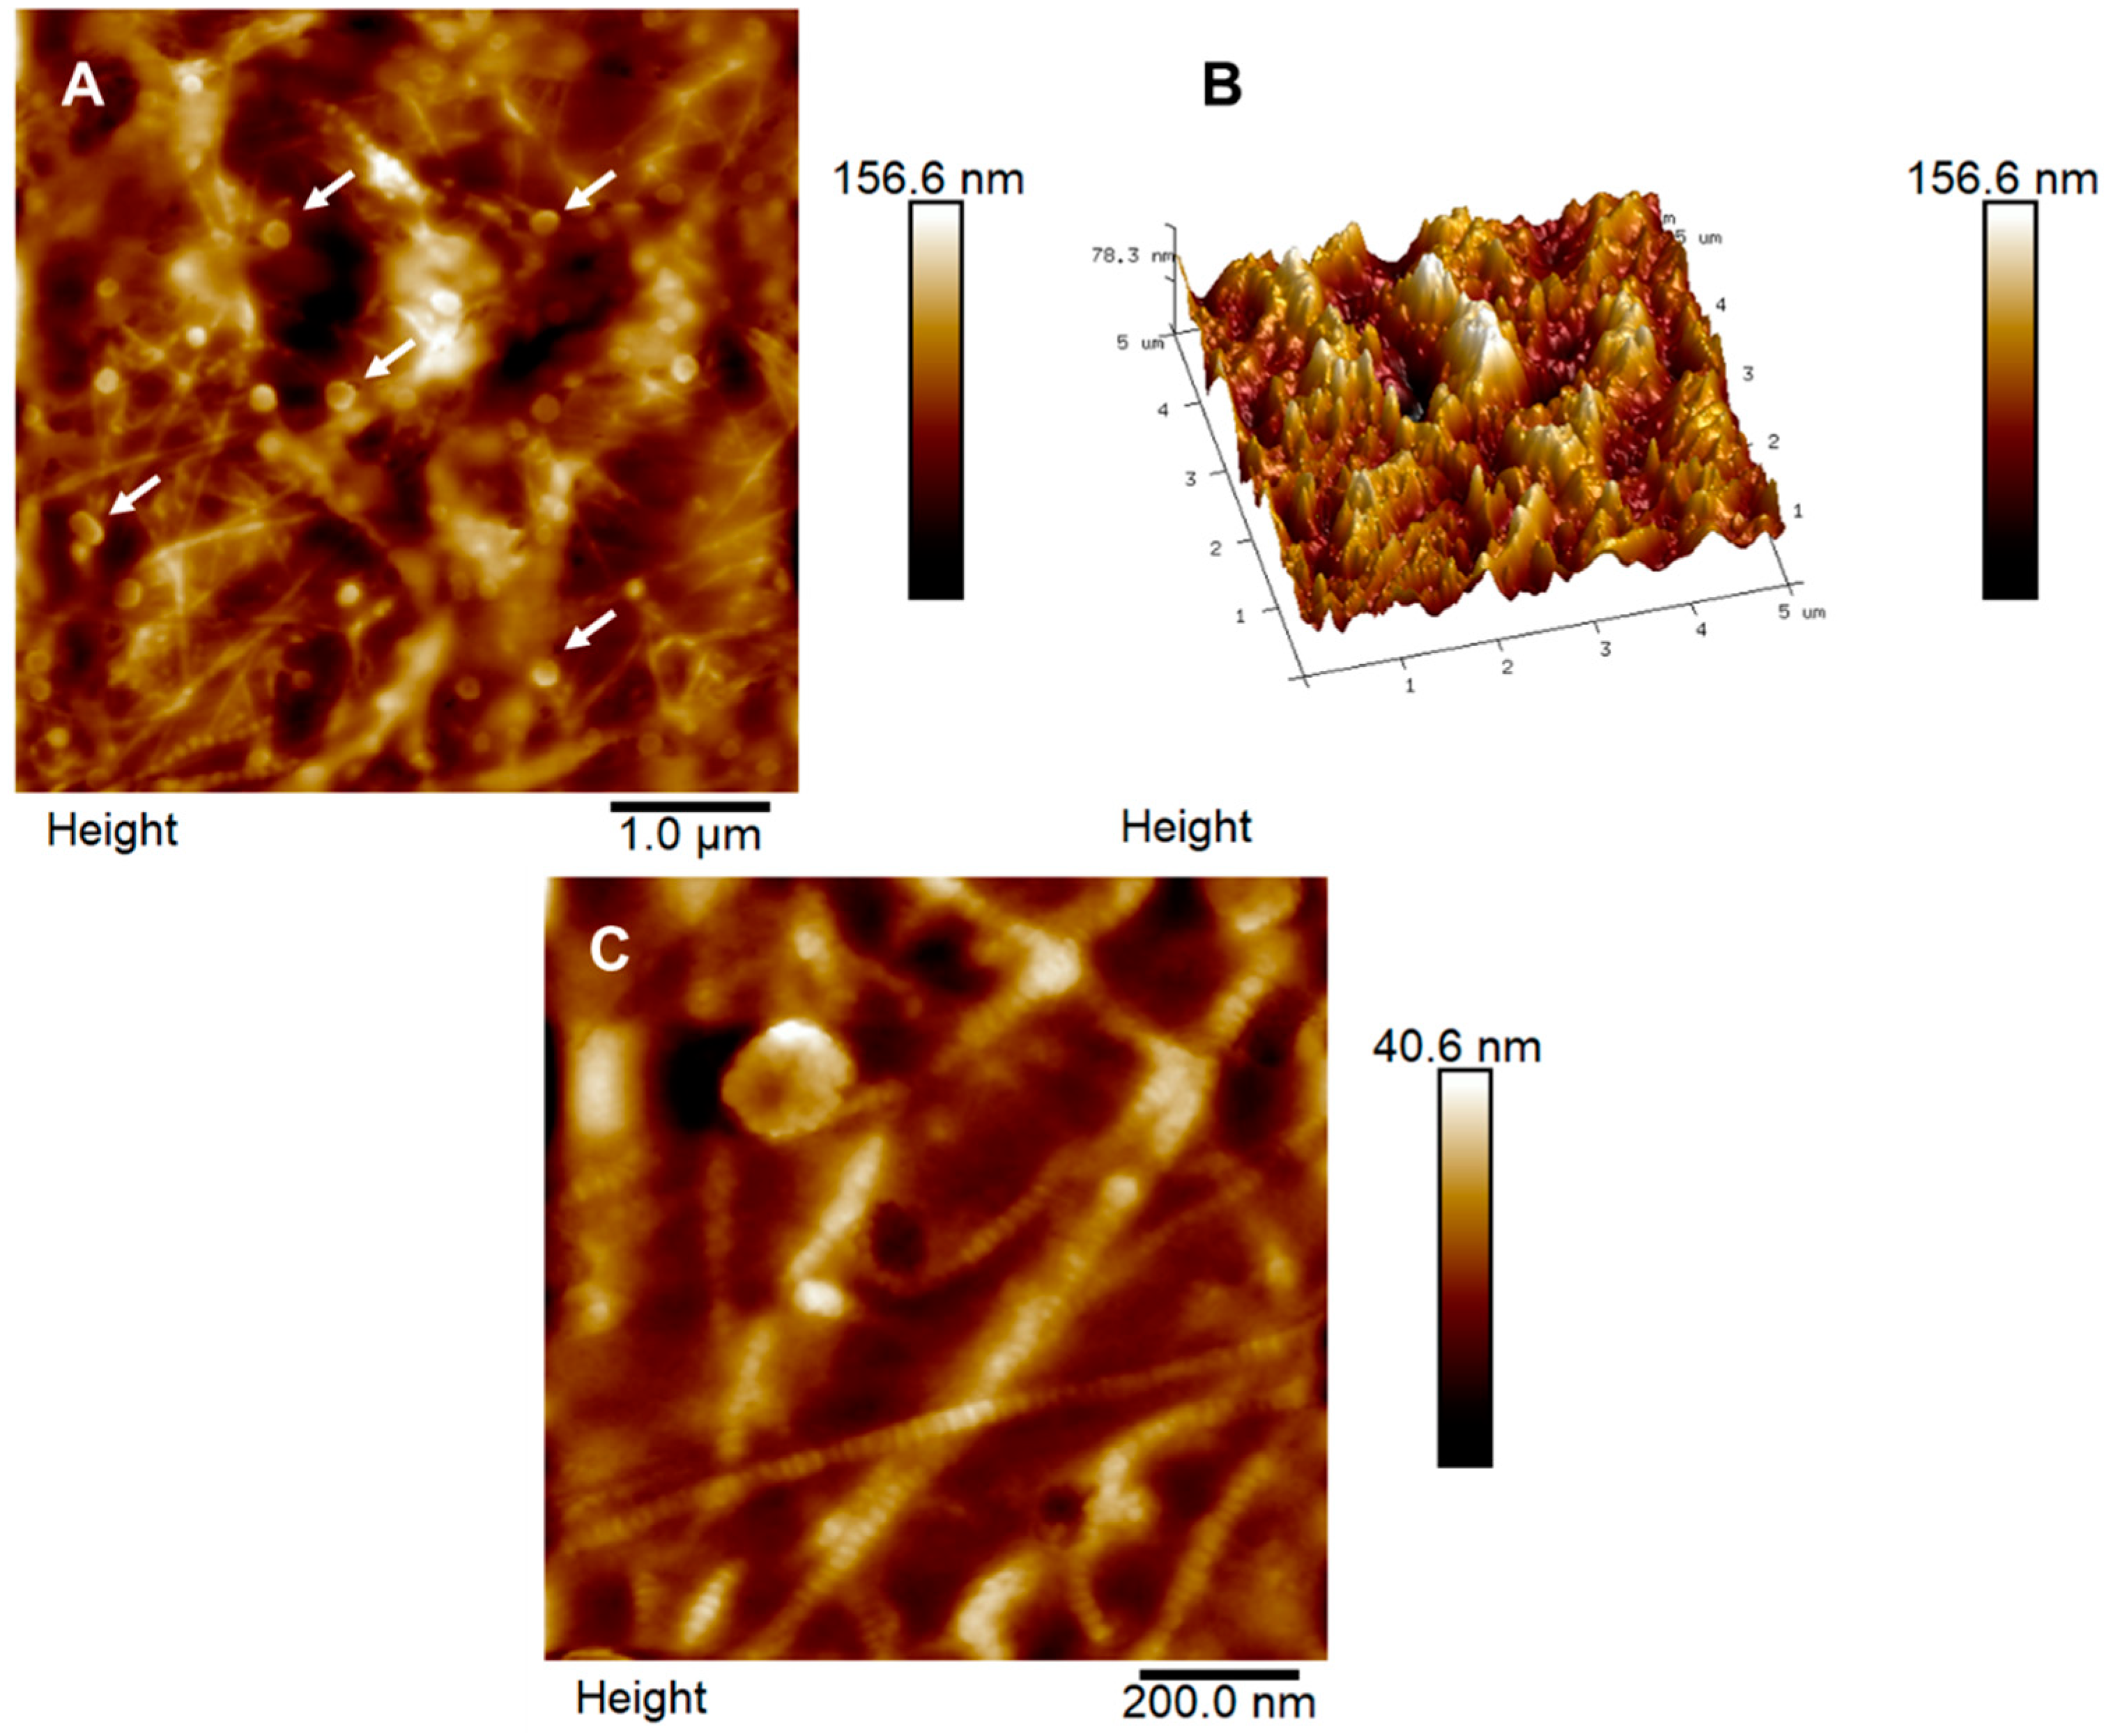
3.2. Bowman’s Layer
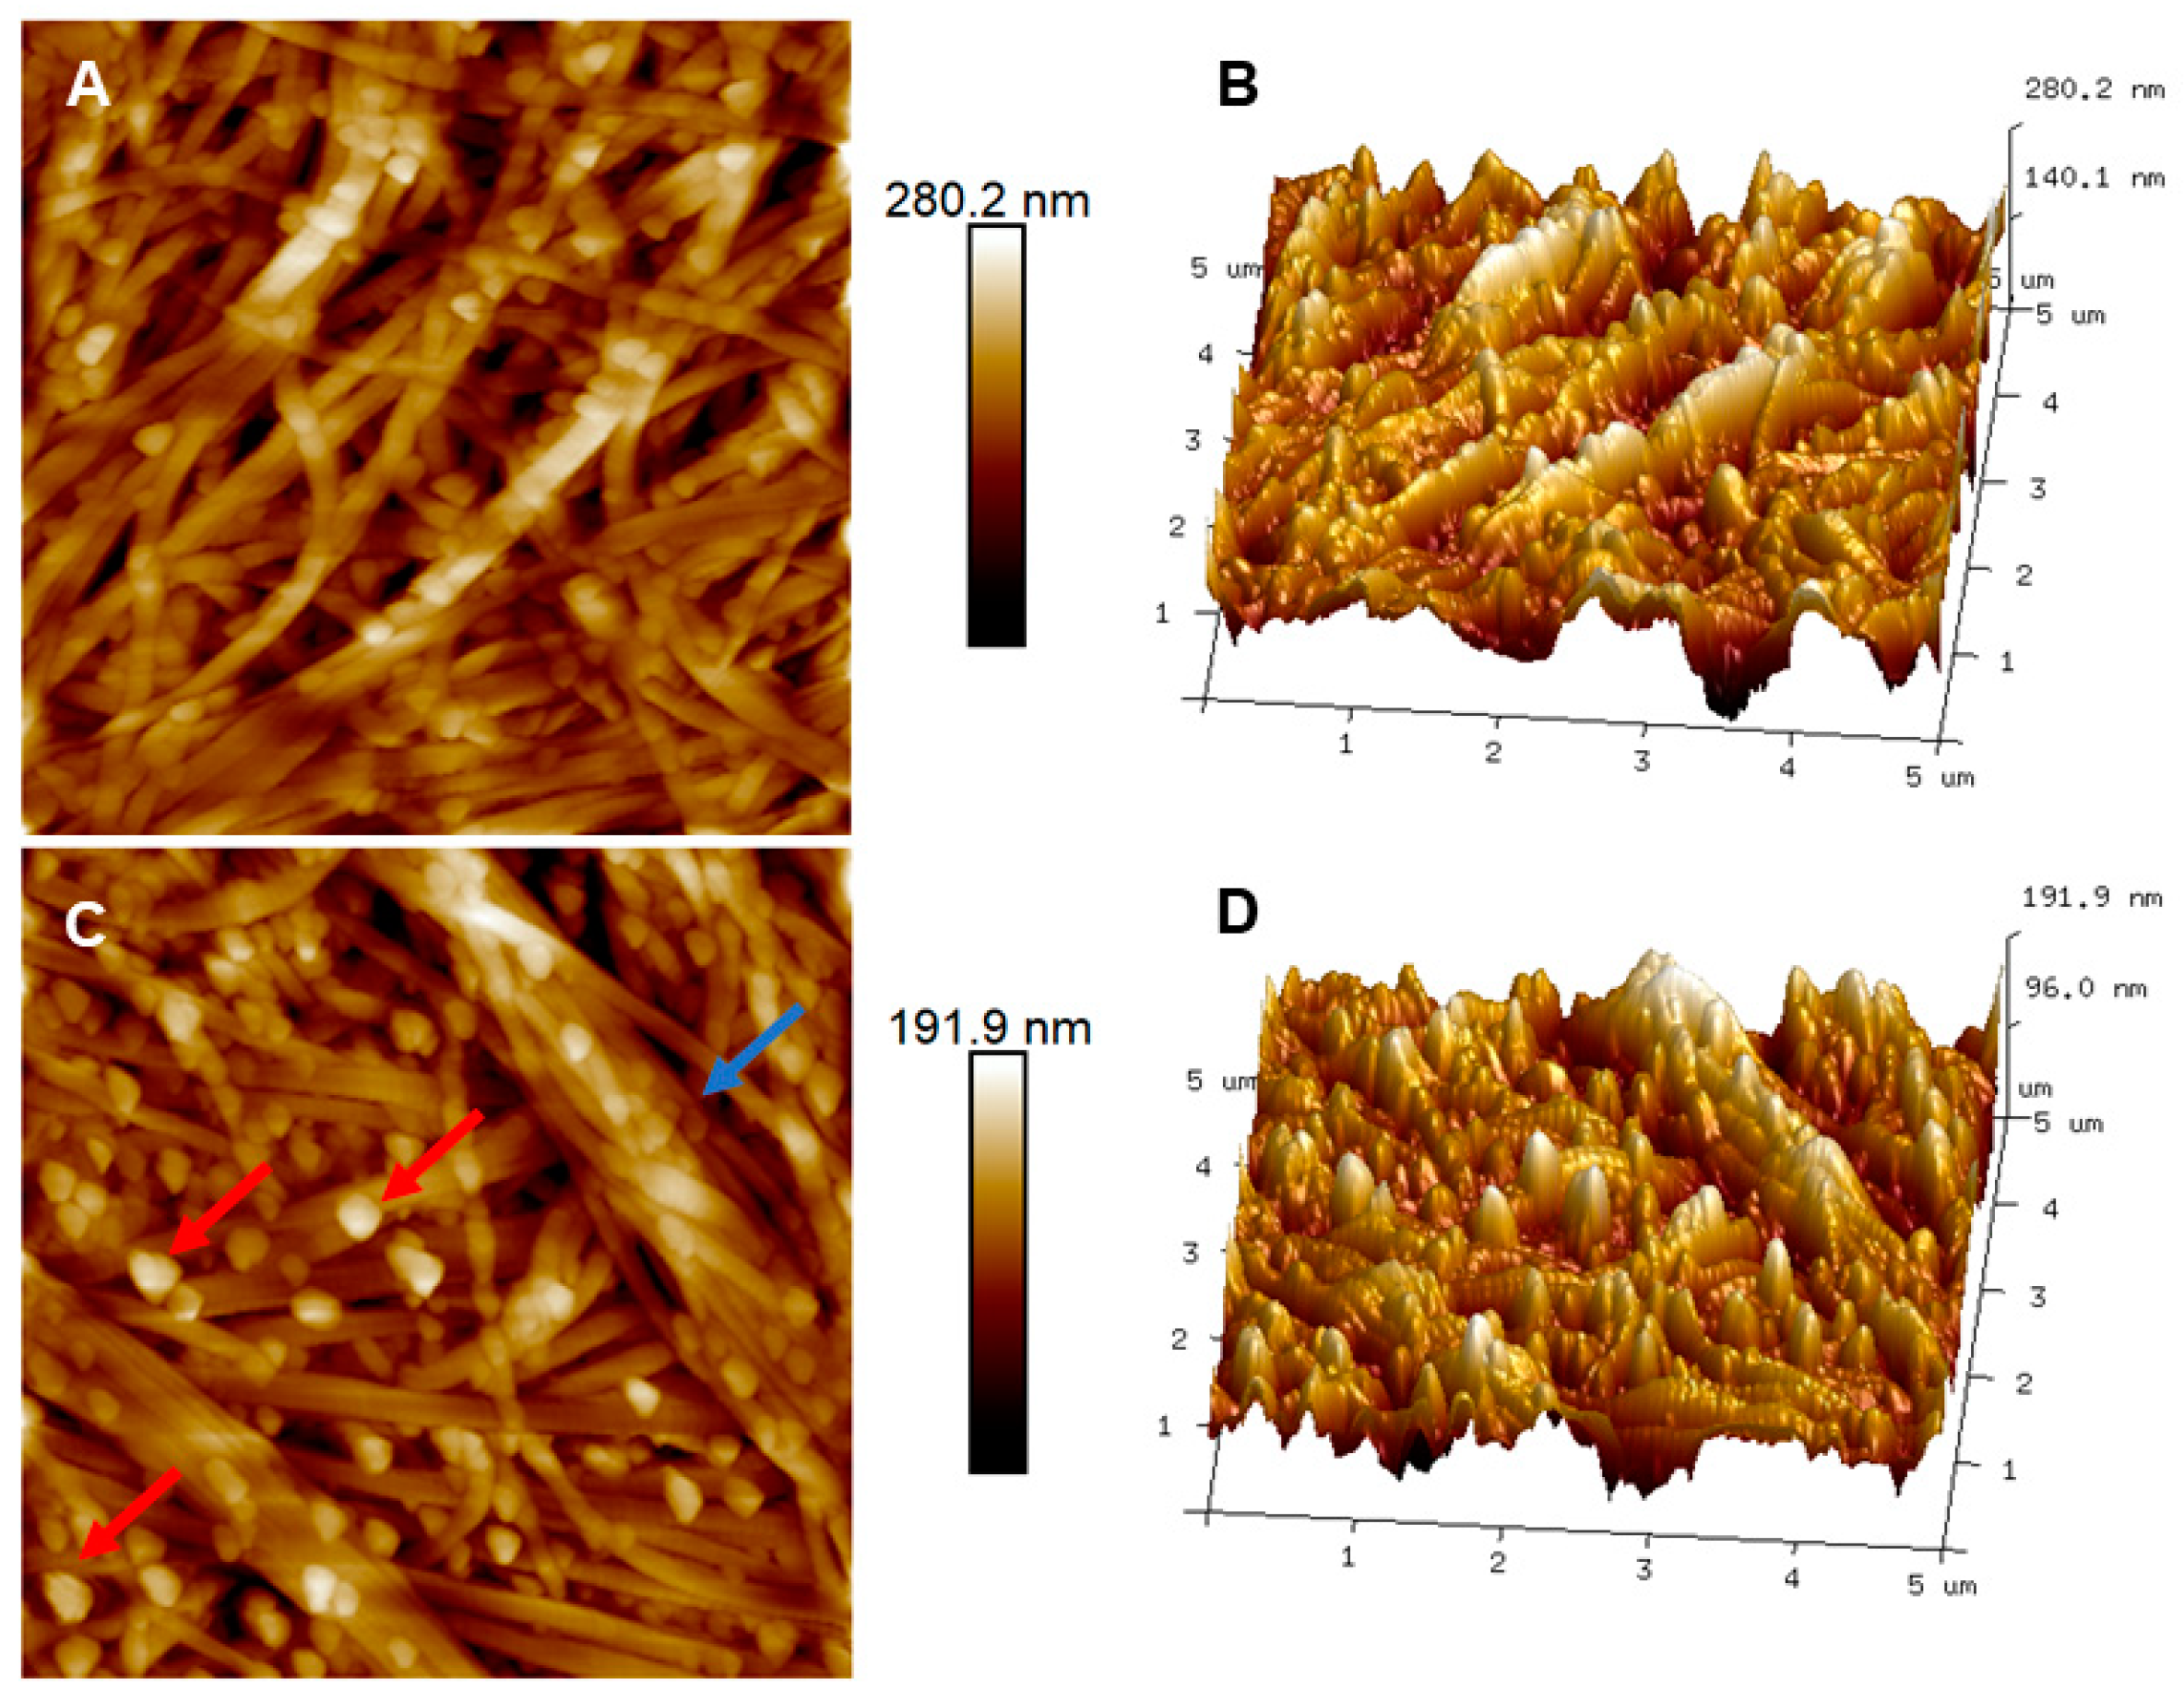
3.3. Stroma
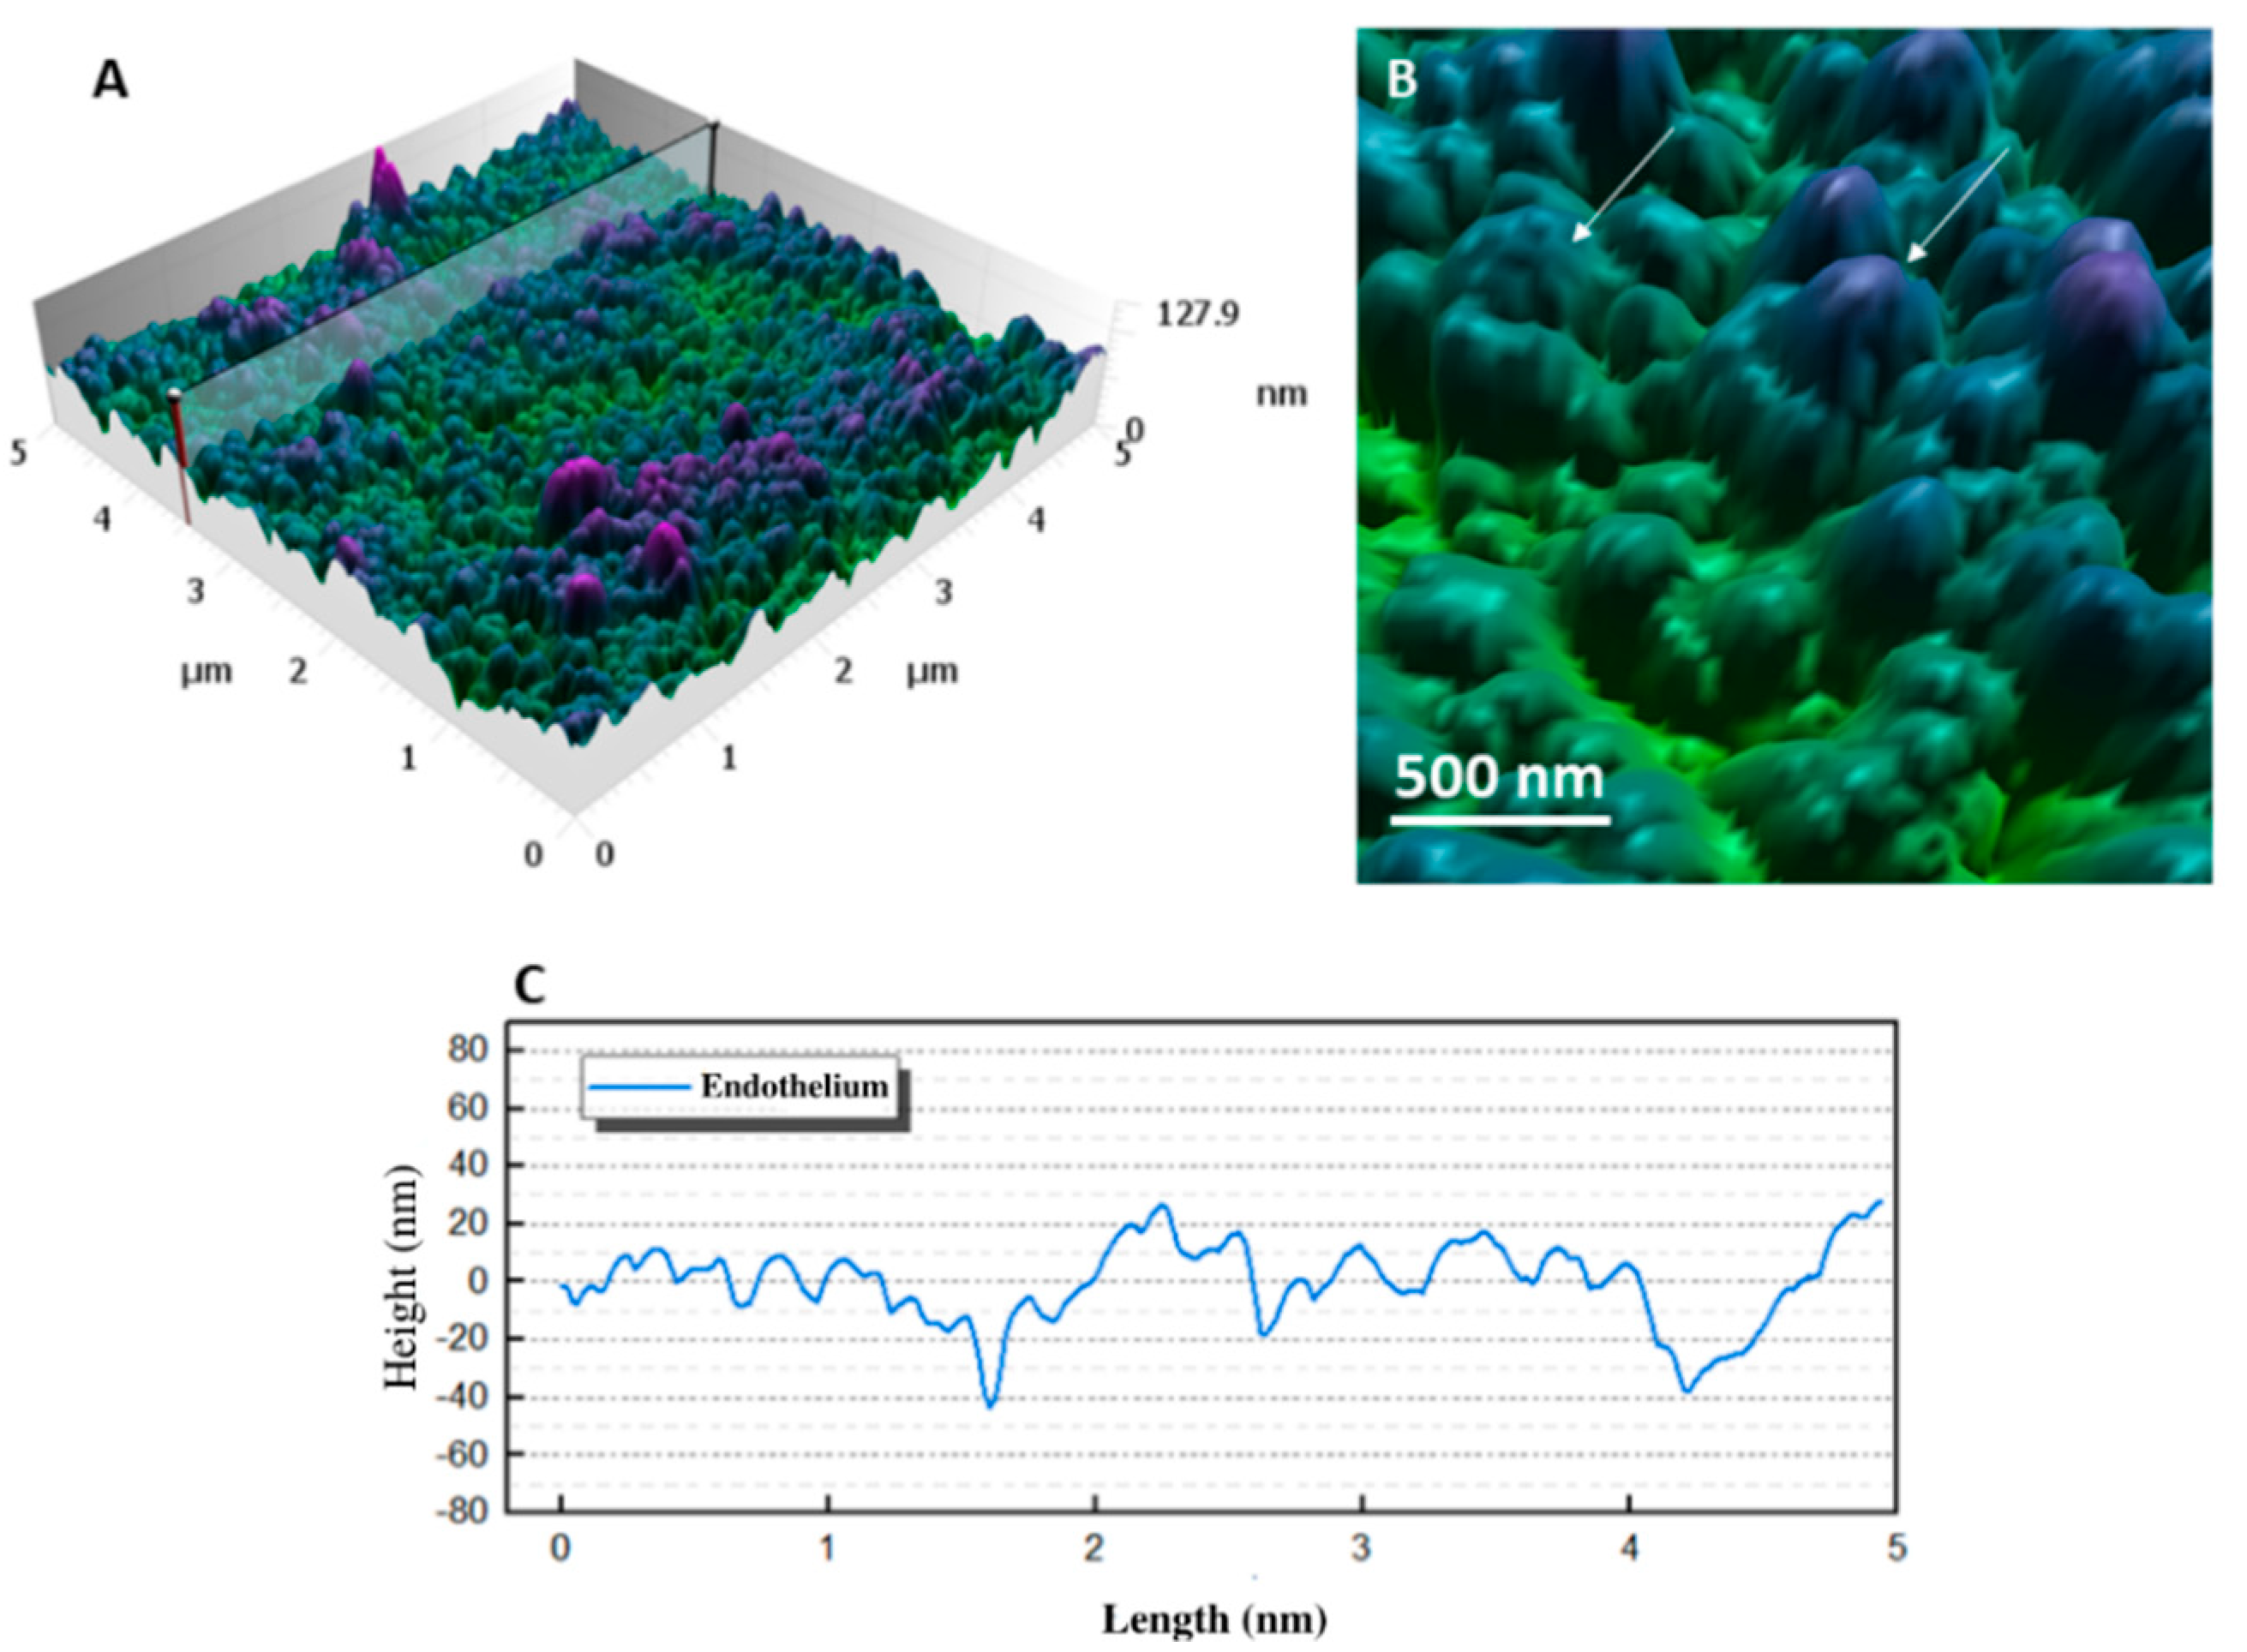
3.4. Endothelium
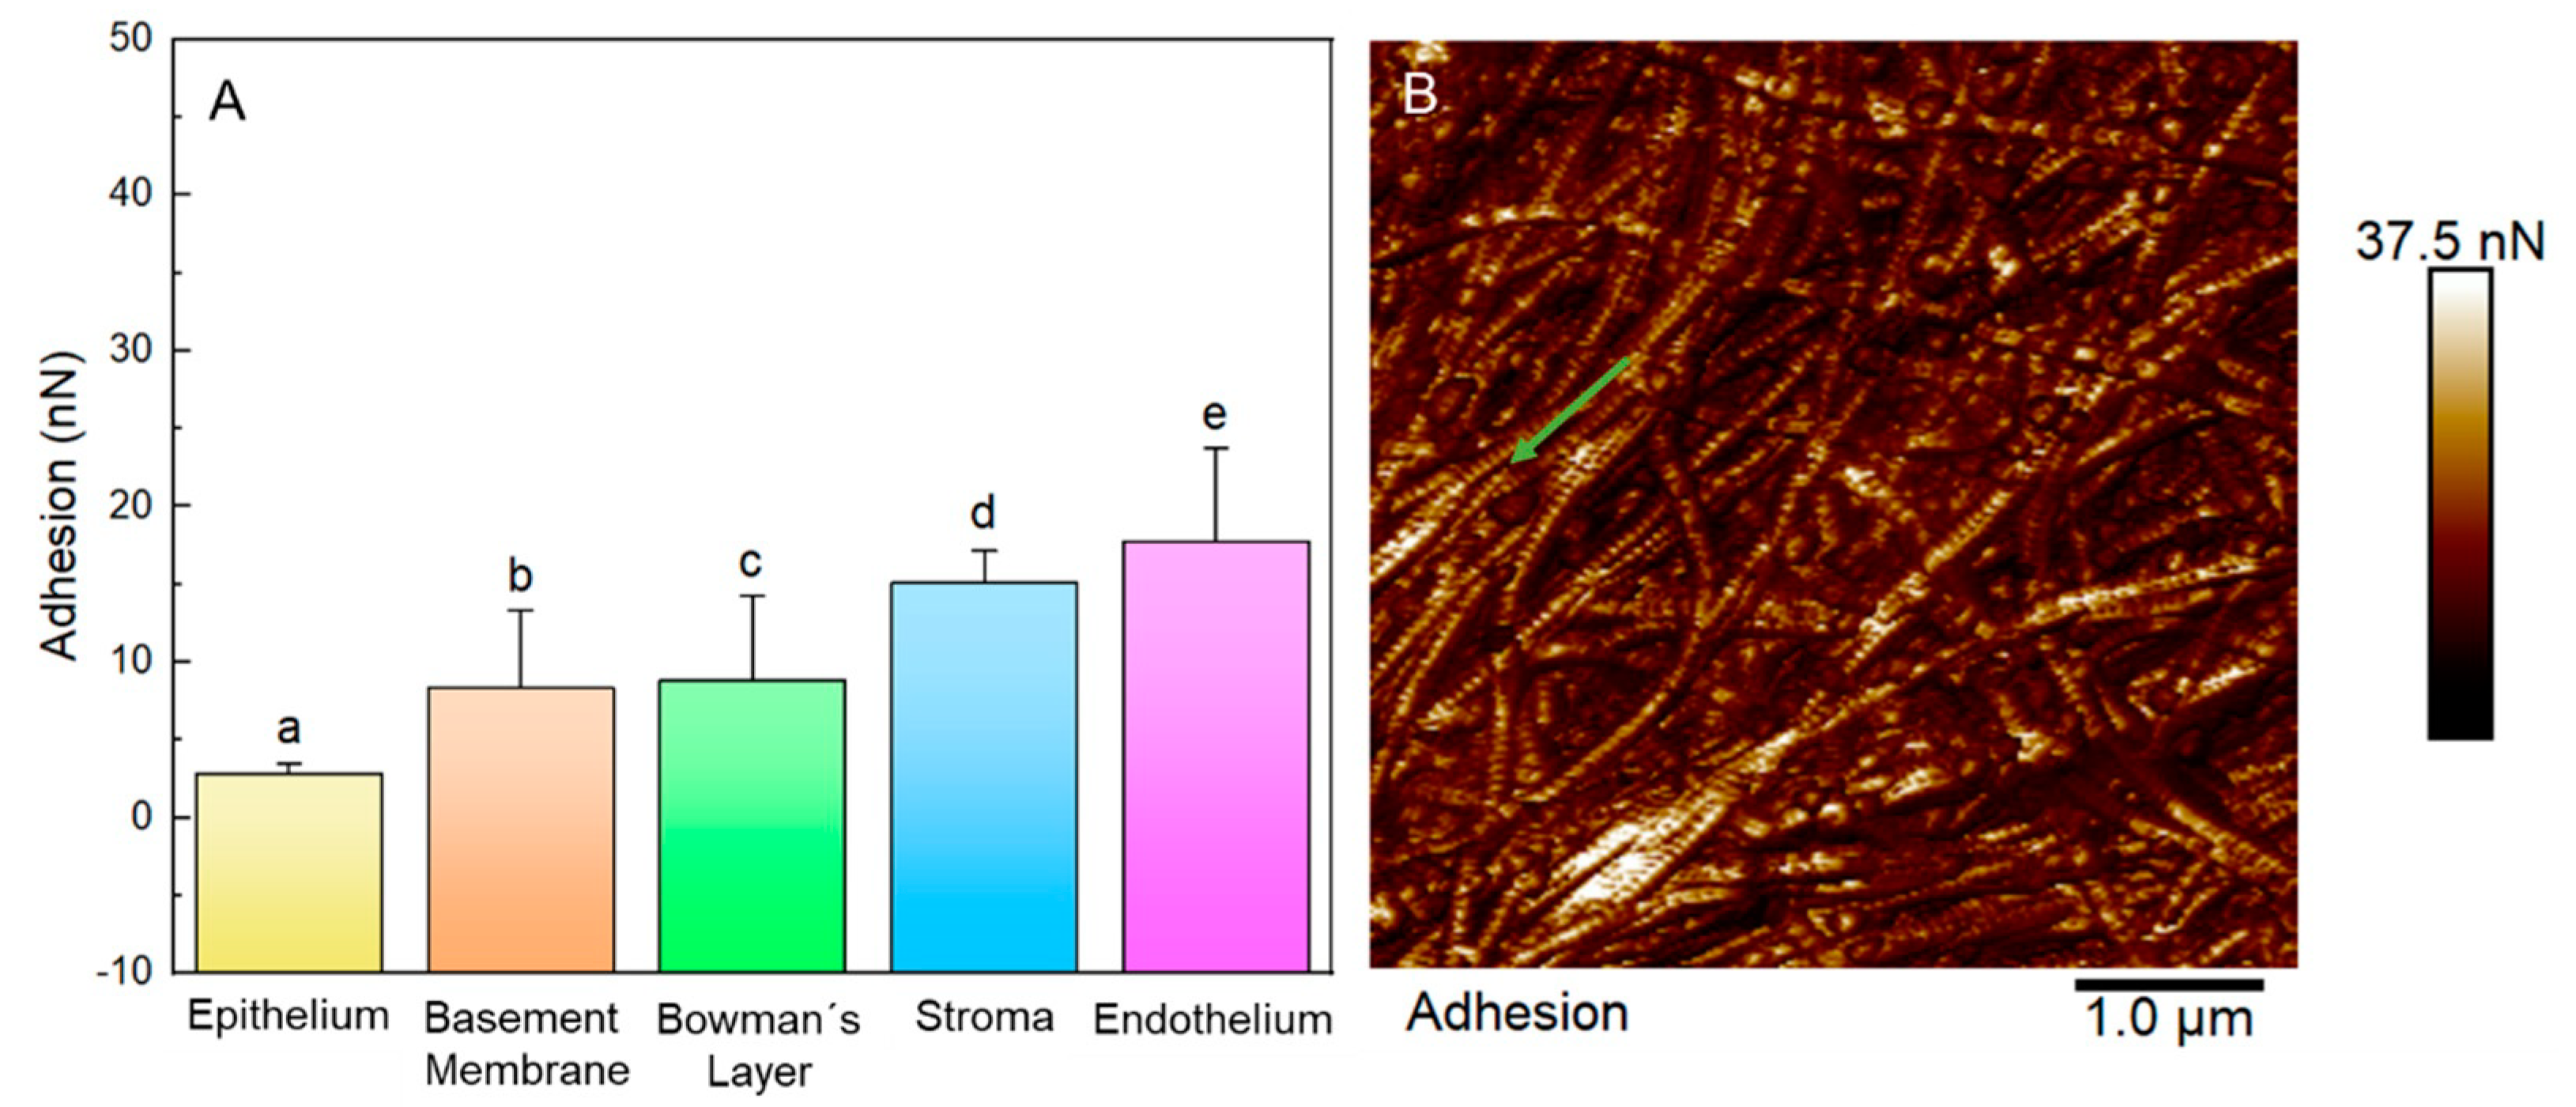
3.5. Biophysical Properties of Layers
4. Discussion
5. Conclusions
Author Contributions
Funding
Institutional Review Board Statement
Informed Consent Statement
Data Availability Statement
Acknowledgments
Conflicts of Interest
References
- Lwigale, P.Y. Corneal Development. In Progress in Molecular Biology and Translational Science; Elsevier: Amsterdam, The Neterlands, 2015; Volume 134, pp. 43–59. [Google Scholar] [CrossRef]
- Foster, J.W.; Wahlin, K.; Adams, S.M.; Birk, D.E.; Zack, D.J.; Chakravarti, S. Cornea organoids from human induced pluripotent stem cells. Sci. Rep. 2017, 7, 41286. [Google Scholar] [CrossRef] [PubMed]
- Lombardo, M.; Lombardo, G.; Carbone, G.; Santo, M.P.D.; Barberi, R.; Serrao, S. Biomechanics of the Anterior Human Corneal Tissue Investigated with Atomic Force Microscopy. Investig. Ophthalmol. Vis. Sci. 2012, 53, 1050–1057. [Google Scholar] [CrossRef] [PubMed] [Green Version]
- DelMonte, D.W.; Kim, T. Anatomy and physiology of the cornea. J. Cataract Refract. Surg. 2011, 37, 588–598. [Google Scholar] [CrossRef]
- Lekhanont, K.; Panday, V.; Akpek, E.K. Permanent keratoprostheses. In Corneal Surgery; Elsevier: Amsterdam, The Neterlands, 2009; pp. 683–690. [Google Scholar] [CrossRef]
- Taher, E.E.; Elalfy, M.; Elsawah, K. Stem cell therapies in ocular repair, regeneration, and diseases. In Mesenchymal Stem Cells in Human Health and Diseases; Elsevier: Amsterdam, The Neterlands, 2020; pp. 45–78. [Google Scholar] [CrossRef]
- Dua, H.S.; Faraj, L.A.; Said, D.G.; Gray, T.; Lowe, J. Human corneal anatomy redefined: A novel pre-descemet’s layer (Dua’s Layer). Ophthalmology 2013, 120, 1778–1785. [Google Scholar] [CrossRef]
- Martin, R. Cornea, and anterior eye assessment with slit lamp biomicroscopy, specular microscopy, confocal microscopy, and ultrasound biomicroscopy. Indian J. Ophthalmol. 2018, 66, 195. [Google Scholar] [CrossRef]
- Gamidov, A.A.; Baryshev, K.V.; Perevozchikov, K.A.; Surnina, Z.V. Atomic force microscopy in the study of retinal structure. Vestn. Oftalmol. 2020, 136, 251. [Google Scholar] [CrossRef]
- Alhasawi, A. Microstructural Imaging of the Eye and Mechanical Mapping of Retinal Tissue using Atomic Force Microscopy (AFM). Doctoral Dissertation, Memorial University of Newfoundland, St. John’s, NL, Canada, 2016. [Google Scholar]
- Grant, C.A.; Thomson, N.H.; Savage, M.D.; Woon, H.W.; Greig, D. Surface characterisation and biomechanical analysis of the sclera by atomic force microscopy. J. Mech. Behav. Biomed. Mater. 2011, 4, 535–540. [Google Scholar] [CrossRef]
- Diakonis, V.F.; Likht, N.Y.; Yesilirmak, N.; Delgado, D.; Karatapanis, A.E.; Yesilirmak, Y.; Fraker, C.; Yoo, S.H.; Ziebarth, N.M. Corneal elasticity after oxygen enriched high intensity corneal cross linking assessed using atomic force microscopy. Exp. Eye Res. 2016, 153, 51–55. [Google Scholar] [CrossRef]
- Dias, J.; Diakonis, V.F.; Lorenzo, M.; Gonzalez, F.; Porras, K.; Douglas, S.; Avila, M.; Yoo, S.H.; Ziebarth, N.M. Corneal stromal elasticity and viscoelasticity assessed by atomic force microscopy after different cross linking protocols. Exp. Eye Res. 2015, 138, 1–5. [Google Scholar] [CrossRef] [Green Version]
- Seifert, J.; Hammer, C.M.; Rheinlaender, J.; Sel, S.; Scholz, M.; Paulsen, F.; Schäffer, T.E. Distribution of Young’s modulus in porcine corneas after riboflavin/UVA-induced collagen cross-linking as measured by atomic force microscopy. PLoS ONE 2014, 9, e88186. [Google Scholar] [CrossRef] [Green Version]
- Abrams, G.A.; Schaus, S.S.; Goodman, S.L.; Nealey, P.F.; Murphy, C.J. Nanoscale Topography of the Corneal Epithelial Basement Membrane and Descemet’s Membrane of the Human. Cornea 2000, 19, 57–64. [Google Scholar] [CrossRef] [PubMed]
- Belikov, S.; Alexander, J.; Wall, C.; Yermolenko, I.; Magonov, S.; Malovichko, I. Thermal tune method for AFM oscillatory resonant imaging in air and liquid. In Proceedings of the 2014 American Control Conference, Portland, OR, USA, 4–6 June 2014; pp. 1009–1014. [Google Scholar] [CrossRef]
- Adamcik, J.; Berquand, A.; Mezzenga, R. Single-step direct measurement of amyloid fibrils stiffness by peak force quantitative nanomechanical atomic force microscopy. Appl. Phys. Lett. 2011, 98, 193701. [Google Scholar] [CrossRef]
- Dufrêne, Y.F. Atomic force microscopy: A powerful molecular toolkit in nanoproteomics. Proteomics 2009, 9, 5400–5405. [Google Scholar] [CrossRef] [PubMed]
- Gong, Y.; Misture, S.T.; Gao, P.; Mellott, N.P. Surface Roughness Measurements Using Power Spectrum Density Analysis with Enhanced Spatial Correlation Length. J. Phys. Chem. C 2016, 120, 22358–22364. [Google Scholar] [CrossRef]
- Costa, L.M., Jr.; Silva, C.R.; Soares, A.M.; Menezes, A.S.; Silva, M.R.; Amarante, A.F.; Costa, E.F.; Alencar, L.M. Assessment of biophysical properties of Haemonchus contortus from different life cycle stages with atomic force microscopy. Ultramicroscopy 2020, 209, 112862. [Google Scholar] [CrossRef]
- Amorim, M.D.S.D.N.; Batista, J.A.; Maia, F., Jr.; Fontes, A.; Santos-Oliveira, R.; Rebelo Alencar, L.M. Alencar. New Insights into Hemolytic Anemias: Ultrastructural and Nanomechanical Investigation of Red Blood Cells Showed Early Morphological Changes. SSRN J. 2021, 18, 405–421. [Google Scholar] [CrossRef]
- Furthmayr, H.; Wiedemann, H.; Timpl, R.; Odermatt, E.; Engel, J. Electron-microscopical approach to a structural model of intima collagen. Biochem. J. 1983, 211, 303–311. [Google Scholar] [CrossRef]
- Mak, K.M.; Png, C.Y.M. Type VI Collagen: Biological Functions and Its Neo-epitope as Hepatic Fibrosis Biomarker. In Biomarkers in Liver Disease; Org to Ed; Springer: Dordrecht, The Netherlands, 2015; pp. 1–27. [Google Scholar] [CrossRef]
- Fox, J.W.; Mayer, U.; Nischt, R.; Aumailley, M.; Reinhardt, D.; Wiedemann, H.; Mann, K.; Timpl, R.; Krieg, T.; Engel, J. Recombinant nidogen consists of three globular domains and mediates binding of laminin to collagen type IV. EMBO J. 1991, 10, 3137–3146. [Google Scholar] [CrossRef]
- Torricelli, A.A.M.; Marino, G.K.; Santhanam, A.; Wu, J.; Singh, A.; Wilson, S.E. Epithelial basement membrane proteins perlecan and nidogen-2 are up-regulated in stromal cells after epithelial injury in human corneas. Exp. Eye Res. 2015, 134, 33–38. [Google Scholar] [CrossRef] [Green Version]
- Predescu, D.; Palade, G.E. Plasmalemmal vesicles represent the large pore system of continuous microvascular endothelium. Am. J. Physiol.-Heart Circ. Physiol. 1993, 265, H725–H733. [Google Scholar] [CrossRef]
- Waring, G.O.; Bourne, W.M.; Edelhauser, H.F.; Kenyon, K.R. The corneal endothelium. Normal and pathologic structure and function. Ophthalmology 1982, 89, 531–590. [Google Scholar] [CrossRef]
- Tatiana, M. Atlas Digital de Biologia Celular e Tecidual; Edição da Autora: Porto Alegre, Brazil, 2016; p. 135. Available online: https://www.ufrgs.br/atlasbiocel/ (accessed on 14 November 2021).
- Byström, B.; Virtanen, I.; Rousselle, P.; Miyazaki, K.; Lindén, C.; Domellö, F.P. Laminins in normal, keratoconus, bullous keratopathy and scarred human corneas. Histochem. Cell Biol. 2007, 127, 657–667. [Google Scholar] [CrossRef] [PubMed]
- Torricelli, A.A.M.; Singh, V.; Santhiago, M.R.; Wilson, S.E. The Corneal Epithelial Basement Membrane: Structure, Function, and Disease. Invest. Ophthalmol. Vis. Sci. 2013, 54, 6390. [Google Scholar] [CrossRef] [PubMed]
- Stanley, R. BSAVA manual of canine and feline ophthalmology. Aust. Vet. J. 2016, 94, 3. [Google Scholar]
- Gozzo, F. Caracterização Morfológica de Tecidos Oculares por Microscopia de Força Atômica. Master’s Dissertation, Universidade de São Paulo, São Paulo, Brasil, 2009. [Google Scholar]
- Eghrari, A.O.; Riazuddin, S.A.; Gottsch, J.D. Overview of the Cornea. In Progress in Molecular Biology and Translational Science; Elsevier: Amsterdam, The Netherlands, 2015; Volume 134, pp. 7–23. [Google Scholar] [CrossRef]
- Chen, Z.; You, J.; Liu, X.; Cooper, S.; Hodge, C.; Sutton, G.; Crook, J.M.; Wallace, G.G. Biomaterials for corneal bioengineering. Biomed. Mater. 2018, 13, 032002. [Google Scholar] [CrossRef] [Green Version]
- Stylianou, A. Atomic Force Microscopy for Collagen-Based Nanobiomaterials. Nanomaterials 2017, 2017, 1–14. [Google Scholar] [CrossRef] [Green Version]
- Fukuda, K. Corneal fibroblasts: Function and markers. Exp. Eye Res. 2020, 200, 108229. [Google Scholar] [CrossRef]
- Rebêlo, L.M.; de Sousa, J.S.; Filho, J.M.; Schäpe, J.; Doschke, H.; Radmacher, M. Microrheology of cells with magnetic force modulation atomic force microscopy. Soft Matter 2013, 10, 2141–2149. [Google Scholar] [CrossRef]
- Molladavoodi, S.; Kwon, H.-J.; Medley, J.; Gorbet, M. Human corneal epithelial cell response to substrate stiffness. Acta Biomater. 2015, 11, 324–332. [Google Scholar] [CrossRef]
- Yuan, S. Endothelial contractile cytoskeleton and microvascular permeability. CHC 2009, 1, 43–50. [Google Scholar] [CrossRef] [Green Version]
- Last, J.A.; Russell, P.; Nealey, P.F.; Murphy, C.J. The Applications of Atomic Force Microscopy to Vision Science. Invest. Ophthalmol. Vis. Sci. 2010, 51, 6083. [Google Scholar] [CrossRef] [PubMed]
- Butt, H.-J.; Cappella, B.; Kappl, M. Force measurements with the atomic force microscope: Technique, interpretation and applications. Surf. Sci. Rep. 2005, 59, 1–152. [Google Scholar] [CrossRef] [Green Version]
- Cardoso-Lima, R.; Souza, P.F.N.; Guedes, M.I.F.; Santos-Oliveira, R.; Alencar, L.M.R. SARS-CoV-2 Unrevealed: Ultrastructural and Nanomechanical Analysis. Langmuir 2021, 37, 10762–10769. [Google Scholar] [CrossRef] [PubMed]
- Zhu, C.; Joyce, N.C. Proliferative Response of Corneal Endothelial Cells from Young and Older Donors. Invest. Ophthalmol. Vis. Sci. 2004, 45, 1743. [Google Scholar] [CrossRef]
- Quantock, A.J.; Young, R.D. Development of the corneal stroma, and the collagen-proteoglycan associations that help define its structure and function. Dev. Dyn. 2008, 237, 2607–2621. [Google Scholar] [CrossRef] [Green Version]
- Last, J.A.; Liliensiek, S.J.; Nealey, P.F.; Murphy, C.J. Determining the mechanical properties of human corneal basement membranes with atomic force microscopy. J. Struct. Biol. 2009, 167, 19–24. [Google Scholar] [CrossRef] [Green Version]
- de Souza, R.S.; Pinhal, M.A.D.S. Interações em processos fisiológicos: A importância da dinâmica entre matriz extracelular e proteoglicanos. Arq. Bras. Ciên. Saúde 2011, 36, 1–7. [Google Scholar] [CrossRef]
- Miner, J.J.; Platt, D.J.; Ghaznavi, C.M.; Chandra, P.; Santeford, A.; Menos, A.M.; Dong, Z.; Wang, E.R.; Qian, W.; Karozichian, E.S.; et al. HSV-1 and Zika Virus but Not SARS-CoV-2 Replicate in the Human Cornea and Are Restricted by Corneal Type III Interferon. Cell Rep. 2020, 33, 108339. [Google Scholar] [CrossRef]


Publisher’s Note: MDPI stays neutral with regard to jurisdictional claims in published maps and institutional affiliations. |
© 2022 by the authors. Licensee MDPI, Basel, Switzerland. This article is an open access article distributed under the terms and conditions of the Creative Commons Attribution (CC BY) license (https://creativecommons.org/licenses/by/4.0/).
Share and Cite
Rates, E.R.D.; Almeida, C.D.; Costa, E.d.P.F.; Farias, R.J.d.M.; Santos-Oliveira, R.; Alencar, L.M.R. Layer-by-Layer Investigation of Ultrastructures and Biomechanics of Human Cornea. Int. J. Mol. Sci. 2022, 23, 7833. https://doi.org/10.3390/ijms23147833
Rates ERD, Almeida CD, Costa EdPF, Farias RJdM, Santos-Oliveira R, Alencar LMR. Layer-by-Layer Investigation of Ultrastructures and Biomechanics of Human Cornea. International Journal of Molecular Sciences. 2022; 23(14):7833. https://doi.org/10.3390/ijms23147833
Chicago/Turabian StyleRates, Erick Rafael Dias, Charles Duarte Almeida, Elaine de Paula Fiod Costa, Roberta Jansen de Mello Farias, Ralph Santos-Oliveira, and Luciana Magalhães Rebelo Alencar. 2022. "Layer-by-Layer Investigation of Ultrastructures and Biomechanics of Human Cornea" International Journal of Molecular Sciences 23, no. 14: 7833. https://doi.org/10.3390/ijms23147833