
The Biochemical Assessment of Mitochondrial Respiratory Chain Disorders

Abstract
:1. Introduction
2. Lactate and Pyruvate
3. Amino Acids
4. Urine Organic Acids
5. Other Metabolites
6. Spectrophotometric Assessment of MRC Enzyme Activities
7. Polarographic Assessment of MRC Function
8. CoQ10
9. GSH
10. 5MTHF
11. FGF-21/GF-15
12. Conclusions
Author Contributions
Funding
Institutional Review Board Statement
Informed Consent Statement
Data Availability Statement
Conflicts of Interest
References
- Wallace, D.C. Mitochondrial diseases in man and mouse. Science 1999, 283, 1482–1487. [Google Scholar] [CrossRef] [PubMed] [Green Version]
- Hatefi, Y. The mitochondrial electron transport and oxidative phosphorylation system. Annu. Rev. Biochem. 1985, 54, 1015–1069. [Google Scholar] [CrossRef] [PubMed]
- Haas, R.H.; Parikh, S.; Falk, M.J.; Saneto, R.P.; Wolf, N.I.; Darin, N.; Cohen, B.H. Mitochondrial disease: A practical approach for primary care physicians. Pediatrics 2007, 120, 1326–1333. [Google Scholar] [CrossRef] [PubMed] [Green Version]
- Gorman, G.S.; Shaefer, A.M.; Ng, Y.; Gomez, N.; Blakely, E.L.; Alston, C.L.; McFarland, R. Prevalence of nuclear and mitochondrial DNA mutations related to adult mitochondrial disease. Ann. Neurol. 2015, 77, 753–759. [Google Scholar] [CrossRef] [PubMed] [Green Version]
- Frazier, A.E.; Thorburn, D.R.; Compton, A.G. Mitochondrial energy generation disorders: Genes, mechanisms, and clues to pathology. J. Biol. Chem. 2019, 294, 5386–5395. Available online: https://doi.org/10.1074/jbc.R117.809194 (accessed on 12 December 2017). [CrossRef] [Green Version]
- Haas, R.H.; Parikh, S.; Falk, M.J.; Saneto, R.P.; Wolf, N.I.; Darin, N.; Wong, L.J.; Cohen, B.H.; Naviaux, R.K. The in-depth evaluation of suspected mitochondrial disease. Mol. Genet. Metab. 2008, 94, 16–37. [Google Scholar] [CrossRef] [Green Version]
- Hargreaves, I.P. Biochemical assessment and monitoring of mitochondrial disease. J. Clin. Med. 2018, 7, 66. [Google Scholar] [CrossRef] [Green Version]
- Tyynismaa, H.; Carroll, C.J.; Raimundo, N.; Ahola-Erkkilä, S.; Wenz, T.; Ruhanen, H.; Guse, K.; Hemminki, A.; Peltola-Mjøsund, K.E.; Tulkki, V.; et al. Mitochondrial myopathy induces a starvation-like response. Hum. Mol. Genet. 2010, 19, 3948–3958. [Google Scholar] [CrossRef] [Green Version]
- Kalko, S.G.; Paco, S.; Jou, C.; Rodríguez, M.A.; Meznaric, M.; Rogac, M.; Jekovec-Vrhovsek, M.; Sciacco, M.; Moggio, M.; Fagiolari, G.; et al. Transcriptomic profiling of TK2 deficient human skeletal muscle suggests a role for the p53 signalling pathway and identifies growth and differentiation factor-15 as a potential novel biomarker for mitochondrial myopathy. BMC Genom. 2014, 15, 91. [Google Scholar] [CrossRef] [Green Version]
- Hargreaves, I.P. Ubiquinone: Cholesterol`s reclusive cousin. Ann. Clin. Biochem. 2003, 40, 207–218. [Google Scholar] [CrossRef]
- Garcia-Cazorla, A.; Quadros, E.V.; Nascimento, A.; Garcia-Silva, M.T.; Briones, P.; Montoya, J.; Ramaekers, V.T. Mitochondrial diseases associated with cerebral folate deficiency. Neurology 2008, 70, 1360–1362. [Google Scholar] [CrossRef] [PubMed]
- Magner, M.; Szentiványi, K.; Svandová, I.; Ješina, P.; Tesařová, M.; Honzík, T.; Zeman, J. Elevated CSF-lactate is a reliable marker of mitochondrial disorders in children even after brief seizures. Eur. J. Paediatr. Neurol. EJPN Off. J. Eur. Paediatr. Neurol. Soc. 2011, 15, 101–108. [Google Scholar] [CrossRef] [PubMed]
- Gray, L.R.; Tompkins, S.C.; Taylor, E.B. Regulation of pyruvate metabolism and human disease. Cell. Mol. Life Sci. CMLS 2014, 71, 42577–42604. [Google Scholar] [CrossRef] [PubMed] [Green Version]
- Andersen, L.W.; Mackenhauer, J.; Roberts, J.C.; Berg, K.M.; Cocchi, M.N.; Donnino, M.W. Etiology and therapeutic approach to elevated lactate levels. Mayo Clin. Proc. 2013, 88, 1127–1140. [Google Scholar] [CrossRef] [Green Version]
- Chow, S.L.; Rooney, Z.J.; Cleary, M.A.; Clayton, P.T.; Leonard, J.V. The significance of elevated CSF lactate. Arch. Dis. Child. 2005, 90, 1188–1189. [Google Scholar] [CrossRef] [Green Version]
- Parikh, S.; Goldstein, A.; Koenig, M.K.; Scaglia, F.; Enns, G.M.; Saneto, R.; Anselm, I.; Cohen, B.H.; Falk, M.J.; Greene, C.; et al. Diagnosis and management of mitochondrial disease: A consensus statement from the Mitochondrial Medicine Society. Genet. Med. Off. J. Am. Coll. Med. Genet. 2015, 17, 689–701. [Google Scholar] [CrossRef] [Green Version]
- Feldman, A.G.; Sokol, R.J.; Hardison, R.M.; Alonso, E.M.; Squires, R.H.; Narkewicz, M.R.; Pediatric Acute Liver Failure Study Group. Lactate and lactate: Pyruvate ratio in the diagnosis and outcomes of pediatric acute liver failure. J. Pediatrics 2017, 182, 217–222.e3. [Google Scholar] [CrossRef] [Green Version]
- Clarke, C.; Xiao, R.; Place, E.; Zhang, Z.; Sondheimer, N.; Bennett, M.; Yudkoff, M.; Falk, M.J. Mitochondrial respiratory chain disease discrimination by retrospective cohort analysis of blood metabolites. Mol. Genet. Metab. 2013, 110, 145–152. [Google Scholar] [CrossRef] [Green Version]
- Bernier, F.P.; Boneh, A.; Dennett, X.; Chow, C.W.; Cleary, M.A.; Thorburn, D.R. Diagnostic criteria for respiratory chain disorders in adults and children. Neurology 2002, 59, 1406–1411. [Google Scholar] [CrossRef]
- Carayol, M.; Licaj, I.; Achaintre, D.; Sacerdote, C.; Vineis, P.; Key, T.J.; Onland Moret, N.C.; Scalbert, A.; Rinaldi, S.; Ferrari, P. Reliability of serum metabolites over a two-year period: A targeted metabolomic approach in fasting and non-fasting samples from EPIC. PLoS ONE 2015, 10, e0135437. [Google Scholar] [CrossRef] [Green Version]
- Dimou, A.; Tsimihodimos, V.; Bairaktari, E. The Critical Role of the Branched Chain Amino Acids (BCAAs) Catabolism-Regulating Enzymes, Branched-Chain Aminotransferase (BCAT) and Branched-Chain α-Keto Acid Dehydrogenase (BCKD), in Human Pathophysiology. Int. J. Mol. Sci. 2022, 23, 4022. [Google Scholar] [CrossRef] [PubMed]
- Morava, E.; van den Heuvel, L.P.W.J.; Hol, F.; De Vries, M.C.; Hogeveen, M.; Rodenburg, R.J.; Smeitink, J.A.M. Mitochondrial disease criteria: Diagnostic applications in children. Neurology 2006, 67, 1823–1826. [Google Scholar] [CrossRef] [PubMed]
- Shatla, H.M.; Tomoum, H.Y.; Elsayed, S.M.; Elagouza, I.A.; Shatla, R.H.; Mohsen, M.M.; Hamed, A.N. Role of plasma amino acids and urinary organic acids in diagnosis of mitochondrial diseases in children. Pediatric Neurol. 2014, 51, 820–825. Available online: https://pubmed.ncbi.nlm.nih.gov/25456303/ (accessed on 7 April 2022). [CrossRef] [PubMed]
- Keyfi, F.; Lukacs, Z.; Varasteh, A. A description of reference ranges for organic acids in urine samples from a paediatric population in Iran. Rep. Biochem. Mol. Biol. 2017, 6, 40–50. [Google Scholar]
- Alban, C.; Fatale, E.; Joulani, A.; Ilin, P.; Saada, A. The relationship between mitochondrial respiratory chain activities in muscle and metabolites in plasma and urine: A retrospective study. J. Clin. Med. 2017, 6, 31. [Google Scholar] [CrossRef] [Green Version]
- Bennett, M.J.; Sheng, F.; Saada, A. Biochemical assays of TCA cycle and β-oxidation metabolites. Methods Cell Biol. 2020, 155, 83–120. [Google Scholar]
- Kumps, A.; Duez, P.; Mardens, Y. Metabolic, nutritional, iatrogenic, and artefactual sources of urinary organic acids: A comprehensive table. Clin. Chem. 2002, 48, 708–717. [Google Scholar]
- Hargreaves, I.P. Mitochondrial Respiratory Chain Disorders from Clinical Presentation to Diagnosis and Treatment; Nova Science Publishers Inc.: New York, NY, USA, 2019; ISBN 9781536150537. [Google Scholar]
- Ostojic, S.M. Plasma creatine as a marker of mitochondrial dysfunction. Med. Hypotheses 2018, 113, 52–53. [Google Scholar] [CrossRef]
- Maresca, A.; Del Dotto, V.; Romagnoli, M.; La Morgia, C.; Di Vito, L.; Capristo, M.; Valentino, M.L.; Carelli, V. Expanding and validating the biomarkers for mitochondrial diseases. J. Mol. Med. 2020, 98, 1467–1478. [Google Scholar] [CrossRef]
- Dougherty, F.E. Metabolic testing in mitochondrial disease. Semin. Neurol. 2001, 21, 303–308. [Google Scholar] [CrossRef] [Green Version]
- Barrientos, A.; Fontanesi, F.; Díaz, F. Evaluation of the mitochondrial respiratory chain and oxidative phosphorylation system using polarography and spectrophotometric enzyme assays. Curr. Protoc. Hum. Genet. 2009, 63, 19.3.1–19.3.14. [Google Scholar] [CrossRef] [PubMed] [Green Version]
- Yubero, D.; Montero, R.; Artuch, R.; Land, J.M.; Heales, S.J.; Hargreaves, I.P. Biochemical diagnosis of coenzyme q10 deficiency. Mol. Syndromol. 2014, 5, 147–155. [Google Scholar] [CrossRef] [PubMed] [Green Version]
- Reisch, A.S.; Elpeleg, O. Biochemical assays for mitochondrial activity: Assays of TCA cycle enzymes and PDHc. Methods Cell Biol. 2007, 80, 199–222. [Google Scholar]
- Chretien, D.; Rustin, P.; Bourgeron, T.; Rötig, A.; Saudubray, J.; Munnich, A. Reference charts for respiratory chain activities in human tissue. Clin. Chim. Acta 1994, 228, 53–70. [Google Scholar] [CrossRef]
- Wenchich, L.; Drahota, Z.; Honzik, T.; Hansíková, H.; Tesarova, M.; Zeman, J.; Houstek, J. Polarographic evaluation of mitochondrial enzyme activity in isolated mitochondria and in permeabilized human muscle cells with inherited mitochondrial defects. Physiol. Res. 2003, 52, 781–788. [Google Scholar]
- Ost, M.; Doerrier, C.; Gama-Perez, P.; Moreno-Gomez, S. Analysis of mitochondrial respiratory function in tissue biopsies and blood cells. Curr. Opin. 2018, 21, 5. [Google Scholar] [CrossRef]
- Cengel, Y.; Heat, T.M. Mitochondria. In A Practical Approach; Darley-Usmar, V.M., Rickwood, D., Wilson, M.T., Eds.; IRL Press Oxford: Oxford, UK, 1987; p. 340. [Google Scholar]
- Pesta, D.; Gnaiger, E. High-Resolution Respirometry: Oxphos Protocols for Human Cells and Permeabilized Fibers from Small Biopsies of Human Muscle; Humana Press: Totowa, NJ, USA, 2012; Volume 810, pp. 25–58. [Google Scholar]
- Levitsky, Y.; Pegouske, D.J.; Hammer, S.S.; Frantz, N.L.; Fisher, K.P.; Muchnik, A.B.; Saripalli, A.R.; Kirschner, P.; Bazil, J.N.; Busik, J.V.; et al. Micro-respirometry of whole cells and isolated mitochondria. RSC Adv. 2019, 9, 33257–33267. [Google Scholar] [CrossRef]
- McDonnell, M.G.; Archbold, G.P. Plasma ubiquinol/cholesterol ratios in patients with hyperlipidemia, those with diabetes mellitus and in patients equiring dialysis. Clin. Chim. Acta 1996, 253, 117–126. [Google Scholar] [CrossRef]
- Lowry, O.H.; Rosebrough, N.J.; Farr, A.L.; Randall, R.J. Protein measurement with the Folin phenol reagent. J. Biol. Chem. 1951, 193, 265–275. [Google Scholar] [CrossRef]
- Duncan, A.J.; Heales, S.J.; Mills, K.; Eaton, S.; Land, J.M.; Hargreaves, I.P. Determination of Coenzyme Q10 in blood mononuclear cells, skeletal muscle and plasma by HPLC using di-propoxy-Coenzyme Q10 as an internal standard. Clin. Chem. 2005, 51, 2380–2382. [Google Scholar] [CrossRef] [Green Version]
- Hargreaves, I.P.; Sheena, Y.; Land, J.M.; Heales, S.J.R. Glutathione deficiency in patients with mitochondrial disease: Implications for pathogenesis and treatment. J. Inherit. Metab. Dis. 2005, 28, 81–88. [Google Scholar] [CrossRef] [PubMed]
- Enns, G.M.; Cowan, T.M. Glutathione as a Redox Biomarker in Mitochondrial Disease—Implications for Therapy. J. Clin. Med. 2017, 6, 50. [Google Scholar] [CrossRef] [Green Version]
- Chai, Y.C.; Ashraf, S.S.; Rokutan, K.; Johnston, R.B.; Jr Thomas, J.A. S-thiolation of individual human neutrophil proteins including actin by stimulation of the respiratory burst: Evidence against a role for glutathione disulfide. Arch. Biochem. Biophys. 1994, 310, 273–281. [Google Scholar] [CrossRef] [PubMed]
- Tipple, T.E.; Rogers, L.K. Methods for the determination of plasma or tissue glutathione levels. Methods Mol. Biol. 2012, 889, 315–324. [Google Scholar] [CrossRef] [Green Version]
- Batllori, M.; Molero-Luis, M.; Ormazabal, A.; Montero, R.; Sierra, C.; Ribes, A.; Montoya, J.; Ruiz-Pesini, E.; O’Callaghan, M.; Pias, L.; et al. Cerebrospinal fluid monoamines, pterins, and folate in patients with mitochondrial diseases: Systematic review and hospital experience. J. Inherit. Metab. Dis. 2018, 41, 1147–1158. [Google Scholar] [CrossRef] [PubMed]
- Tanji, K.; Schon, E.A.; DiMauro, S.; Bonilla, E. Kearns Sayre syndrome: Oncocytic transformation of choroid plexus epithelium. J. Neurol. Sci. 2000, 178, 29–36. [Google Scholar] [CrossRef]
- Aylett, S.B.; Neergheen, V.; Hargreaves, I.P.; Eaton, S.; Land, J.M.; Rahman, S.; Heales, S.J. Levels of 5-methyltetrahydrofolate and ascorbic acid in cerebrospinal fluid are correlated: Implications for the accelerated degradation of folate by reactive oxygen species. Neurochem. Int. 2013, 63, 750–755. [Google Scholar] [CrossRef] [PubMed]
- Akiyama, M.; Akiyama, T.; Kanamaru, K.; Kuribayashi, M.; Tada, H.; Shiokawa, T.; Toda, S.; Imai, K.; Kobayashi, Y.; Tohyama, J.; et al. Determination of CSF 5-methyltetrahydrofolate in children and its application for defects of folate transport and metabolism. Clin. Chim. Acta 2016, 460, 120–125. [Google Scholar] [CrossRef]
- Hyland, K.; Shoffner, J.; Heales, S.J. Cerebral folate deficiency. J. Inherit. Metab. Dis. 2010, 33, 563–570. [Google Scholar] [CrossRef]
- Akiyama, T.; Tada, H.; Shiokawa, T.; Kobayashi, K.; Yoshinaga, H. Total folate and 5-methyltetrahydrofolate in the cerebrospinal fluid of children: Correlation and reference values. Clin. Chem. Lab. Med. CCLM 2015, 53, 2009–2014. [Google Scholar] [CrossRef]
- Scholle, M.L.; Lehmann, D.; Deschauer, M.; Kraya, T.; Zierz, S. FGF-21 as a Potential Biomarker for Mitochondrial Diseases. Curr. Med. Chem. 2018, 25, 2070–2081. [Google Scholar] [CrossRef] [PubMed]
- Morovat, A.; Weerasinghe, G.; Nesbitt, V.; Hofer, M.; Agnew, T.; Quaghebeur, G.; Sergeant, K.; Fratter, C.; Guha, N.; Mirzazadeh, M.; et al. Use of FGF-21 as a Biomarker of Mitochondrial Disease in Clinical Practice. J. Clin. Med. 2017, 6, 80. [Google Scholar] [CrossRef] [PubMed] [Green Version]
- Woo, Y.C.; Xu, A.; Wang, Y.; Lam, K.S. Fibroblast growth factor 21 as an emerging metabolic regulator: Clinical perspectives. Clin. Endocrinol. 2013, 78, 489–496. [Google Scholar] [CrossRef] [PubMed]
- Suomalainen, A.; Elo, J.M.; Pietiläinen, K.H.; Hakonen, A.H.; Sevastianova, K.; Korpela, M.; Isohanni, P.; Marjavaara, S.K.; Tyni, T.; Kiuru-Enari, S.; et al. FGF-21 as a biomarker for muscle-manifesting mitochondrial respiratory chain deficiencies: A diagnostic study. Lancet Neurol. 2011, 10, 806–818. [Google Scholar] [CrossRef]
- Lehtonen, J.M.; Forsström, S.; Bottani, E.; Viscomi, C.; Baris, O.R.; Isoniemi, H.; Höckerstedt, K.; Österlund, P.; Hurme, M.; Jylhävä, J.; et al. FGF21 is a biomarker for mitochondrial translation and mtDNA maintenance disorders. Neurology 2016, 87, 2290–2299. [Google Scholar] [CrossRef] [PubMed]
- Tranchant, C.; Anheim, M. Movement disorders in mitochondrial diseases. Rev. Neurol. 2016, 172, 524–529. [Google Scholar] [CrossRef]
- Varhaug, K.N.; Hikmat, O.; Nakkestad, H.L.; Vedeler, C.A.; Bindoff, L.A. Serum biomarkers in primary mitochondrial disorders. Brain Commun. 2021, 3, fcaa222. [Google Scholar] [CrossRef]
- Davis, R.L.; Liang, C.; Sue, C.M. A comparison of current serum biomarkers as diagnostic indicators of mitochondrial diseases. Neurology 2016, 86, 2010–2015. [Google Scholar] [CrossRef]
- Riley, L.G.; Nafisinia, M.; Menezes, M.J.; Nambiar, R.; Williams, A.; Barnes, E.H.; Selvanathan, A.; Lichkus, K.; Bratkovic, D.; Yaplito-Lee, J.; et al. FGF21 outperforms GDF15 as a diagnostic biomarker of mitochondrial disease in children. Mol. Genet. Metab. 2022, 135, 63–71. [Google Scholar] [CrossRef]
- Zheng, Y.-S.; Sun, C.; Wang, R.; Chen, N.; Luo, S.-S.; Xi, J.-Y.; Lu, J.-H.; Zhao, C.-B.; Li, Y.-X.; Zhou, L.; et al. Neurofilament light is a novel biomarker for mitochondrial encephalomyopathy, lactic acidosis, and stroke-like episodes. Sci. Rep. 2021, 11, 2001. [Google Scholar] [CrossRef]
- Altmann, P.; Ponleitner, M.; Rommer, P.S.; Haslacher, H.; Mucher, P.; Leutmezer, F.; Petzold, A.; Wotawa, C.; Lanzenberger, R.; Berger, T.; et al. Seven day pre-analytical stability of serum and plasma neurofilament light chain. Sci. Rep. 2021, 11, 11034. [Google Scholar] [CrossRef] [PubMed]
- Tanno, T.; Noel, P.; Miller, J.L. Growth differentiation factor 15 in erythroid health and disease. Curr. Opin. Hematol. 2010, 17, 184–190. [Google Scholar] [CrossRef] [PubMed]
- Wittig, I.; Braun, H.P.; Schägger, H. Blue native PAGE. Nat. Protoc. 2006, 1, 418–428. [Google Scholar] [CrossRef]
- McKenzie, M.; Lazarou, M.; Thorburn, D.R.; Ryan, M.T. Mitochondrial respiratory chain supercomplexes are destabilized in Barth Syndrome patients. J. Mol. Biol. 2006, 361, 462–469. [Google Scholar] [CrossRef] [PubMed]
- Ghosh, S.; Iadarola, D.M.; Ball, W.B.; Gohil, V.M. Mitochondrial dysfunctions in barth syndrome. IUBMB Life 2019, 71, 791–801. [Google Scholar] [CrossRef] [PubMed]
- Hargreaves, I.P. Coenzyme Q10 as a therapy for mitochondrial disease. Int. J. Biochem. Cell Biol. 2014, 49, 105–111. [Google Scholar] [CrossRef] [PubMed]
- Sharma, R.; Reinstadler, B.; Engelstad, K.; Skinner, O.S.; Stackowitz, E.; Haller, R.G.; Clish, C.B.; Pierce, K.; Walker, M.A.; Fryer, R.; et al. Circulating markers of NADH-reductive stress correlate with mitochondrial disease severity. J. Clin. Investig. 2021, 131, e136055. [Google Scholar] [CrossRef]


| Enzyme | Reference | Principal of Assay |
|---|---|---|
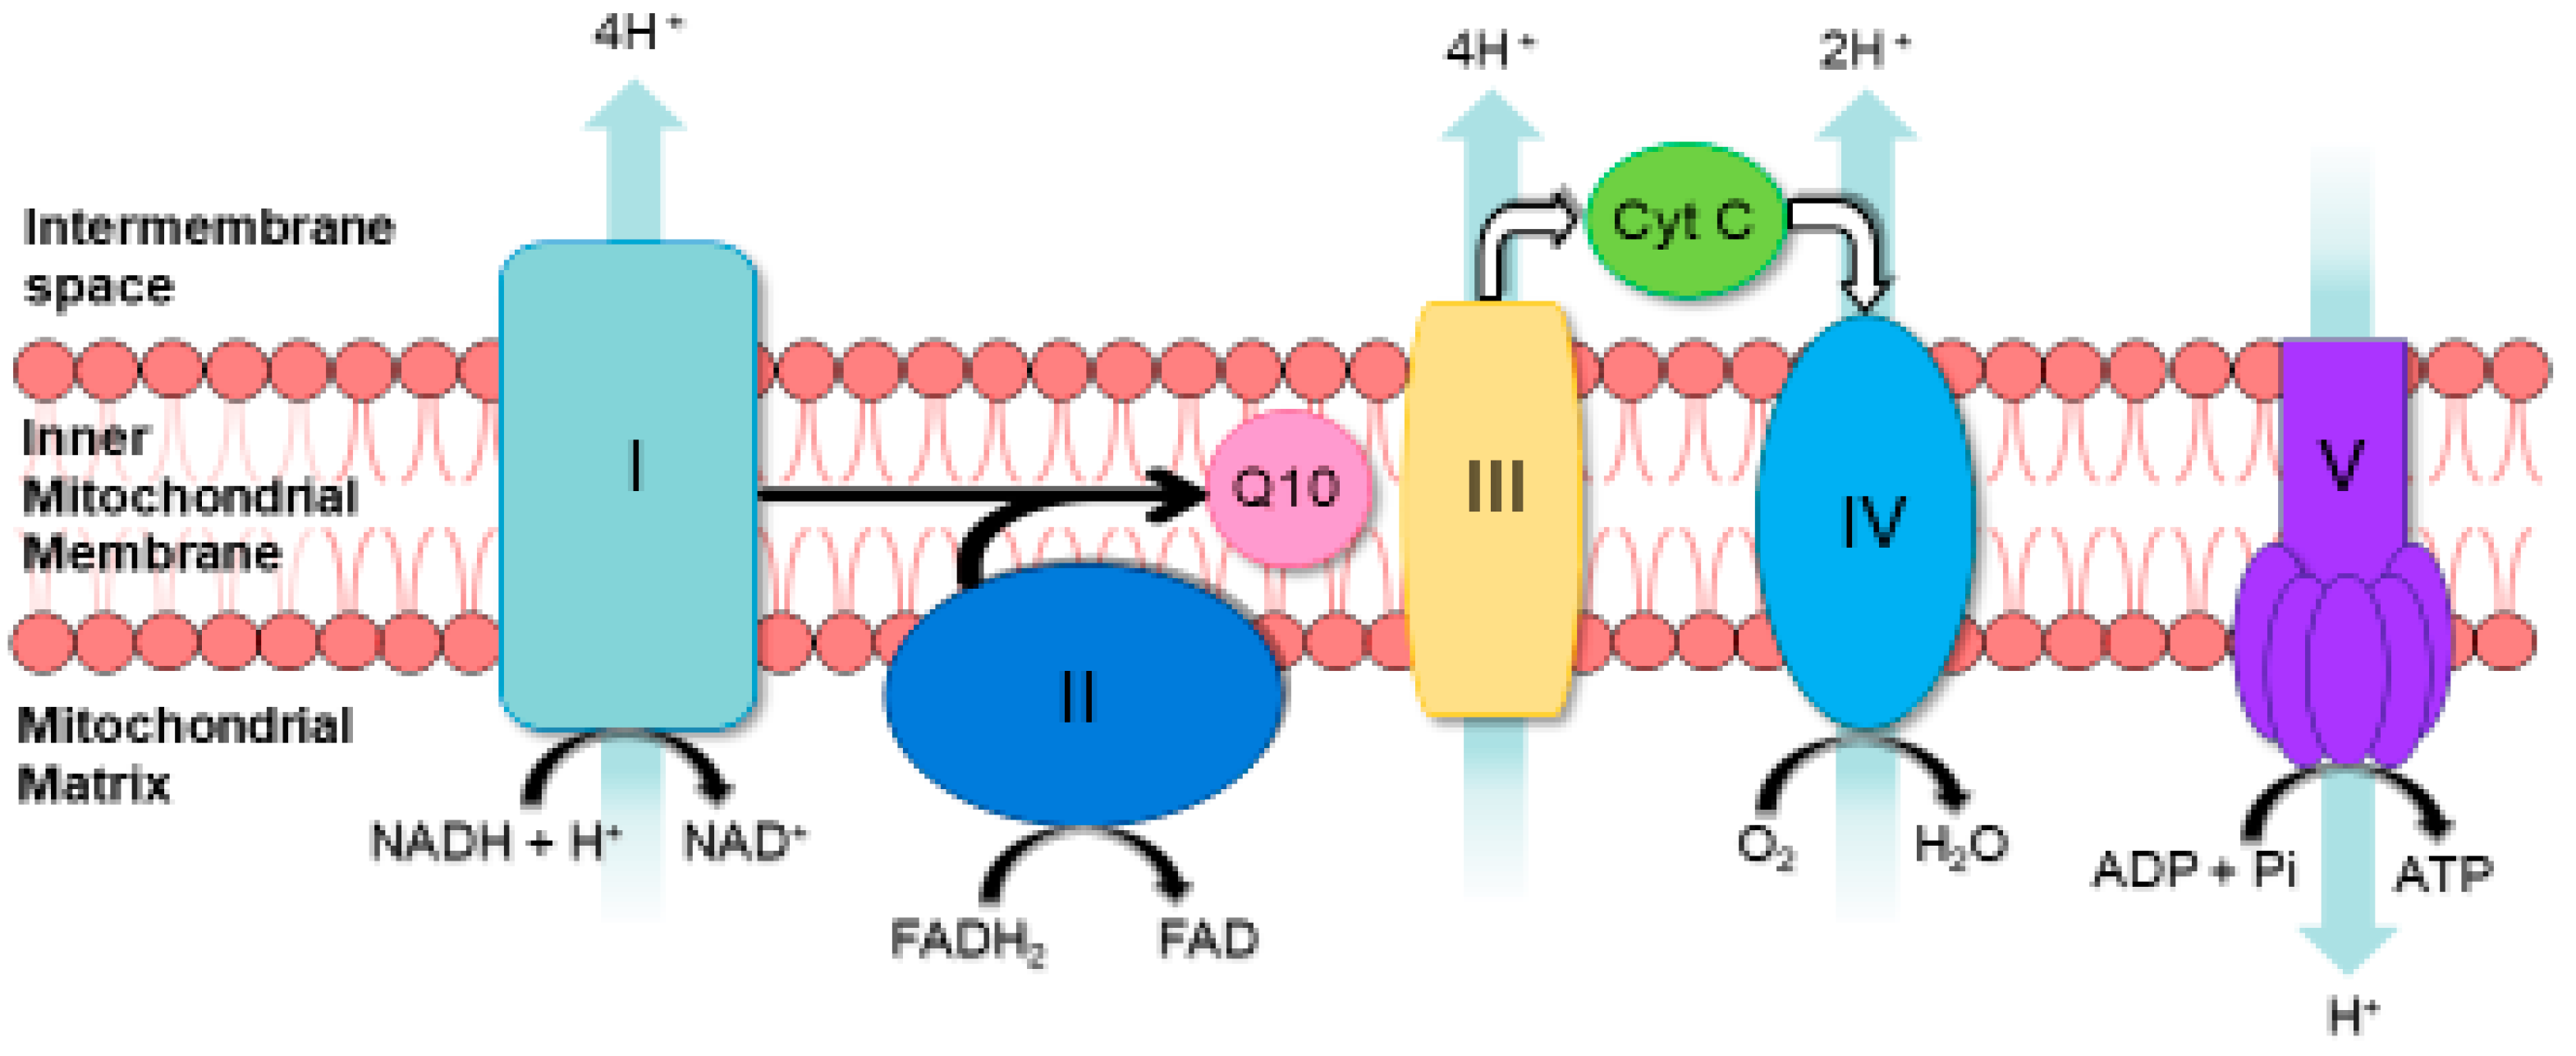
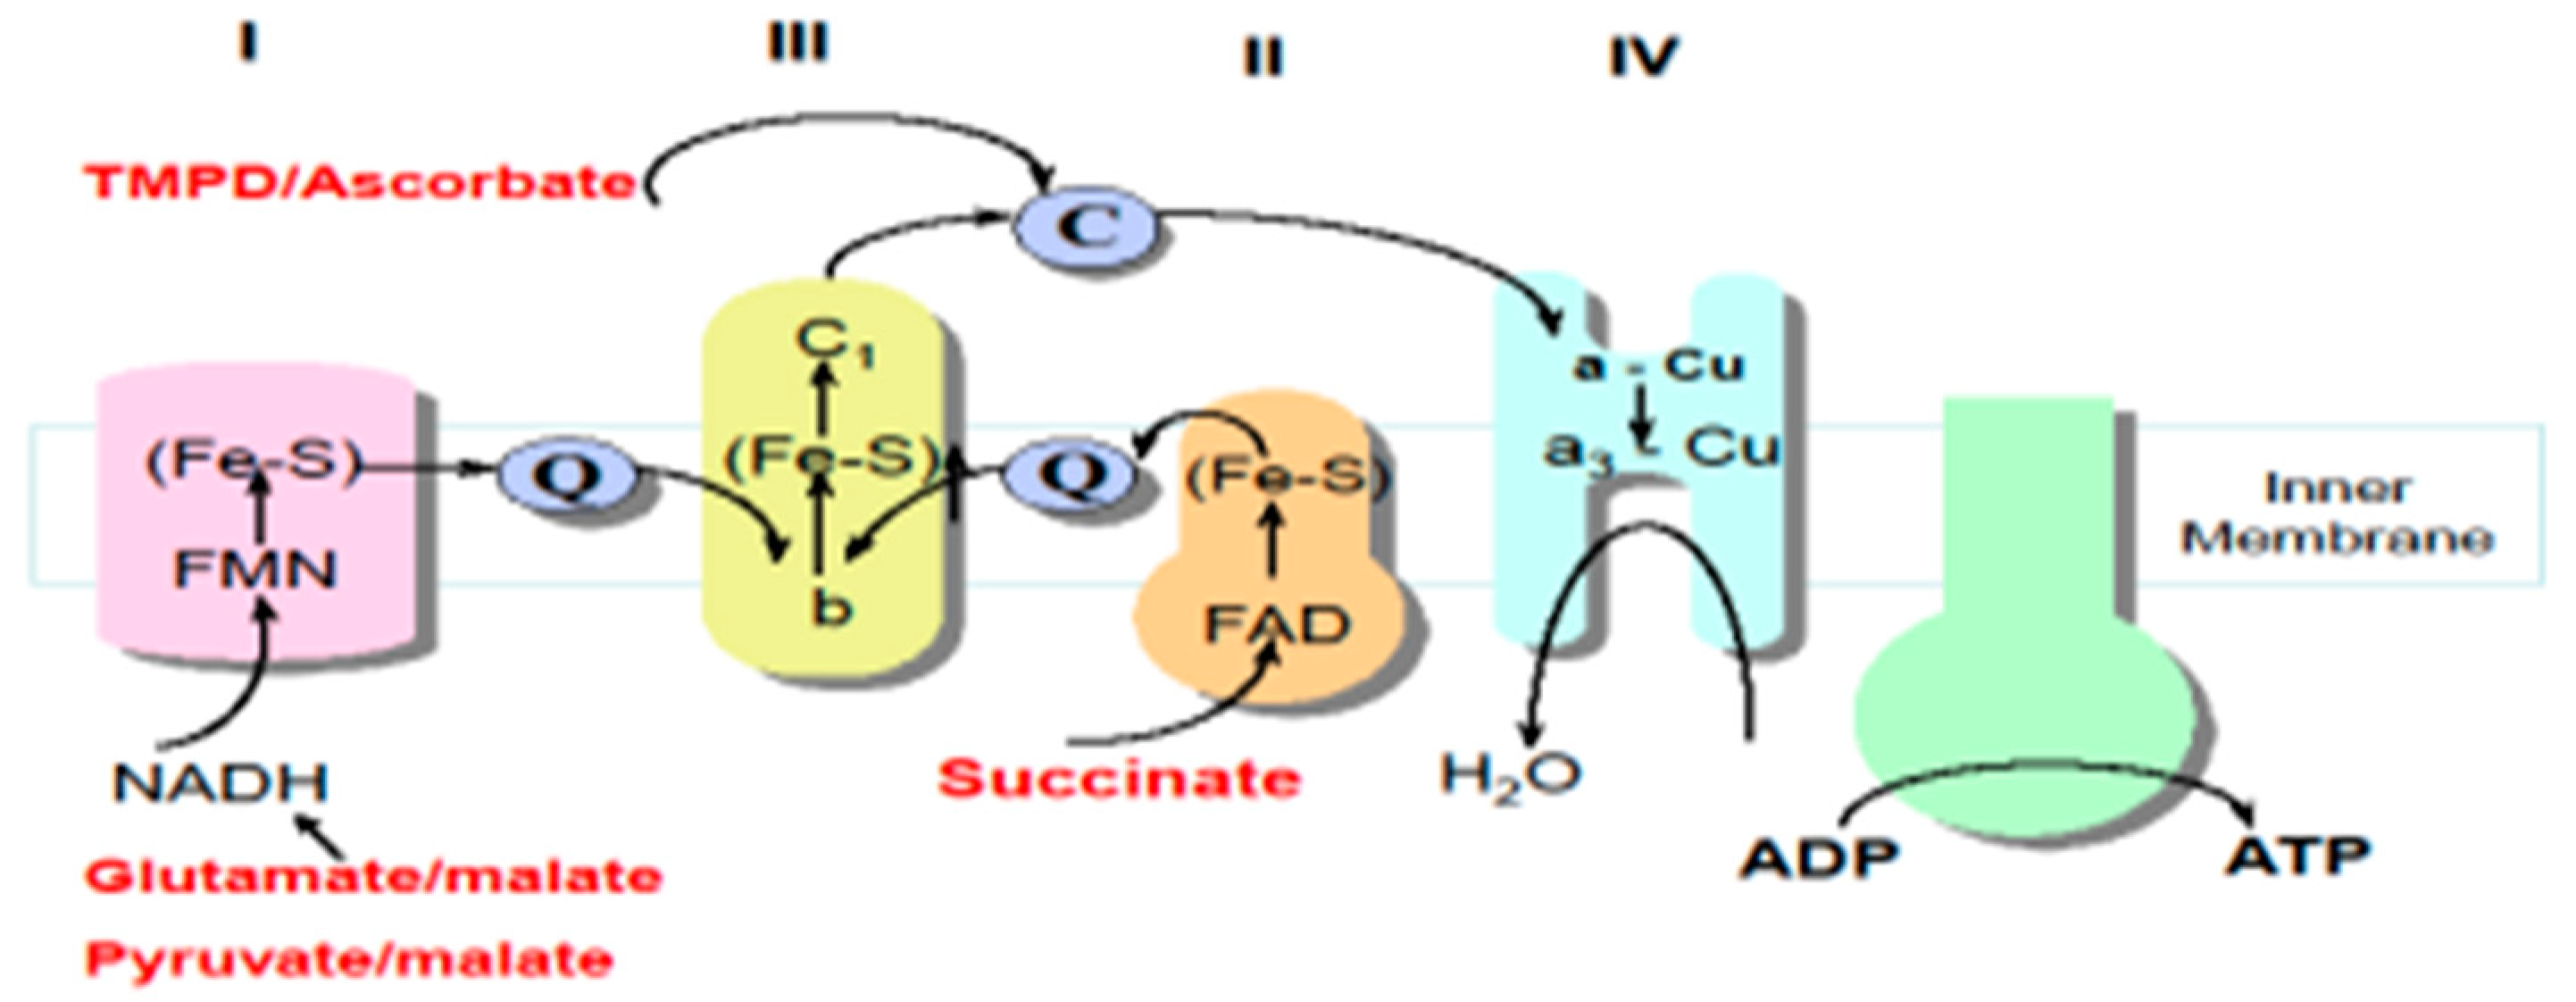
| MRC Complex I | [32] | NADH is oxidised complex I. Electrons are then transferred to CoQ1 (analogue of CoQ10), which is reduced to ubiquinol. Complex I activity is then measured by the rotenone-sensitive rate of NADH oxidation at 340 nm. |
| MRC Complex II | [32] | Succinate is oxidised by complex II and the resulting electrons are transferred from this enzyme via CoQ1 to DTNB (5,5′-dithio-bis-(2-nitrobenzoic acid)). Complex II activity is then measured by the succinate-dependent thenoyltrifluoroacetone (specific complex II inhibitor) reduction of DTNB at 600 nm. |
| MRC Complex III | [32] | Decylubiquinol (analogue of CoQ10) donates electrons to complex III, which then reduces cytochrome c (Cyt C). Complex III activity is then measured by the antimycin A (specific complex III inhibitor)-sensitive reduction of Cyt C at 550 nm. |
| MRC Complex IV | [32] | The potassium cyanide-sensitive oxidation of reduced Cyt. C by complex IV is measured at 550 nm. The activity is highly dependent on Cyt. C concentration. Consequently, activity is expressed as a pseudo-first-order rate constant. |
| MRC Complex I–III | [33] | NADH is oxidised by complex I. The electrons are then transferred to complex III by CoQ10, which then reduces Cyt C. The activity of complex I–III is measured by NADH-dependent, antimycin A-sensitive reduction of Cyt C at 550 nm. |
| MRC Complex II–III | [33] | Succinate is oxidised by complex II. Electrons are then transferred from complex II by CoQ10, which then reduces Cyt C. Complex II/III activity is measured by the succinate-dependent, antimycin A-sensitive reduction of Cyt C at 550 nm. |
| Citrate synthase (CS) | [32] | CS catalyses the condensation of oxaloacetate and acetyl-CoA to form citrate and free coenzyme A (CoA-SH). CoA-SH reacts with the compound DTNB to form thionitrobenzoate (TNB), which absorbs at 412 nm. The activity of CS is proportional to the amount of TNB formed. |
Publisher’s Note: MDPI stays neutral with regard to jurisdictional claims in published maps and institutional affiliations. |
© 2022 by the authors. Licensee MDPI, Basel, Switzerland. This article is an open access article distributed under the terms and conditions of the Creative Commons Attribution (CC BY) license (https://creativecommons.org/licenses/by/4.0/).
Share and Cite
Turton, N.; Cufflin, N.; Dewsbury, M.; Fitzpatrick, O.; Islam, R.; Watler, L.L.; McPartland, C.; Whitelaw, S.; Connor, C.; Morris, C.; et al. The Biochemical Assessment of Mitochondrial Respiratory Chain Disorders. Int. J. Mol. Sci. 2022, 23, 7487. https://doi.org/10.3390/ijms23137487
Turton N, Cufflin N, Dewsbury M, Fitzpatrick O, Islam R, Watler LL, McPartland C, Whitelaw S, Connor C, Morris C, et al. The Biochemical Assessment of Mitochondrial Respiratory Chain Disorders. International Journal of Molecular Sciences. 2022; 23(13):7487. https://doi.org/10.3390/ijms23137487
Chicago/Turabian StyleTurton, Nadia, Neve Cufflin, Mollie Dewsbury, Olivia Fitzpatrick, Rahida Islam, Lowidka Linares Watler, Cara McPartland, Sophie Whitelaw, Caitlin Connor, Charlotte Morris, and et al. 2022. "The Biochemical Assessment of Mitochondrial Respiratory Chain Disorders" International Journal of Molecular Sciences 23, no. 13: 7487. https://doi.org/10.3390/ijms23137487