
Methylphenidate Restores Behavioral and Neuroplasticity Impairments in the Prenatal Nicotine Exposure Mouse Model of ADHD: Evidence for Involvement of AMPA Receptor Subunit Composition and Synaptic Spine Morphology in the Hippocampus

 , , , and
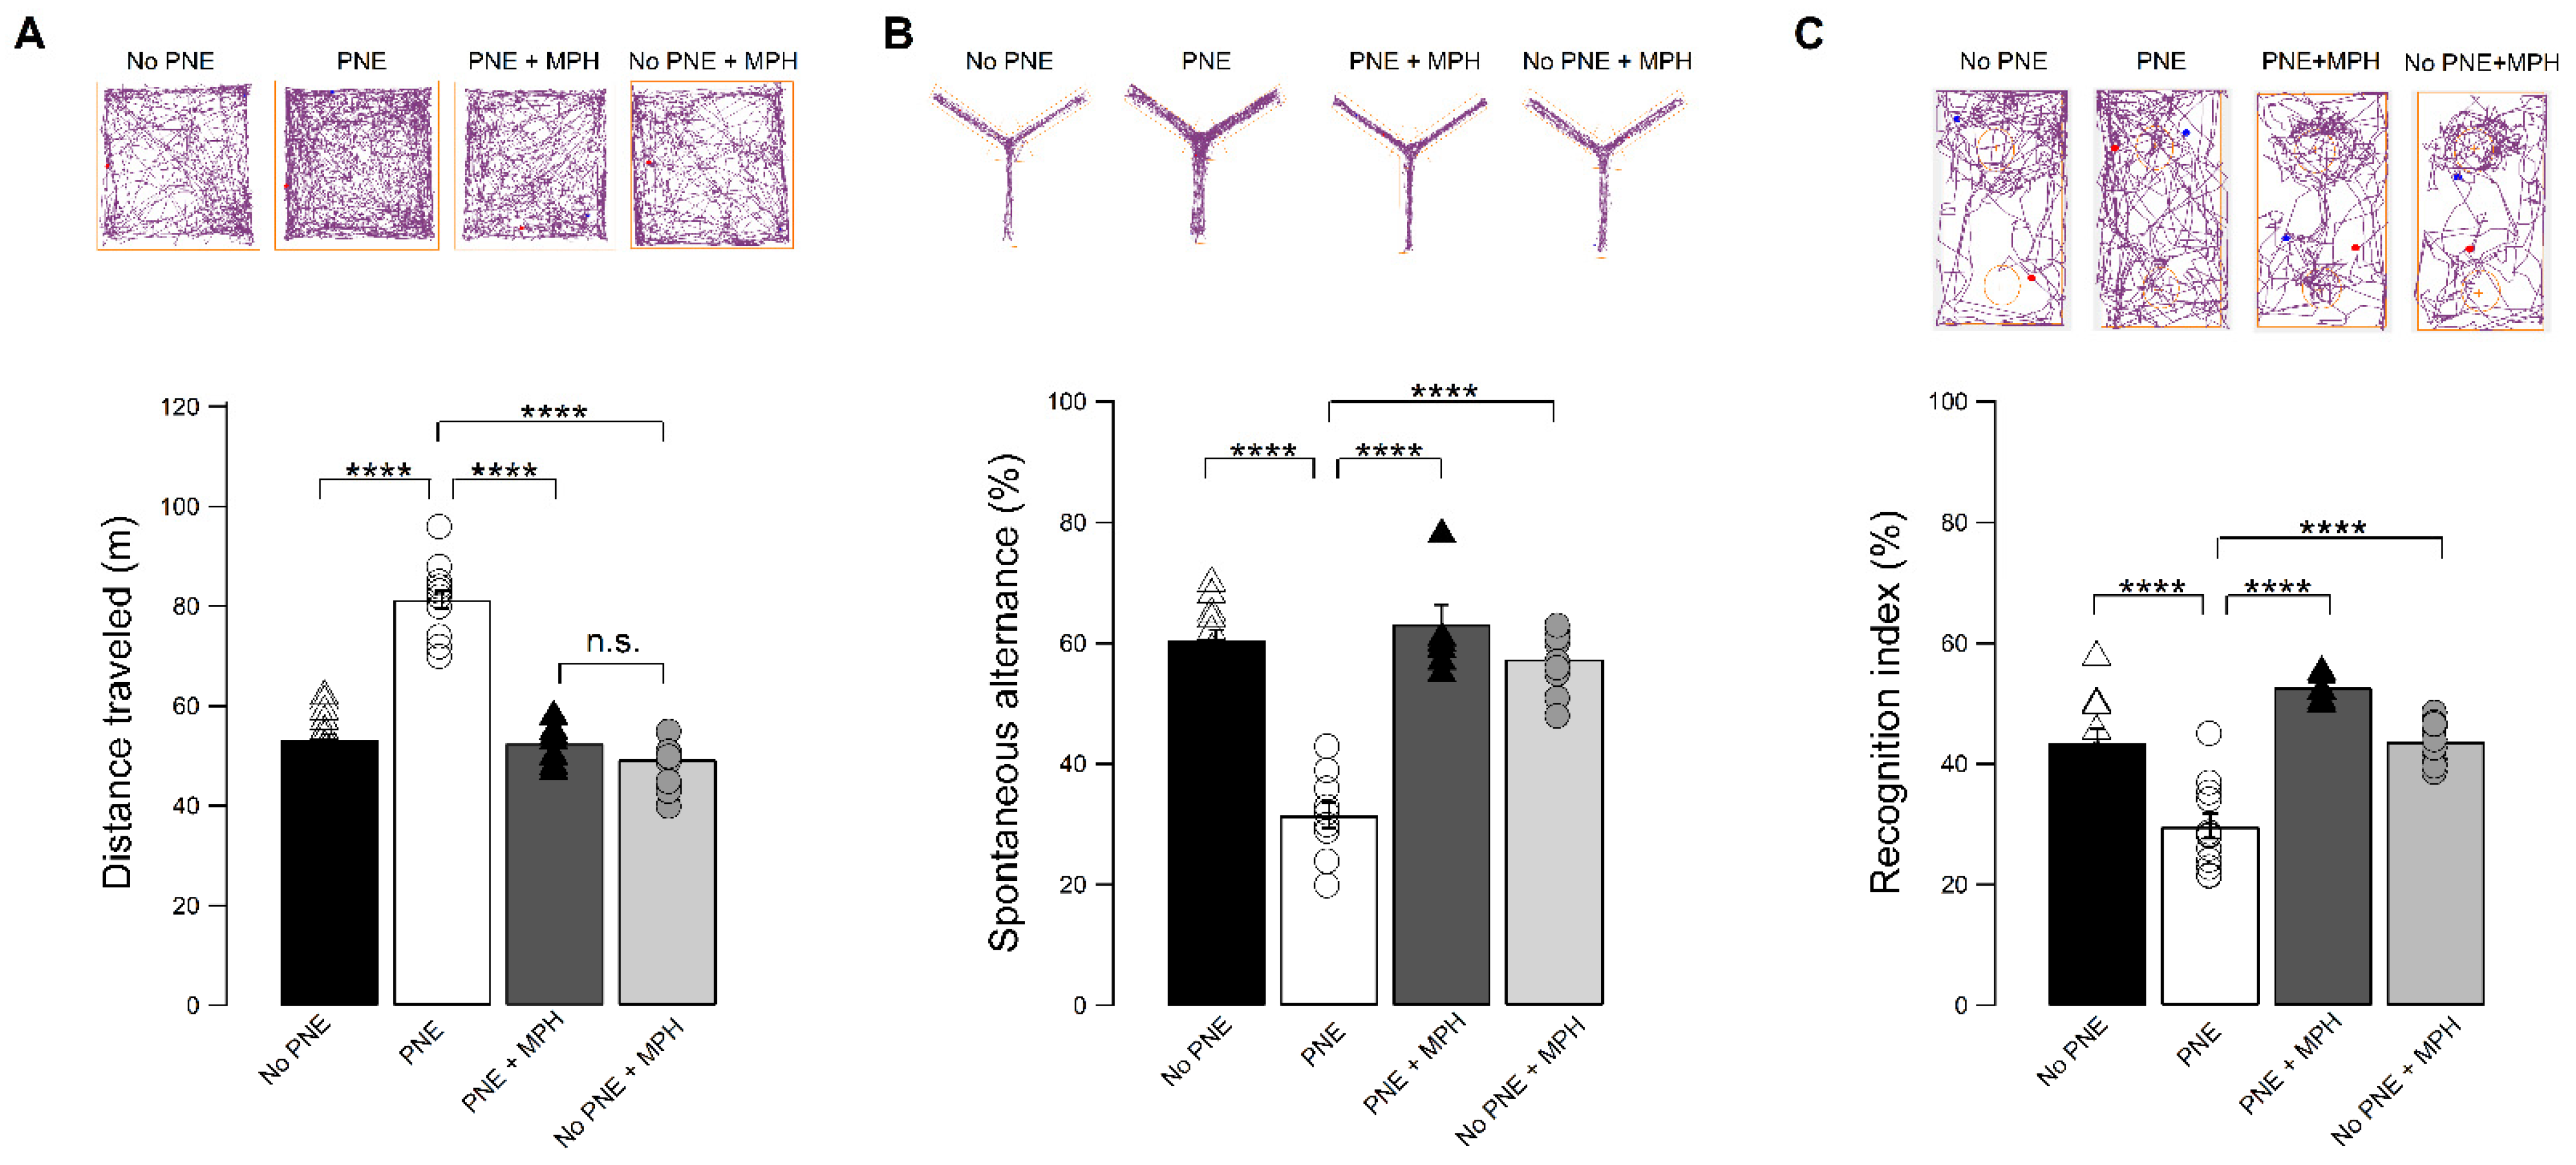
Abstract
:1. Introduction
1.1. The PNE Model of ADHD
1.2. Role of the Hippocampus in Neuroplastic Changes Related to ADHD and MPH-Induced Neuroplasticity
1.3. Induction of Hippocampal LTP at the CA3/CA1 Synapse Changes AMPAR Subunit Composition
1.4. Spine Maturation and ADHD
2. Results
2.1. A Single Dose of Orally Administered MPH Decreases Motor Hyperactivity and Improves Attention and Working Memory in PNE Mice
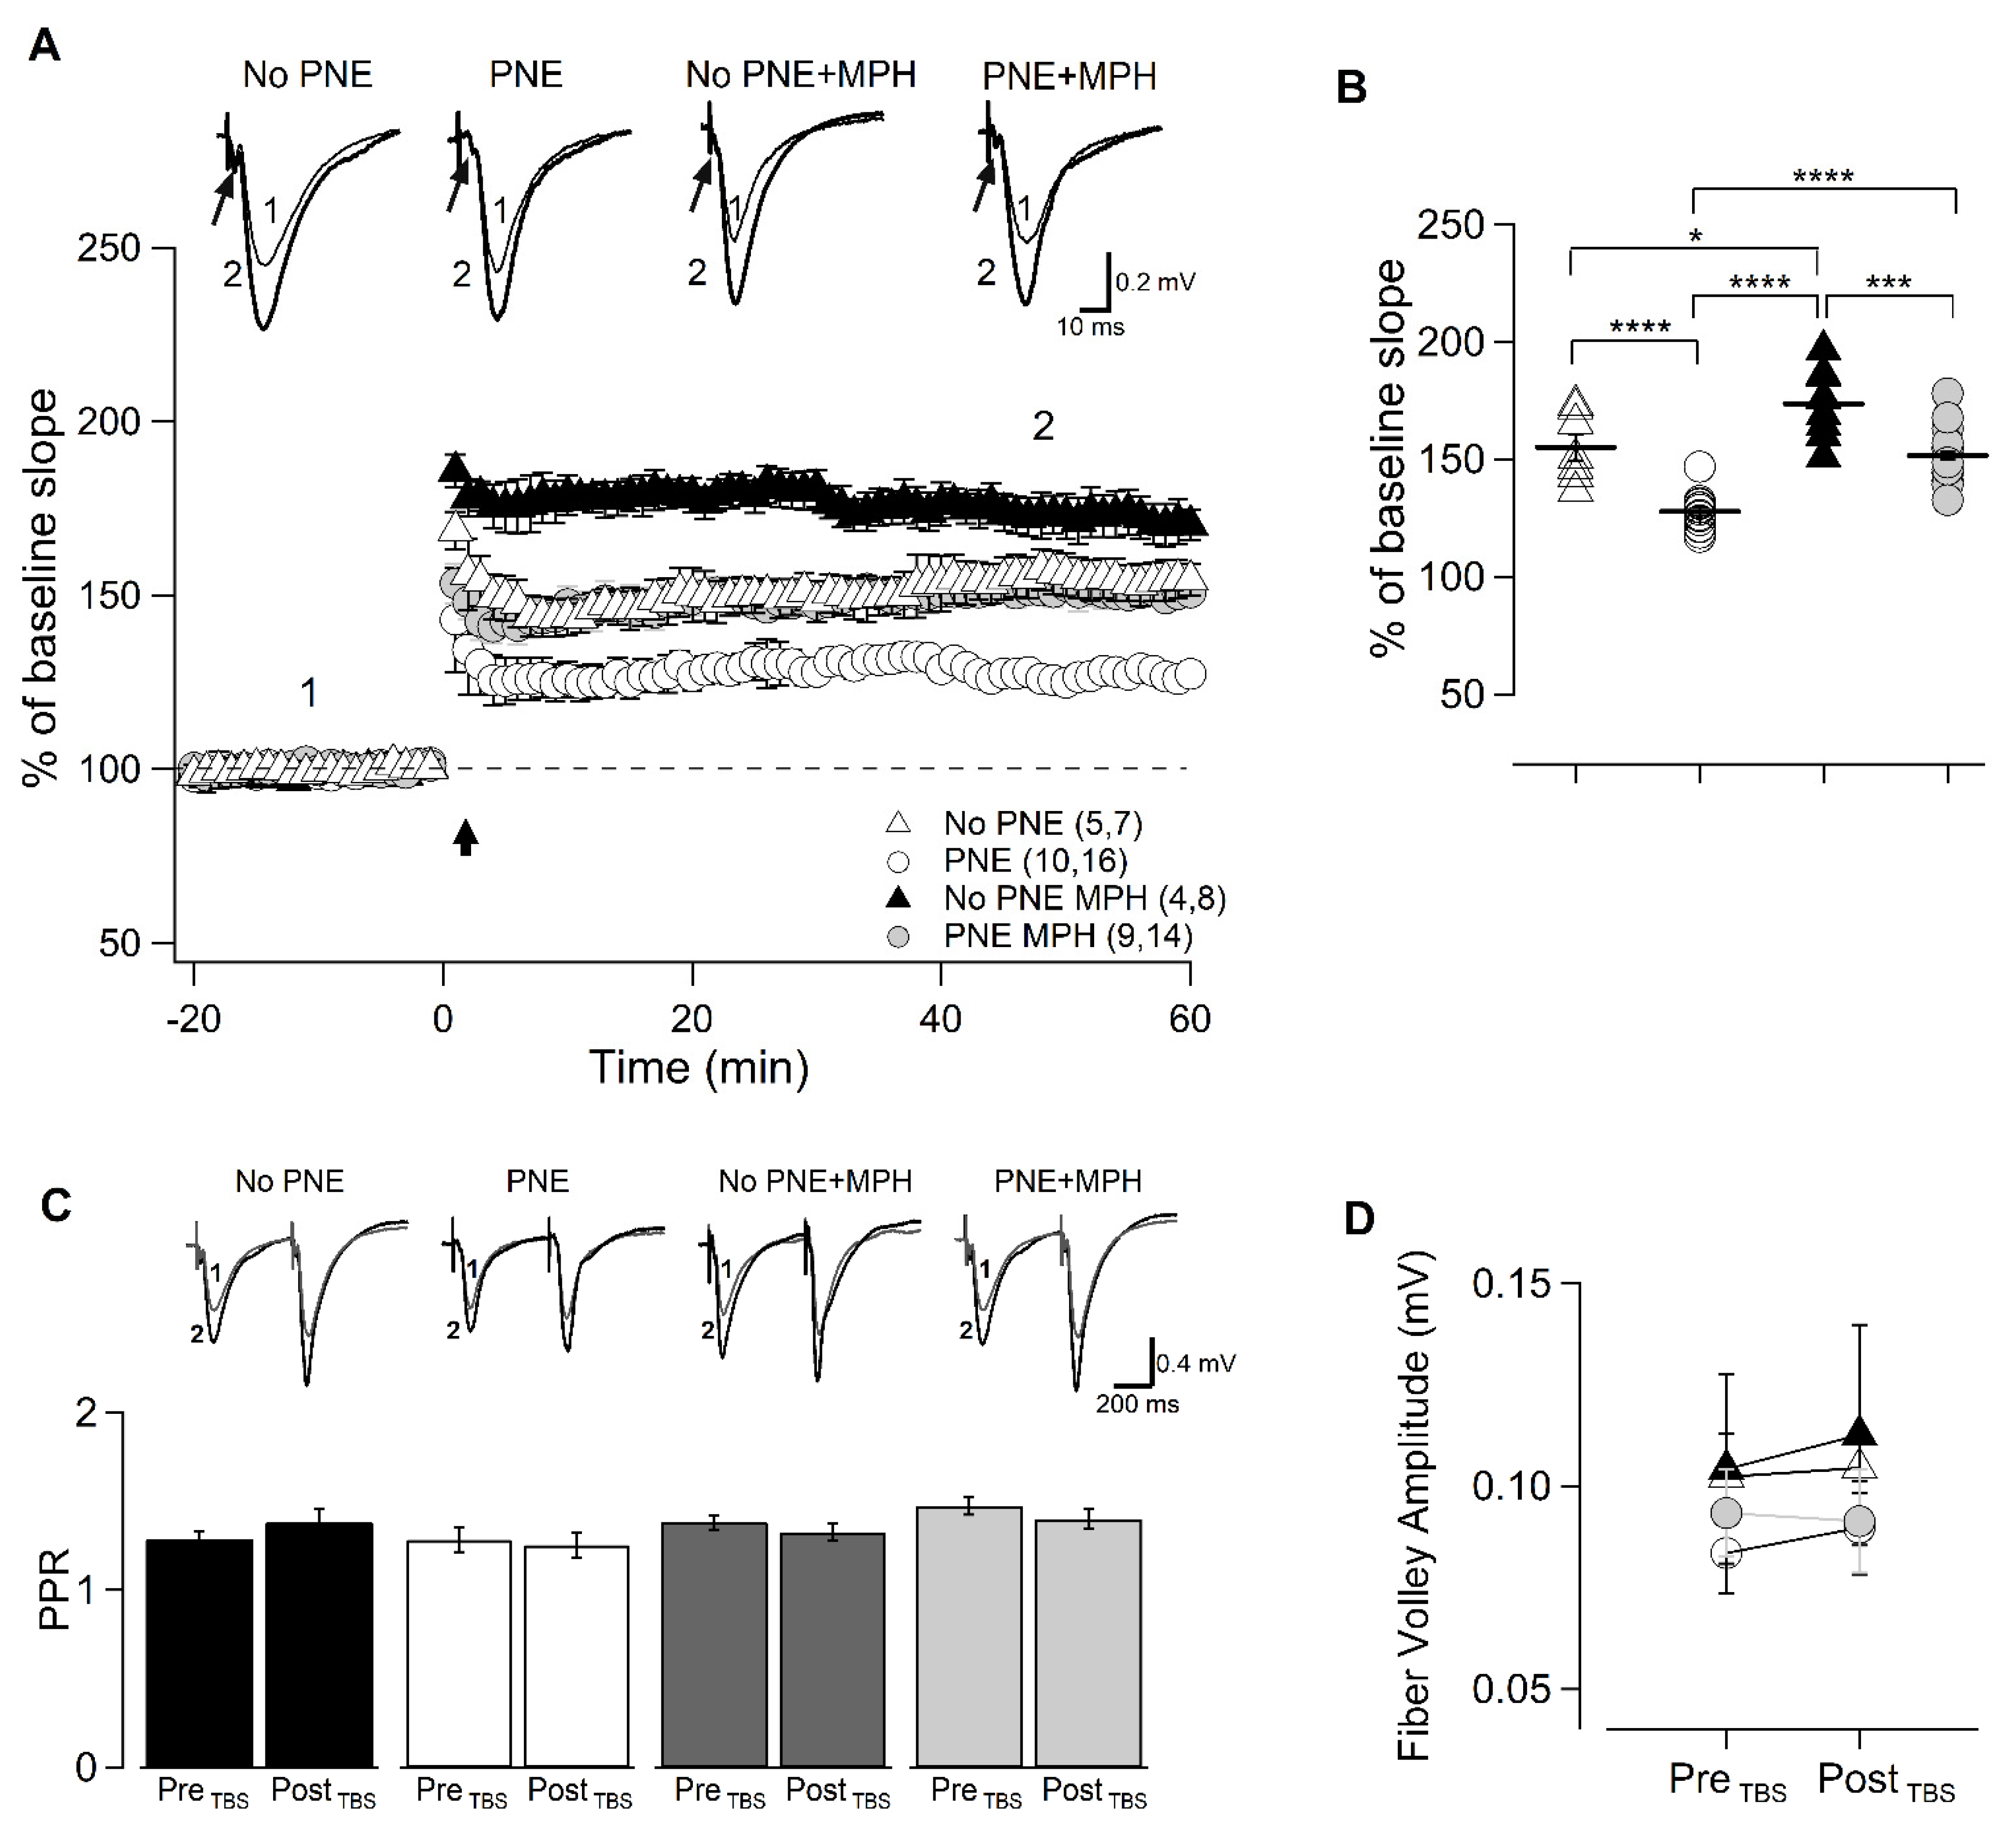
2.2. MPH Restores Electrophysiological Parameters and Neuroplasticity at the CA3/CA1 Synapse Mainly Acting at Postsynaptic Sites
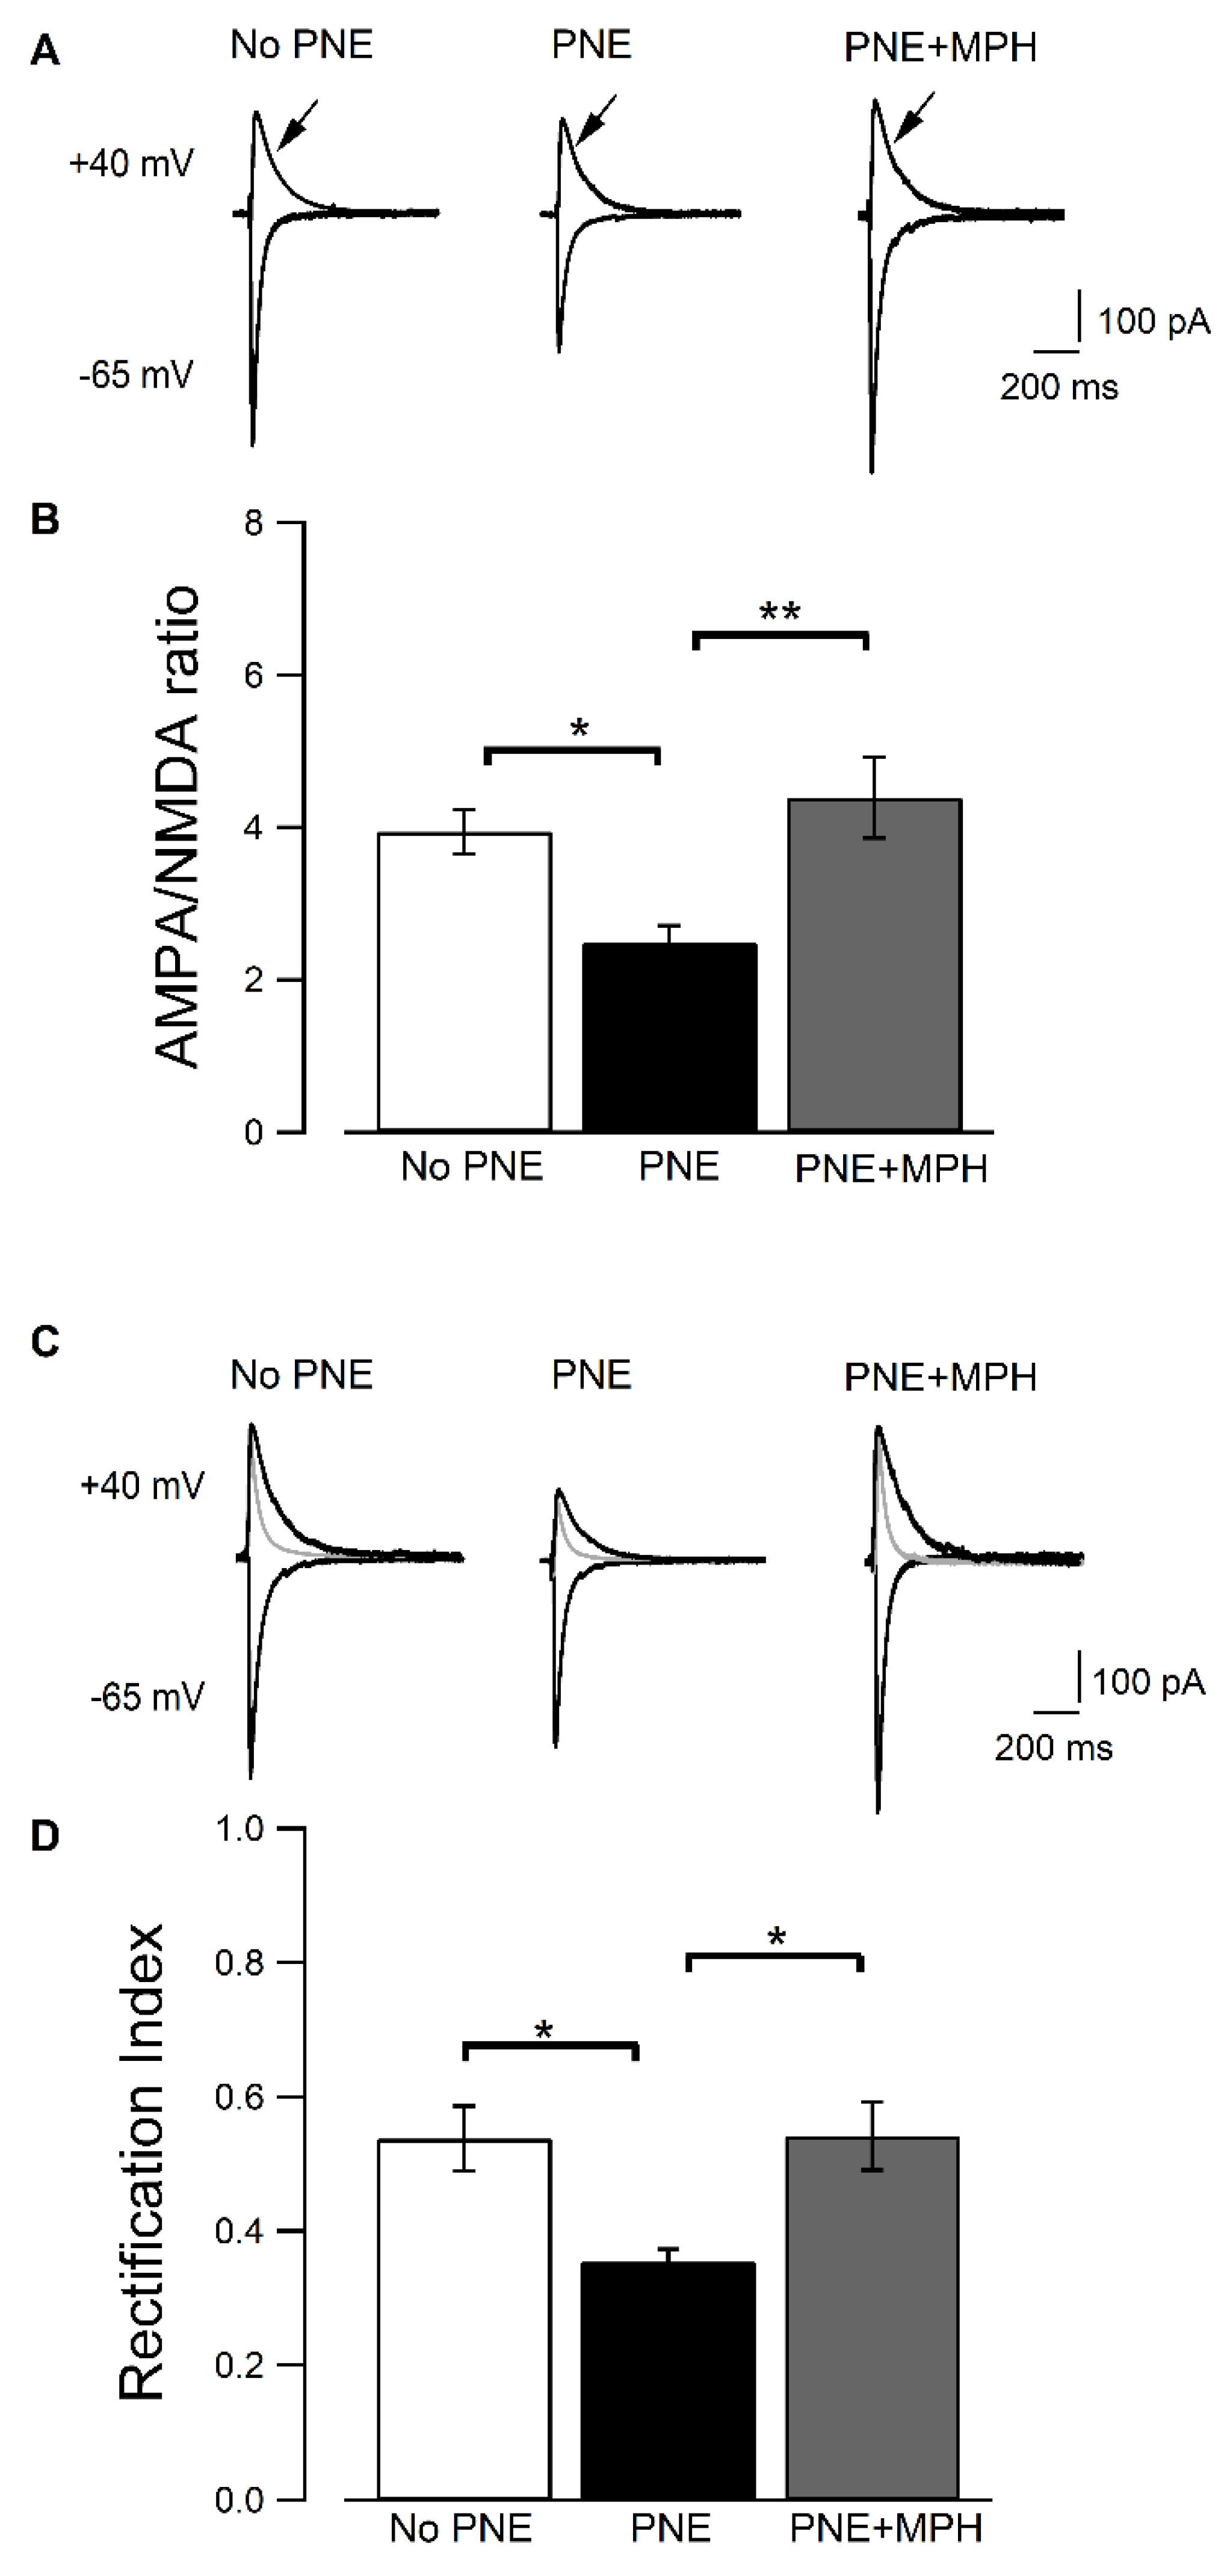
2.3. AMPAR-Dependent EPSCs Are Decreased in CA1 Pyramidal Neurons from PNE Mice and Are Restored in PNE Animals after Administration of MPH
2.4. Induction of LTP, Its Reduction in PNE Mice and Recovery by MPH Is Correlated to Changes in AMPAR Subunit Composition
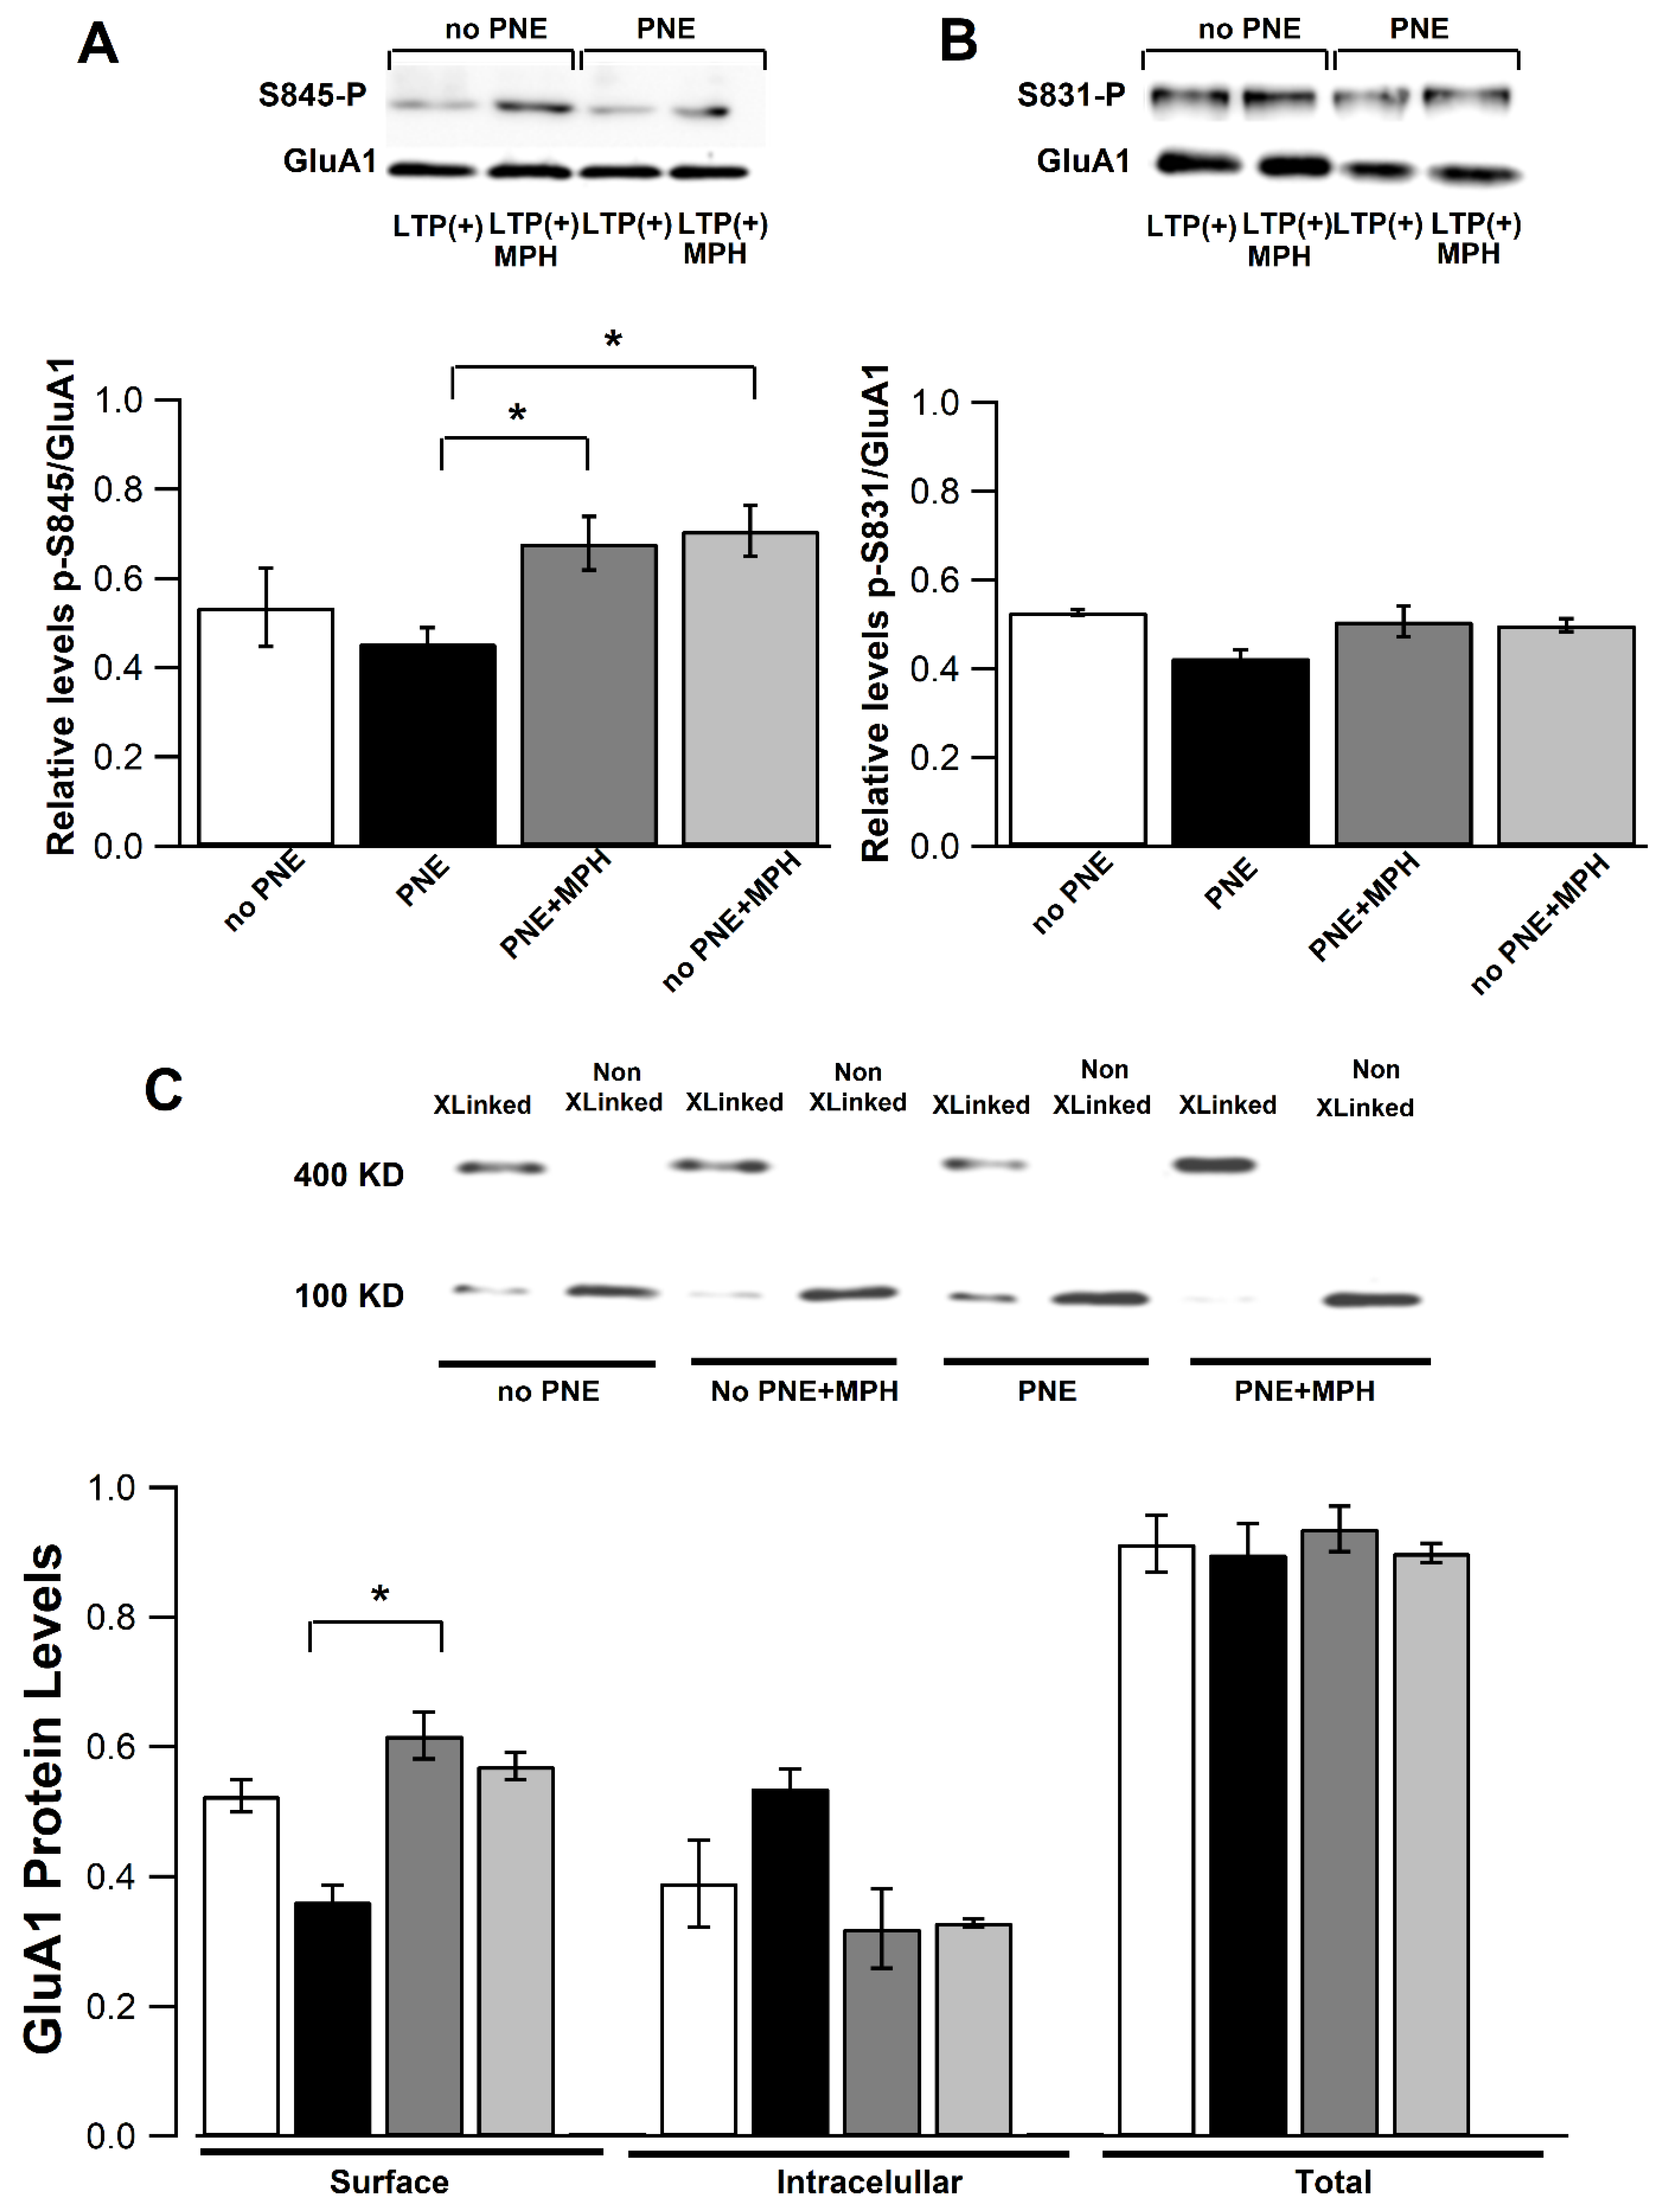
2.5. MPH Administration Restores Phosphorylation of Ser845 of the GLUA1 Subunit and Surface GluA1 AMPA Receptor Levels in CA1 Pyramidal Neurons of PNE Mice
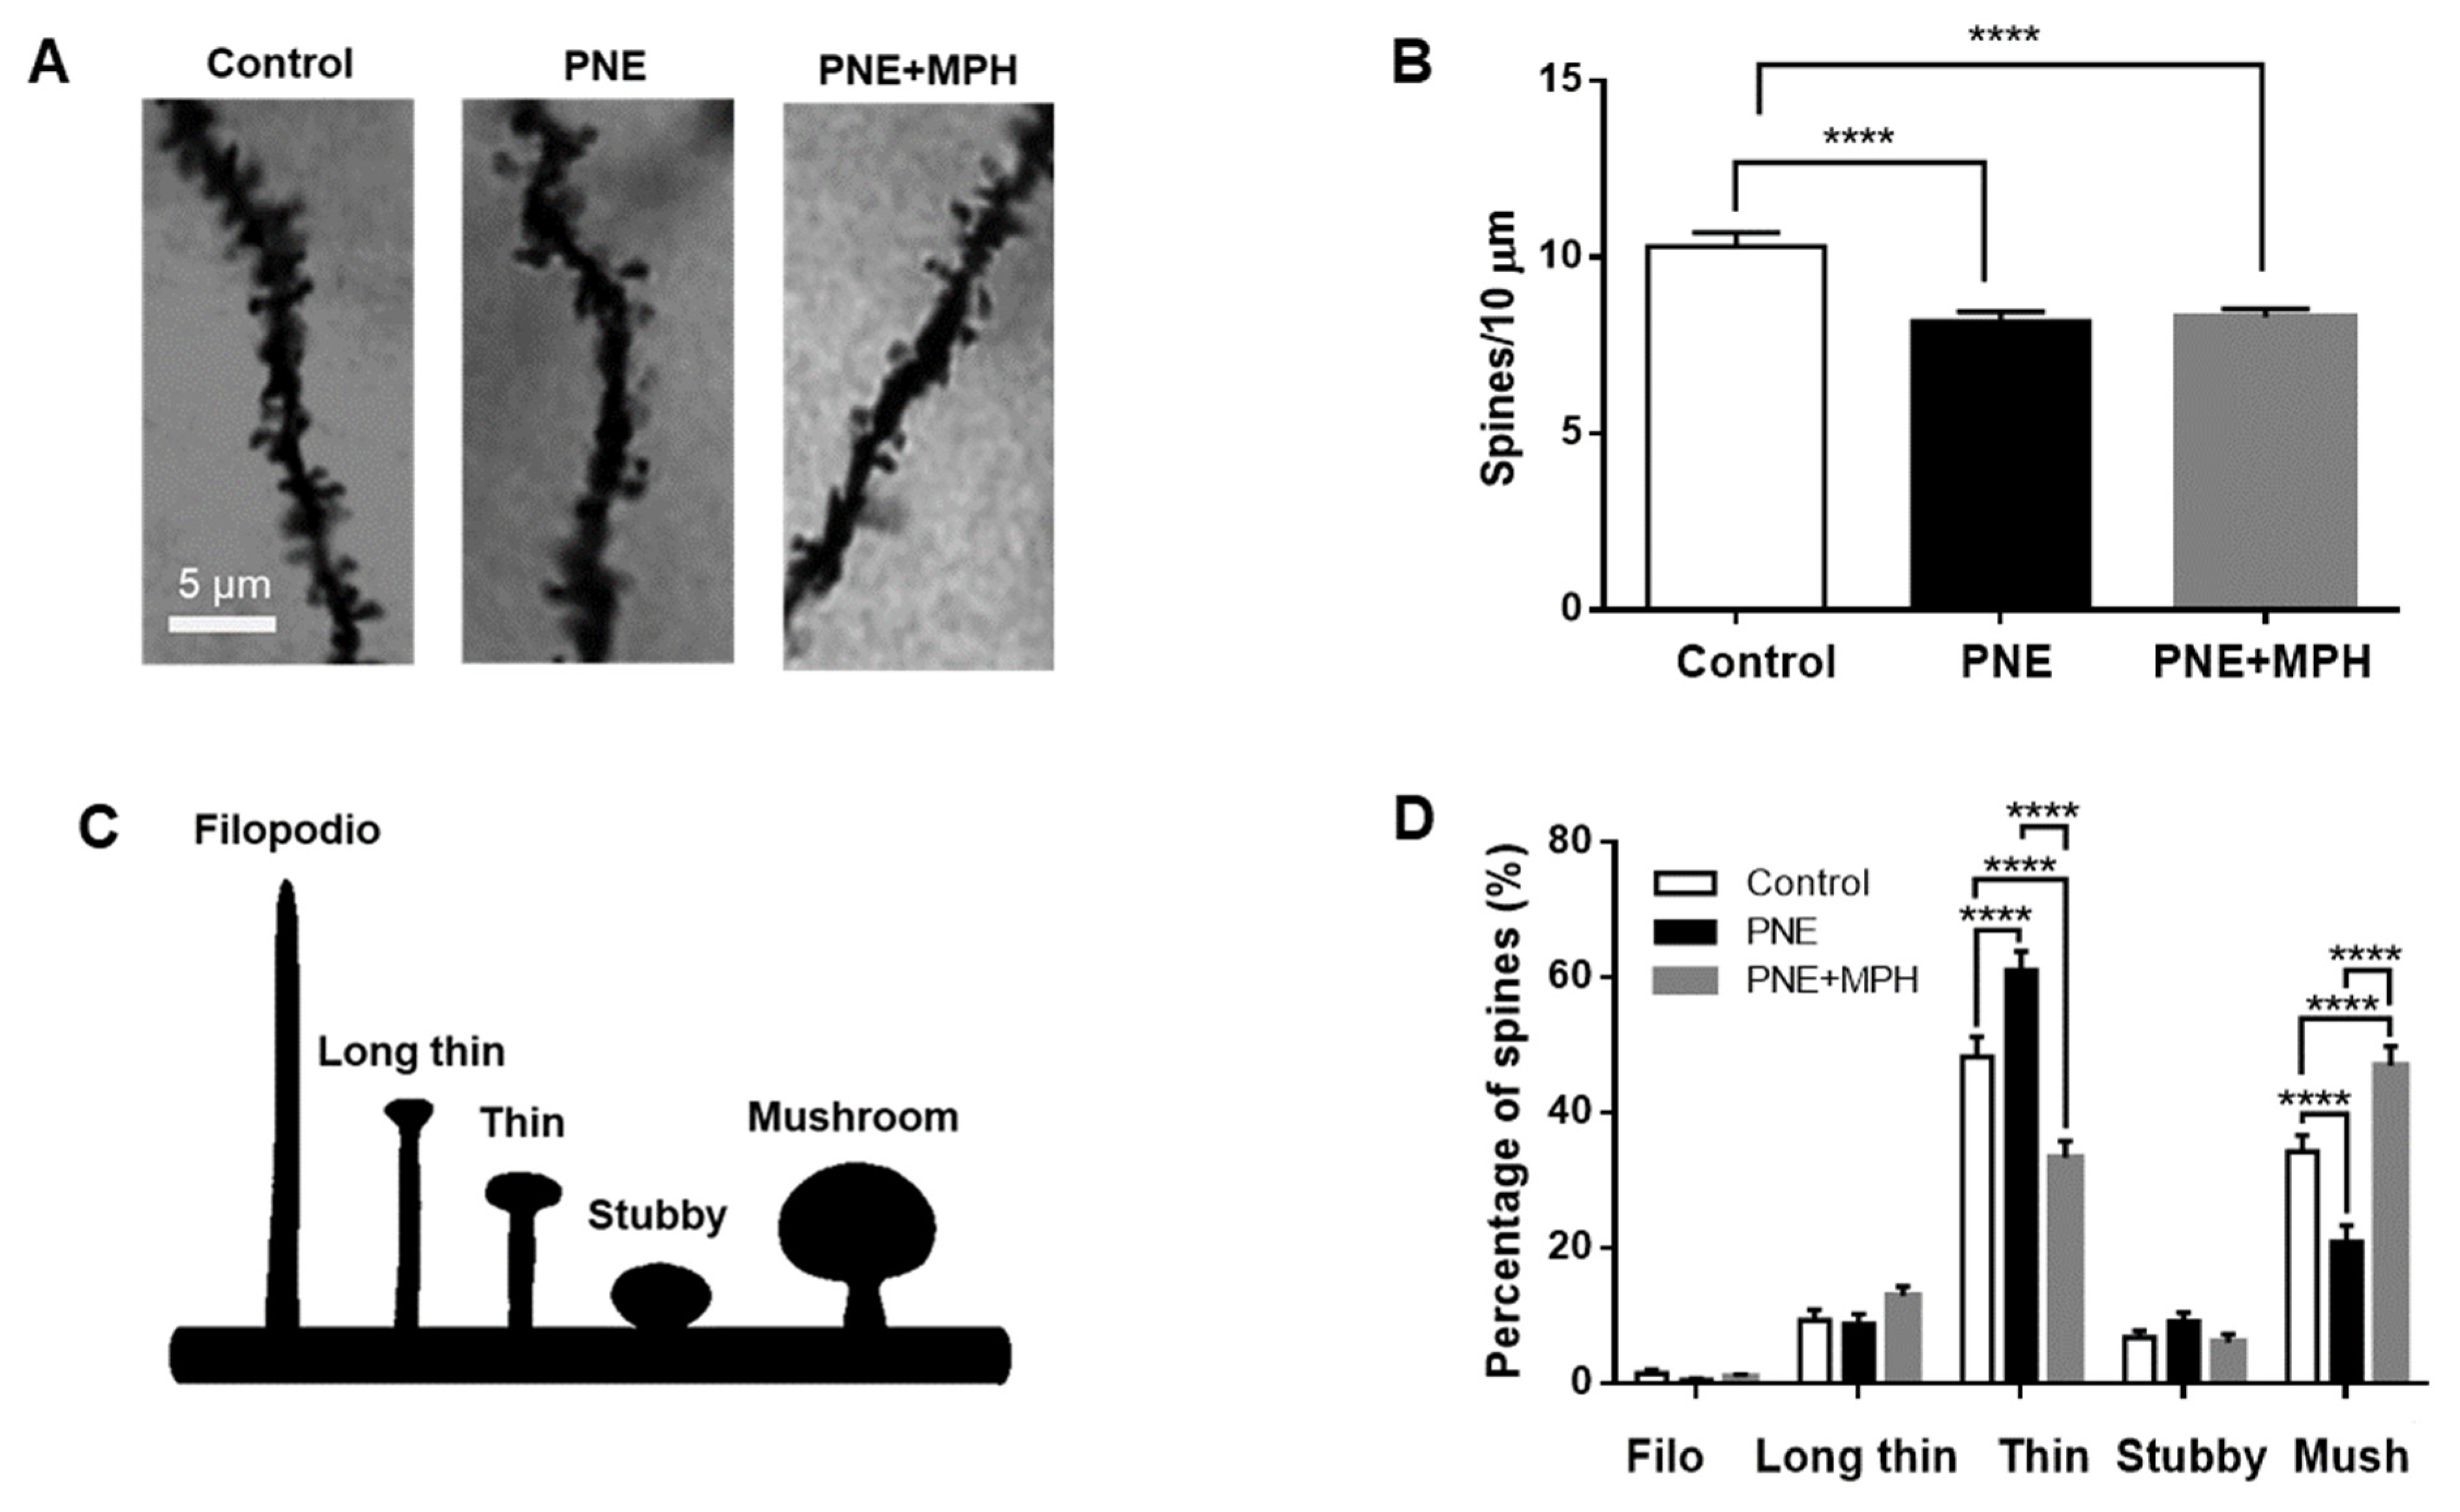
2.6. Dendritic Spine Density and Maturation State Are Impaired in PNE Mice; MPH Restores Maturation of Dendritic Spines, but Not Their Density
3. Discussion
3.1. Restoration of ADHD Symptoms to Normal by Single Oral Administration of MPH
3.2. Differences in Neuroplasticity between PNE Mice and Controls and Restoration of Neuroplasticity by MPH Are Essentially Due to Postsynaptic Processes
3.3. Electrophysiological and Molecular Evidence for Differences/Changes in AMPAR Composition
3.4. Maturation of Dendritic Spines Is Correlated to the Differences/Changes Observed with Electrophysiological and Molecular Methods
4. Conclusions
5. Materials and Methods
5.1. Management Protocol and Animal Care
5.2. Murine Model of ADHD Induced by Prenatal Nicotine Exposure
5.3. Administration of MPH
5.4. Behavioral Tests
5.5. Hippocampal Slices
5.6. Electrophysiology
5.7. Western Blot
5.8. Crosslinking Assay
5.9. Golgi Staining and Dendritic Spines Analysis
5.10. Statistical Analysis
Author Contributions
Funding
Institutional Review Board Statement
Informed Consent Statement
Data Availability Statement
Conflicts of Interest
References
- Joseph, J.; Devu, B. Prevalence of Attention-Deficit Hyperactivity Disorder in India: A Systematic Review and Meta-Analysis. Indian J. Psychiatr. Nurs. 2019, 16, 118. [Google Scholar] [CrossRef]
- Carpenter Rich, E.; Loo, S.K.; Yang, M.; Dang, J.; Smalley, S.L. Social Functioning Difficulties in ADHD: Association with PDD Risk. Clin. Child Psychol. Psychiatry 2009, 14, 329–344. [Google Scholar] [CrossRef] [PubMed] [Green Version]
- Simon, N.; Rolland, B.; Karila, L. Methylphenidate in Adults with Attention Deficit Hyperactivity Disorder and Substance Use Disorders. Curr. Pharm. Des. 2015, 21, 3359–3366. [Google Scholar] [CrossRef] [PubMed]
- Arnsten, A.F.; Dudley, A.G. Methylphenidate Improves Prefrontal Cortical Cognitive Function through Alpha2 Adrenoceptor and Dopamine D1 Receptor Actions: Relevance to Therapeutic Effects in Attention Deficit Hyperactivity Disorder. Behav. Brain Funct. 2005, 1, 2. [Google Scholar] [CrossRef] [Green Version]
- Banaschewski, T.; Becker, K.; Scherag, S.; Franke, B.; Coghill, D. Molecular Genetics of Attention-Deficit/Hyperactivity Disorder: An Overview. Eur. Child Adolesc. Psychiatry 2010, 19, 237–257. [Google Scholar] [CrossRef] [Green Version]
- Sagvolden, T.; Johansen, E.B. Rat Models of ADHD. Curr. Top. Behav. Neurosci. 2012, 9, 301–315. [Google Scholar] [CrossRef] [Green Version]
- Majdak, P.; Ossyra, J.R.; Ossyra, J.M.; Cobert, A.J.; Hofmann, G.C.; Tse, S.; Panozzo, B.; Grogan, E.L.; Sorokina, A.; Rhodes, J.S. A New Mouse Model of ADHD for Medication Development. Sci. Rep. 2016, 6, 39472. [Google Scholar] [CrossRef] [Green Version]
- Bouchatta, O.; Manouze, H.; Bouali-benazzouz, R.; Kerekes, N.; Ba-M’hamed, S.; Fossat, P.; Landry, M.; Bennis, M. Neonatal 6-OHDA Lesion Model in Mouse Induces Attention-Deficit/ Hyperactivity Disorder (ADHD)-like Behaviour. Sci. Rep. 2018, 8, 15349. [Google Scholar] [CrossRef] [Green Version]
- Huang, J.; Zhong, Z.; Wang, M.; Chen, X.; Tan, Y.; Zhang, S.; He, W.; He, X.; Huang, G.; Lu, H.; et al. Circadian Modulation of Dopamine Levels and Dopaminergic Neuron Development Contributes to Attention Deficiency and Hyperactive Behavior. J. Neurosci. 2015, 35, 2572–2587. [Google Scholar] [CrossRef] [Green Version]
- Feldman, H.M.; Reiff, M.I. Attention Deficit–Hyperactivity Disorder in Children and Adolescents. N. Engl. J. Med. 2014, 370, 838–846. [Google Scholar] [CrossRef]
- Zhu, J.; Zhang, X.; Xu, Y.; Spencer, T.J.; Biederman, J.; Bhide, P.G. Prenatal Nicotine Exposure Mouse Model Showing Hyperactivity, Reduced Cingulate Cortex Volume, Reduced Dopamine Turnover, and Responsiveness to Oral Methylphenidate Treatment. J. Neurosci. 2012, 32, 9410–9418. [Google Scholar] [CrossRef] [Green Version]
- Zhu, J.; Fan, F.; McCarthy, D.M.; Zhang, L.; Cannon, E.N.; Spencer, T.J.; Biederman, J.; Bhide, P.G. A Prenatal Nicotine Exposure Mouse Model of Methylphenidate Responsive ADHD-associated Cognitive Phenotypes. Int. J. Dev. Neurosci. 2017, 58, 26–34. [Google Scholar] [CrossRef] [PubMed]
- Polli, F.S.; Kohlmeier, K.A. Prenatal Nicotine Exposure Alters Postsynaptic AMPA Receptors and Glutamate Neurotransmission within the Laterodorsal Tegmentum (LDT) of Juvenile Mice. Neuropharmacology 2018, 137, 71–85. [Google Scholar] [CrossRef]
- Polli, F.S.; Ipsen, T.H.; Caballero-Puntiverio, M.; Osterbog, T.B.; Aznar, S.; Andreasen, J.T.; Kohlmeier, K.A. Cellular and Molecular Changes in Hippocampal Glutamate Signaling and Alterations in Learning, Attention, and Impulsivity Following Prenatal Nicotine Exposure. Mol. Neurobiol. 2020, 57, 2002–2020. [Google Scholar] [CrossRef] [PubMed]
- Piña, R.; Rozas, C.; Contreras, D.; Hardy, P.; Ugarte, G.; Zeise, M.L.; Rojas, P.; Morales, B. Atomoxetine Reestablishes Long Term Potentiation in a Mouse Model of Attention Deficit/Hyperactivity Disorder. Neuroscience 2020, 439, 268–274. [Google Scholar] [CrossRef] [PubMed]
- Leuner, B.; Gould, E. Structural Plasticity and Hippocampal Function. Annu. Rev. Psychol. 2010, 61, 111–140. [Google Scholar] [CrossRef] [Green Version]
- Bliss, T.V.; Collingridge, G.L. Expression of NMDA Receptor-Dependent LTP in the Hippocampus: Bridging the Divide. Mol. Brain 2013, 6, 5. [Google Scholar] [CrossRef] [Green Version]
- Koda, K.; Ago, Y.; Cong, Y.; Kita, Y.; Takuma, K.; Matsuda, T. Effects of Acute and Chronic Administration of Atomoxetine and Methylphenidate on Extracellular Levels of Noradrenaline, Dopamine and Serotonin in the Prefrontal Cortex and Striatum of Mice. J. Neurochem. 2010, 114, 259–270. [Google Scholar] [CrossRef]
- Rozas, C.; Carvallo, C.; Contreras, D.; Carreño, M.; Ugarte, G.; Delgado, R.; Zeise, M.L.; Morales, B. Methylphenidate Amplifies Long-Term Potentiation in Rat Hippocampus CA1 Area Involving the Insertion of AMPA Receptors by Activation of β-Adrenergic and D1/D5 Receptors. Neuropharmacology 2015, 99, 15–27. [Google Scholar] [CrossRef]
- Carvallo, C.; Contreras, D.; Ugarte, G.; Delgado, R.; Pancetti, F.; Rozas, C.; Piña, R.; Constandil, L.; Zeise, M.L.; Morales, B. Single and Repeated Administration of Methylphenidate Modulates Synaptic Plasticity in Opposite Directions via Insertion of AMPA Receptors in Rat Hippocampal Neurons. Front. Pharmacol. 2018, 9, 1485. [Google Scholar] [CrossRef] [Green Version]
- Diering, G.H.; Huganir, R.L. The AMPA Receptor Code of Synaptic Plasticity. Neuron 2018, 100, 314–329. [Google Scholar] [CrossRef] [PubMed] [Green Version]
- Cull-Candy, S.G.; Farrant, M. Ca2+-permeable AMPA Receptors and Their Auxiliary Subunits in Synaptic Plasticity and Disease. J. Physiol. 2021, 599, 2655–2671. [Google Scholar] [CrossRef] [PubMed]
- Lin, D.-T.; Makino, Y.; Sharma, K.; Hayashi, T.; Neve, R.; Takamiya, K.; Huganir, R.L. Regulation of AMPA Receptor Extrasynaptic Insertion by 4.1N, Phosphorylation and Palmitoylation. Nat. Neurosci. 2009, 12, 879–887. [Google Scholar] [CrossRef] [PubMed] [Green Version]
- Hoogman, M.; Bralten, J.; Hibar, D.P.; Mennes, M.; Zwiers, M.P.; Schweren, L.S.J.; van Hulzen, K.J.E.; Medland, S.E.; Shumskaya, E.; Jahanshad, N.; et al. Subcortical Brain Volume Differences in Participants with Attention Deficit Hyperactivity Disorder in Children and Adults: A Cross-Sectional Mega-Analysis. Lancet Psychiatry 2017, 4, 310–319. [Google Scholar] [CrossRef] [Green Version]
- Shaw, P.; Eckstrand, K.; Sharp, W.; Blumenthal, J.; Lerch, J.P.; Greenstein, D.; Clasen, L.; Evans, A.; Giedd, J.; Rapoport, J.L. Attention-Deficit/Hyperactivity Disorder Is Characterized by a Delay in Cortical Maturation. Proc. Natl. Acad. Sci. USA 2007, 104, 19649–19654. [Google Scholar] [CrossRef] [Green Version]
- Maiti, P.; Manna, J.; Ilavazhagan, G.; Rossignol, J.; Dunbar, G.L. Molecular Regulation of Dendritic Spine Dynamics and Their Potential Impact on Synaptic Plasticity and Neurological Diseases. Neurosci. Biobehav. Rev. 2015, 59, 208–237. [Google Scholar] [CrossRef]
- Matsuo, N.; Reijmers, L.; Mayford, M. Spine-Type-Specific Recruitment of Newly Synthesized AMPA Receptors with Learning. Science 2008, 319, 1104–1107. [Google Scholar] [CrossRef] [Green Version]
- Kusters, R.; Kapitein, L.C.; Hoogenraad, C.C.; Storm, C. Shape-Induced Asymmetric Diffusion in Dendritic Spines Allows Efficient Synaptic AMPA Receptor Trapping. Biophys. J. 2013, 105, 2743–2750. [Google Scholar] [CrossRef] [Green Version]
- Yang, G.; Gan, W.-B. Sleep Contributes to Dendritic Spine Formation and Elimination in the Developing Mouse Somatosensory Cortex. Dev. Neurobiol. 2012, 72, 1391–1398. [Google Scholar] [CrossRef]
- Bosch, M.; Castro, J.; Saneyoshi, T.; Matsuno, H.; Sur, M.; Hayashi, Y. Structural and Molecular Remodeling of Dendritic Spine Substructures during Long-Term Potentiation. Neuron 2014, 82, 444–459. [Google Scholar] [CrossRef] [Green Version]
- Lu, W.; Shi, Y.; Jackson, A.C.; Bjorgan, K.; During, M.J.; Sprengel, R.; Seeburg, P.H.; Nicoll, R.A. Subunit Composition of Synaptic AMPA Receptors Revealed by a Single-Cell Genetic Approach. Neuron 2009, 62, 254–268. [Google Scholar] [CrossRef] [PubMed] [Green Version]
- Ge, Y.; Tian, M.; Liu, L.; Wong, T.P.; Gong, B.; Wu, D.; Cho, T.; Lin, S.; Kast, J.; Lu, J.; et al. P97 Regulates GluA1 Homomeric AMPA Receptor Formation and Plasma Membrane Expression. Nat. Commun. 2019, 10, 4089. [Google Scholar] [CrossRef] [PubMed] [Green Version]
- Gipson, C.D.; Olive, M.F. Structural and Functional Plasticity of Dendritic Spines—Root or Result of Behavior? Genes Brain Behav. 2017, 16, 101–117. [Google Scholar] [CrossRef] [PubMed] [Green Version]
- Zhu, J.; Lee, K.P.; Spencer, T.J.; Biederman, J.; Bhide, P.G. Transgenerational Transmission of Hyperactivity in a Mouse Model of ADHD. J. Neurosci. 2014, 34, 2768–2773. [Google Scholar] [CrossRef] [Green Version]
- Berridge, C.W.; Devilbiss, D.M.; Andrzejewski, M.E.; Arnsten, A.F.T.; Kelley, A.E.; Schmeichel, B.; Hamilton, C.; Spencer, R.C. Methylphenidate Preferentially Increases Catecholamine Neurotransmission within the Prefrontal Cortex at Low Doses That Enhance Cognitive Function. Biol. Psychiatry 2006, 60, 1111–1120. [Google Scholar] [CrossRef] [PubMed]
- Burgos, H.; Cofré, C.; Hernández, A.; Sáez-Briones, P.; Agurto, R.; Castillo, A.; Morales, B.; Zeise, M.L. Methylphenidate Has Long-Lasting Metaplastic Effects in the Prefrontal Cortex of Adolescent Rats. Behav. Brain Res. 2015, 291, 112–117. [Google Scholar] [CrossRef]
- Oh, M.C.; Derkach, V.A.; Guire, E.S.; Soderling, T.R. Extrasynaptic Membrane Trafficking Regulated by GluR1 Serine 845 Phosphorylation Primes AMPA Receptors for Long-Term Potentiation. J. Biol. Chem. 2006, 281, 752–758. [Google Scholar] [CrossRef] [Green Version]
- Vanhoose, A.M.; Clements, J.M.; Winder, D.G. Novel Blockade of Protein Kinase A-Mediated Phosphorylation of AMPA Receptors. J. Neurosci. 2006, 26, 1138–1145. [Google Scholar] [CrossRef]
- Buonarati, O.R.; Hammes, E.A.; Watson, J.F.; Greger, I.H.; Hell, J.W. Mechanisms of Postsynaptic Localization of AMPA-Type Glutamate Receptors and Their Regulation during Long-Term Potentiation. Sci. Signal. 2019, 12, eaar6889. [Google Scholar] [CrossRef] [Green Version]
- Nusser, Z.; Lujan, R.; Laube, G.; Roberts, J.D.B.; Molnar, E.; Somogyi, P. Cell Type and Pathway Dependence of Synaptic AMPA Receptor Number and Variability in the Hippocampus. Neuron 1998, 21, 545–559. [Google Scholar] [CrossRef] [Green Version]
- Racca, C.; Stephenson, F.A.; Streit, P.; Roberts, J.D.B.; Somogyi, P. NMDA Receptor Content of Synapses in Stratum Radiatum of the Hippocampal CA1 Area. J. Neurosci. 2000, 20, 2512–2522. [Google Scholar] [CrossRef] [PubMed]
- Matsuzaki, M.; Ellis-Davies, G.C.R.; Nemoto, T.; Miyashita, Y.; Iino, M.; Kasai, H. Dendritic Spine Geometry Is Critical for AMPA Receptor Expression in Hippocampal CA1 Pyramidal Neurons. Nat. Neurosci. 2001, 4, 1086–1092. [Google Scholar] [CrossRef] [Green Version]
- Nimchinsky, E.A. The Number of Glutamate Receptors Opened by Synaptic Stimulation in Single Hippocampal Spines. J. Neurosci. 2004, 24, 2054–2064. [Google Scholar] [CrossRef] [PubMed] [Green Version]
- Lang, C.; Barco, A.; Zablow, L.; Kandel, E.R.; Siegelbaum, S.A.; Zakharenko, S.S. Transient Expansion of Synaptically Connected Dendritic Spines upon Induction of Hippocampal Long-Term Potentiation. Proc. Natl. Acad. Sci. USA 2004, 101, 16665–16670. [Google Scholar] [CrossRef] [PubMed] [Green Version]
- Matsuzaki, M.; Honkura, N.; Ellis-Davies, G.C.R.; Kasai, H. Structural Basis of Long-Term Potentiation in Single Dendritic Spines. Nature 2004, 429, 761–766. [Google Scholar] [CrossRef] [PubMed]
- Kopec, C.D. Glutamate Receptor Exocytosis and Spine Enlargement during Chemically Induced Long-Term Potentiation. J. Neurosci. 2006, 26, 2000–2009. [Google Scholar] [CrossRef] [Green Version]
- Park, M.; Salgado, J.M.; Ostroff, L.; Helton, T.D.; Robinson, C.G.; Harris, K.M.; Ehlers, M.D. Plasticity-Induced Growth of Dendritic Spines by Exocytic Trafficking from Recycling Endosomes. Neuron 2006, 52, 817–830. [Google Scholar] [CrossRef] [PubMed] [Green Version]
- Vyazovskiy, V.V.; Cirelli, C.; Pfister-Genskow, M.; Faraguna, U.; Tononi, G. Molecular and Electrophysiological Evidence for Net Synaptic Potentiation in Wake and Depression in Sleep. Nat. Neurosci. 2008, 11, 200–208. [Google Scholar] [CrossRef]
- Zito, K.; Scheuss, V.; Knott, G.; Hill, T.; Svoboda, K. Rapid Functional Maturation of Nascent Dendritic Spines. Neuron 2009, 61, 247–258. [Google Scholar] [CrossRef] [Green Version]
- Sparks, J.A.; Pauly, J.R. Effects of Continuous Oral Nicotine Administration on Brain Nicotinic Receptors and Responsiveness to Nicotine in C57Bl/6 Mice. Psychopharmacology 1999, 141, 145–153. [Google Scholar] [CrossRef]
- Biederman, J.; Spencer, T.; Wilens, T. Evidence-Based Pharmacotherapy for Attention-Deficit Hyperactivity Disorder. Int. J. Neuropsychopharmacol. 2004, 7, 77–97. [Google Scholar] [CrossRef] [PubMed]
- Kimko, H.C.; Cross, J.T.; Abernethy, D.R. Pharmacokinetics and Clinical Effectiveness of Methylphenidate. Clin. Pharmacokinet. 1999, 37, 457–470. [Google Scholar] [CrossRef] [PubMed]
- Swanson, J.M.; Volkow, N.D. Serum and Brain Concentrations of Methylphenidate: Implications for Use and Abuse. Neurosci. Biobehav. Rev. 2003, 27, 615–621. [Google Scholar] [CrossRef]
- Balcioglu, A.; Ren, J.-Q.; McCarthy, D.; Spencer, T.J.; Biederman, J.; Bhide, P.G. Plasma and Brain Concentrations of Oral Therapeutic Doses of Methylphenidate and Their Impact on Brain Monoamine Content in Mice. Neuropharmacology 2009, 57, 687–693. [Google Scholar] [CrossRef] [Green Version]
- Zhang, L.; Zhang, L. Voluntary Oral Administration of Drugs in Mice. Protoc. Exch. 2011, 5, e2099. [Google Scholar] [CrossRef]
- Dudchenko, P.A. An Overview of the Tasks Used to Test Working Memory in Rodents. Neurosci. Biobehav. Rev. 2004, 28, 699–709. [Google Scholar] [CrossRef] [PubMed]
- Alkam, T.; Hiramatsu, M.; Mamiya, T.; Aoyama, Y.; Nitta, A.; Yamada, K.; Kim, H.-C.; Nabeshima, T. Evaluation of Object-Based Attention in Mice. Behav. Brain Res. 2011, 220, 185–193. [Google Scholar] [CrossRef] [PubMed]
- Schulz, P.E.; Cook, E.P.; Johnston, D. Changes in Paired-Pulse Facilitation Suggest Presynaptic Involvement in Long-Term Potentiation. J. Neurosci. 1994, 14, 5325–5337. [Google Scholar] [CrossRef] [PubMed] [Green Version]
- Risher, W.C.; Ustunkaya, T.; Singh Alvarado, J.; Eroglu, C. Rapid Golgi Analysis Method for Efficient and Unbiased Classification of Dendritic Spines. PLoS ONE 2014, 9, e107591. [Google Scholar] [CrossRef] [Green Version]


Publisher’s Note: MDPI stays neutral with regard to jurisdictional claims in published maps and institutional affiliations. |
© 2022 by the authors. Licensee MDPI, Basel, Switzerland. This article is an open access article distributed under the terms and conditions of the Creative Commons Attribution (CC BY) license (https://creativecommons.org/licenses/by/4.0/).
Share and Cite
Contreras, D.; Piña, R.; Carvallo, C.; Godoy, F.; Ugarte, G.; Zeise, M.; Rozas, C.; Morales, B. Methylphenidate Restores Behavioral and Neuroplasticity Impairments in the Prenatal Nicotine Exposure Mouse Model of ADHD: Evidence for Involvement of AMPA Receptor Subunit Composition and Synaptic Spine Morphology in the Hippocampus. Int. J. Mol. Sci. 2022, 23, 7099. https://doi.org/10.3390/ijms23137099
Contreras D, Piña R, Carvallo C, Godoy F, Ugarte G, Zeise M, Rozas C, Morales B. Methylphenidate Restores Behavioral and Neuroplasticity Impairments in the Prenatal Nicotine Exposure Mouse Model of ADHD: Evidence for Involvement of AMPA Receptor Subunit Composition and Synaptic Spine Morphology in the Hippocampus. International Journal of Molecular Sciences. 2022; 23(13):7099. https://doi.org/10.3390/ijms23137099
Chicago/Turabian StyleContreras, Darwin, Ricardo Piña, Claudia Carvallo, Felipe Godoy, Gonzalo Ugarte, Marc Zeise, Carlos Rozas, and Bernardo Morales. 2022. "Methylphenidate Restores Behavioral and Neuroplasticity Impairments in the Prenatal Nicotine Exposure Mouse Model of ADHD: Evidence for Involvement of AMPA Receptor Subunit Composition and Synaptic Spine Morphology in the Hippocampus" International Journal of Molecular Sciences 23, no. 13: 7099. https://doi.org/10.3390/ijms23137099