
Oscillatory Potentials in Achromatopsia as a Tool for Understanding Cone Retinal Functions

 ,
,  , , , and
Abstract
:1. Introduction
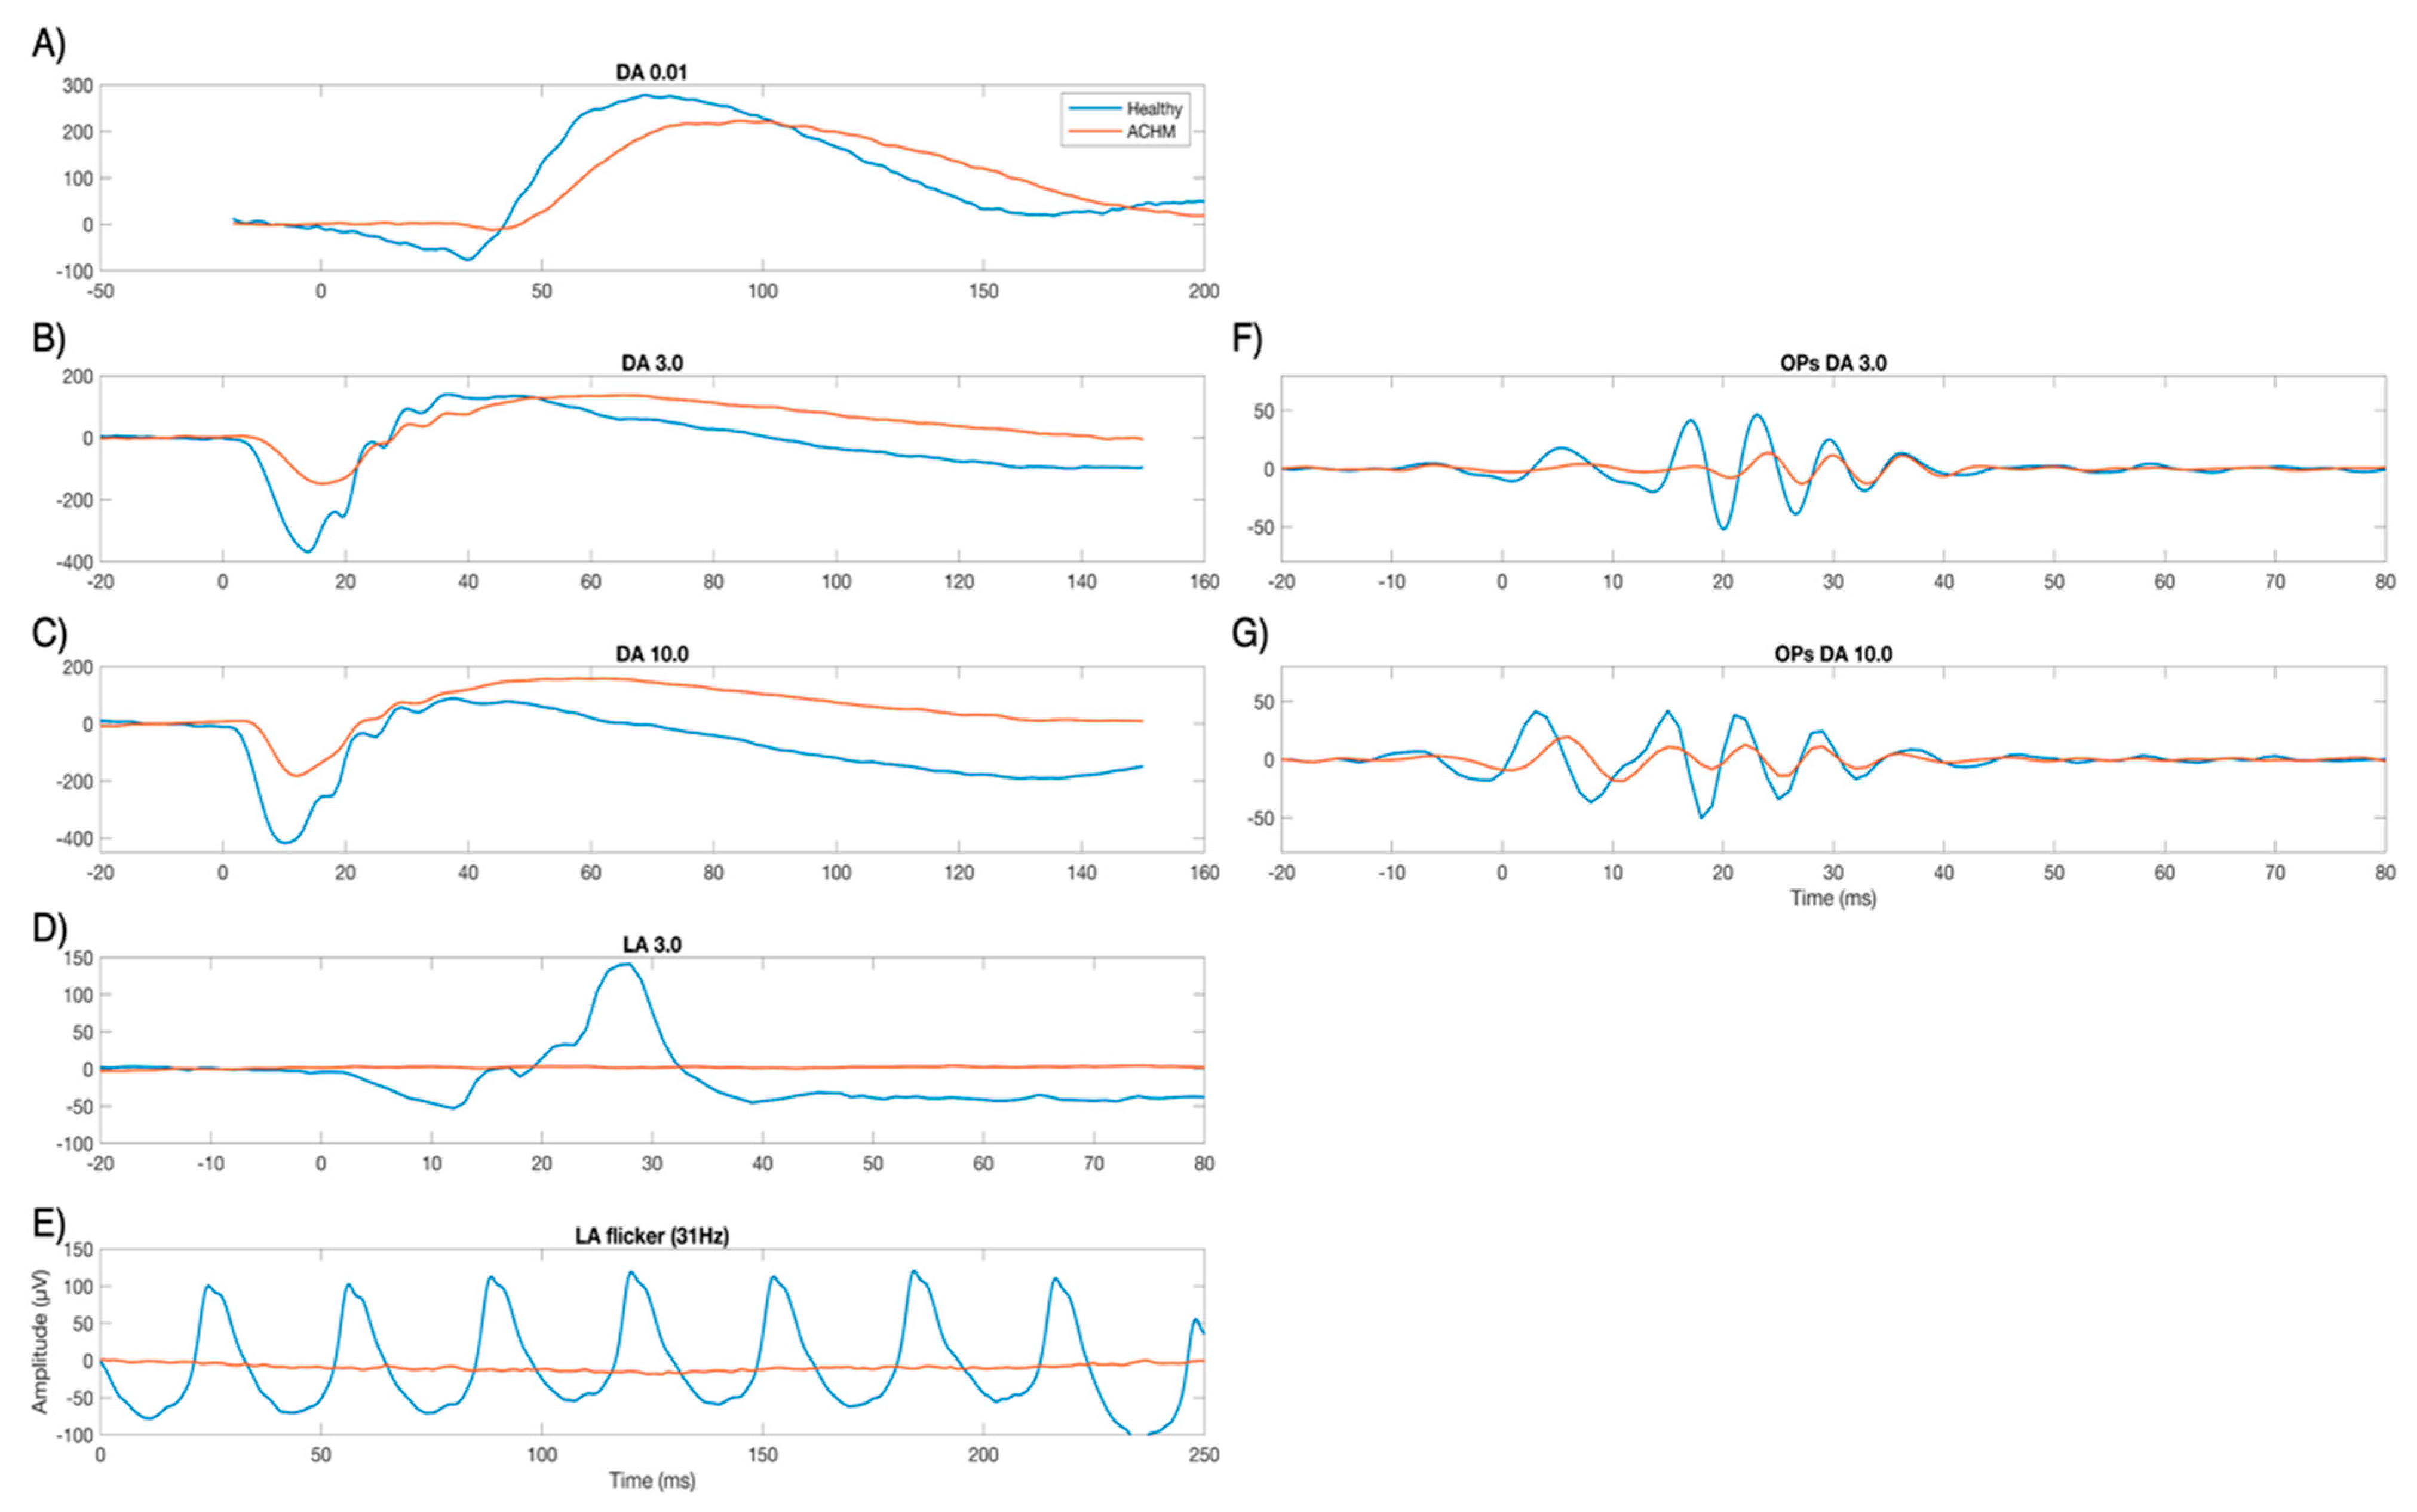
2. Results
2.1. Electrophysiological Results
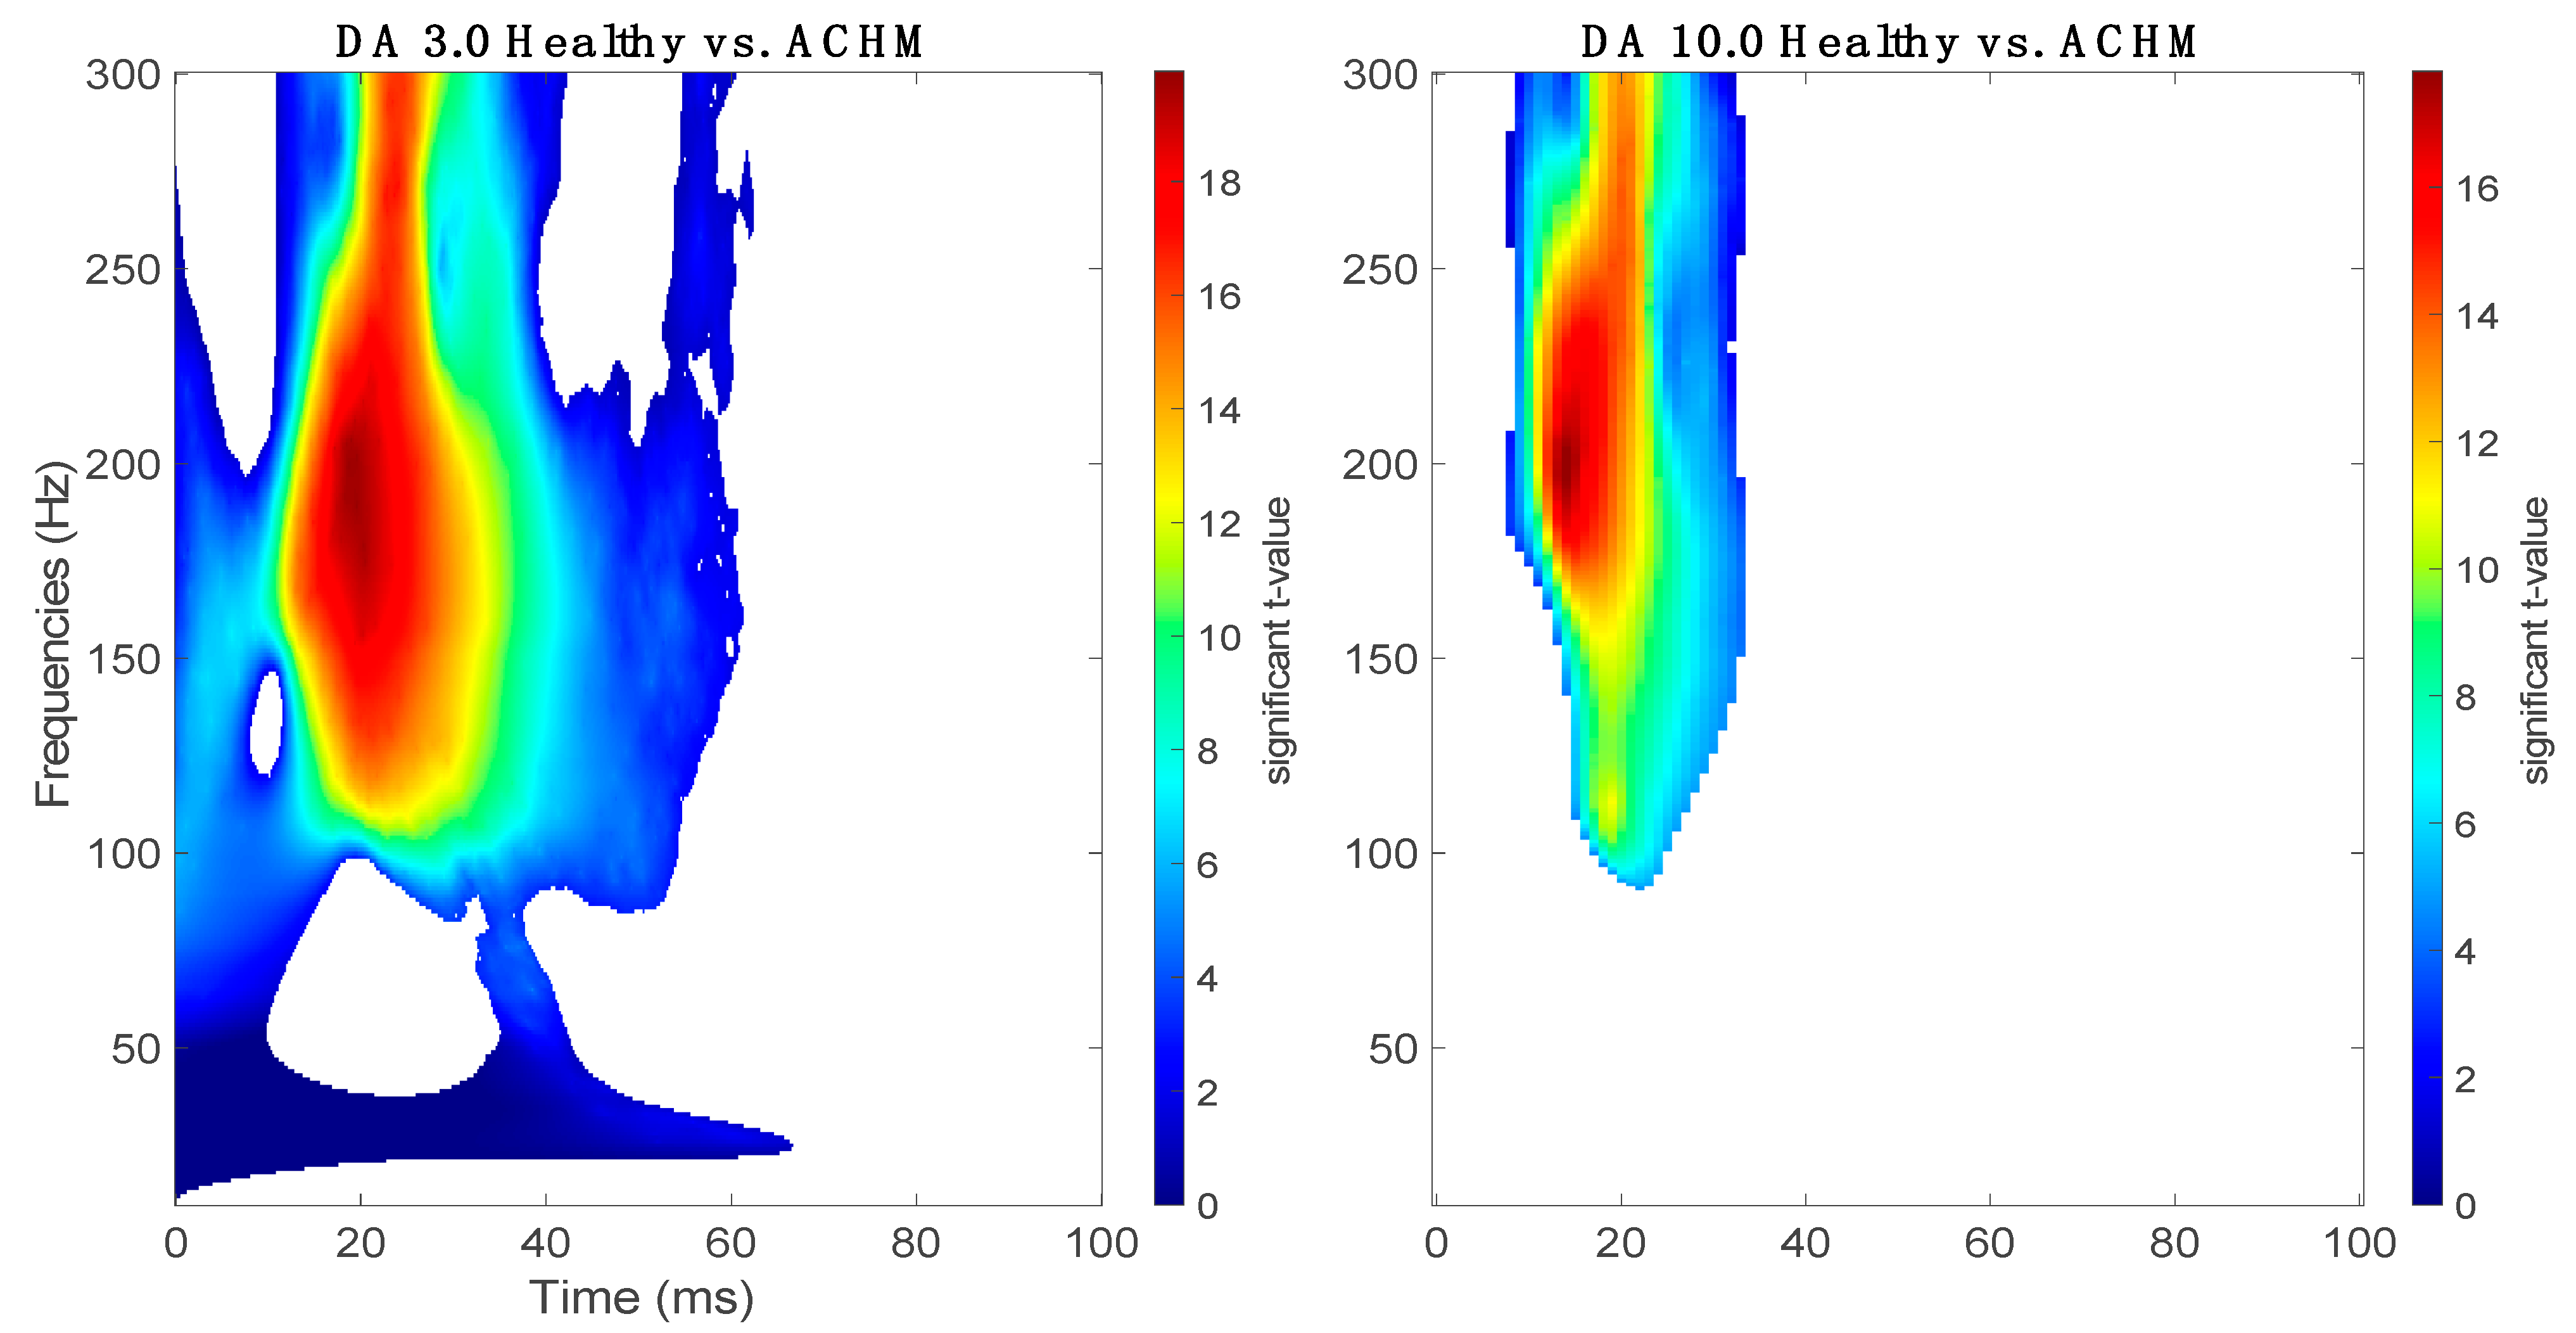
2.2. Complex Morlet Wavelet Transform
3. Discussion
4. Materials and Methods
4.1. Preparation and ffERG Recordings
4.2. ffERG Analysis
4.3. Statistical Analysis
Author Contributions
Funding
Institutional Review Board Statement
Informed Consent Statement
Data Availability Statement
Acknowledgments
Conflicts of Interest
References
- Michaelides, M.; Hunt, D.; Moore, A.T. The cone dysfunction syndromes. Br. J. Ophthalmol. 2004, 88, 291–297. [Google Scholar] [CrossRef] [PubMed]
- Simunovic, M.P. Colour vision deficiency. Eye 2010, 24, 747–755. [Google Scholar] [CrossRef] [Green Version]
- Remmer, M.H.; Rastogi, N.; Ranka, M.P.; Ceisler, E.J. Achromatopsia: A review. Curr. Opin. Ophthalmol. 2015, 26, 333–340. [Google Scholar] [CrossRef] [PubMed]
- Hirji, N.; Aboshiha, J.; Georgiou, M.; Bainbridge, J.; Michaelides, M. Achromatopsia: Clinical features, molecular genetics, animal models and therapeutic options. Ophthalmic Genet. 2018, 39, 149–157. [Google Scholar] [CrossRef] [PubMed]
- Wissinger, B.; Gamer, D.; Jägle, H.; Giorda, R.; Marx, T.; Mayer, S.; Tippmann, S.; Broghammer, M.; Jurklies, B.; Rosenberg, T.; et al. CNGA3 Mutations in Hereditary Cone Photoreceptor Disorders. Am. J. Hum. Genet. 2001, 69, 722–737. [Google Scholar] [CrossRef] [Green Version]
- Aboshiha, J.; Dubis, A.M.; Carroll, J.; Hardcastle, A.; Michaelides, M. The cone dysfunction syndromes. Br. J. Ophthalmol. 2016, 100, 115–121. [Google Scholar] [CrossRef] [Green Version]
- Andréasson, S.; Tornqvist, K. Electroretinograms in patients with achromatopsia. Acta Ophthalmol. 2009, 69, 711–716. [Google Scholar] [CrossRef]
- Zobor, D.; Werner, A.; Stanzial, F.; Benedicenti, F.; Rudolph, G.; Kellner, U.; Hamel, C.; Andréasson, S.; Zobor, G.; Strasser, T.; et al. The Clinical Phenotype of CNGA3-Related Achromatopsia: Pretreatment Characterization in Preparation of a Gene Replacement Therapy Trial. Investig. Opthalmology Vis. Sci. 2017, 58, 821–832. [Google Scholar] [CrossRef] [PubMed] [Green Version]
- Khan, N.W.; Wissinger, B.; Kohl, S.; Sieving, P.A. CNGB3Achromatopsia with Progressive Loss of Residual Cone Function and Impaired Rod-Mediated Function. Investig. Opthalmology Vis. Sci. 2007, 48, 3864–3871. [Google Scholar] [CrossRef] [Green Version]
- Moskowitz, A.; Hansen, R.M.; Akula, J.; Eklund, S.E.; Fulton, A.B. Rod and Rod-Driven Function in Achromatopsia and Blue Cone Monochromatism. Investig. Opthalmology Vis. Sci. 2009, 50, 950–958. [Google Scholar] [CrossRef]
- McCulloch, D.L.; Marmor, M.F.; Brigell, M.G.; Hamilton, R.; Holder, G.E.; Tzekov, R.; Bach, M. ISCEV Standard for full-field clinical electroretinography (2015 update). Doc. Ophthalmol. 2015, 130, 1–12. [Google Scholar] [CrossRef]
- A Stockton, R.; Slaughter, M.M. B-wave of the electroretinogram. A reflection of ON bipolar cell activity. J. Gen. Physiol. 1989, 93, 101–122. [Google Scholar] [CrossRef]
- Perlman, I. The Electroretinogram: ERG; University of Utah Health Sciences Center: Salt Lake City, UT, USA, 2007. [Google Scholar]
- Barraco, R.; Adorno, D.P.; Bellomonte, L.; Brai, M. A study of the human rod and cone electroretinogram a-wave component. J. Stat. Mech. Theory Exp. 2009, 2009, P03007. [Google Scholar] [CrossRef]
- Cobb, W.A. A new component of the human electroretinogram. J. Physiol. 1954, 123, 36–37. [Google Scholar]
- Yonemura, D.; Masuda, Y.; Hatta, M. The Oscillatory Potential in the Electroretinogram. JPN. J. Physiol. 1963, 13, 129–137. [Google Scholar] [CrossRef]
- Wachtmeister, L.; E Dowling, J. The oscillatory potentials of the mudpuppy retina. Investig. Ophthalmol. Vis. Sci. 1978, 17, 1176–1188. [Google Scholar]
- Henny Heynen, L.W.; van Norren, D. Origin of the oscillatory potentials in the primate retina. Vis. Res. 1985, 25, 1365–1373. [Google Scholar] [CrossRef]
- Wachtmeister, L. Oscillatory potentials in the retina: What do they reveal. Prog. Retin. Eye Res. 1998, 17, 485–521. [Google Scholar] [CrossRef]
- Kojima, M.; Zrenner, E. Off-components in response to brief light flashes in the oscillatory potential of the human electroretinogram. Graefe’s Arch. Clin. Exp. Ophthalmol. 1978, 206, 107–120. [Google Scholar] [CrossRef]
- Wachtmeister, L. Basic research and clinical aspects of the oscillatory potentials of the electroretinogram. Doc. Ophthalmol. 1987, 66, 187–194. [Google Scholar] [CrossRef]
- Van Der Torren, K.; Groeneweg, G.; Van Lith, G. Measuring oscillatory potentials: Fourier analysis. Doc. Ophthalmol. 1988, 69, 153–159. [Google Scholar] [CrossRef] [PubMed]
- Lachapelle, P.; Benoit, J.; Blain, L.; Guité, P.; Roy, M.S. The oscillatory potentials in response to stimuli of photopic intensities delivered in dark-adaptation: An explanation for the conditioning flash effect. Vis. Res. 1990, 30, 503–513. [Google Scholar] [CrossRef]
- Lei, B.; Yao, G.; Zhang, K.; Hofeldt, K.J.; Chang, B. Study of Rod- and Cone-Driven Oscillatory Potentials in Mice. Investig. Opthalmology Vis. Sci. 2006, 47, 2732–2738. [Google Scholar] [CrossRef] [PubMed] [Green Version]
- Yin, J.-P.; Lei, B.; Peng, H.; Wang, J.; Fu, X.-N. Characteristics of dark-adapted and light-adapted oscillatory potentials in human electroretinogram. Nan Fang Yi Ke Da Xue Xue Bao J. South. Med Univ. 2011, 31, 2057–2060. [Google Scholar]
- Zhang, K.; Yao, G.; Gao, Y.; Hofeldt, K.J.; Lei, B. Frequency spectrum and amplitude analysis of dark- and light-adapted oscillatory potentials in albino mouse, rat and rabbit. Doc. Ophthalmol. 2007, 115, 85–93. [Google Scholar] [CrossRef]
- E King-Smith, P.; Loffing, D.H.; Jones, R. Rod and cone ERGs and their oscillatory potentials. Investig. Ophthalmol. Vis. Sci. 1986, 27, 270–273. [Google Scholar]
- Lachapelle, P.; Rousseau, S.; McKerral, M.; Benoit, J.; Polomeno, R.C.; Koenekoop, R.K.; Little, J.M. Evidence supportive of a functional discrimination between photopic oscillatory potentials as revealed with cone and rod mediated retinopathies. Doc. Ophthalmol. 1998, 95, 35–54. [Google Scholar] [CrossRef]
- Dong, C.-J.; Agey, P.; Hare, W.A. Origins of the electroretinogram oscillatory potentials in the rabbit retina. Vis. Neurosci. 2004, 21, 533–543. [Google Scholar] [CrossRef]
- Barraco, R.; Adorno, D.P.; Brai, M.; Tranchina, L. A comparison among different techniques for human ERG signals processing and classification. Phys. Med. 2014, 30, 86–95. [Google Scholar] [CrossRef] [Green Version]
- Gauvin, M.; Lina, J.-M.; Lachapelle, P. Advance in ERG Analysis: From Peak Time and Amplitude to Frequency, Power, and Energy. BioMed Res. Int. 2014, 2014, 246096. [Google Scholar] [CrossRef]
- Behbahani, S.; Ramezani, A.; Moridani, M.K.; Sabbaghi, H. Time-Frequency Analysis of Photopic Negative Response in CRVO Patients. Semin. Ophthalmol. 2020, 35, 187–193. [Google Scholar] [CrossRef] [PubMed]
- Ahmadieh, H.; Behbahani, S.; Safi, S. Continuous wavelet transform analysis of ERG in patients with diabetic retinopathy. Doc. Ophthalmol. 2021, 142, 305–314. [Google Scholar] [CrossRef] [PubMed]
- Forte, J.D.; Bui, B.V.; Vingrys, A.J. Wavelet analysis reveals dynamics of rat oscillatory potentials. J. Neurosci. Methods 2008, 169, 191–200. [Google Scholar] [CrossRef] [PubMed]
- Dimopoulos, I.S.; Freund, P.R.; Redel, T.; Dornstauder, B.; Gilmour, G.; Sauvé, Y. Changes in Rod and Cone-Driven Oscillatory Potentials in the Aging Human Retina. Investig. Opthalmol. Vis. Sci. 2014, 55, 5058–5073. [Google Scholar] [CrossRef] [Green Version]
- Kohl, S.; Marx, T.; Giddings, I.; Jägle, H.; Jacobson, S.G.; Apfelstedt-Sylla, E.; Zrenner, E.; Sharpe, L.T.; Wissinger, B. Total colorblindness is caused by mutations in the gene encoding the α-subunit of the cone photoreceptor cGMP-gated cation channel. Nat. Genet. 1998, 19, 257–259. [Google Scholar] [CrossRef]
- Soucy, E.; Wang, Y.; Nirenberg, S.; Nathans, J.; Meister, M. A Novel Signaling Pathway from Rod Photoreceptors to Ganglion Cells in Mammalian Retina. Neuron 1998, 21, 481–493. [Google Scholar] [CrossRef] [Green Version]
- Bloomfield, S.A.; Völgyi, B. The diverse functional roles and regulation of neuronal gap junctions in the retina. Nat. Rev. Neurosci. 2009, 10, 495–506. [Google Scholar] [CrossRef]
- Haverkamp, S. Synaptic Plasticity in CNGA3−/− Mice: Cone Bipolar Cells React on the Missing Cone Input and Form Ectopic Synapses with Rods. J. Neurosci. 2006, 26, 5248–5255. [Google Scholar] [CrossRef]
- Banin, E.; Gootwine, E.; Obolensky, A.; Ezra-Elia, R.; Ejzenberg, A.; Zelinger, L.; Honig, H.; Rosov, A.; Yamin, E.; Sharon, D.; et al. Gene Augmentation Therapy Restores Retinal Function and Visual Behavior in a Sheep Model of CNGA3 Achromatopsia. Mol. Ther. 2015, 23, 1423–1433. [Google Scholar] [CrossRef] [Green Version]
- Mühlfriedel, R.; Tanimoto, N.; Schön, C.; Sothilingam, V.; Garrido, M.G.; Beck, S.C.; Huber, G.; Biel, M.; Seeliger, M.W.; Michalakis, S. AAV-Mediated Gene Supplementation Therapy in Achromatopsia Type 2: Preclinical Data on Therapeutic Time Window and Long-Term Effects. Front. Neurosci. 2017, 11, 292. [Google Scholar] [CrossRef]
- Fischer, M.D.; Michalakis, S.; Wilhelm, B.; Zobor, D.; Muehlfriedel, R.; Kohl, S.; Weisschuh, N.; Ochakovski, G.A.; Klein, R.; Schoen, C.; et al. Safety and Vision Outcomes of Subretinal Gene Therapy Targeting Cone Photoreceptors in Achromatopsia. JAMA Ophthalmol. 2020, 138, 643–651. [Google Scholar] [CrossRef]
- Reichel, F.F.; Michalakis, S.; Wilhelm, B.; Zobor, D.; Muehlfriedel, R.; Kohl, S.; Weisschuh, N.; Sothilingam, V.; Kuehlewein, L.; Kahle, N.; et al. Three-year results of phase I retinal gene therapy trial for CNGA3-mutated achromatopsia: Results of a non randomized controlled trial. Br. J. Ophthalmol. 2021. [Google Scholar] [CrossRef] [PubMed]
- Cohen, M.X. Analyzing Neural Time Series Data: Theory and Practice; MIT Press: Cambridge, MA, USA, 2014. [Google Scholar]
- Oostenveld, R.; Fries, P.; Maris, E.; Schoffelen, J.-M. FieldTrip: Open Source Software for Advanced Analysis of MEG, EEG, and Invasive Electrophysiological Data. Comput. Intell. Neurosci. 2010, 2011, 156869. [Google Scholar] [CrossRef] [PubMed]
- Maris, E.; Schoffelen, J.-M.; Fries, P. Nonparametric statistical testing of coherence differences. J. Neurosci. Methods 2007, 163, 161–175. [Google Scholar] [CrossRef] [PubMed]


| Normal Controls | ACHM | ||||
|---|---|---|---|---|---|
| Amplitude (Mean ± Std) | Implicit Time (Mean ± Std) | Amplitude (Mean ± Std) | Implicit Time (Mean ± Std) | ||
| DA 3.0 | a-wave | −264.8 ± 61.8 | 14.6 ± 1.08 | −185 ± 50.9 ** | 16.20 ± 1.48 ** |
| b-wave | 449.8 ± 107.49 | 48.4 ± 4.10 | 324.17 ± 93 ** | 53.33 ± 5.3 ** | |
| DA 10.0 | a-wave | −302.57 ± 65.6 | 11.07 ± 0.9 | −219.99 ± 60.7 ** | 12.35 ± 1 ** |
| b-wave | 456.50 ± 116.47 | 47.38 ± 4.8 | 344.96 ± 91.8 ** | 49.14 ± 4.6 | |
Publisher’s Note: MDPI stays neutral with regard to jurisdictional claims in published maps and institutional affiliations. |
© 2021 by the authors. Licensee MDPI, Basel, Switzerland. This article is an open access article distributed under the terms and conditions of the Creative Commons Attribution (CC BY) license (https://creativecommons.org/licenses/by/4.0/).
Share and Cite
Righetti, G.; Kempf, M.; Braun, C.; Jung, R.; Kohl, S.; Wissinger, B.; Zrenner, E.; Stingl, K.; Stingl, K. Oscillatory Potentials in Achromatopsia as a Tool for Understanding Cone Retinal Functions. Int. J. Mol. Sci. 2021, 22, 12717. https://doi.org/10.3390/ijms222312717
Righetti G, Kempf M, Braun C, Jung R, Kohl S, Wissinger B, Zrenner E, Stingl K, Stingl K. Oscillatory Potentials in Achromatopsia as a Tool for Understanding Cone Retinal Functions. International Journal of Molecular Sciences. 2021; 22(23):12717. https://doi.org/10.3390/ijms222312717
Chicago/Turabian StyleRighetti, Giulia, Melanie Kempf, Christoph Braun, Ronja Jung, Susanne Kohl, Bernd Wissinger, Eberhart Zrenner, Katarina Stingl, and Krunoslav Stingl. 2021. "Oscillatory Potentials in Achromatopsia as a Tool for Understanding Cone Retinal Functions" International Journal of Molecular Sciences 22, no. 23: 12717. https://doi.org/10.3390/ijms222312717