Article

Revealing Electrical and Mechanical Performances of Highly Oriented Electrospun Conductive Nanofibers of Biopolymers with Tunable Diameter

by
Muhammad A. Munawar
1,2,* and
Dirk W. Schubert
1,2,*
1
Institute of Polymer Materials, Department of Material Science, Faculty of Engineering, Friedrich-Alexander-University Erlangen-Nuremberg, Martensstrasse 7, 91058 Erlangen, Germany
2
KeyLab Advanced Fiber Technology, Bavarian Polymer Institute, Dr.-Mack-Strasse 77, 90762 Fürth, Germany
*
Authors to whom correspondence should be addressed.
Int. J. Mol. Sci. 2021, 22(19), 10295; https://doi.org/10.3390/ijms221910295
Submission received: 31 July 2021 / Revised: 15 September 2021 / Accepted: 18 September 2021 / Published: 24 September 2021
(This article belongs to the Special Issue Electroconductive Materials in Tissue Engineering)

Abstract

:
The present study outlines a reliable approach to determining the electrical conductivity and elasticity of highly oriented electrospun conductive nanofibers of biopolymers. The highly oriented conductive fibers are fabricated by blending a high molar mass polyethylene oxide (PEO), polycaprolactone (PCL), and polylactic acid (PLA) with polyaniline (PANi) filler. The filler-matrix interaction and molar mass (M) of host polymer are among governing factors for variable fiber diameter. The conductivity as a function of filler fraction (φ) is shown and described using a McLachlan equation to reveal the electrical percolation thresholds (φc) of the nanofibers. The molar mass of biopolymer, storage time, and annealing temperature are significant factors for φc. The Young’s modulus (E) of conductive fibers is dependent on filler fraction, molar mass, and post-annealing process. The combination of high orientation, tunable diameter, tunable conductivity, tunable elasticity, and biodegradability makes the presented nanofibers superior to the fibers described in previous literature and highly desirable for various biomedical and technical applications.

1. Introduction

The orientation, diameter, electrical conductivity, and mechanical strength (elasticity/stiffness) are among the most significant characteristics of electrospun fibers for reliable usage in various biomedical applications: cardiac tissue [1,2,3,4,5,6,7], muscle tissue [8,9,10], nerve tissue [11,12,13,14,15], bone tissue [16,17], wound healing [18,19], etc., and technical applications and wearable electrical devices [20,21], brain-machine interface [22], biomedical devices [23,24], field-effect transistors (FET) [25], biosensors [26,27,28] and electrodes [29,30,31]. In recent years, highly aligned nanofiber arrays have become some of the most prominent nanostructures owing to their directionality [32]. Moreover, the highly aligned fibers can provide directional guidance during the release and growth of proteins, especially in tissue engineering fields, such as neurite and muscle outgrowth [33].
Fiber diameter has a significant effect on the differentiation and proliferation of cells. Christopherson et al. [34] suggested that rat neural stem cells (rNSCs) preferentially differentiate into oligodendrocytes on smaller fiber-diameter substrate, while on larger fiber-diameter substrate, rNSCs preferentially differentiate into neuronal lineage. This allows investigators to tailor fiber diameter according to the desired cell response.
Electrical admittivity of human tissue may be predominantly conductive, capacitive, or a combination of these depending on tissue type, availability of charge carriers, and frequency of the applied electric field. It is carried out by ions, dipoles, or electrons as well as holes (semiconductor) [35,36,37]. As such, electrical activity is a key feature of many types of tissues and organs, such as skin, heart, muscle, nerve, bone, cartilage, and cornea [38]. The conductivity can be enhanced by increasing ionic strength or through the addition of electroconductive materials, including nanoparticles, nanorods, nanowires, carbon nanotubes, and intrinsically conductive polymers (ICPs) [3,39,40,41]. The impact of electrical inducement on tissues has been known since the 1960s, when Bassett et al. proved that electrical stimulation affects bone formation [42]. It has been demonstrated that in-vitro application of electrophysiologically DC fields (1–10 V/cm) and AC currents (10 to 100 mA) governs cellular behavior via interference in migration, cytoskeleton organization, alignment of neural cells, vascular endothelial, cardiofibroblasts, and myoblast cells and enhances neurite outgrowth in nerve cells, differentiation, and collagen production [43]. Preliminary studies have confirmed that the electrical properties of implanted scaffolds must be tuned correctly for the development of physiologically suitable artificial tissues.
The electrospun scaffold provides a “house” for cells and can regulate cellular function and behavior via cell-scaffold interactions. The mechanical cues that cells experience are intimately related to the microstructure of the scaffold. A well-known example is that stem cells differentiate into specific lineages (from neurogenic to osteogenic) depending on the relevant mechanical properties of the scaffold (from brain to collagenous bone) [44]. Additionally, physical, biochemical, and mechanical stimulations affect cell-material interactions potentially to guarantee the required regeneration [45]. Tissue properties, such as stiffness and biosignals, determine cellular activity, including adhesion, proliferation, differentiation, and growth. Thus, a complete understanding of mechanobiology is crucial to the appropriate use of electrospun fibers in biomedical applications.
The most studied ICPs in the biomedical field are PANi and polypyrrole (PPy). The dispersibility of PANi and PPy in water is limited, and therefore, their potential use is also limited [6]. Polythiophene family members are also an attractive alternative for various biomedical applications, as they exhibit improved dispersibility in water [46]. The common attributes of ICPs, such as electroactivity, reversible oxidation, low density, adjustable electrical conductivity (10−11 to 105 S cm−1), hydrophobicity, biocompatibility, and surface topography [3,39,40,41], are required for tissue engineering and regenerative medicine applications. However, the combination of conductivity, electroactivity, biostability, and biocompatibility of ICPs blended with biopolymers (polyethylene oxide PEO, polycaprolactone PCL, polylactic acid PLA) provides an appropriate platform for various electrically stimulated biosensing applications [47]. One-dimensional (1D) materials produced by electrospinning are superior to conventional film-based planar materials having large specific surface area and suitable mechanical Young’s modulus (stiffness) [48,49].
Moreover, the ICPs can form a percolating pathway for electrons and encourage the formation of electron-hole pairs, which can improve the electronic performance of electrospun conductive fiber composites [50].
The electrical percolation threshold is the critical volume fraction (φc) of conductive filler in electrospun conductive fiber composites (ECFCs) at which the electrical conductivity increases by several orders of magnitude. Below this critical volume fraction, the ECFCs cannot form a continuous path, meaning the conductivity of the material is extremely low. However, conductivity increases above φc and gradually tends to a constant value. This is the conductivity percolation phenomenon. It is important to determine this conductivity percolation because the materials exhibit an insulator–conductor transition; specifically, the electrical conductivity rapidly increases when initial conductive channels are formed. A detailed study was conducted for determining the electrical percolation threshold of highly oriented electrospun conductive fibers in our recent article [51]. The percolation phenomenon depends on filler–matrix interactions, molar mass of matrix, inherent electrical conductivity of the filler, and post-annealing conditions.
In this study, the highly oriented electrospun conductive fiber composites (ECFCs) of PEO, PCL, and PLA blended with doped PANi were fabricated using an electrospinning process. The electrospinning set-up deploying a proprietary designed rotating wheel collector enabled high orientation of ECFCs [52]. The highly oriented ECFCs were collected on microscopic glass slides (GS) for density, resistance (conductivity), and elasticity measurements. A new procedure and model equations were developed for the calculation of conductivity (σ) and Young’s modulus (E) of ECFCs. The values for electrical percolation threshold φc were determined by fitting the McLachlan general effective media (GEM) equation to experimental conductivities for all types of fabricated ECFCs. The slope of the force-strain curve of a bundle of conductive fibers was determined in the linear elastic region and used for calculating the Young’s modulus. The Young’s moduli as a function of filler fraction were determined using a density-based model equation. A subsequent annealing was conducted, varying annealing temperature and time to show effects on percolation thresholds and Young’s moduli of ECFCs, respectively.
The main motivation of this study was to determine the electrical and mechanical properties of conductive fibers using the new, simple, and reliable methods considering fiber dimension and alignment.

2. Results and Discussion

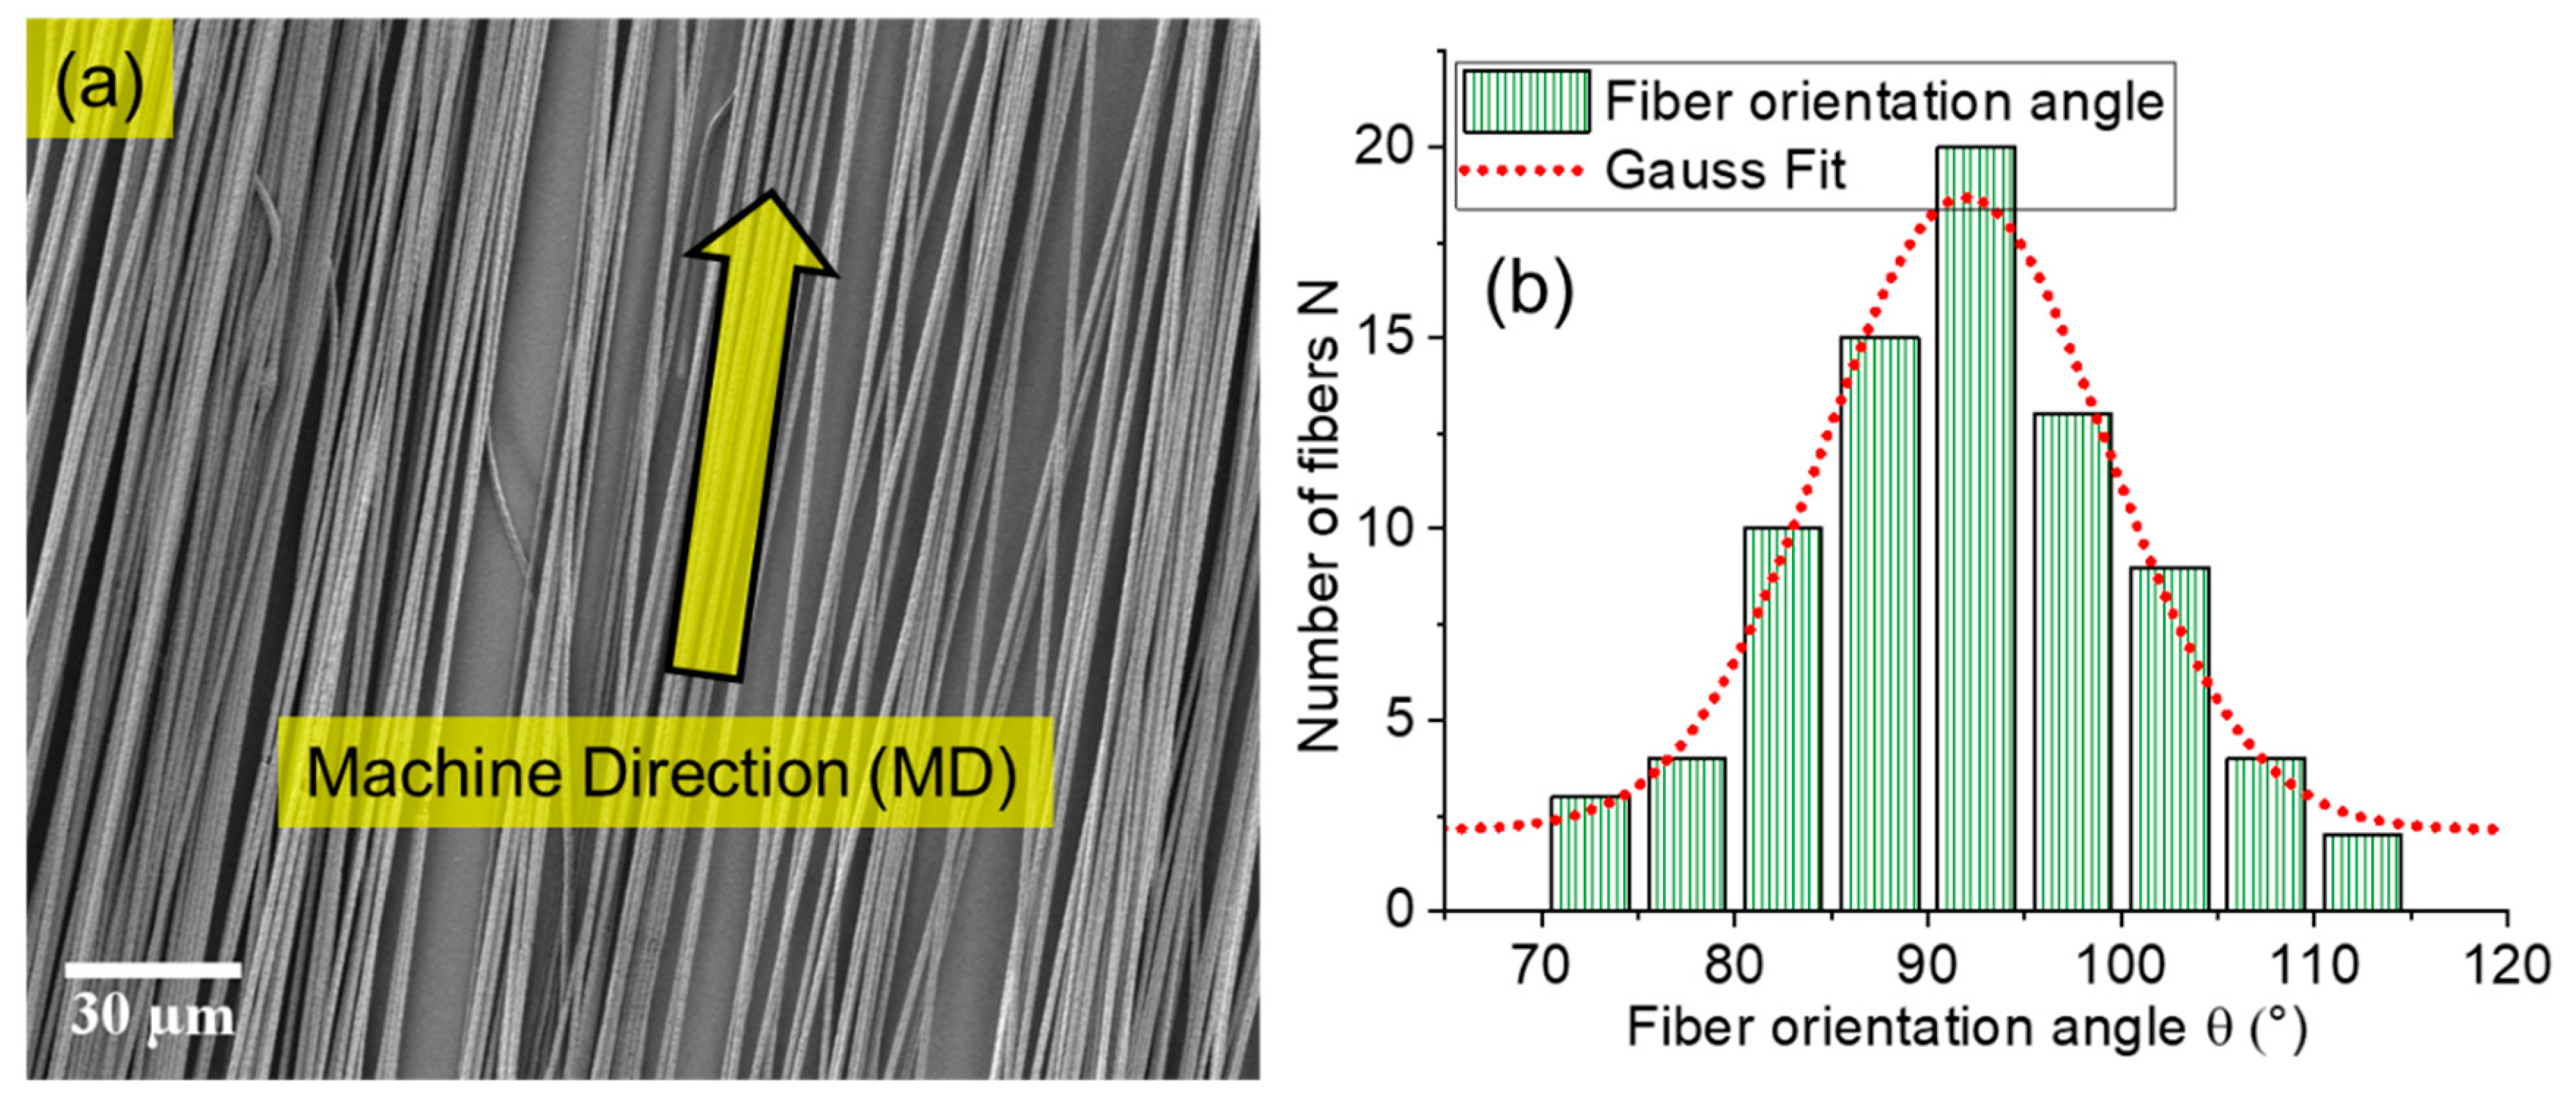
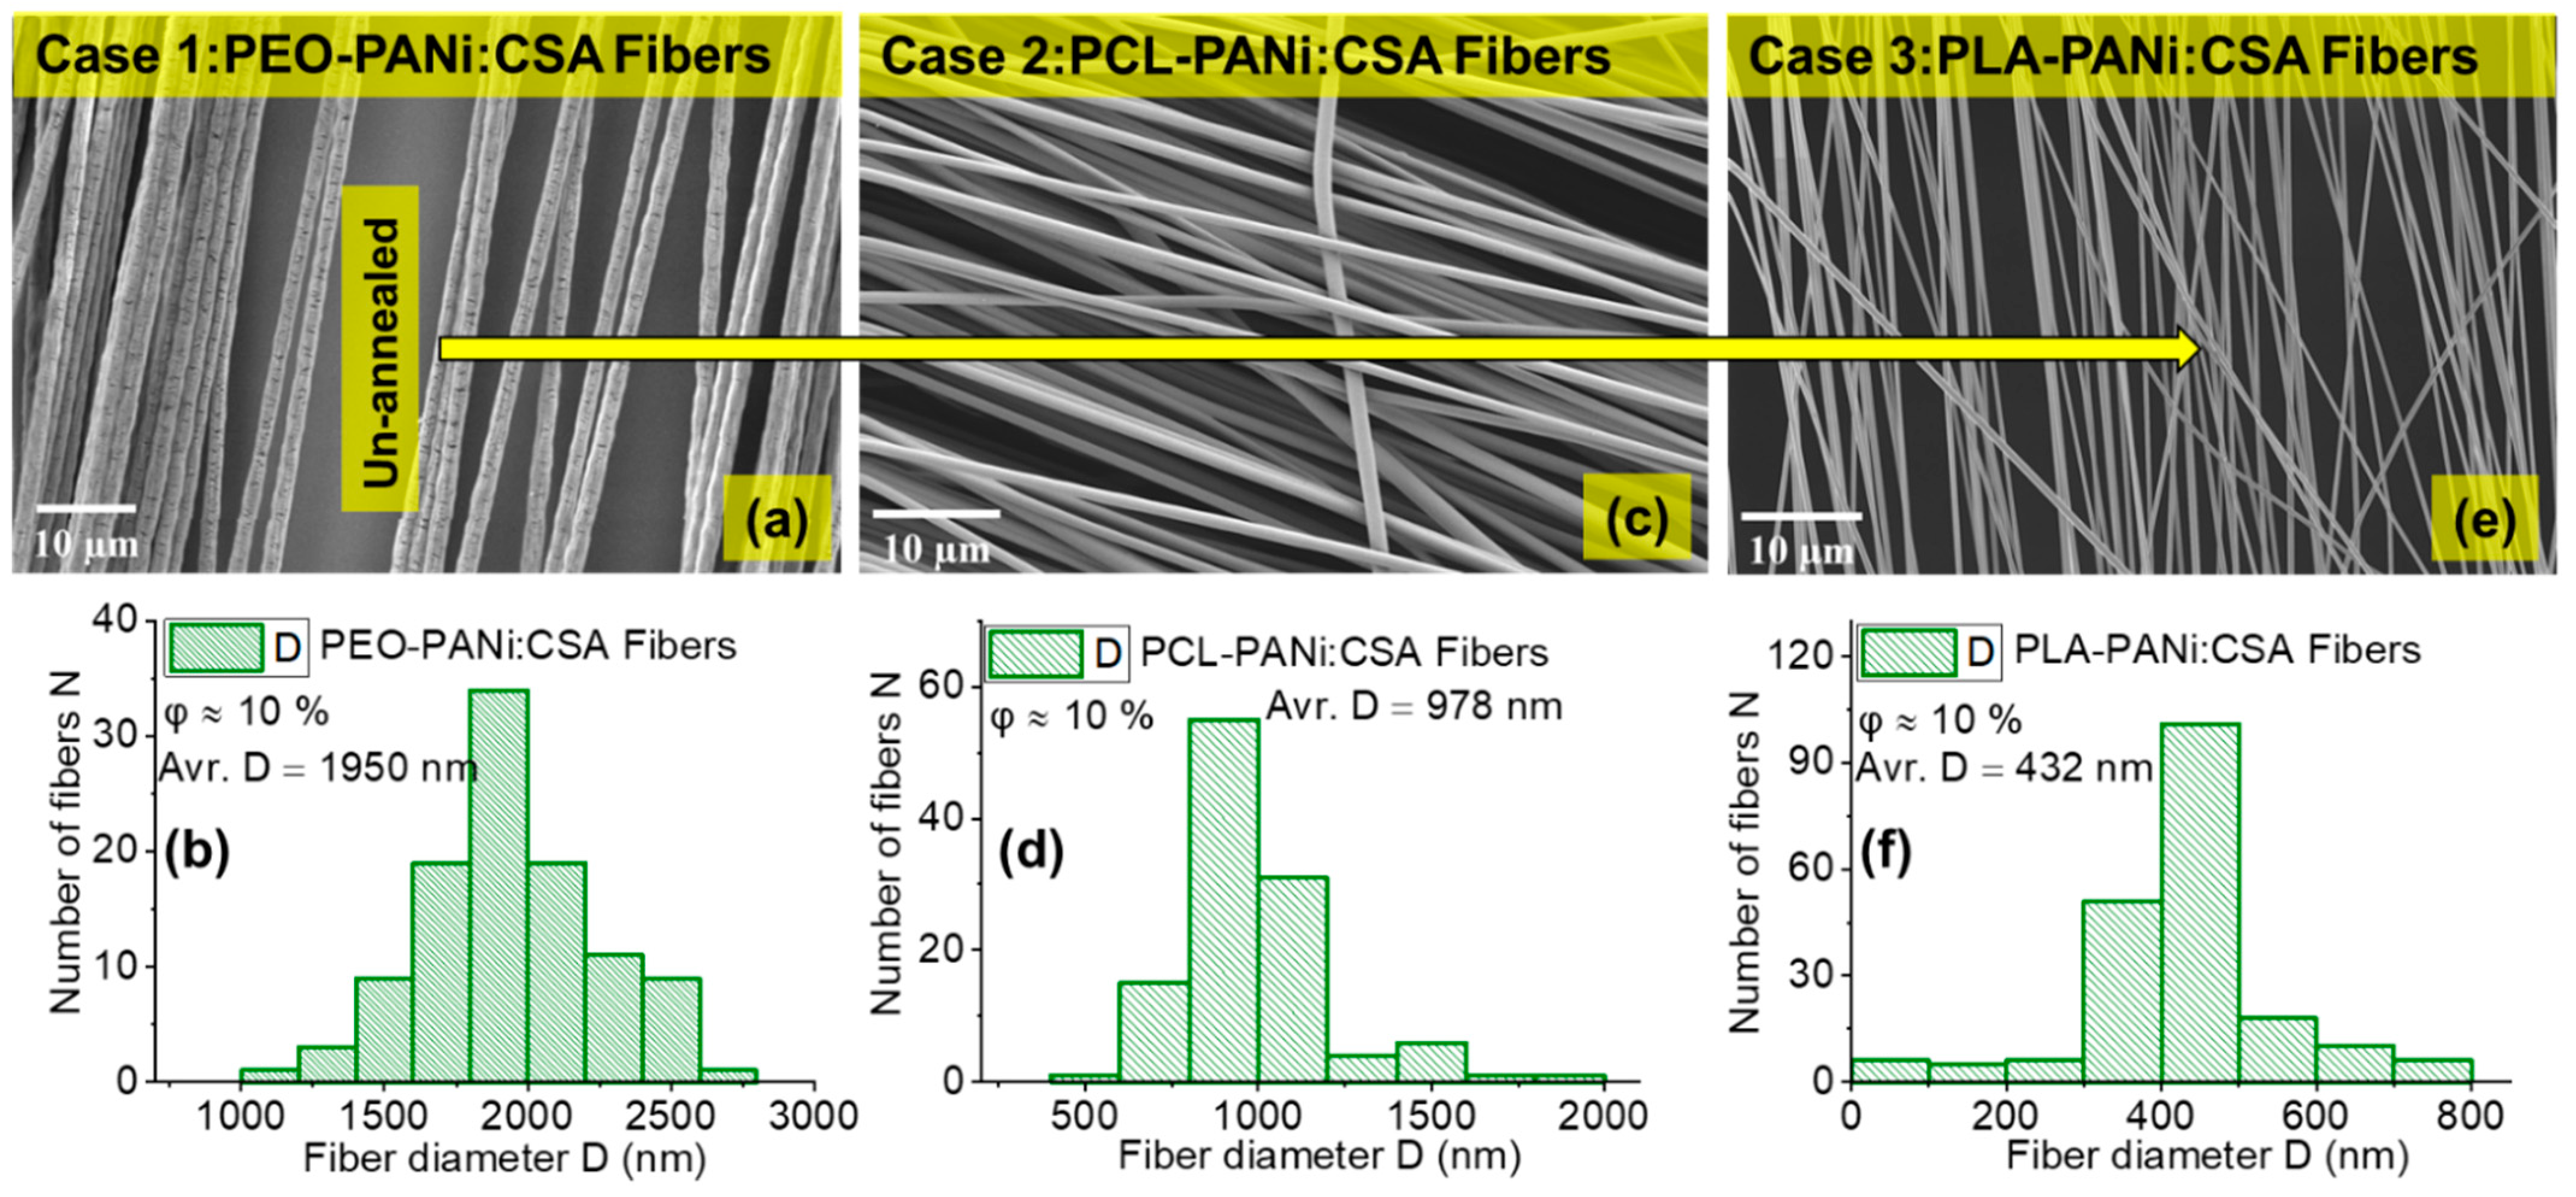
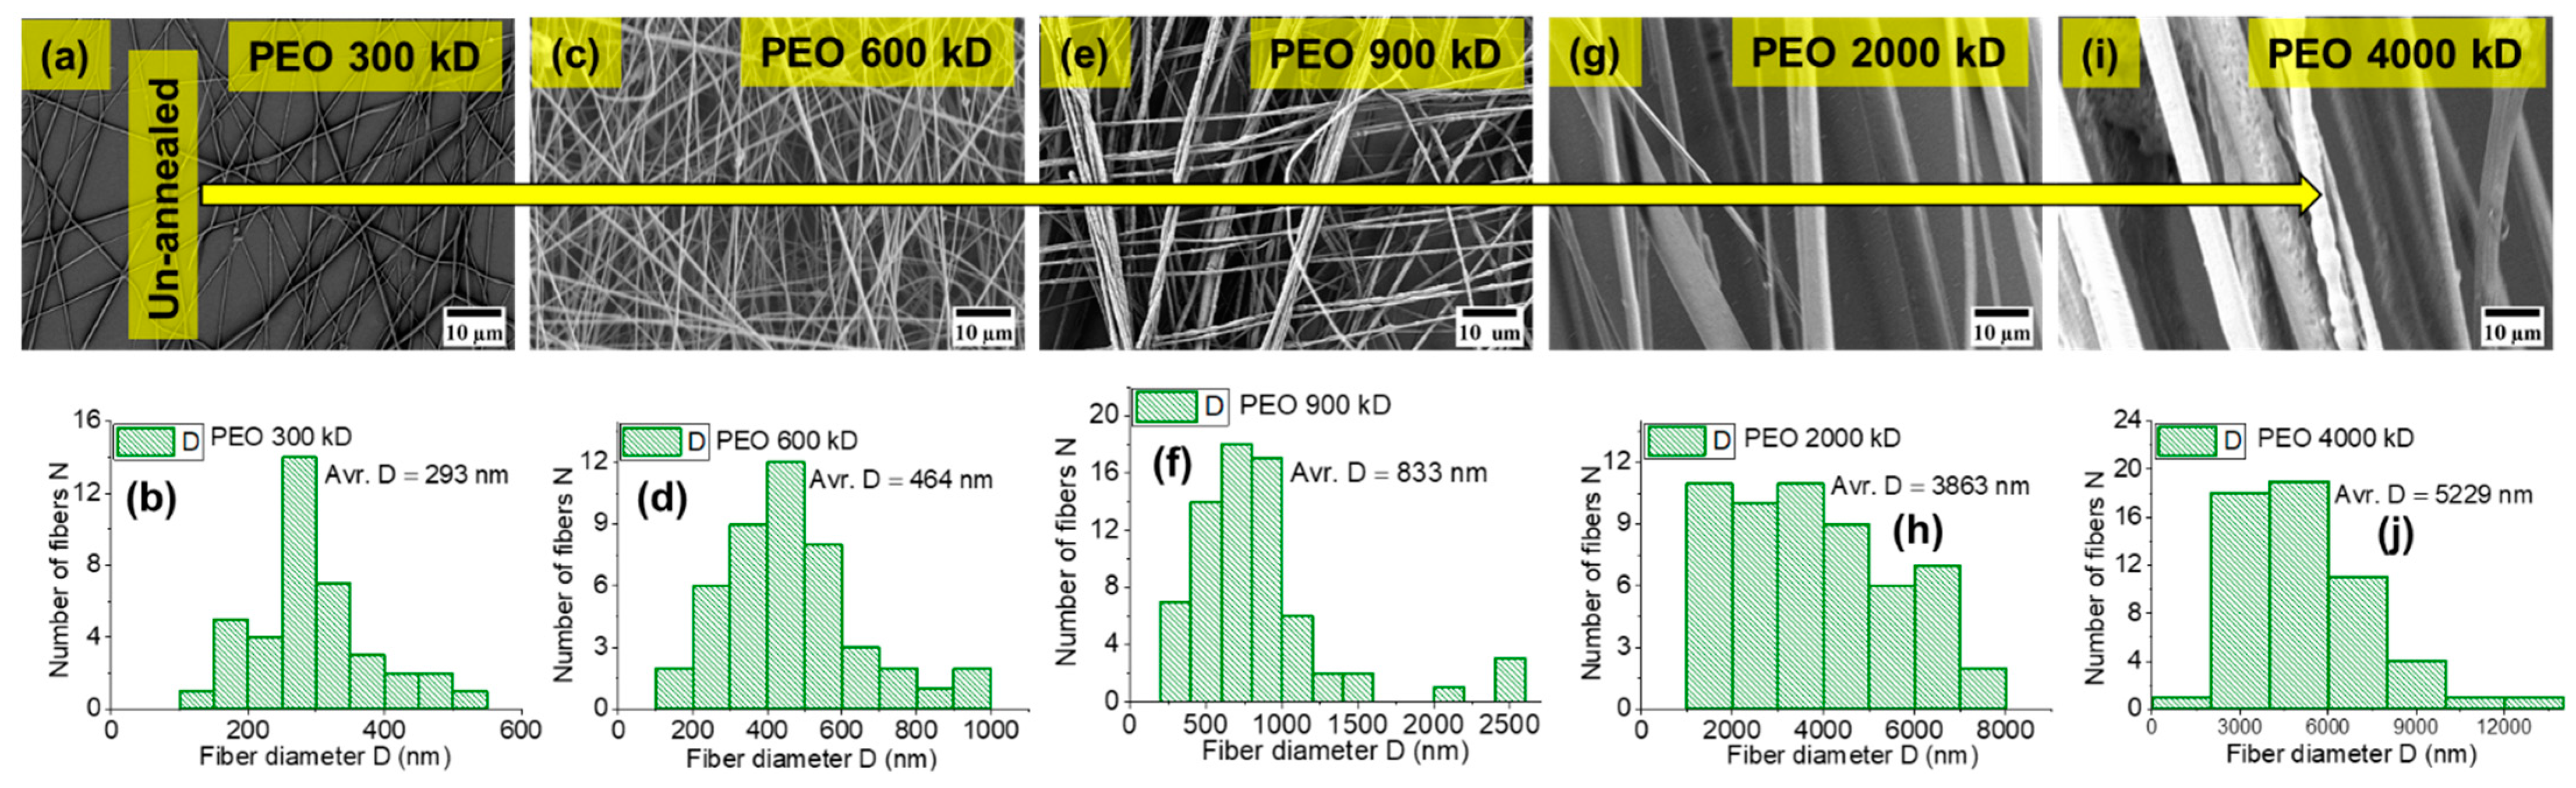
2.1. High Orientation with Tunable Fiber Diameter

The highly aligned electrospun conductive nanofibers of biodegradable polymers were fabricated successfully using a special collector electrode. The scanning electron microscopy (SEM) image (Figure 1a) shows that the fibers are straight and highly aligned in the machine direction MD, while the orientation angles of the fibers were measured against the vertical direction in the SEM image because the vertical axis of the image was positioned to coincide with the machine direction. The histogram (Figure 1b) shows that the fibers are predominantly oriented between 70° and 115°. The highest number of fibers was collected at an angle of 90°, and the orientation angle distribution can be described by a normal (Gauss Fit) distribution.
A detailed SEM image and statistical analysis was conducted for PEO-PANi:CSA fibers (Figure 2 and Figure 3), PCL-PANi:CSA fibers (Figure 2) and PLA-PANi:CSA fibers (Figure 2), respectively. Figure 2 and Figure 3 show the SEM images with their fiber-diameter histograms, including filler concentration (φ%) and average fiber diameter (avr. D) for Case 1–Case 3. Note that the fiber diameter varies from case to case. In this study, the filler–matrix interaction and molar mass (M) of matrix are significant factors that affect the fiber diameter (D) of conductive fibers independently. The effect of filler–matrix interaction on fiber diameter is apparent from Figure 2, where the filler (PANi) produces variable fiber diameter with PEO, PCL, and PLA matrices (50 nm < D < 2500 nm) under the same processing conditions. However, filler-matrix interaction and filler concentration ratio are responsible for the variable diameter and have stated in our recent study [51].
Moreover, the order of molar mass M of polymer matrix is PEO > PCL > PLA and the corresponding trend in fiber diameter is observed: 1950 nm > 978 nm > 432 nm for cases 1, 2, and 3, respectively. Figure 3 shows the trend in fiber diameter for PEO fibers for different molar masses of PEO (300 kD, 600 kD, 900 kD, 2000 kD, and 4000 kD), with φPEO ≈ 2%. The fiber diameter (D) increases (from 290 nm to 5200 nm) with increasing molar mass of PEO. Higher molar mass provides higher viscosity of the polymer solution, which is responsible for thicker fiber diameter when using electrospinning. The statistical analysis (Figure 2 and Figure 3) show that at least bimodal fiber-diameter distribution is present as a result of jet splitting during the electrospinning process. The dependency of viscosity and concentration on the fiber diameter and jet splitting for bimodal distribution has been discussed theoretically and experimentally in [53,54], respectively. However, the molar mass is also among significant factors for determining fiber diameter. The fiber-diameter (D) range of our highly oriented conductive fibers is approximately 50 nm < D < 5000 nm, making them desirable for various applications.

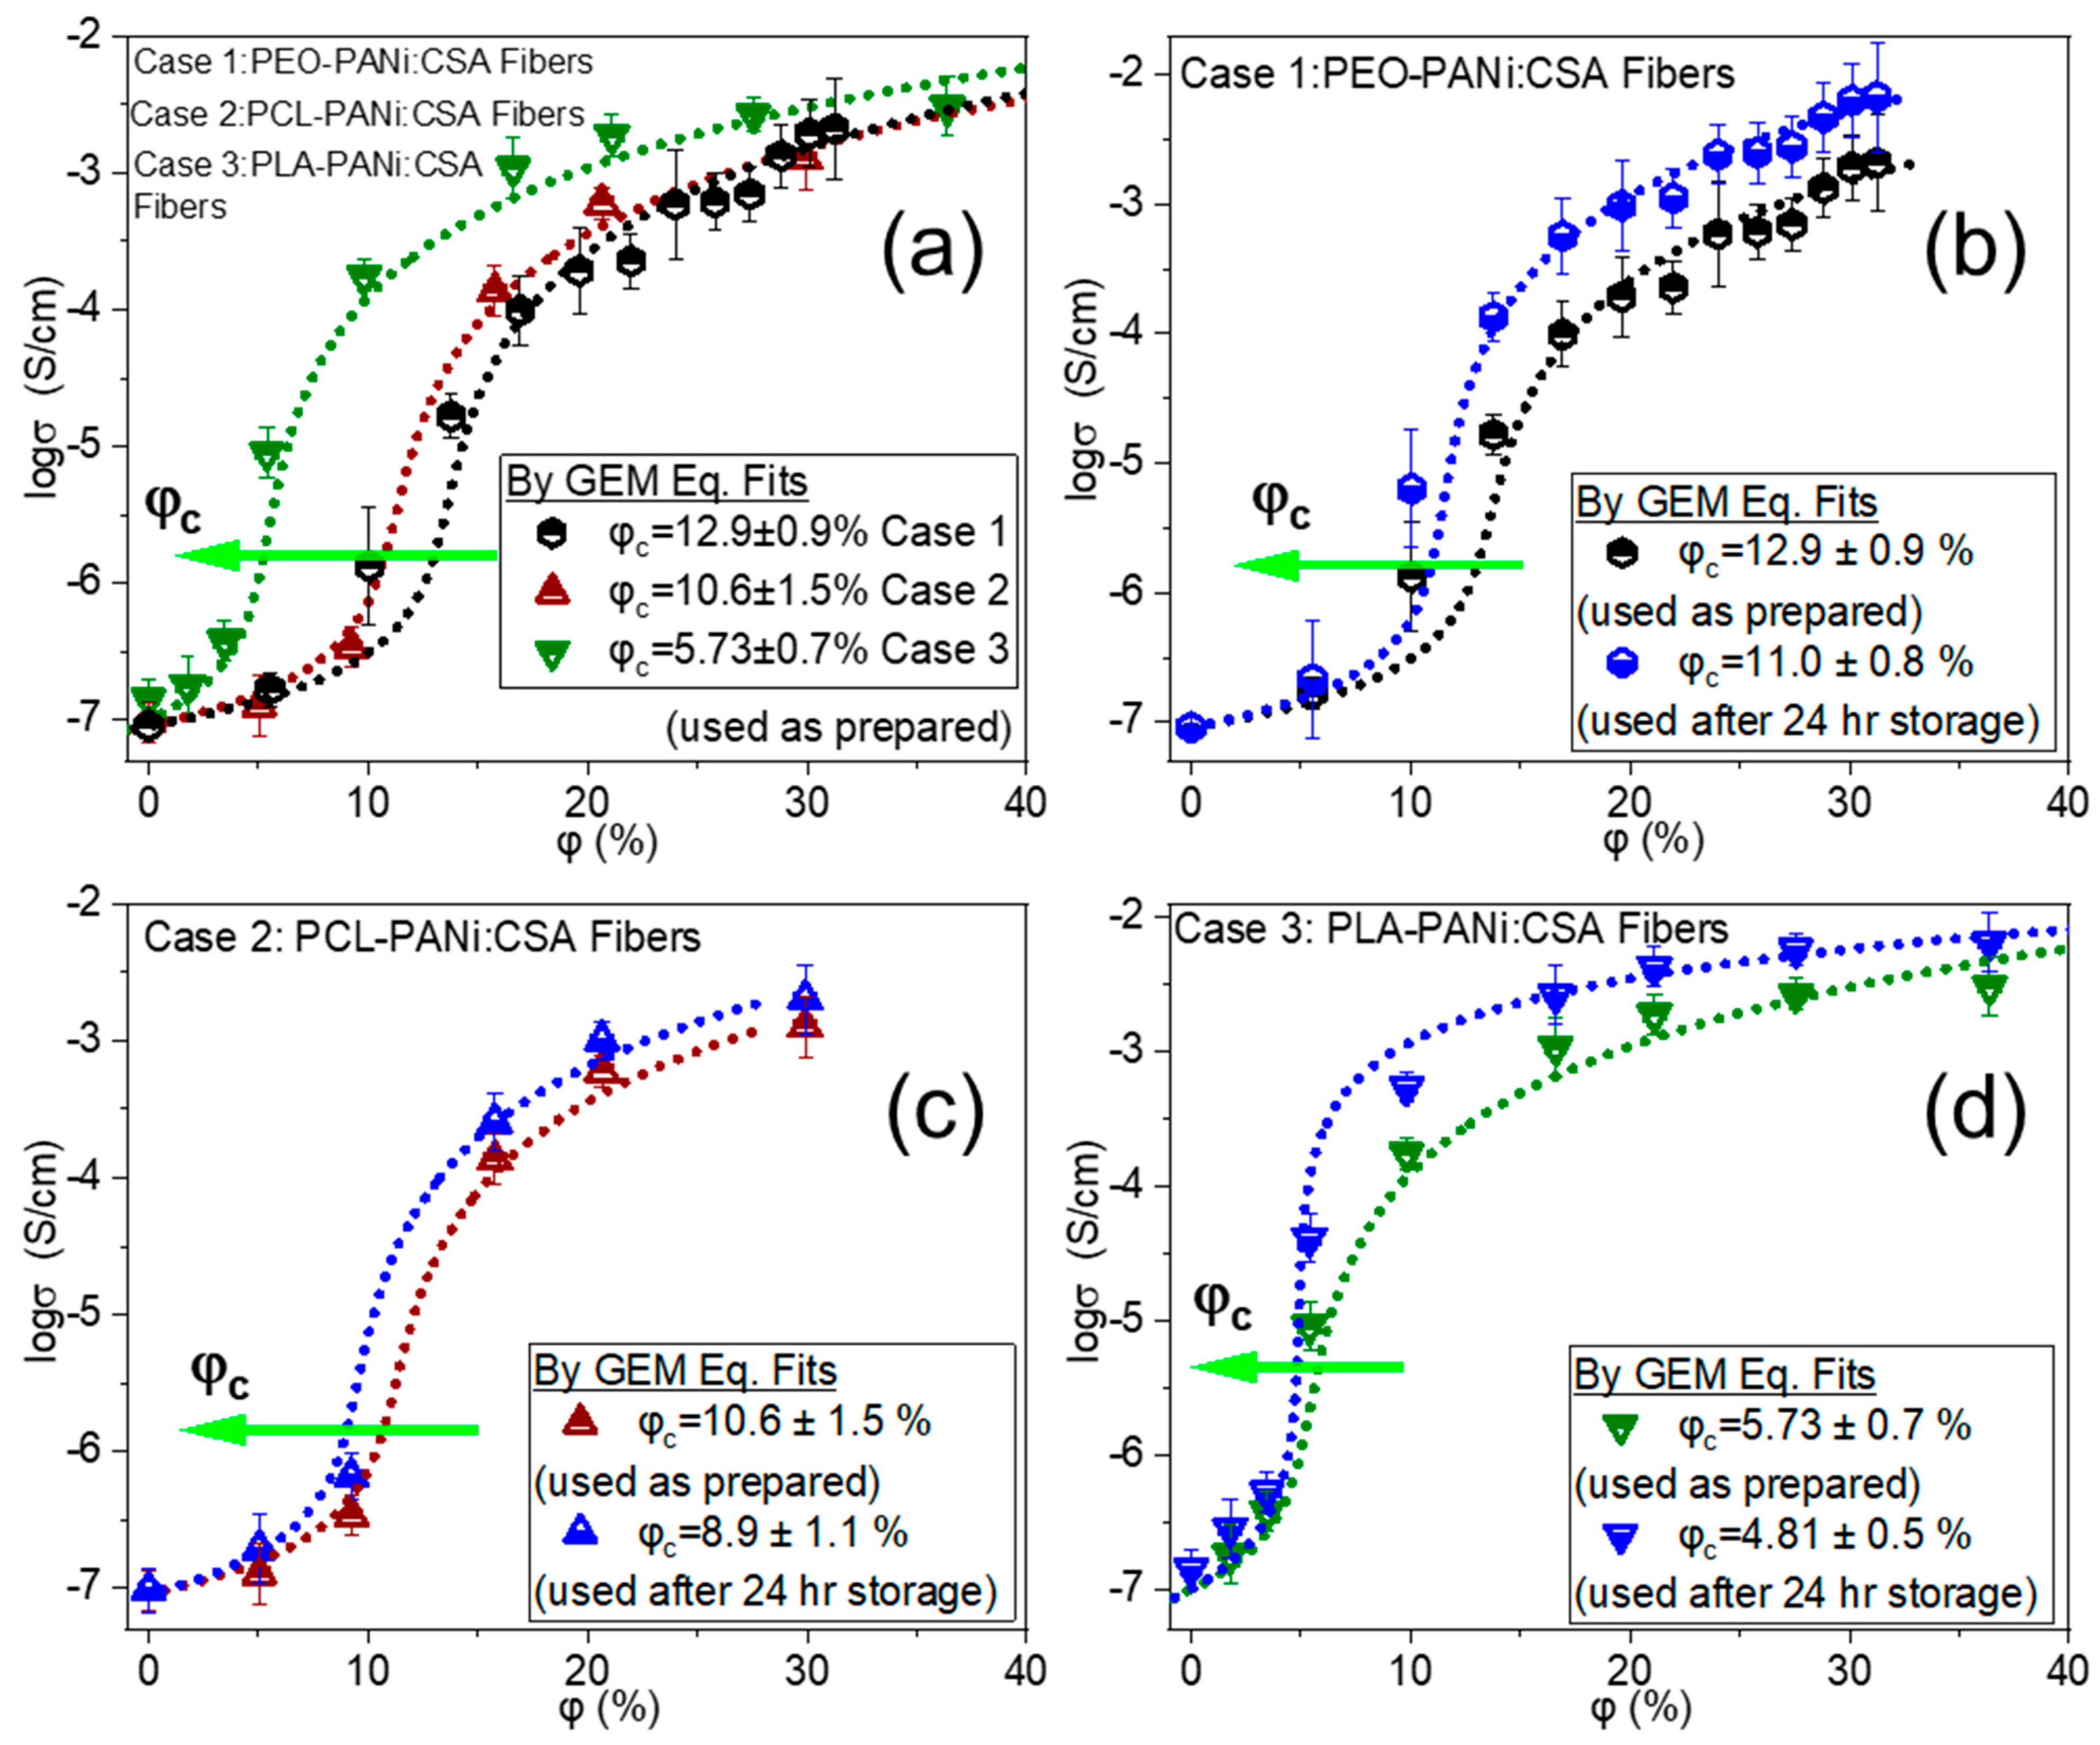
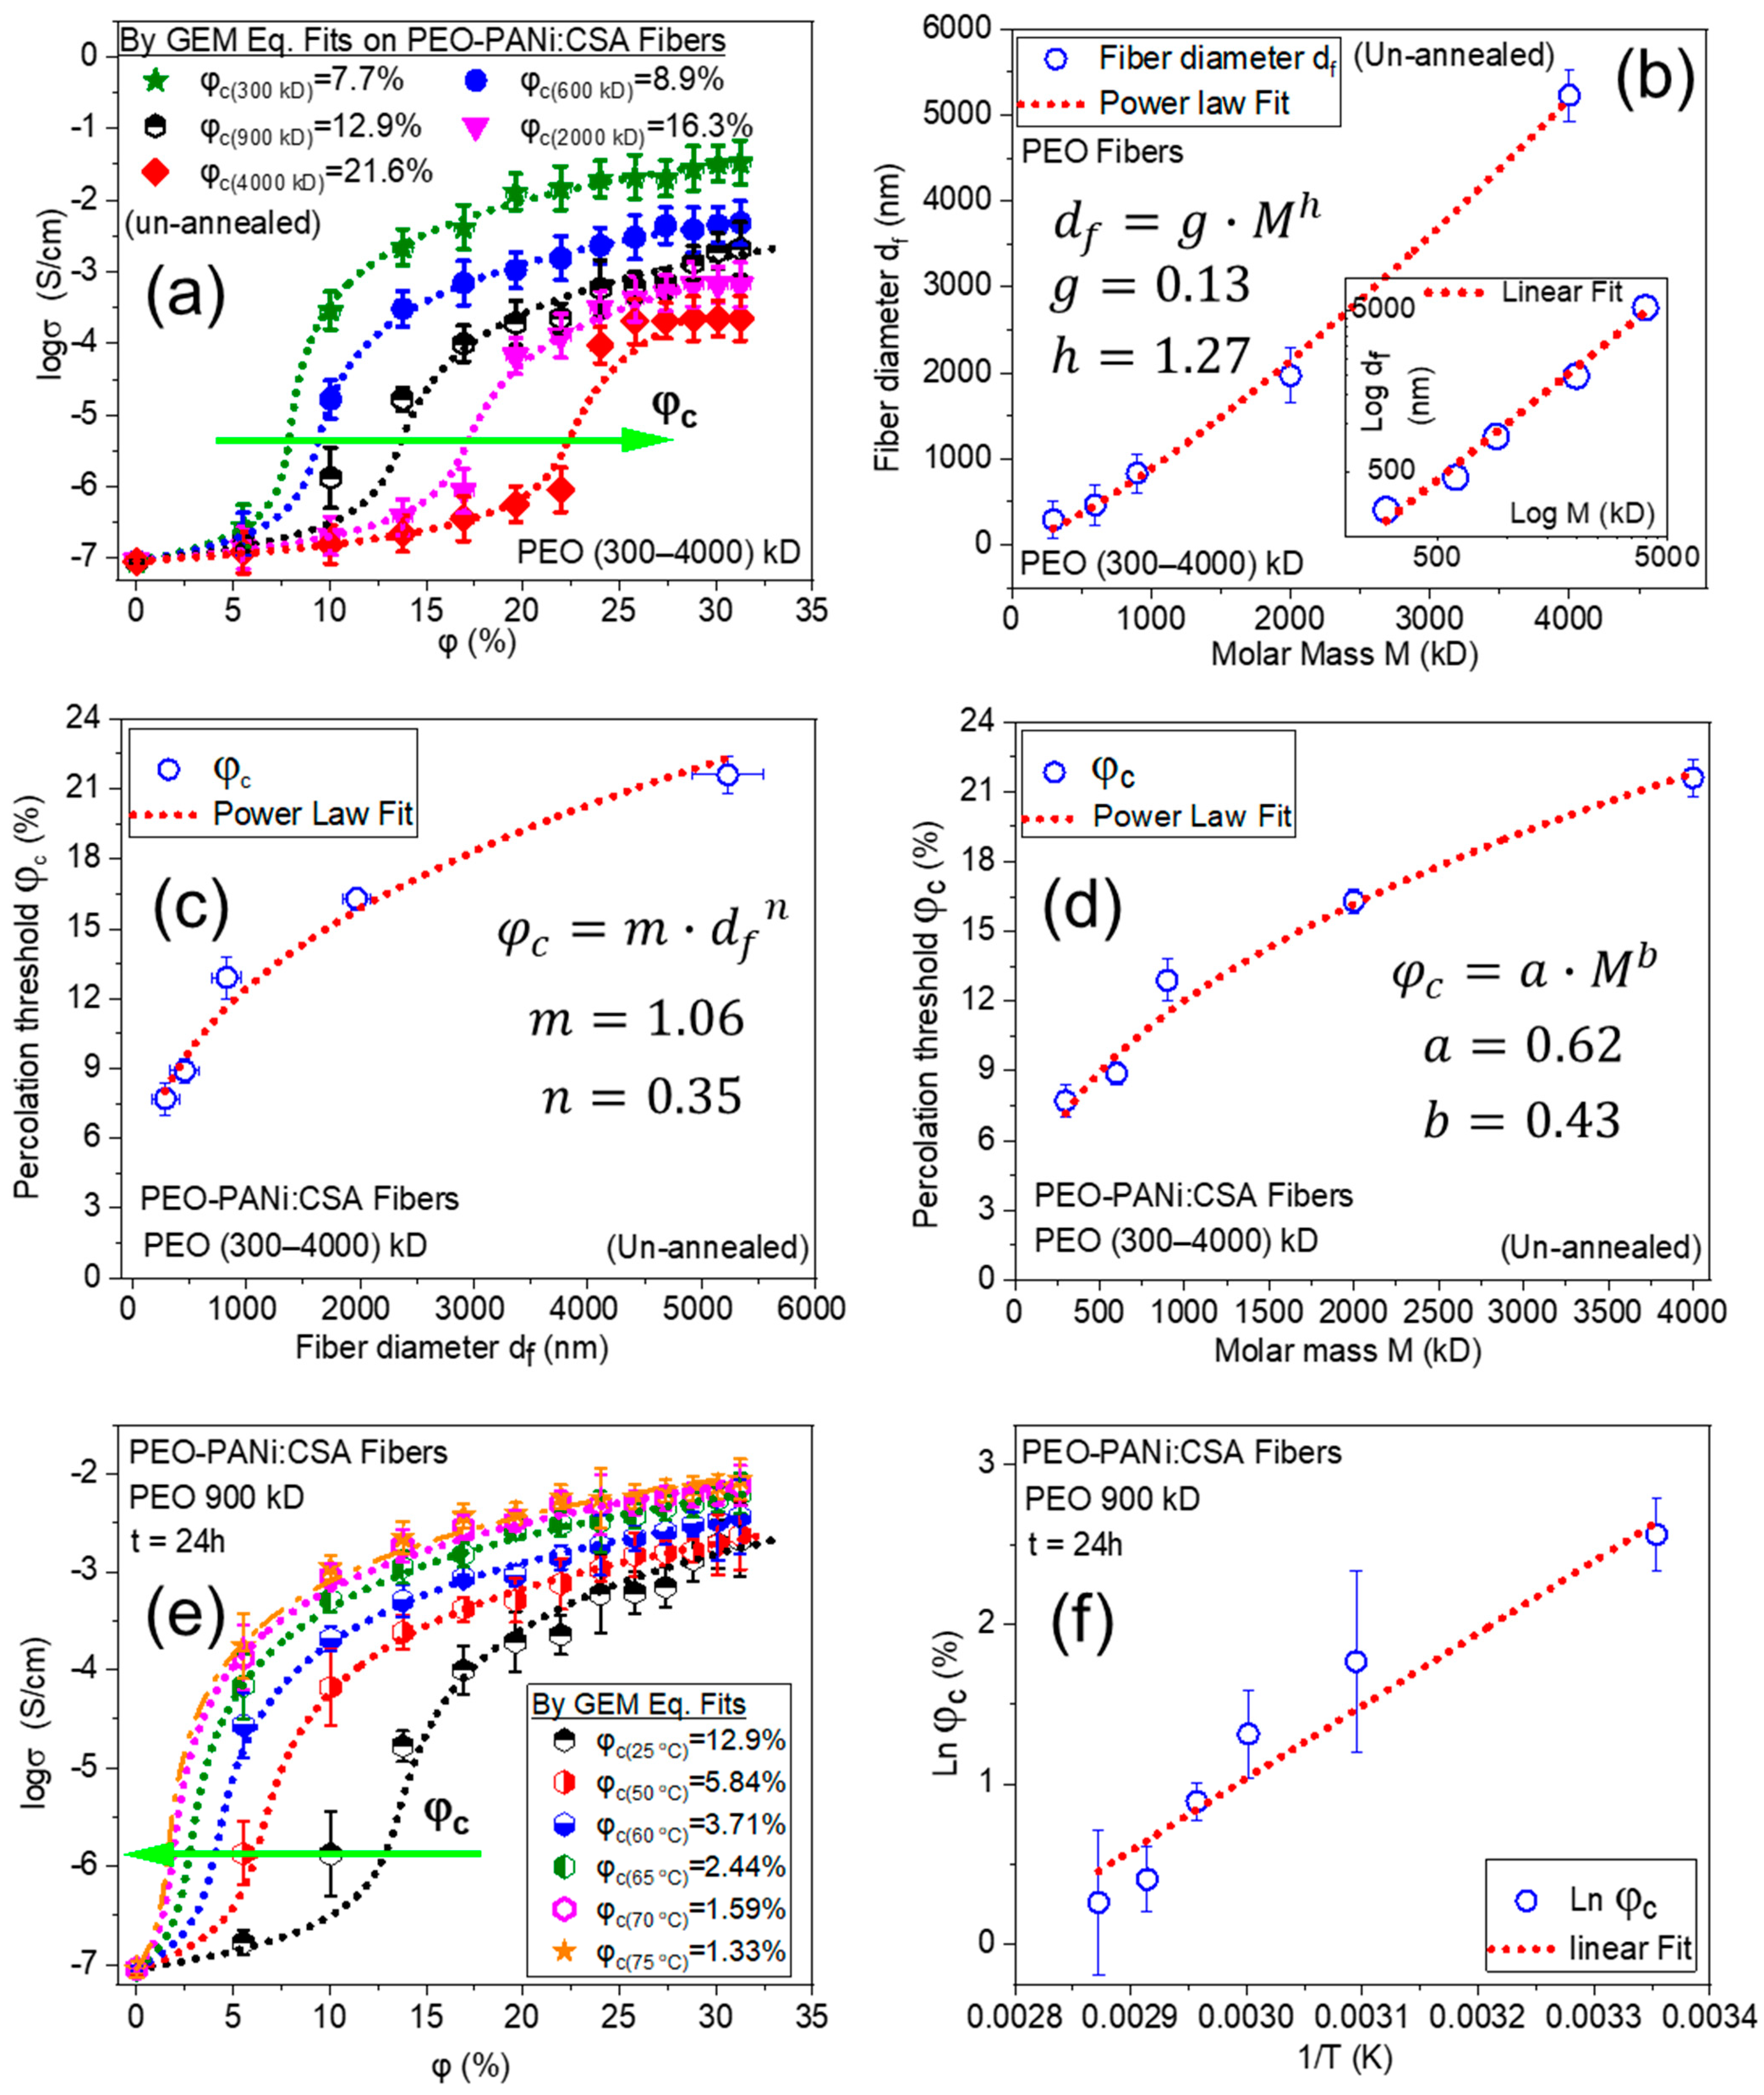
2.2. Identifying the Electrical Percolation Thresholds

The general effective media (GEM) equations (Equations (1) and (2) presented by McLachlan) [55] are used to determine the critical volume fraction/percolation threshold (φc) of ECFCs:
( 1 φ ) · σ m 1 / s σ 1 / s σ m 1 / s + ( 1 φ c φ c ) · σ 1 / s   +   φ · σ f 1 / t σ 1 / t σ f 1 / t + ( 1 φ c φ c ) · σ 1 / t = 0
( 100 φ ) · A   +   φ · B = 0   where   A = σ m 1 / s σ 1 / s σ m 1 / s + ( 100 φ c φ c ) · σ 1 / s   and   B = σ f 1 / t σ 1 / t σ f 1 / t + ( 100 φ c φ c ) · σ 1 / t
where φ is the volume fraction of filler in solid ECFCs calculated using Equation (S10) (derived and stated under Supplementary materials in Section S1), σ is the conductivity of ECFCs, σm and σf are the conductivities of pure matrix and filler, respectively (stated under Table 1), and φc characterizes the percolation threshold. s and t are universal constants [56].
To convert volume fraction (φ) to volume percent (φ%) of filler, Equation (1) can be re-written as Equation (2);
Graphs are plotted utilizing logarithm of conductivity (log σ) of ECFCs and volume percent of filler (φ%). The GEM equation (Equation (2)), with its universal exponents s = 0.87 and t = 2 [51], is fitted with adjustable φc, σm, and σf on each set of experimental conductivities of ECFCs in all three cases. Nevertheless, the fit is performed under the constraints that the conductivities of matrix (σm) and filler (σf) must have constant value within each case. Thus, in the McLachlan GEM equation-fitting procedure, φc is the only adjustable parameter, while the other parameters (s, t, σm, and σf) are kept constant.
To check the annealing dependence of the conductivity of ECFCs, PEO-PANi:CSA fibers were annealed at 50, 60, 65, 70, and 75 °C for a fixed time interval of 24 h under vacuum conditions. The annealing causes lowering the percolation threshold with significant increase in conductivity of electrospun fibers.
The details of the annealing process are stated under Supplementary materials in Section S2.
The resistance R of annealed ECFCs was also measured at room temperature. To ensure accuracy and precision, each sample of ECFCs was fabricated, annealed, and measured at least three times.
Three cases were investigated, and all showed a steep increase in electrical conductivity on reaching a critical concentration, which corresponds to φc. Moreover, the GEM equation was fitted only when electrical conductivity reached flat-plateaus (almost flat-plateaus) at sufficiently high degree of filler. The three cases are Case 1: PEO-PANi:CSA fibers, Case 2: PCL-PANi:CSA fibers, and Case 3: PLA-PANi:CSA fibers.
In all three cases, PANi was used as filler with equal weight doping ratio with CSA (PANi: CSA = 1:1), with conductivity of σf = 100 ± 5 S cm−1. The PEO, PCL, and PLA are used as matrix in Case 1, Case 2, and Case 3, respectively. The conductivity of pure matrix (σm) for PEO, PCL, and PLA fibers is determined at room temperature; σPEO = (8.14 ± 0.3) · 10−8 S cm−1, σPCL = (9.62 ± 1.4) · 10−8 S cm−1, and σm = (1.39 ± 0.95) · 107 S cm−1, respectively.
The maximum concentrations of doped-PANi, spun in Case 1, Case 2, and Case 3 is approximately 31%, 30%, and 36%, respectively. The GEM fitted curves and values of φc for Case 1–Case 3 are shown in Figure 4. The green arrows in Figure 4 indicate the trend of decreasing φc.
The variation of electrical conductivity of ECFCs with increasing filler (ICPs) concentration was divided into three stages. In the first stage, using very low concentration ICPs, the electrical conductivity of ECFCs was very low due to the non-completion of a conductive path between ICP particles (as schematically shown in Figure 5a). In the second stage, the electrical conductivity of ECFCs increased markedly, as the complete electrically conductive path formed due to mutual contacts between ICPs (schematic representation is shown in Figure 5b). The volume fraction of ICPs at this stage is called the percolation threshold φc and calculated by fitting the McLachlan Equation. In the final stage, with the further addition of ICPs to the polymer matrix, several electrically conductive paths were formed (as schematically shown in Figure 5c), and the electrical conductivity of ECFCs further increased gradually, until levelling off.

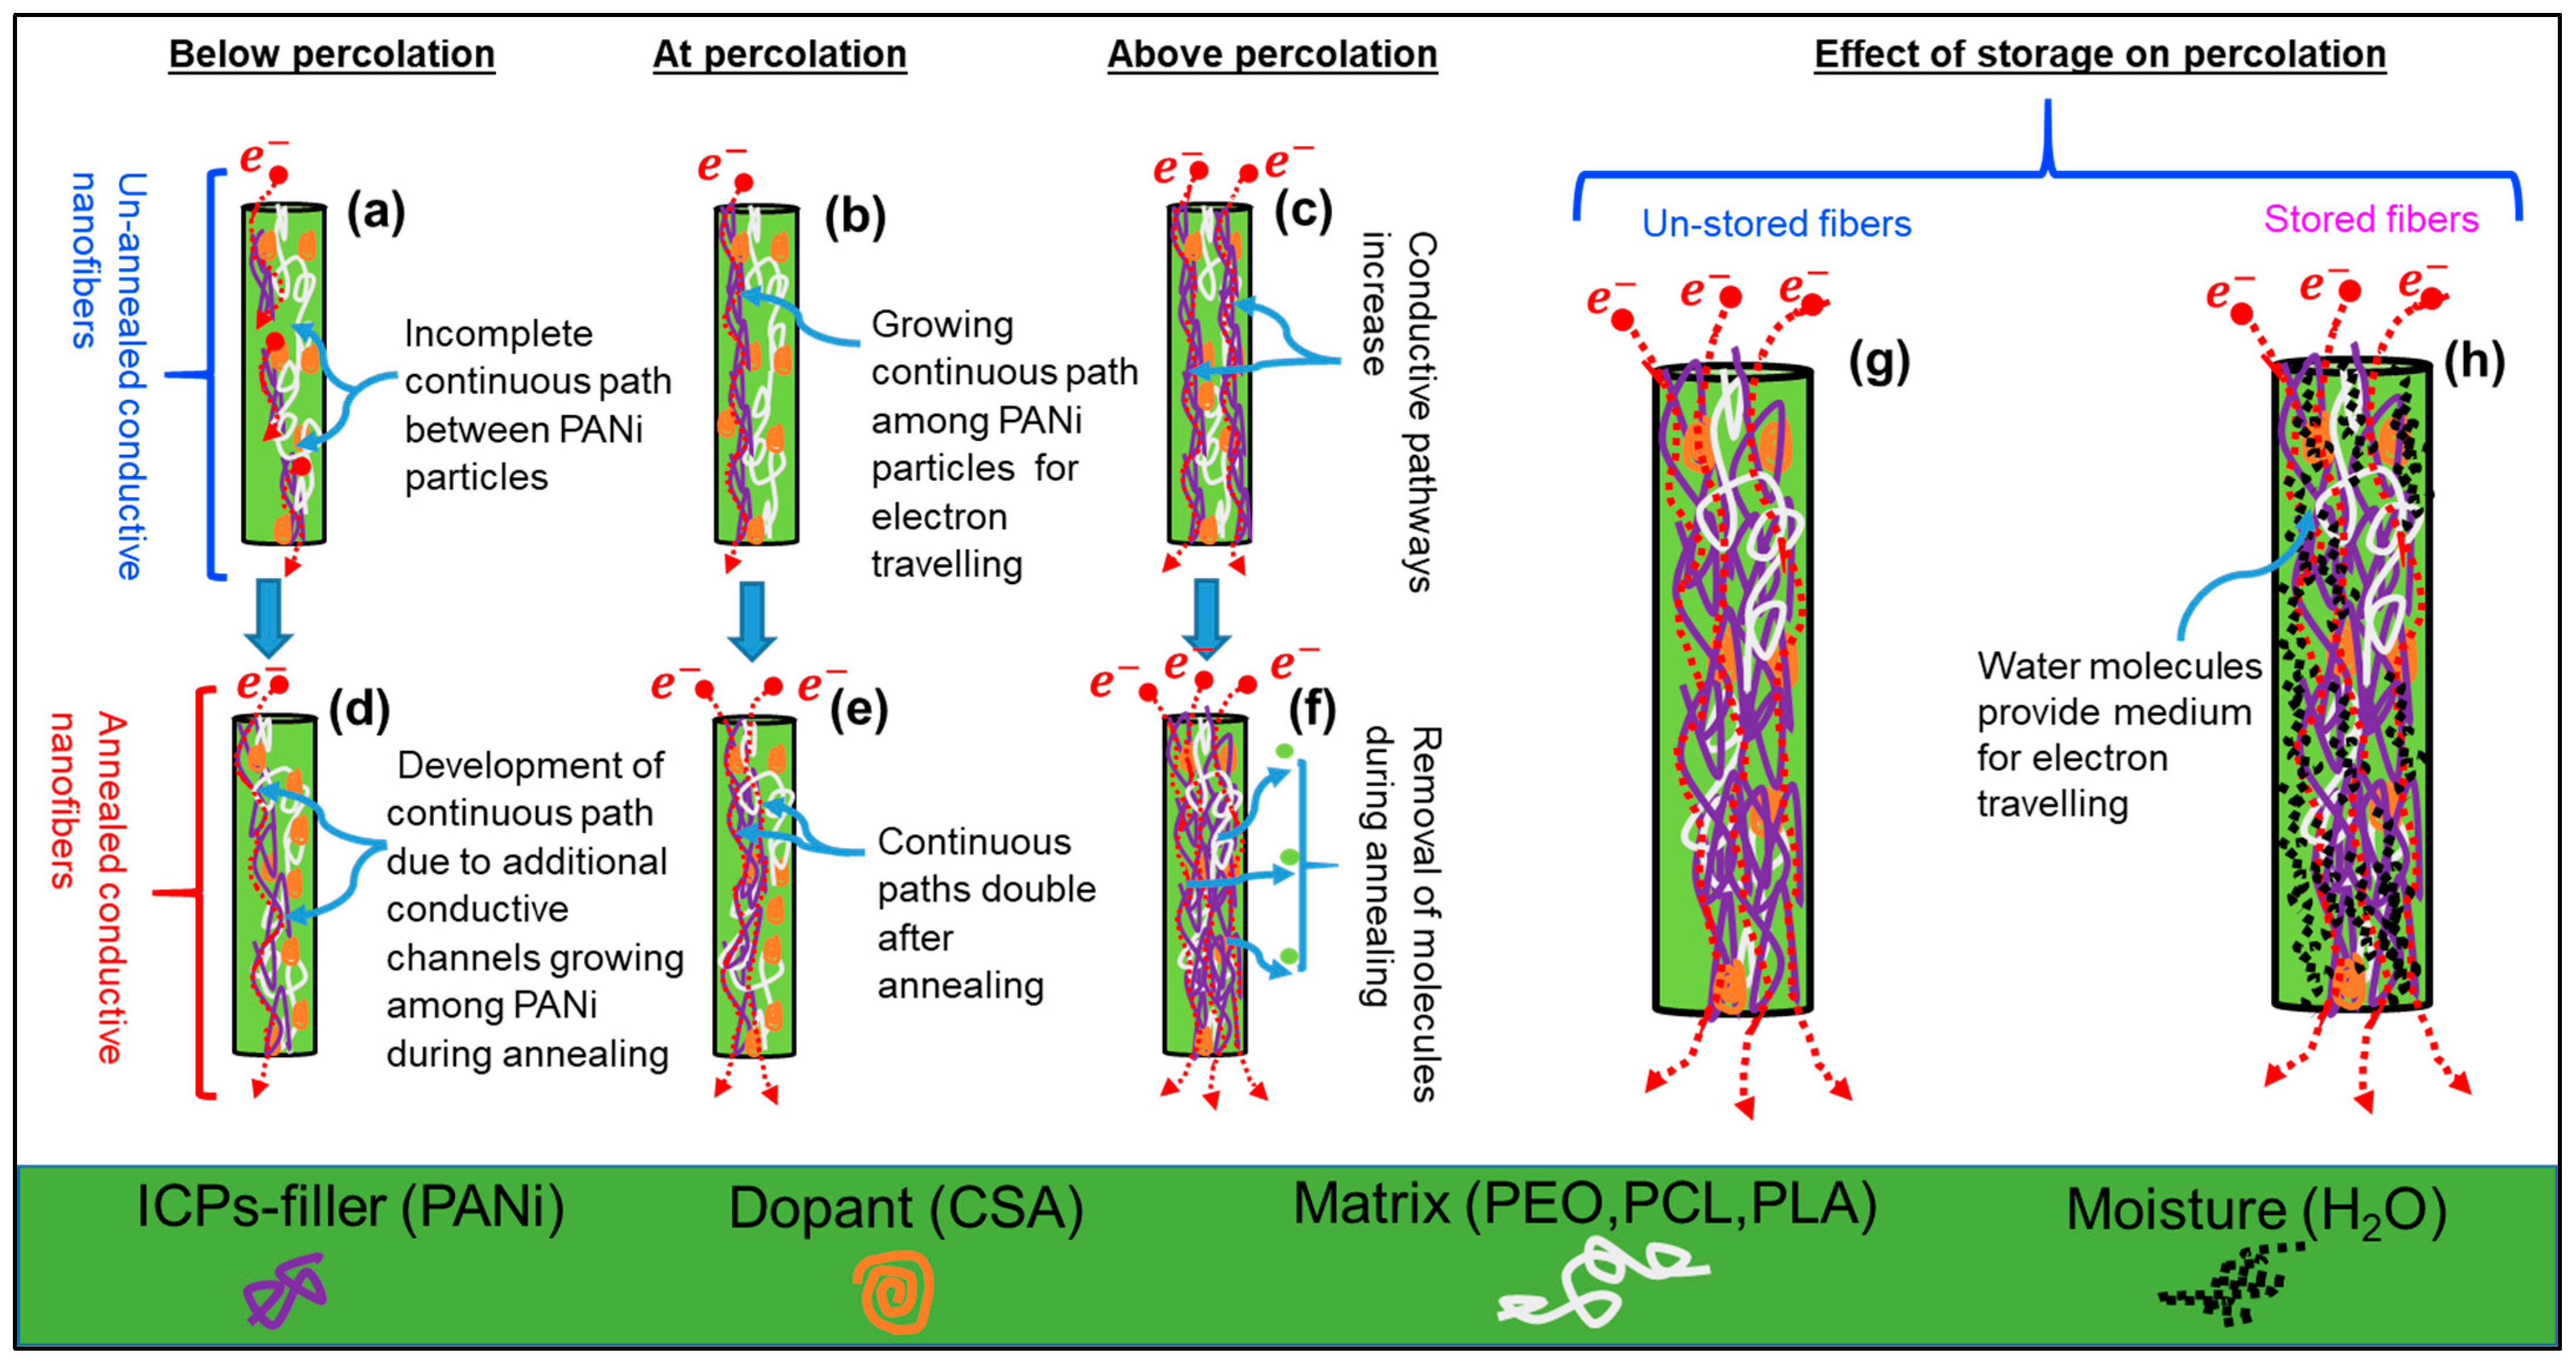
2.2.1. Significant Factors in Determining Percolation Thresholds

The various characteristics of filler and matrix, such as interactions/compatibilities between filler and host polymer and molar mass of the host polymer, have significant influence on determining percolation threshold of electrospun conductive nanofibers.
Figure 4a shows the comparison between all three cases (Case 1–Case 3) of un-annealed (used as prepared) ECFCs with their GEM equation-fitted curves. All three cases have different values of percolation threshold φc. This is a direct consequence of different interactions/compatibilities between filler PANi and polymeric matrices of PEO, PCL, and PLA and we have already stated in our recent study [51].
The order of molar mass M of host polymers in these three cases is PEO > PCL > PLA, and the corresponding trend in φc values is observed; 12.9% > 10.6% > 5.73% for Case 1, 2, and 3, respectively (as shown in Figure 4a). In order to go deeper into the analysis of molar mass dependence with percolation threshold, PEO-PANi:CSA fibers were produced for different molar masses of PEO. Figure 6a shows the trend in φc for PEO-PANi:CSA fibers for different molar masses of PEO (300 kD, 600 kD, 900 kD, 2000 kD, and 4000 kD). φc increases with increasing molar mass of PEO. The green arrow in Figure 6a indicates the trend of increasing φc (from 7.7 to 21.6%). Higher molar mass leads higher viscosity, which is responsible for higher incompatibility among fillers and matrices. Moreover, higher molar mass of host polymer leads to thicker fiber diameter using electrospinning and the power law correlation between molar mass and fiber diameter is shown in Figure 6b. The fibers with thicker diameters need higher percolation thresholds for developing continuous pathways for charge transport and the power law correlation between fiber diamter and percolation threshold is shown in Figure 6c. However, the direct correlation between molar mass (M) and percolation threshold φc is shown in Figure 6d. The percolation threshold φc has a power law dependency with molar mass M.

2.2.2. Post Factors for Determining Percolation Thresholds

Post factors, such as storage time (stored at room temperature 15–25 °C and relative humidity 20–70%) and annealing temperature also have significant influence on determining percolation thresholds of ECFCs. Due to the high specific surface area of electrospun fibers and high affinity of polyaniline for water molecules, high inter-grain connectivity is possible, which ultimately increases electrical mobility in stored ECFCs (schematic representation is shown in Figure 5h). Figure 4b–d show that storage has a marginal effect on percolation threshold φc of ECFCs; φc decreases with storage time. Moreover, for Case 1, the storage effect is more pronounced (φc decreases from 12.9 to 11%) because PEO is more hydrophilic than PCL and PLA.
During the annealing process, the molecular chains of host polymers become more relaxed (expanded), and ICPs (PANi particles) acquire a certain degree of freedom to interconnect/reorganize themselves. This reorganizing (intermingling) of ICPs generates more paths and additional conductive channels (as schematically shown in Figure 5d–f), which are responsible for inter and intra-chain conductivity in annealed ECFCs [57,58]. Nevertheless, annealed ECFCs can transport charge more efficiently than un-annealed. Therefore, the annealed ECFCs have higher conductivity with lower percolation threshold φc than un-annealed ECFCs [59,60,61,62]. The effect of annealing temperature on PEO (900 kD)-PANi:CSA fibers is shown in Figure 6e. The green arrow in Figure 6e indicates the trend of decreasing φc (from 12.9 to 1.3%). The correlation between percolation threshold φc and temperature (T) is shown in Figure 6f indicating an Arrhenius activation process within experimental error.

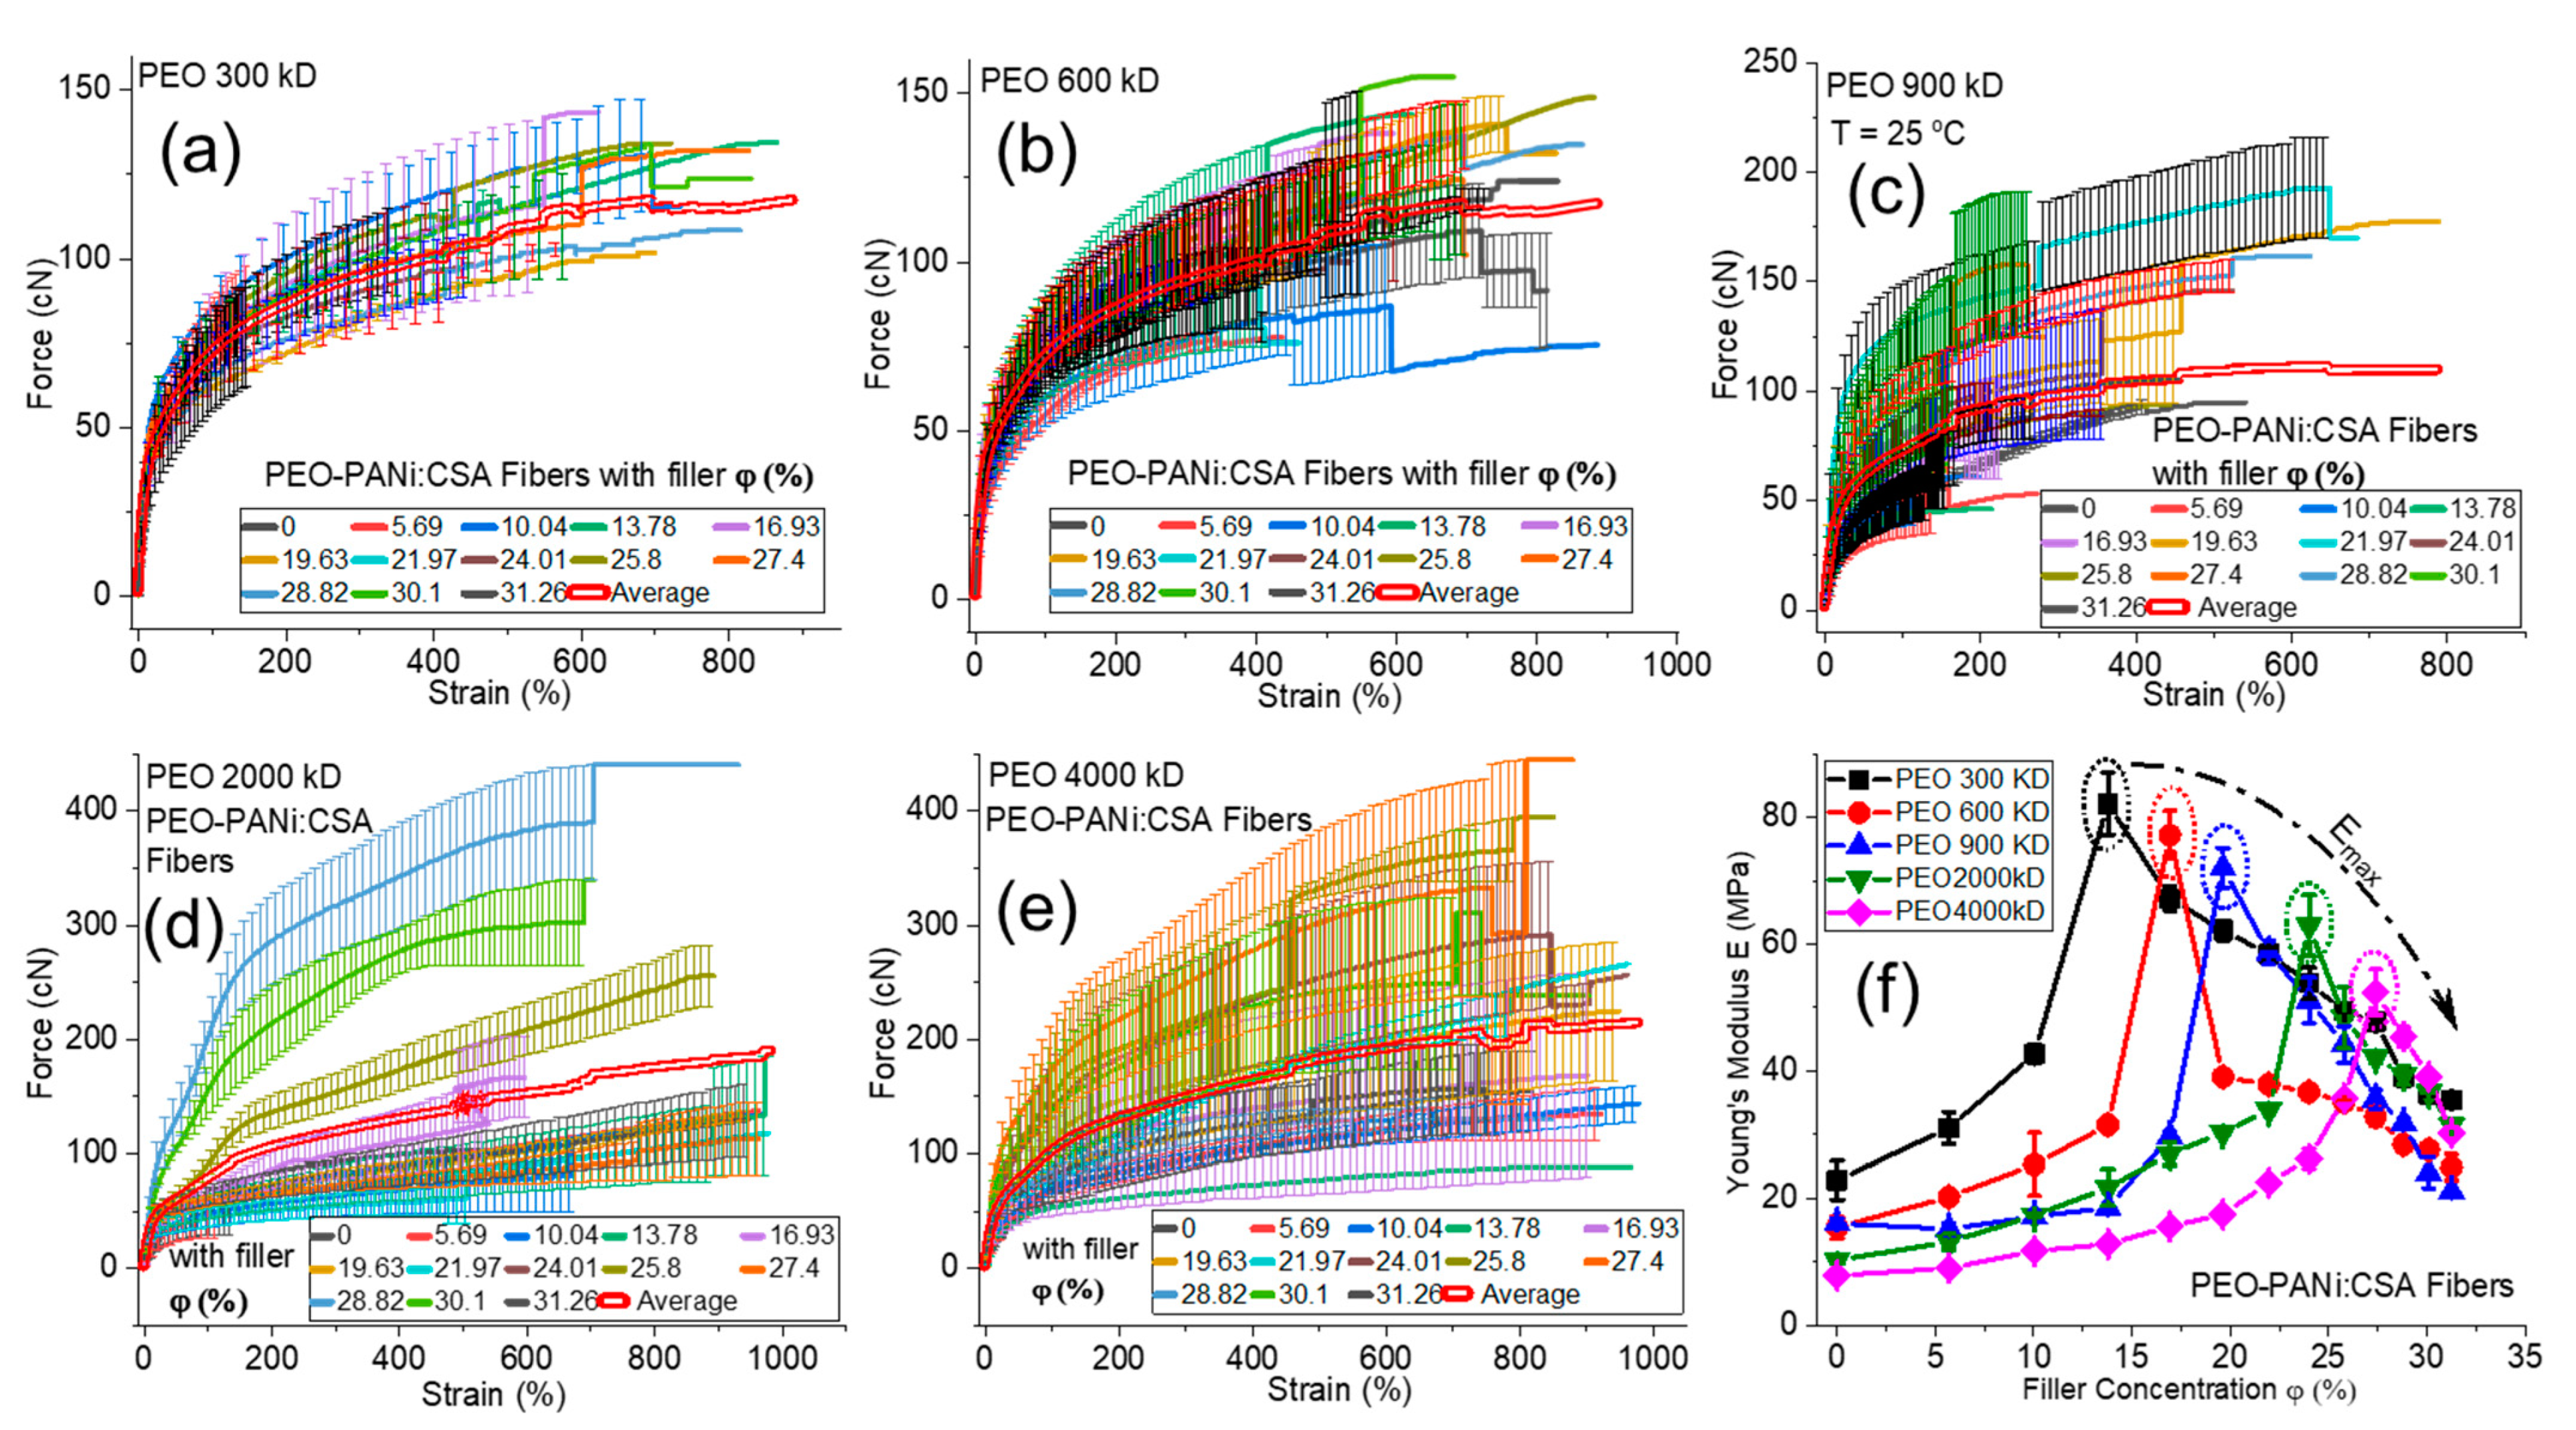
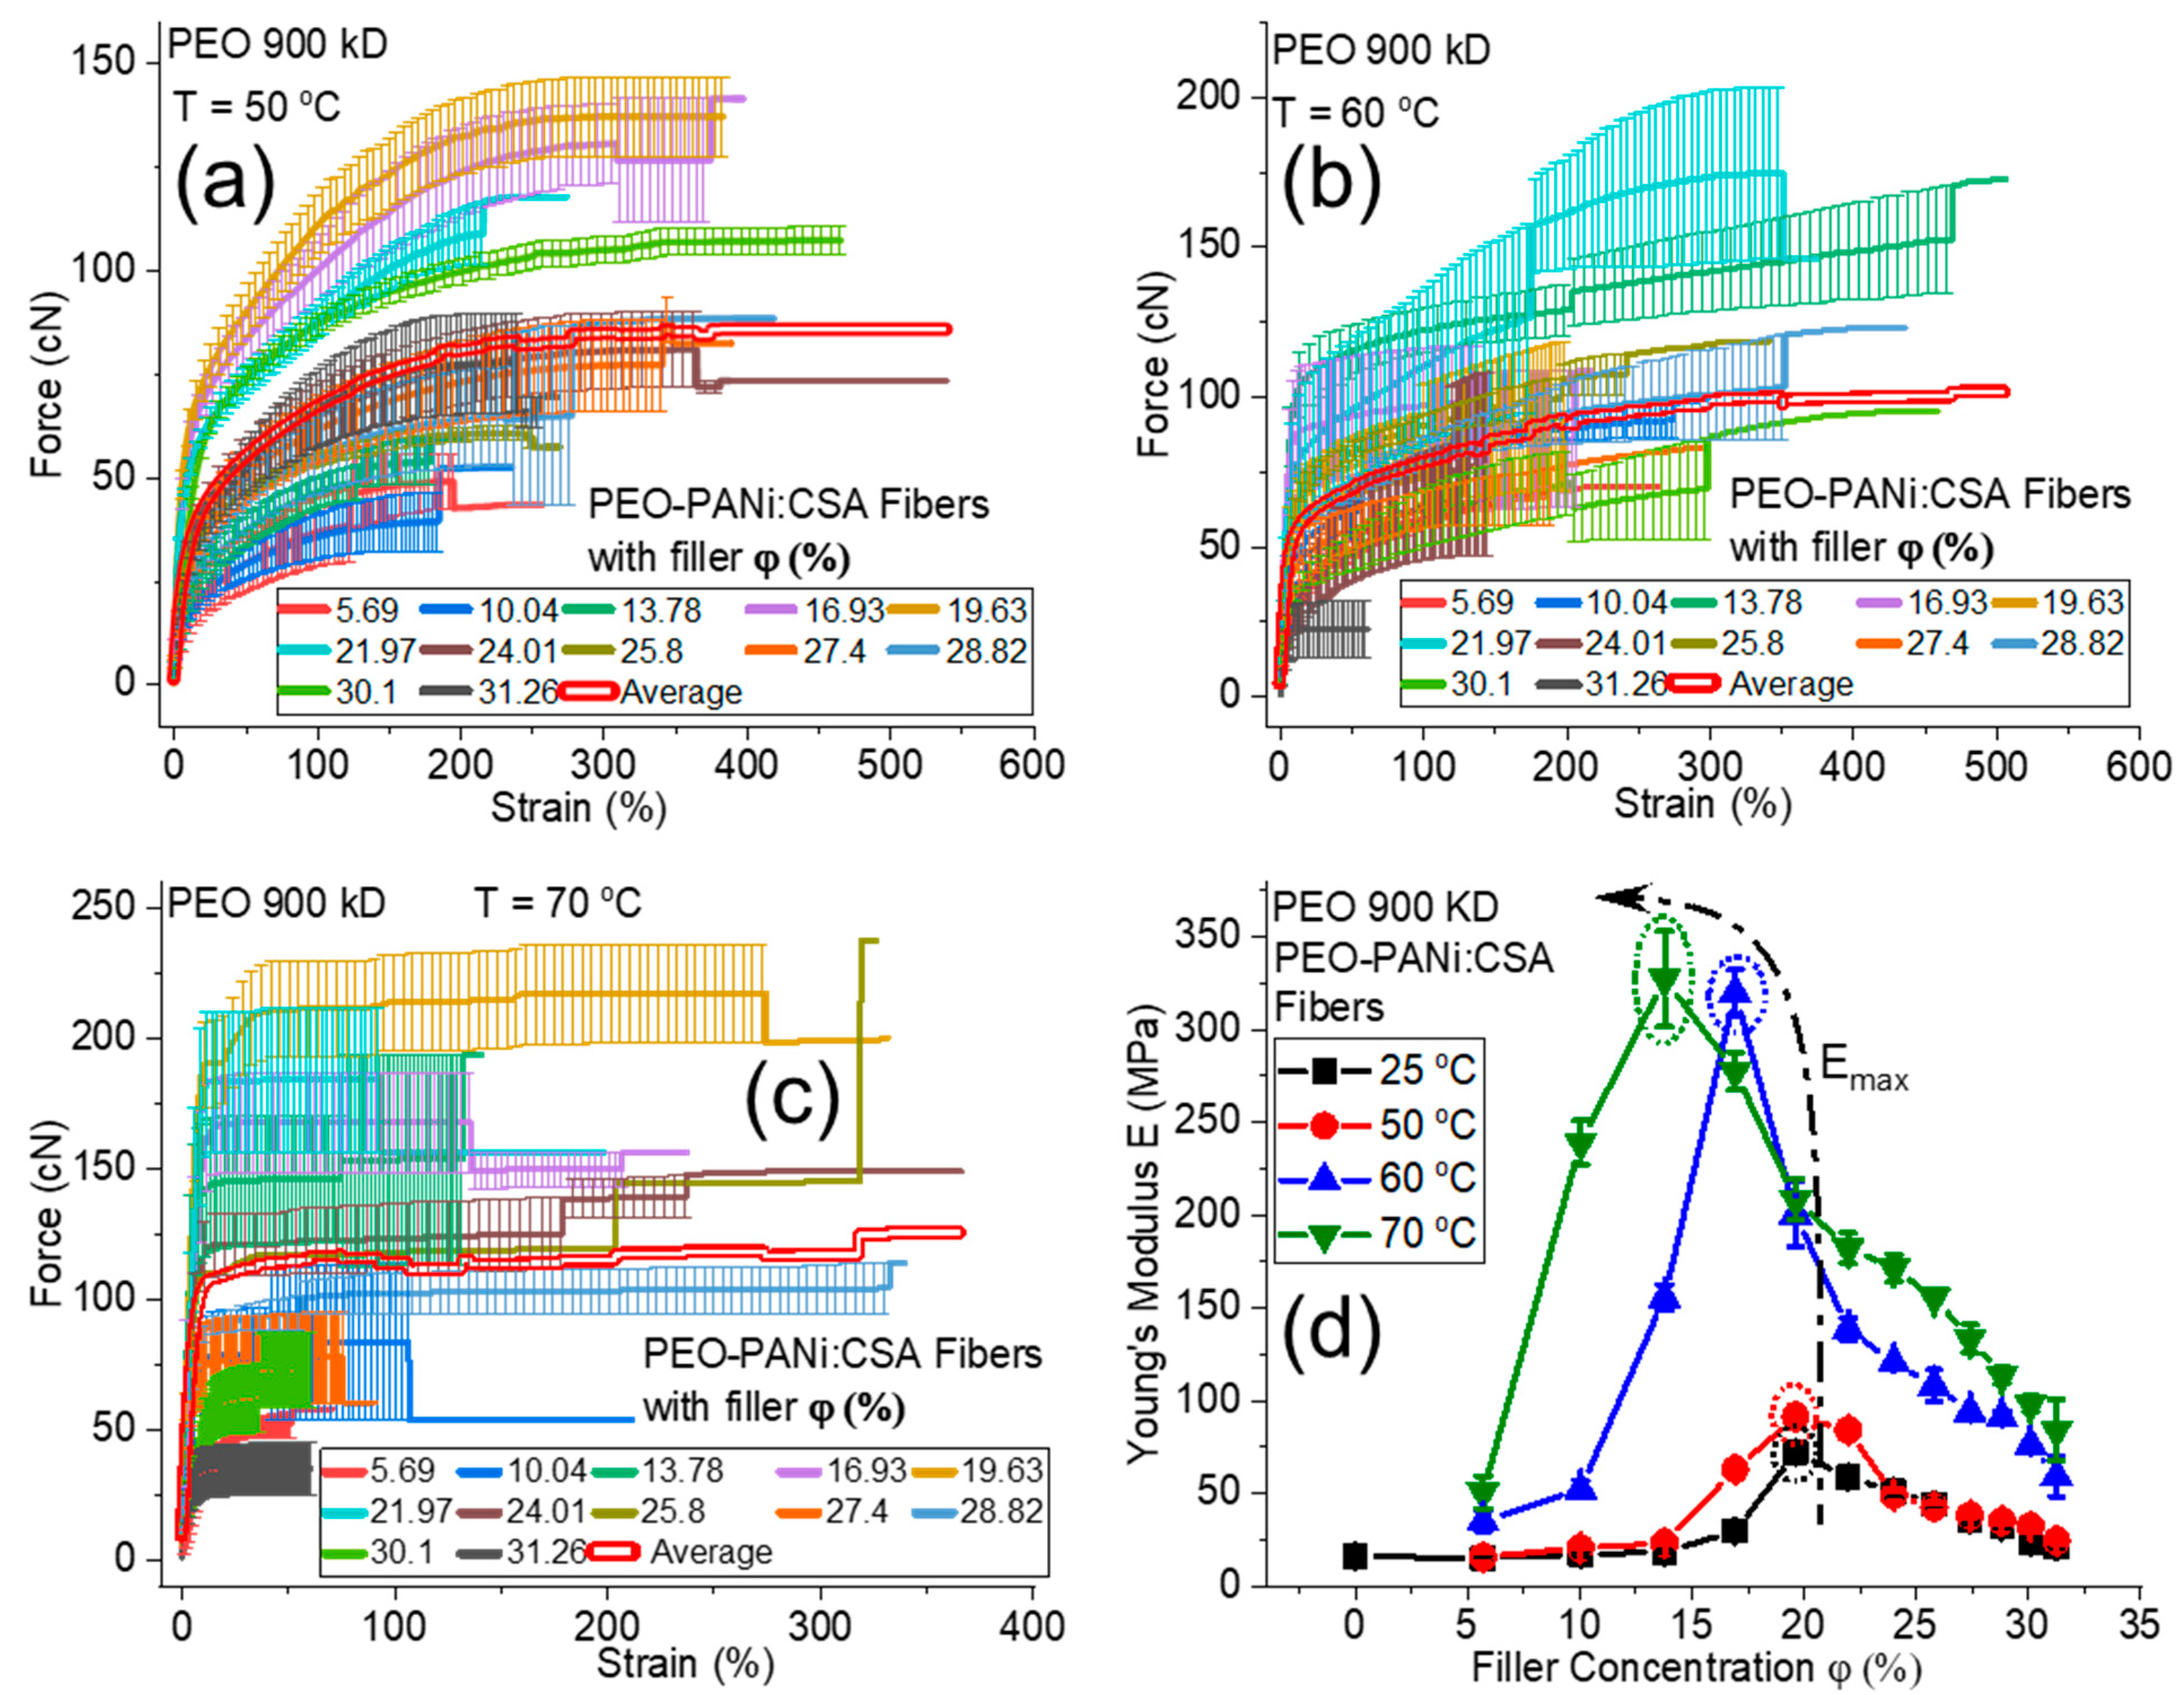
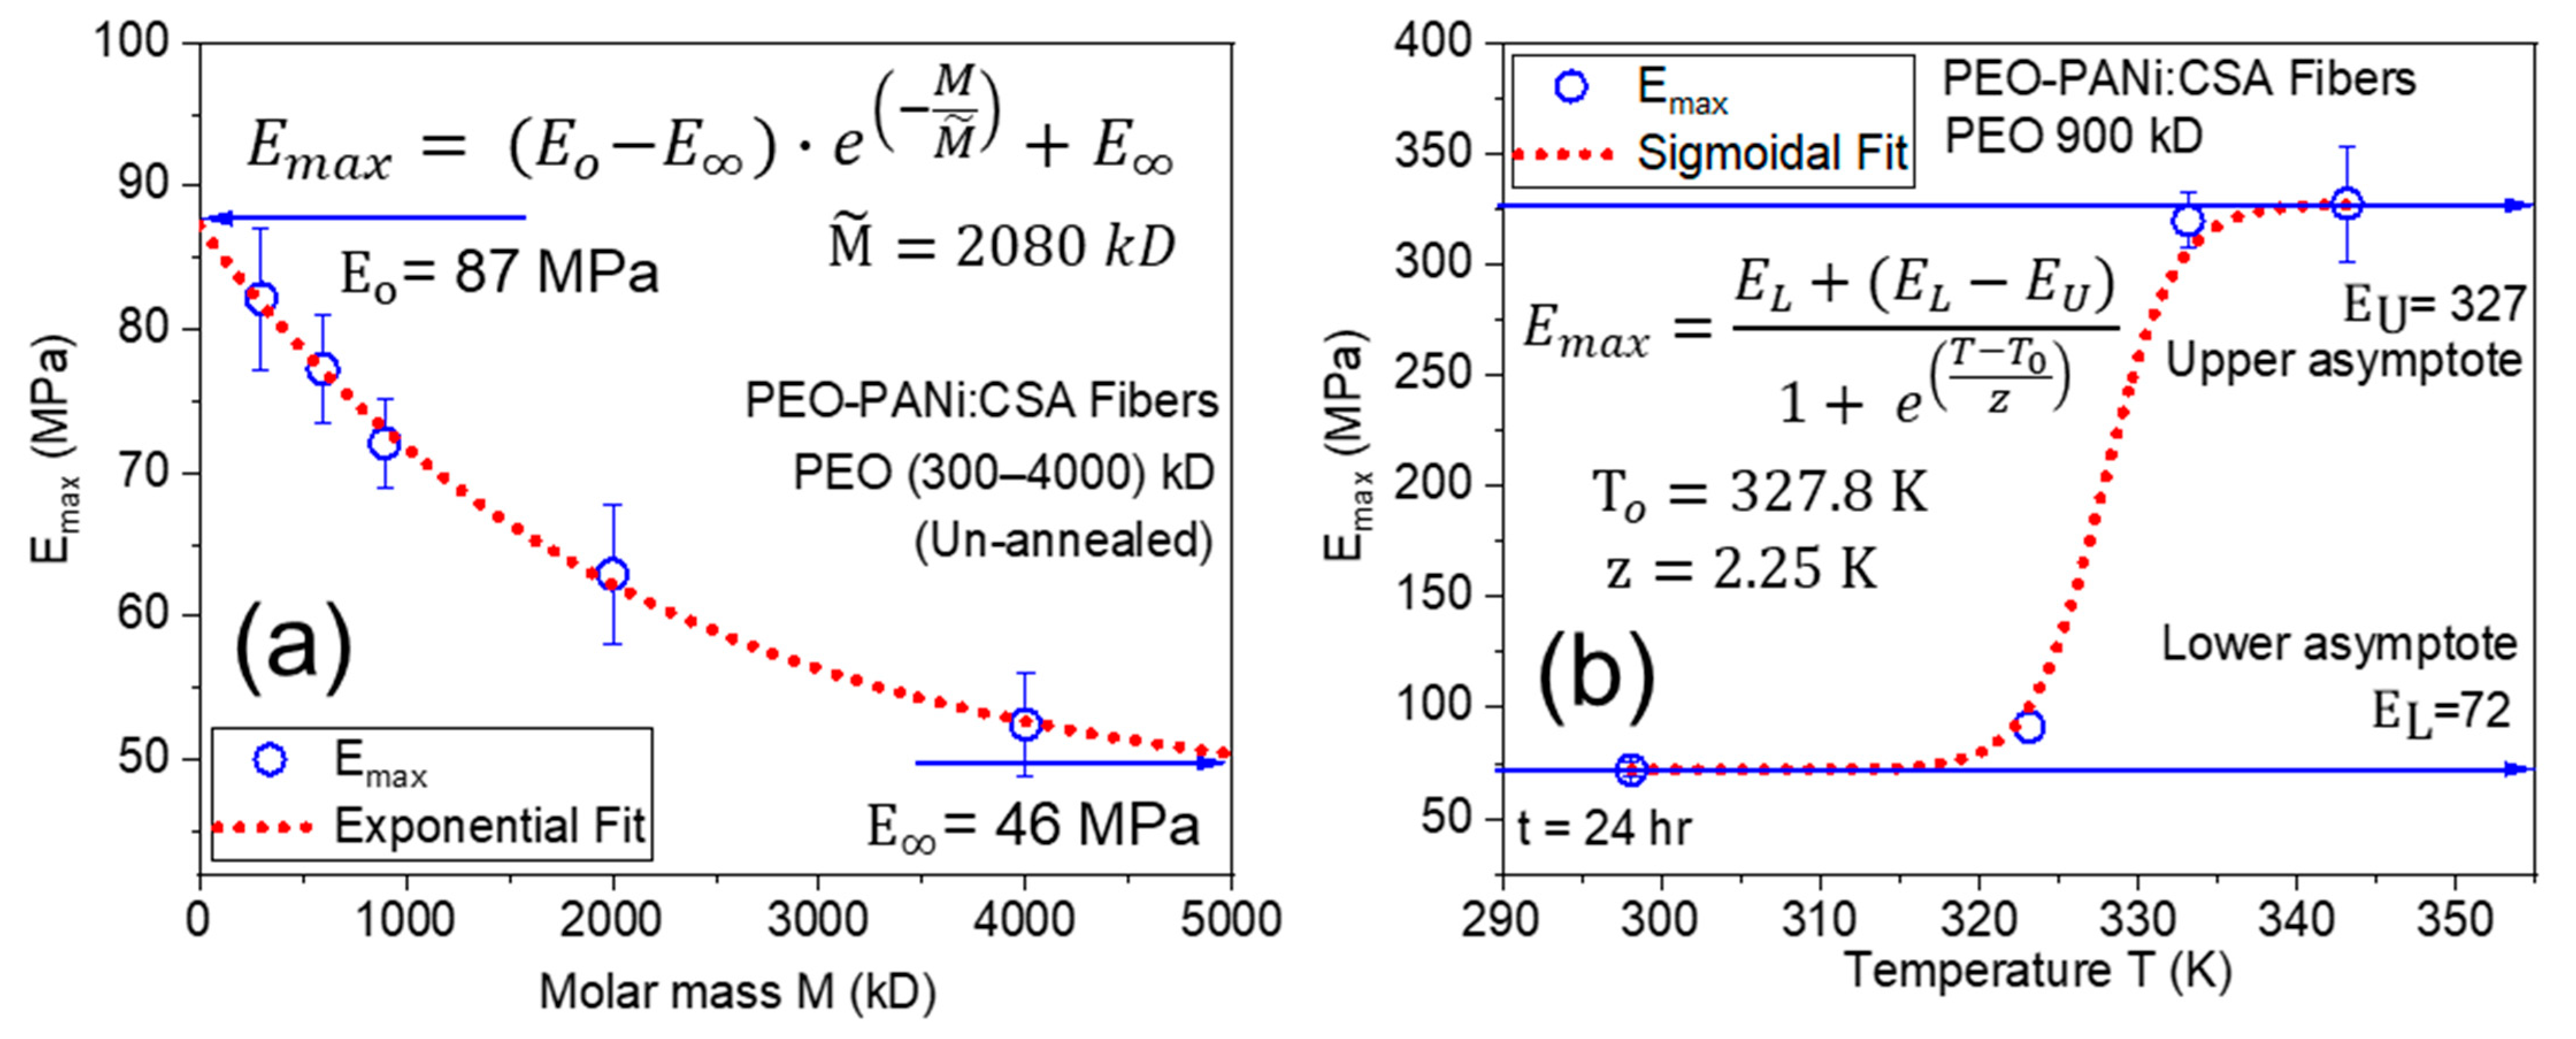
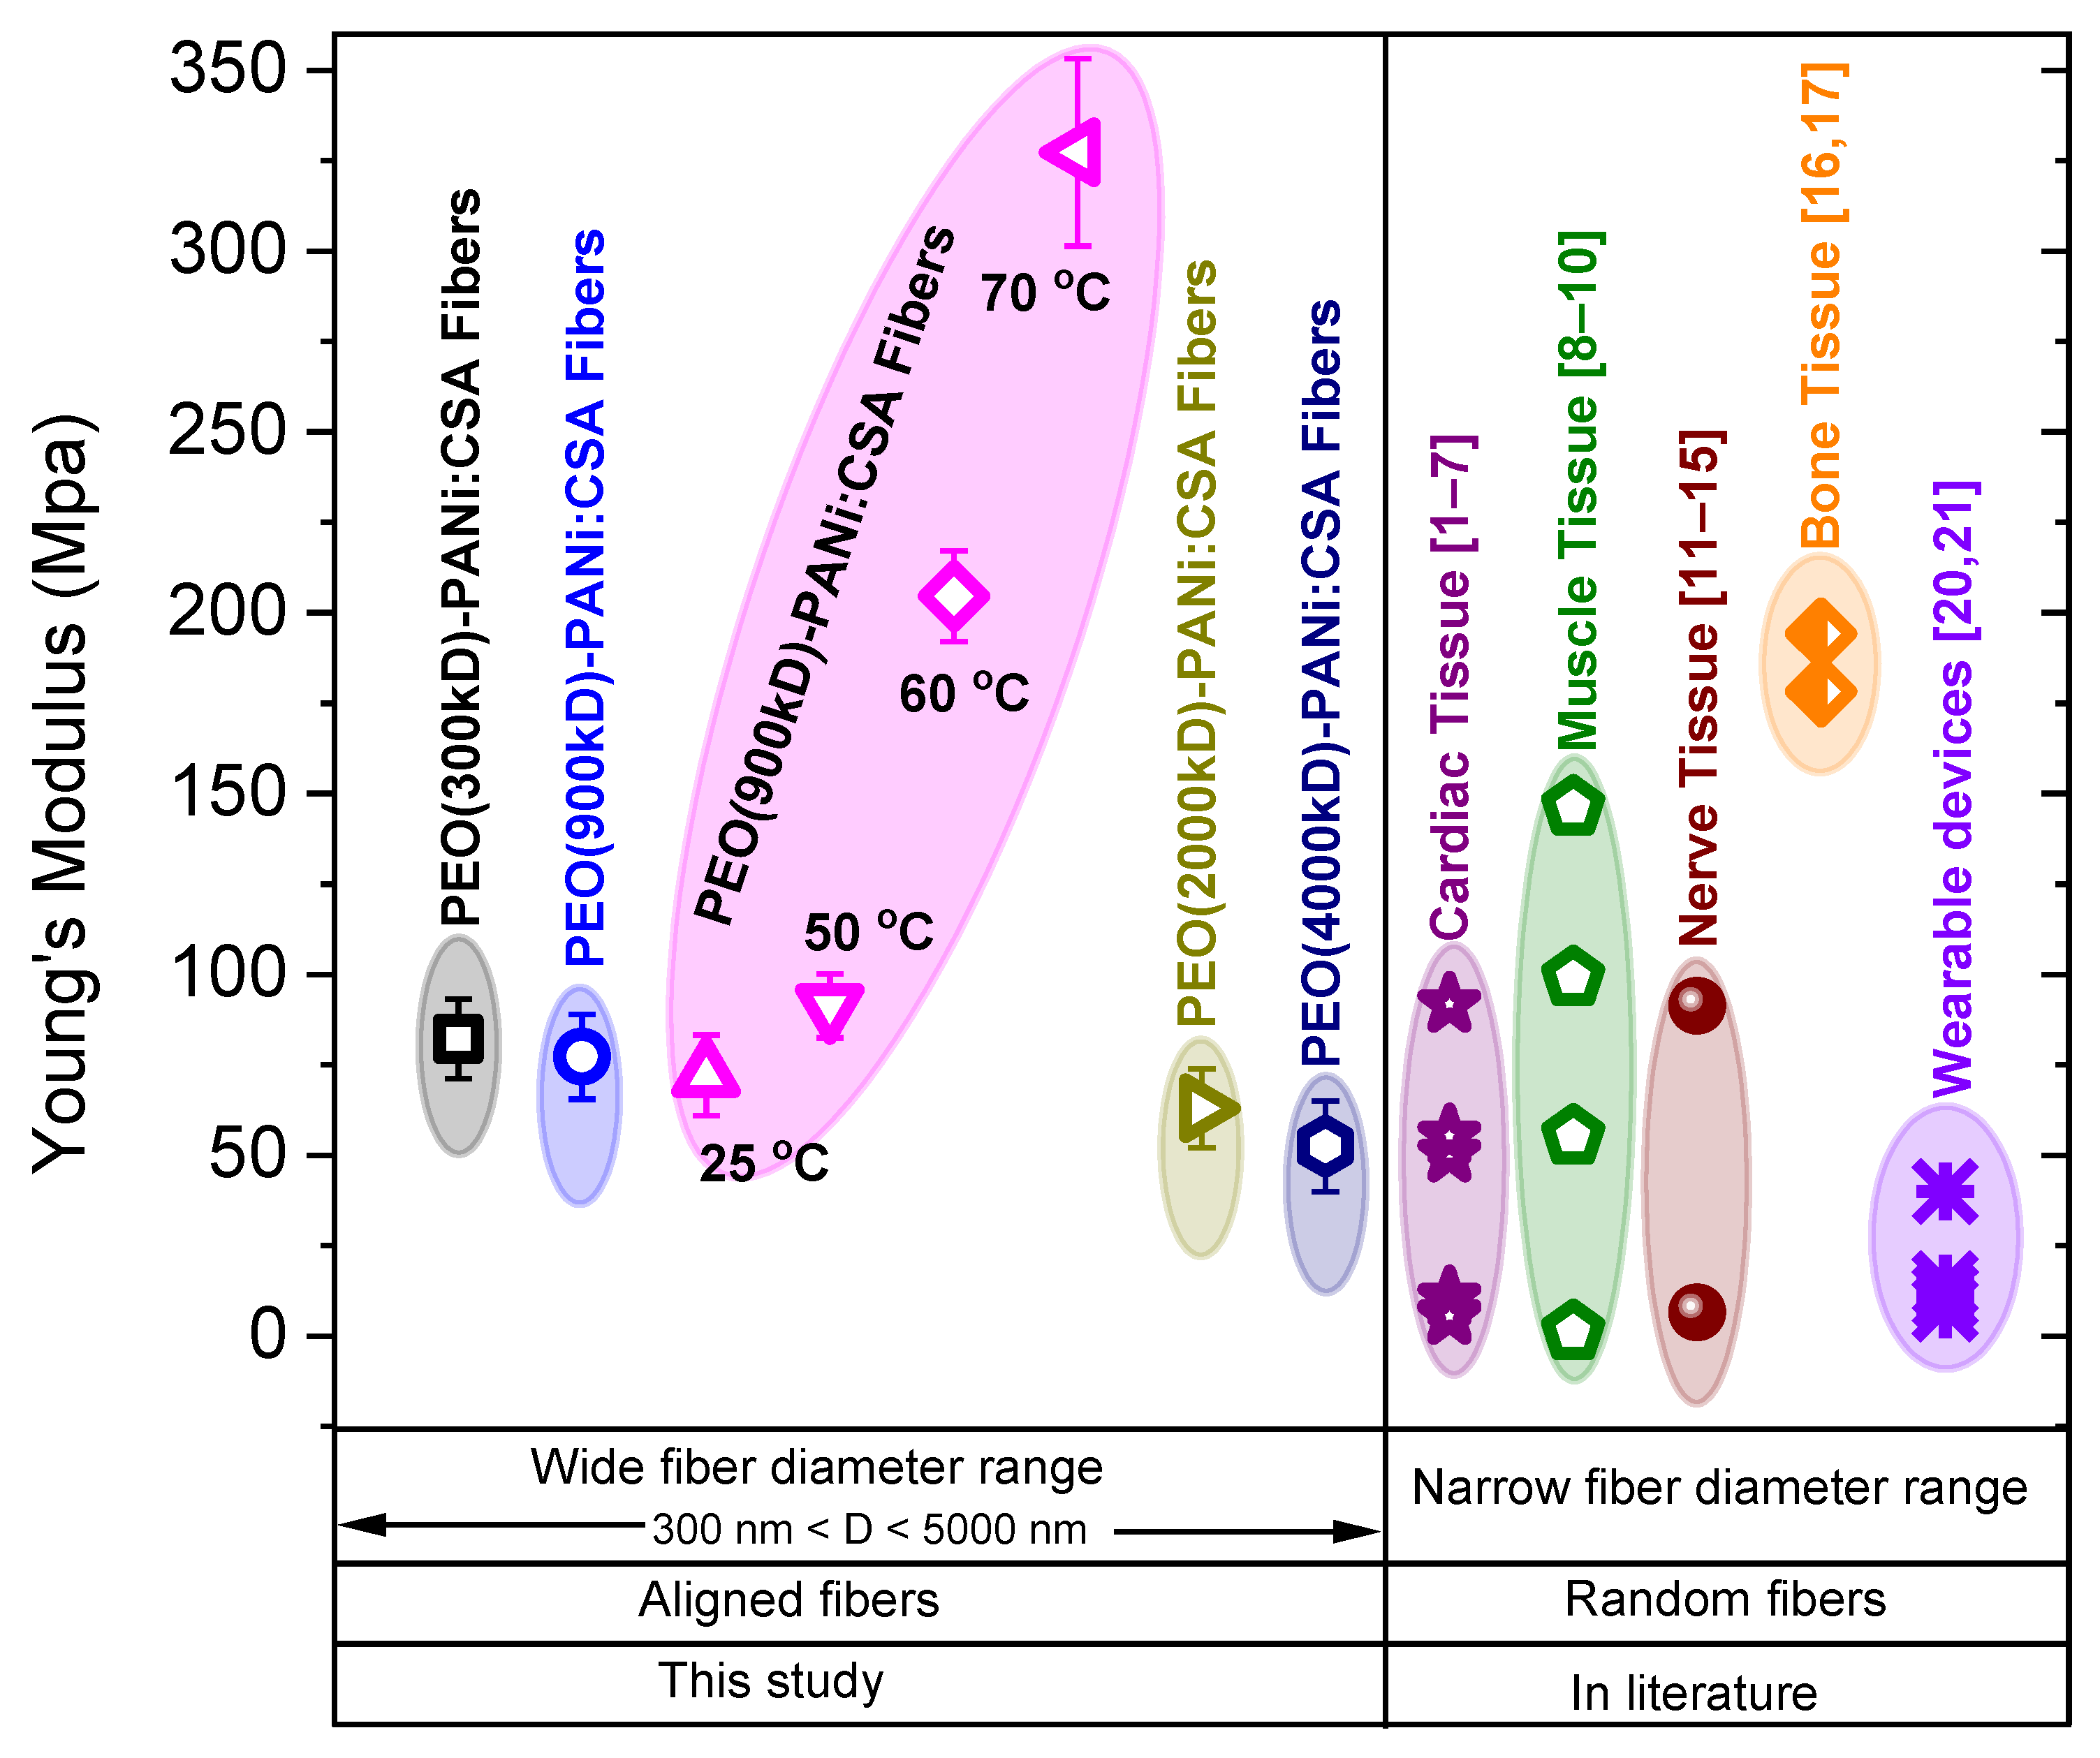
2.3. Identifying the Young’s Modulus

Figure 7a–e show the force-strain curves for PEO-PANi:CSA fibers using 300 kD–4000 kD molar mass of PEO for 0–31 φ% (percent volume fraction) of PANi, respectively. Figure 7f shows the trending curves of Young’s modulus/elasticity (E) for different molar mass of PEO as a function of φ% of PANi. The elasticity E of PEO-PANi:CSA fibers increases to maximum Young’s modulus Emax (as shown within the dotted circles in Figure 7f) and then decreases as a function of φ% of PANi for each molar mass of PEO. The decreases in mechanical strength after the optimal concentration of PANi are expected due to the consequences of phase separation between polymeric matrix PEO and filler PANi particles.
Figure 8a–c show the force-strain curves for PEO (900 kD)-PANi:CSA fibers using 50–70 °C annealing temperature for 0–31 φ% of PANi, respectively. Figure 8d shows the trending curves of E for un-annealed (25 °C) fibers and for 50, 60, and 70 °C annealing temperatures as a function of φ% of PANi, respectively. On annealing, E also increases to Emax (as shown within the dotted circles in Figure 8d), then decreases as a function of φ% of PANi for each annealing temperature. The annealing after optimal concentration of filler particles is also responsible for the initiation of crack growth behavior, which leads to lower mechanical strength of conductive fibers.

Factors Affecting Young’s Modulus

The mechanical properties of fibers (especially elasticity) are influenced by many factors, but filler concentration, molar mass, and post annealing are the most significant in the present study. The Young’s modulus E of PEO-PANi:CSA fibers increases to an optimal concentration of filler PANi (as shown in Figure 7f for each curve with its molar mass) because the interactions of polymeric molecules (PEO matrix) with the surface of the filler particles lead to restricted mobility of the attached molecules resulting in an increase in elasticity due to longer retardation times.
The elasticity of conductive electrospun fibers (PEO-PANi:CSA fibers) is also strongly affected by its molar mass of host polymer/matrix (PEO). The trending curves of PEO-PANi:CSA fibers (Figure 7f) show that the fibers with the lower molar masses have higher E values than higher molar masses of PEO. The reason is that the lower molar mass produces thinner fibers, which are more stretchable and oriented in the electrospinning process due to the lower viscosity. Thus stretching causes high chain orientation along the fiber direction [63,64], which is responsible for higher linear elastic regime (stiffness) in force-strain curves, which is directly dependent on E.
The post-annealing process may cause some liberation of residual solvents and reaction between fillers, dopants, and polymer matrices, which could liberate molecules (water/solvent) as by-products (as shown schematically in Figure 5f). The loss of solvent reduces the weight of fibers, which are directly dependent on Young’s modulus. Moreover, the residual solvents act as a plasticizer, which is responsible for low stiffness of un-annealed nanofibers. The removal of plasticizers (solvents) during annealing also increases the degree of crystallinity, which ultimately leads to higher elasticity in conductive fibers [51]. However, Figure 8d shows that Young’s modulus E of PEO-PANi:CSA fibers increases as long as the annealing temperature does not deteriorate the polymer.
The behavior of maximum Young’s modulus Emax with molar mass M and annealing temperature T are shown in Figure 9a,b, respectively. Figure 9a shows that Emax has a negative exponential correlation with molar mass M of matrix PEO for PEO-PANi:CSA fibers. Emax tends to Eo = 87 MPa for M 0 and E = 46 MPa for M  ∞, respectively. Figure 9b shows the correlation between Emax and temperature T. Emax demonstrates nearly sigmoidal behavior, which ends in a plateau as long as the annealing temperature does not deteriorate the polymer. Moreover, the removal of molecules may lead to some physical/chemical bonding among fillers and matrices for improving the conductivity and dimensional stability.

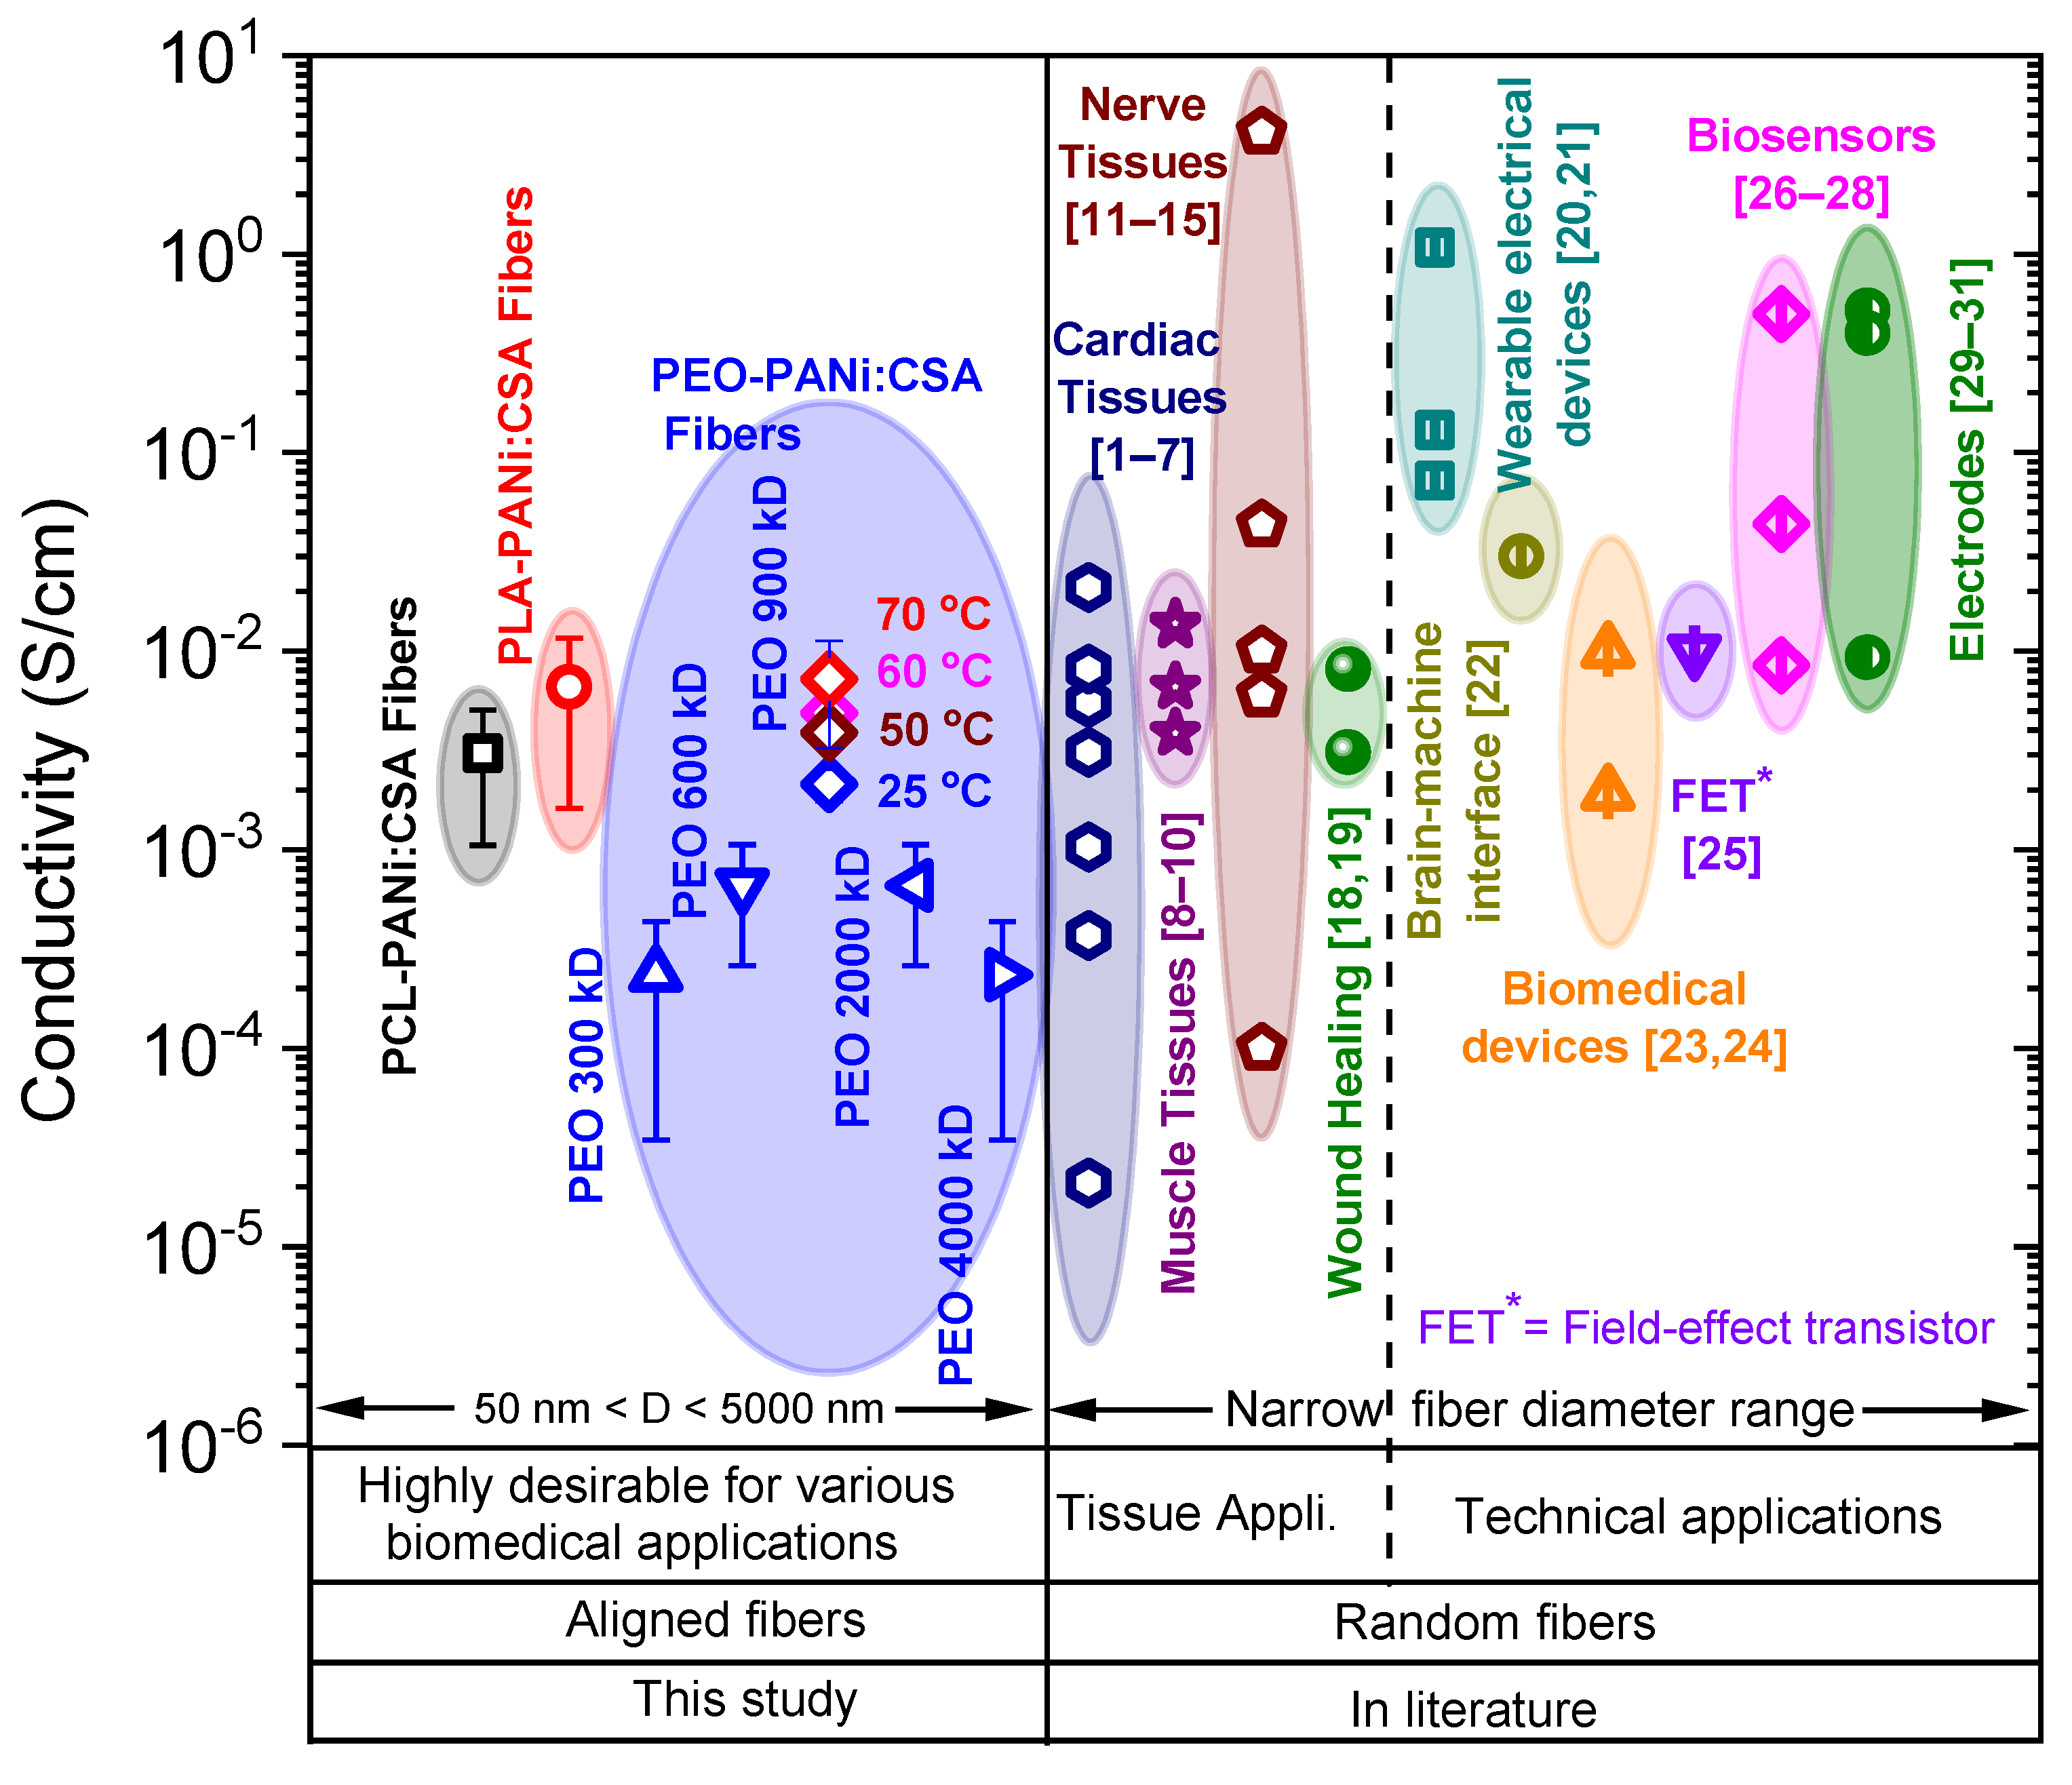
2.4. Comparative Study for Applications

The comparative studies are shown in Figure 10 and Figure 11, comparing the conductivities and Young’s moduli (elasticity) of our fabricated ECFCs with other conductive fibers that have been reported on in the literature for various biomedical applications, such as cardiac, nerve, muscle tissues, wound healing, etc., and technical applications, such as biosensors, biomedical devices, electrodes, field-effect transistor, brain-machine interface, and wearable electrical devices. It is significant that the electrical conductivity and mechanical strength (Young’s modulus/stiffness) of our fabricated ECFCs are suitable for a wide range of biomedical and technical applications. Note that our fibers are highly oriented (aligned), while other fibers described in the literature are randomly oriented. Moreover, the fiber-diameter range is a basic requirement for the appropriate usage of fibers in various applications. Our fabricated conductive fibers have a widely variable fiber-diameter (D) range from a few tens of nanometers to several micrometers (50 < D < 5000 nm). The combination of high orientation, tunable diameter, tunable conductivity, tunable elasticity, and biodegradability makes our nanofibers superior to the fibers described to date and highly desirable for various biomedical and technical applications.

3. Materials and Methods

3.1. Materials

PEO and PCL purchased from Merck (Sigma-Aldrich, Baden-Württemberg, Germany) and PLA containing 2% D-lactic acid and 98% L-lactic acid (Nature Works, Minnetonka, MN, USA) were used. The order of molar mass for PEO, PCL, and PLA is PEO > PCL > PLA (values are provided under Table 1) and these high molar mass biopolymers were used as polymer matrix. The electrical conductivity of pure PEO, PCL, and PLA fibers was measured and used as conductivity of pure polymer matrix (σm) in this study (values are shown in Table 1). The ICPs, such as polyaniline emeraldine base (PANi-EB) doped with (+)-Camphor-10-sulfonic acid (CSA), abbreviated to (PANi:CSA), was used as filler and purchased from Merck (Sigma-Aldrich). PANi was doped with CSA in equal weight ratio (PANi:CSA = 1:1), and the electrical conductivity of doped PANi filler is equal to σf, and its value is stated in Table 1. The solvents ethanol (Et-OH) denatured ≥ 99.8, N,N-dimethyl formamide (DMF) ≥ 99.8, and chloroform (CF) were purchased from Merck (Sigma-Aldrich) Germany. The characteristic properties of the used materials, such as weight average molar mass (Mw), values of melting point (mp), boiling point (bp), density (ρ), and conductivity (σ), are shown in Table 1.

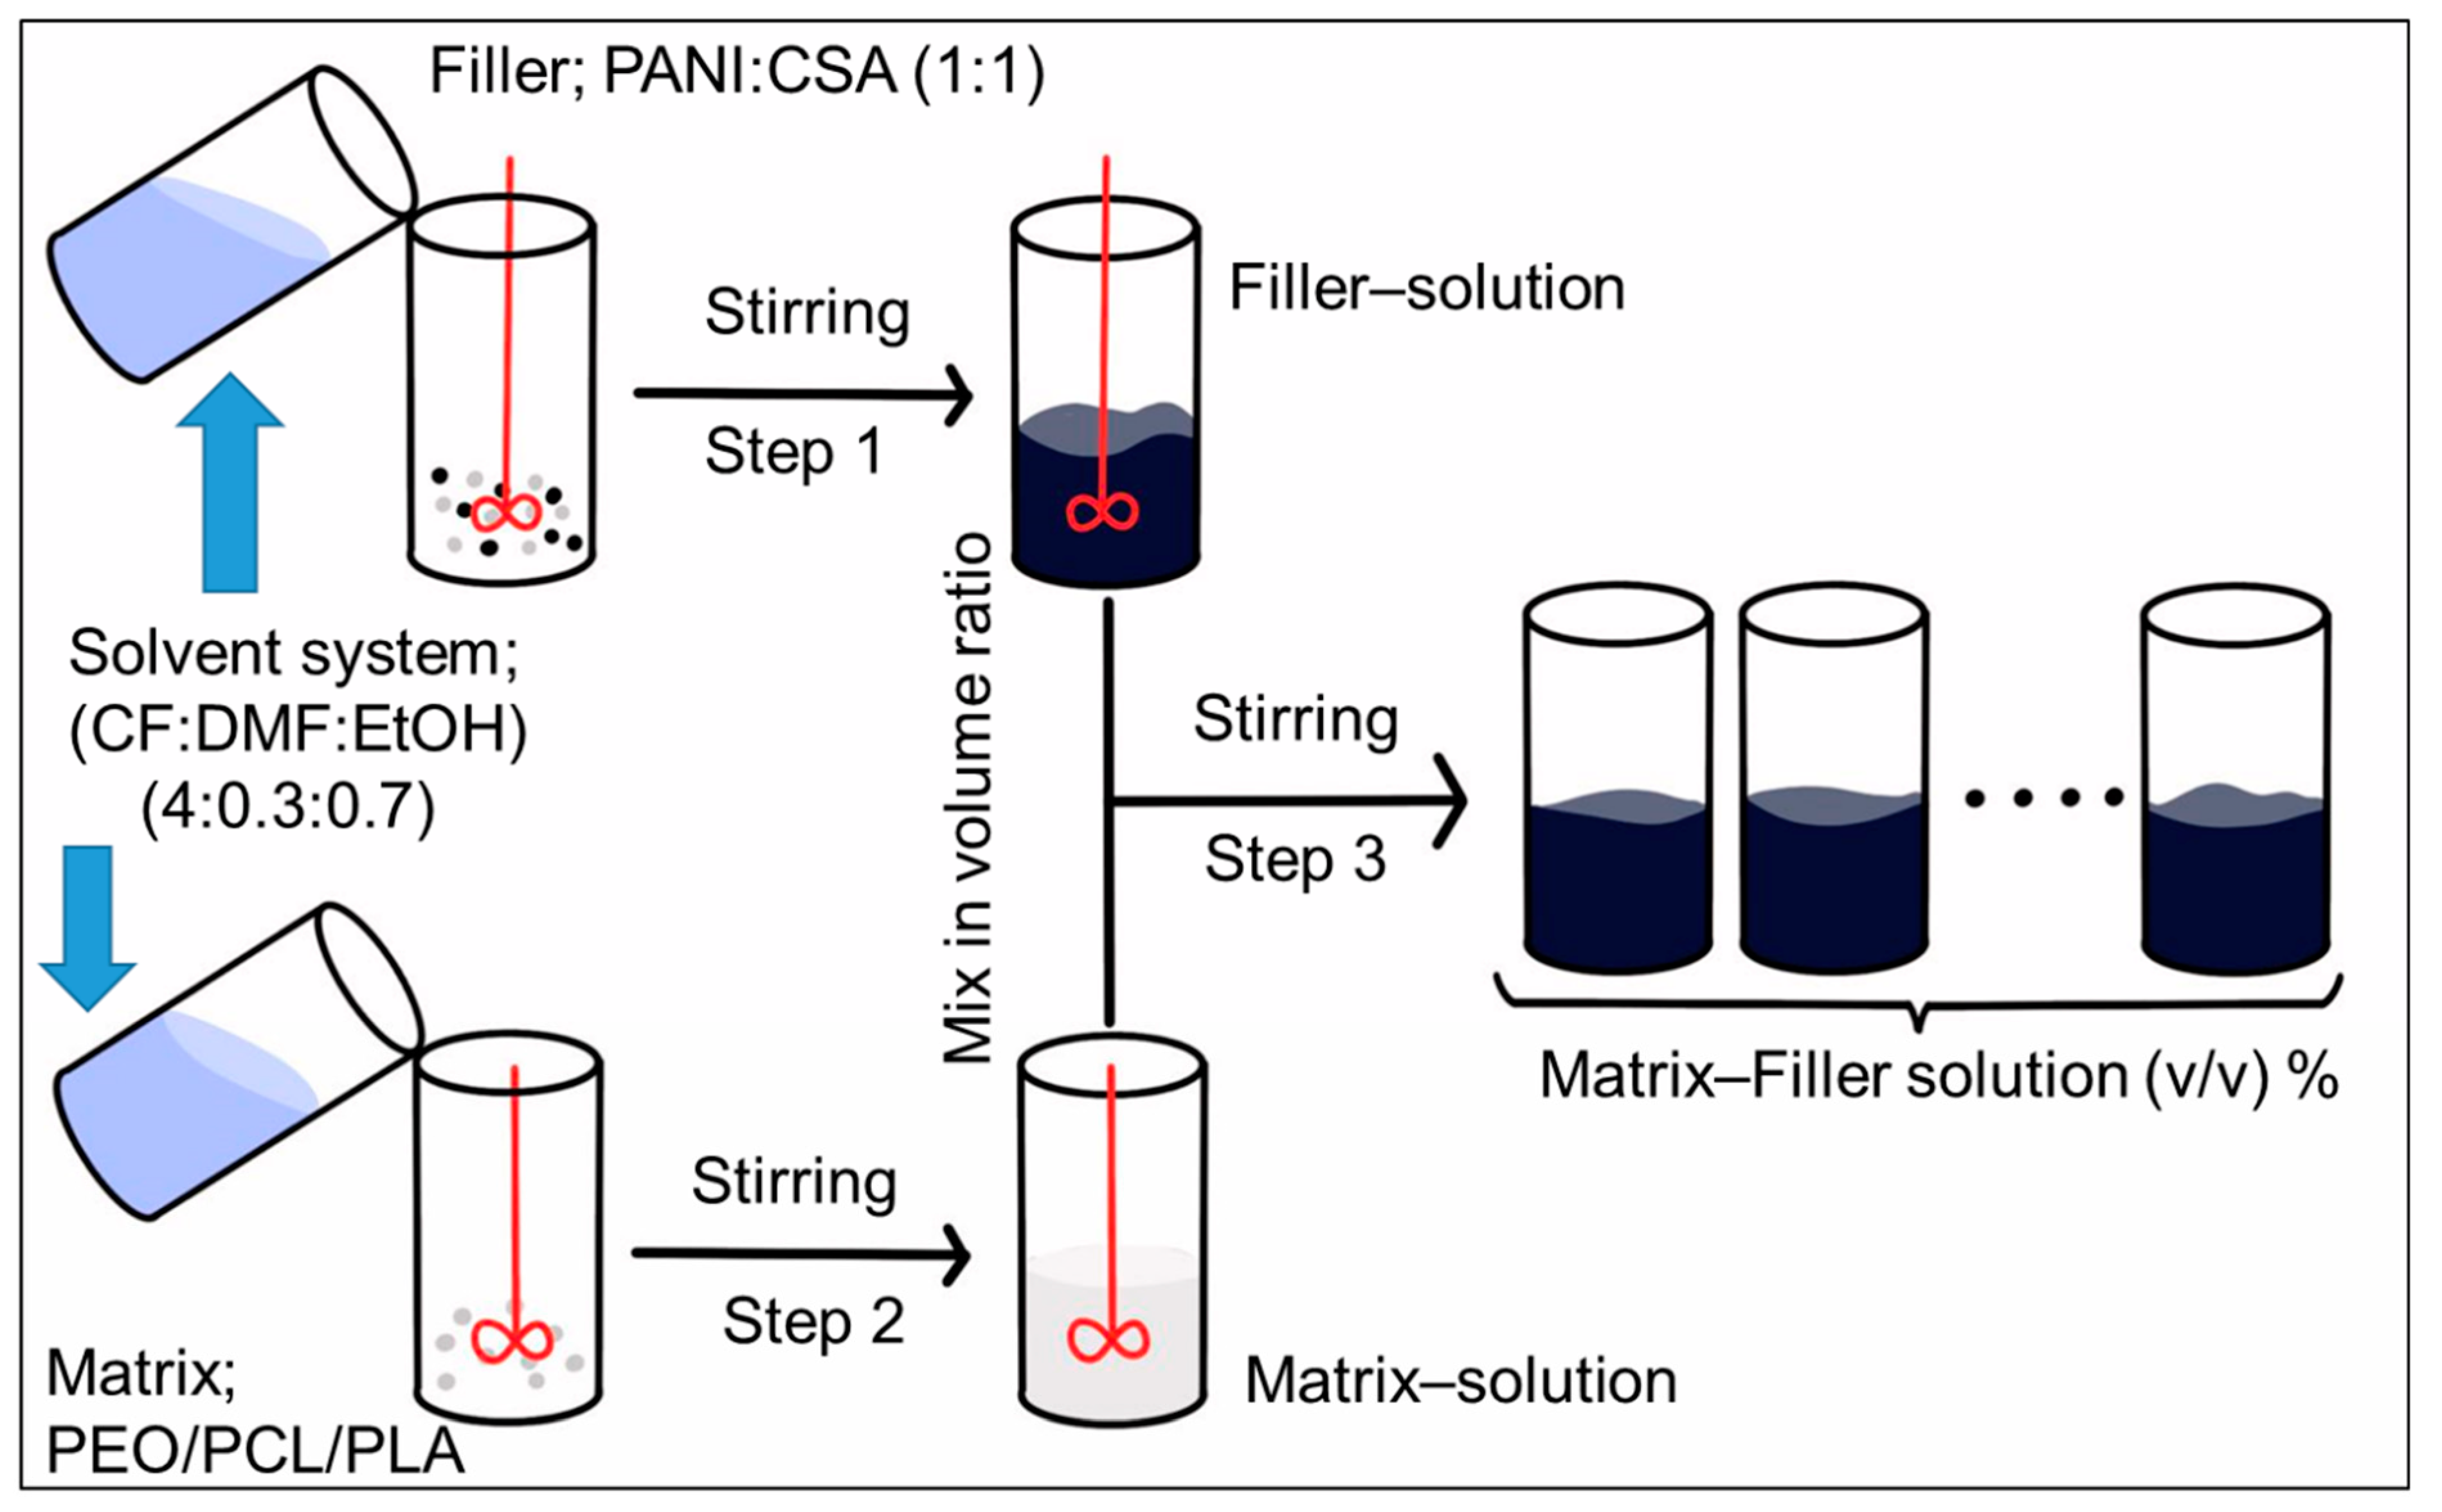
3.2. Preparation of Spinning Solutions

A schematic for the procedure for preparation of spinning solutions is shown in Figure 12. The polymeric matrix solution and filler solution/dispersion with their respective solvent systems were prepared separately in weight/weight percentage (w/w %) via step 1 and step 2, respectively. The independently prepared matrix solution and filler solution were mixed in different volume ratios (step 3). The procedure for conversion of (w/w %) to v/v % (volume/volume percentage) and derivation of equations for calculating the volume fraction of filler (φ) and density (ρc) of dried electrospun conductive fiber composites (ECFCs) are explained in detail under Supplementary materials in Section S1.

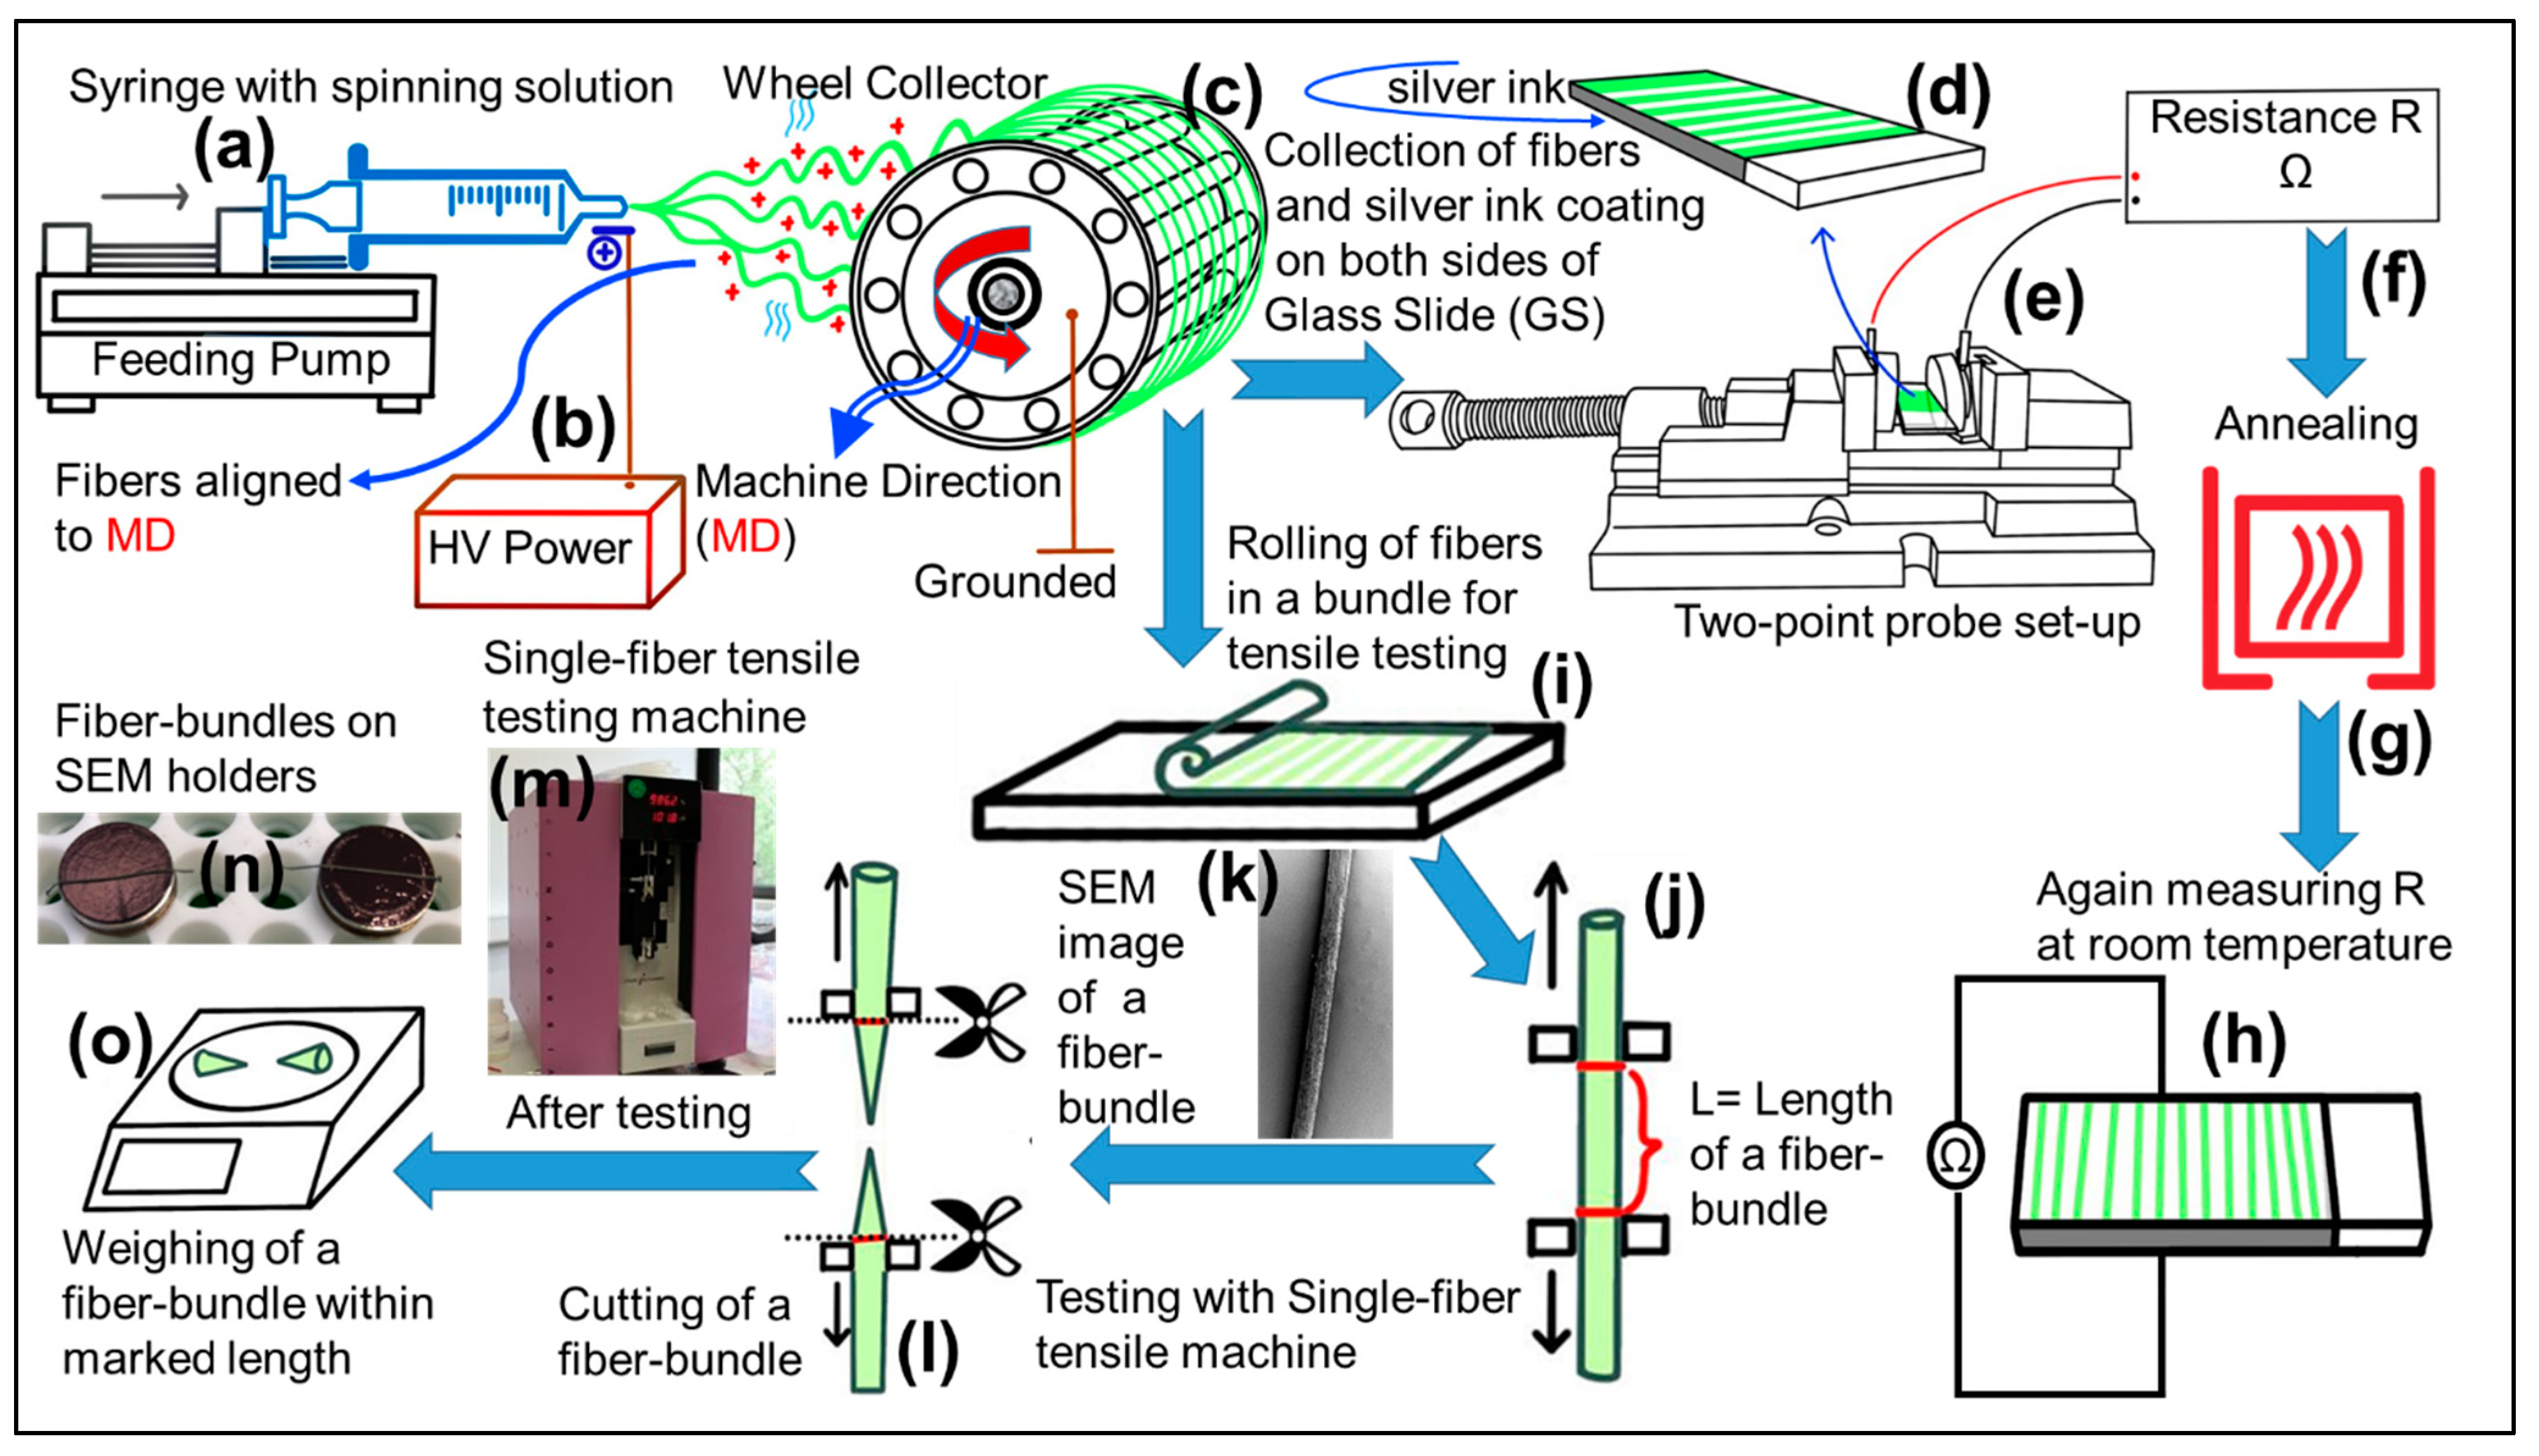
3.3. Electrospinning Set-Up

The electrospinning set-up (schematic shown in Figure 13) consisted of three main parts: a syringe with feeding pump delivering the spinning solution, a high-voltage (HV) power supply (0–60 kV), and a rotating collector for the fibers, which was purpose-built at the University of Erlangen–Nuremberg. A 3D model and its geometrical diagram of the rotating collector are shown in Supplementary materials in Section S3, respectively. The rotating collector consists of two circular terminal plates equipped with circular notches. The notches enable mounting of equally spaced horizontal bars. The bars are held in place by screws. In this study, sixteen bars were used. The spacing between two adjacent bars is 25 mm. The rotating collector has a diameter of 21.2 cm. It can be used up to a speed of 1000 rpm, which corresponds to a tangential velocity of approximately 11 m/s. The matrix filler solutions were poured into 10-mL glass syringe with a blunt 20-gauge stainless steel nozzles with an inner diameter of approximately 0.61 mm and flat tip. The high-voltage power supply (60 kV, DC Linari Engineering S.r.l., and Valpiana, Italy) was used to produce a direct current with the positive polarity on the metallic nozzle, while the collector was grounded. A feeding pump (Linari Engineering S.r.l., and Valpiana, Italy) was used to provide a constant flow rate of the spinning solution. The processing parameters were varied from case to case, and their ranges are: voltage (5–40 kV), flow rate (0.1–4 mL/h), tip-collector distance (5–25 cm), and collector rotation (10–700 rpm). At the optimized processing parameters, the viscoelastic spinning solution was ejected from the spinneret and stretched in the form of a charged jet towards the grounded collector. During the jet’s flight, stretching occurred due to electrical forces, while viscous forces counteracted as discussed in [53] theoretically and in [54] experimentally. The displacement of jets from spinneret to collector and the evaporation (almost complete) of solvent led to solid electrospun conductive fiber composites (ECFCs) on the rotating wheel electrode. These solid ECFCs were collected and transferred onto a glass slide (GS) for further study. A detailed electrospinning theory can be found in the works of Schubert [53,54]

3.4. Electrical Conductivity Measurement

An equation was derived to calculate the conductivity (σ) of ECFCs. The highly aligned fibers were collected on microscopic glass slides (GS) for the measurement of resistance R using an ohmmeter (Keithley 2400). Two opposite sides of GS were coated with silver-ink paste to ensure contact with the electrodes. Complete drying of the paste formed a solid coating layer, as shown in schematic Figure 13.
First, consider a single fiber of length L and radius r, which has cross-sectional area Ae = πr2 (as shown in schematic Figure 14). The fiber has uniform radius along its whole length.
At constant temperature, the resistance of a single fiber Re were calculated using Equation (3):
R e = μ e ·   L π r 2
where μe is resistivity of a single fiber. For n fibers on GS R were calculated using Equation (4):
R = μ ·   L n π r 2
where R and μ are total resistance and resistivity of n fibers, respectively.
As the volume of n cylindrical fibers on GS (V = nπr2L) were calculated using Equation (5):
n π r 2 L = W c ρ c
where Wc and ρc are the final weight and density of dried ECFCs.
Combining and re-arranging Equations (4) and (5) were represented in Equation (6):
R = μ ·   L 2 ·   ρ c W c
Since conductivity σ is the reciprocal of the resistivity μ were calculated using Equation (7):
σ = 1 μ =   L 2 ·   ρ c R   · W c
Using Equation (7), the electrical conductivity σ of ECFCs can be calculated using the value of R, which is measured using a two-point probe method for a constant voltage (1 V) at room temperature, Wc measured before applying the silver-ink paste, L as length of ECFCs (equal to the length of a single fiber), and ρc (density of dried ECFCs) calculated from Equation (S14), which is derived and stated under Supplementary materials in Section S1.

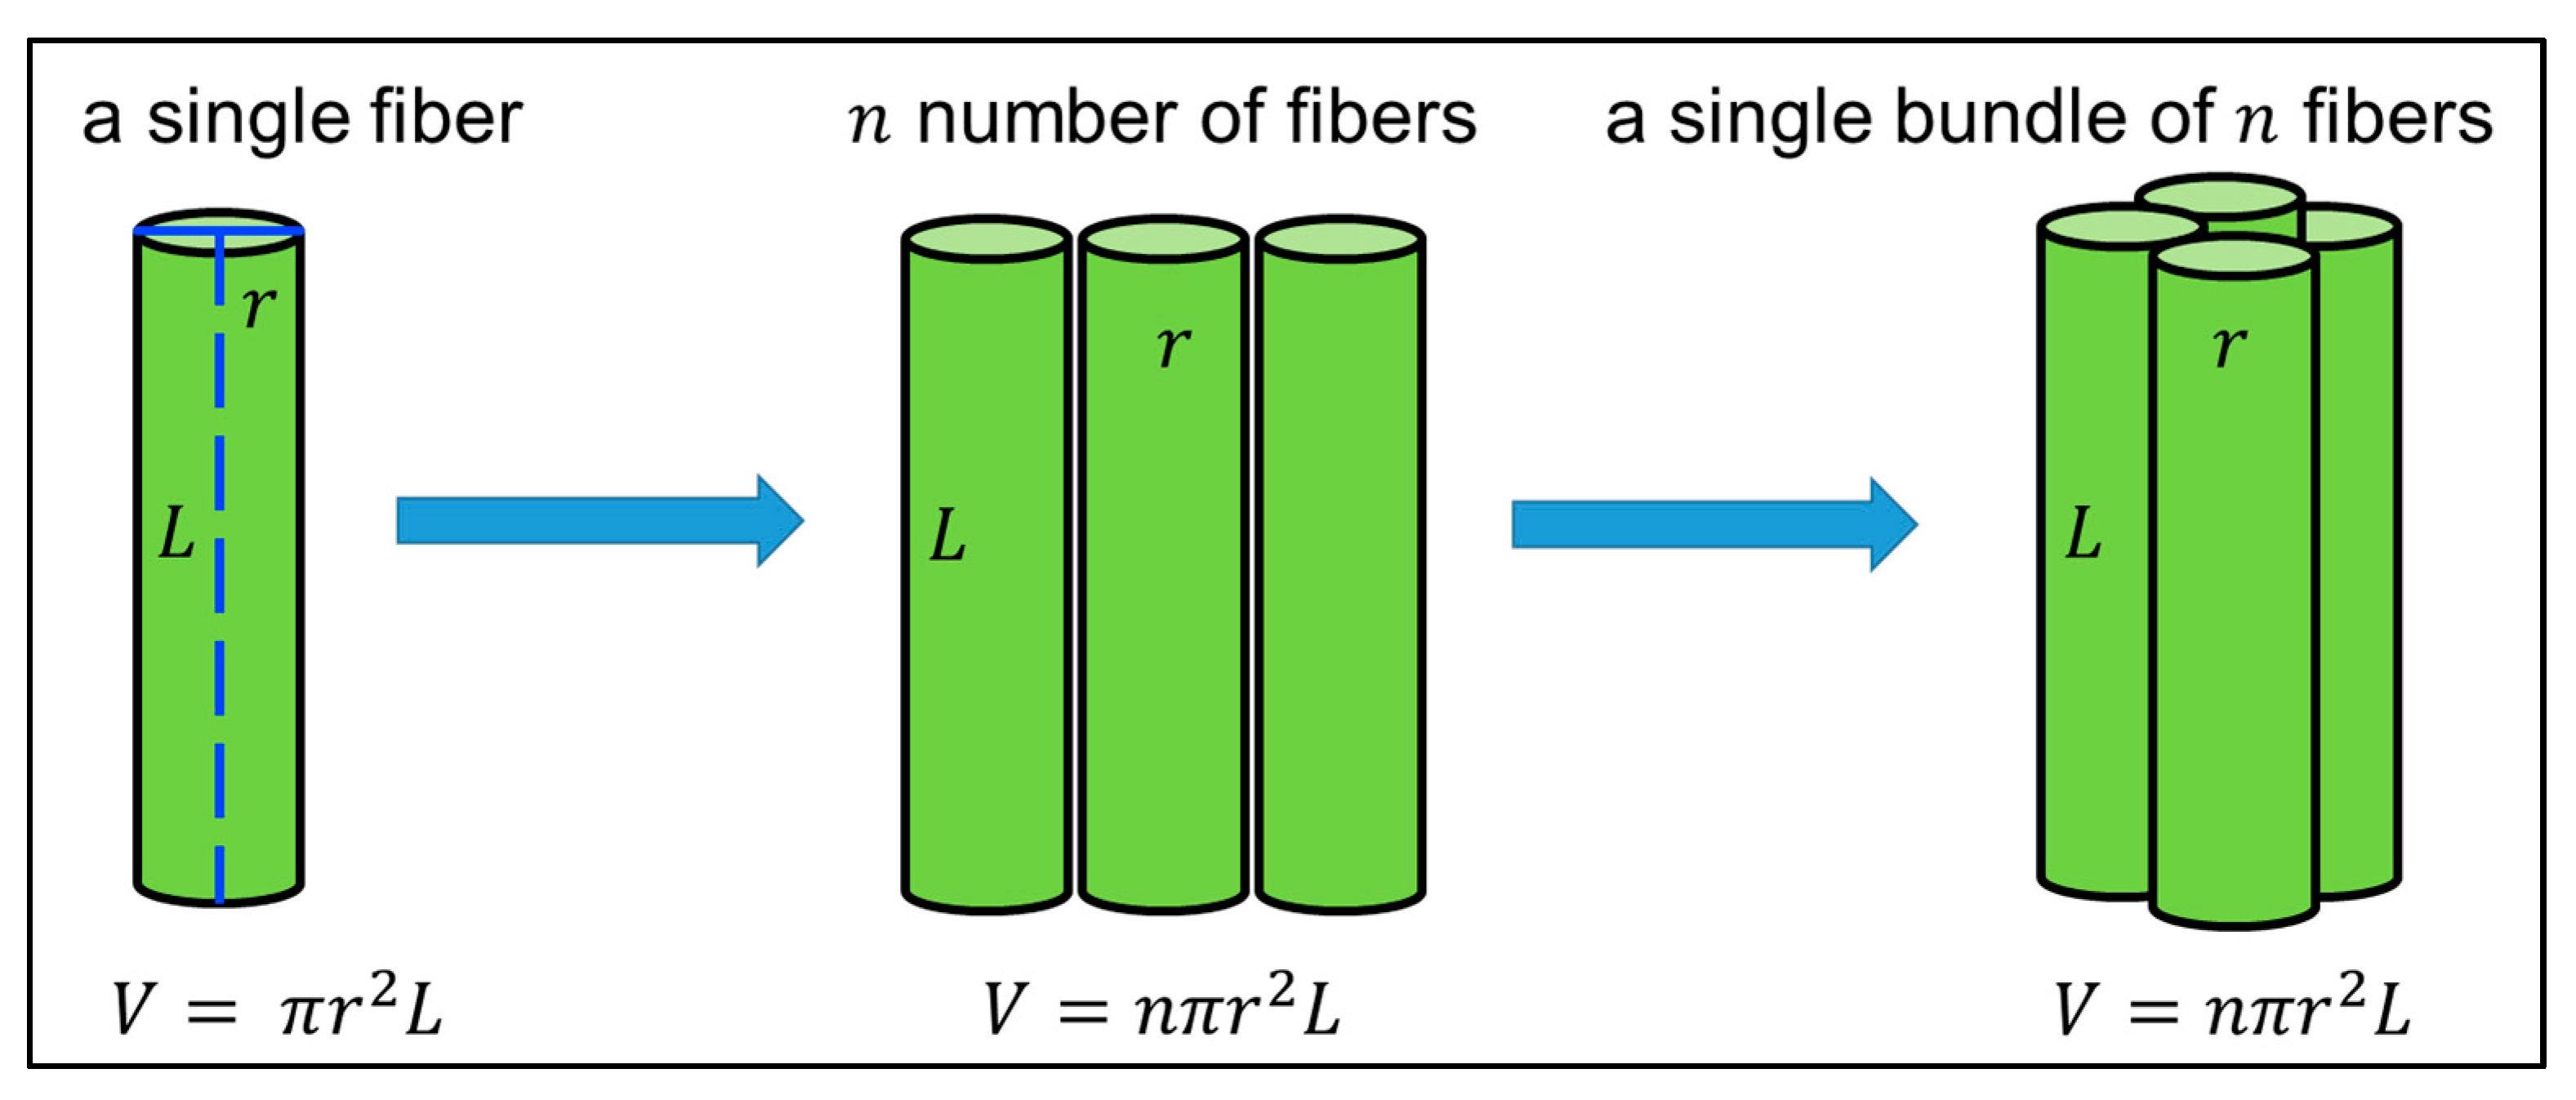
3.5. Mechanical Strength Measurement

The single-fiber tensile test was performed to determine the mechanical properties of ECFCs. The schematic of the mechanical testing process and photo of the single-fiber tensile testing machine (Vibrodyn 400, Lenzing instruments GmbH & Co. KG, Gampern, Austria) are shown in Figure 13. Under the conditions of 200-mg load and 10-mm clamping length within the VPN program, the fiber bundle was stretched at a speed of 10 mm/min until it broke, providing its force-strain curve. Three replicates were carried out for each kind of fiber. Before the tensile testing, the tensile positions were marked on each fiber bundle. After testing, the fiber bundle was cut off along the marks. The weight of each fiber bundle (within marked length) was measured.
An equation was derived to calculate the elastic Young’s modulus (E) of ECFCs. The highly aligned fibers were collected on the glass slide (GS) and rolled to a bundle of fibers (as shown in schematic Figure 14). The SEM images of a fiber bundle with different magnifications have stated under Supplementary materials in Section S4.
Considering a bundle of n fibers with length L and radius r, which has cross-sectional area A = nπr2:
Under optimal conditions, the Young’s modulus of a fiber (E) were calculated as Equations (8)–(10):
E = σ ε
σ = F A
ε = Δ L L
where σ, ε, F, A, ΔL, and L are stress, strain, force, cross-sectional area, change in length, and length of sample, respectively.
As volume of a bundle of fibers (V = nπr2L) were calculated as Equation (11) and (12):
V = W c ρ c
V = A · L
where Wc and ρc are the final weight (within red marks) and density (as calculated using Equation (S14)) of bundle fiber, respectively.
Combining and re-arranging Equations (8)–(12), were shown as Equation (13) and (14):
E = F · L Δ L · ρ c · L W c
E = k · ρ c · L W c where   k = F · L Δ L
where k is the slope of the force-strain curve in the linear elastic region.
The Young’s modulus (E) of a bundle of fibers can be determined using Equation (14).

4. Conclusions

Highly oriented electrospun conductive fibers with tunable diameter are successfully fabricated using a special rotating collector electrode and allow an accurate determination of electrical conductivity and Young’s modulus (E). The fiber diameter is tunable with altering filler-matrix interactions and molar mass of host polymer.
The electrical percolation threshold (φc) is determined by fitting the McLachlan GEM equation to the experimental conductivities of conductive electrospun nanofibers. Higher molar mass produces thicker fiber diameter, and thicker fibers require higher φc to develop continuous pathways for charge transport. The high specific surface area of electrospun fibers and high affinity of polyaniline (PANi) for water molecules cause the high inter-grain connectivity and electrical mobility for lowering φc in stored conductive fibers. During the annealing process, the molecular chains of host polymers become mobile, and PANi particles acquire a certain degree of freedom to reorganize themselves into additional conductive channels for lowering φc in conductive fibers.
The mechanical properties of fibers are influenced by filler volume fraction (φ), molar mass, and post-annealing process. The Young’s modulus E increases to its maximum (Emax) and then decreases as a function of filler fraction. The elasticity of conductive electrospun fibers is strongly affected by molar mass of host polymer: the lower the molar mass, higher the elasticity. The lower molar mass produces thinner fibers, which are more stretchable and oriented in the electrospinning process due to the lower viscosity. Thus stretching causes high chain orientation along the fiber direction, which is responsible for higher elasticity. The removal of plasticizers (solvents) during the annealing process increases the degree of crystallinity, which ultimately leads to higher elasticity in conductive fibers. The maximum Young’s modulus Emax exhibits a negative exponential correlation with molar mass of host polymer. The correlation between Emax and temperature shows sigmoidal behavior, which ends in a plateau as long as the annealing temperature does not deteriorate the polymer.
A trade-off is formed between conductivity and mechanical strength because, on increasing the amount of conductive filler, at first both conductivity and elasticity increase, but the elasticity decreases after optimal filler fraction. Moreover, the fiber diameter, conductivity, and mechanical strength of our fabricated conductive fibers are suitable for a wide range of biomedical and technical applications. The utilization of conductive fibers as nano/micro-carriers in batch and continuous bioprocessing will be evaluated.

Supplementary Materials

The following are available online at https://www.mdpi.com/article/10.3390/ijms221910295/s1: Section S1, Development of procedure and derivation of equations for calculating volume fraction of filler (φ) and density (ρc) of solid electrospun conductive fiber composites (ECFCs); Section S2, Annealing process for conductive fibers; Section S3, 3D-model of rotating wheel collector electrode; Section S4, SEM images of a fiber bundle.

Author Contributions

Supervision, D.W.S.; writing—original draft, M.A.M. All authors have read and agreed to the published version of the manuscript.

Funding

This research was funded by Deutsche Forschungsgemeinschaft (DFG, German Research Foundation)-project number 326998133-TRR 225 (subproject A07).

Conflicts of Interest

The authors declare no competing financial interest.

References

  1. Li, M.; Guo, Y.; Wei, Y.; MacDiarmid, A.G.; Lelkes, P.I. Electrospinning polyaniline-contained gelatin nanofibers for tissue engineering applications. Biomaterials 2006, 27, 2705–2715. [Google Scholar] [CrossRef]
  2. Kai, D.; Prabhakaran, M.P.; Jin, G.; Ramakrishna, S. Polypyrrole-contained electrospun conductive nanofibrous membranes for cardiac tissue engineering. J. Biomed. Mater. Res. Part. A 2011, 99A, 376–385. [Google Scholar] [CrossRef]
  3. Hsiao, C.-W.; Bai, M.-Y.; Chang, Y.; Chung, M.-F.; Lee, T.-Y.; Wu, C.-T.; Maiti, B.; Liao, Z.-X.; Li, R.-K.; Sung, H.-W. Electrical coupling of isolated cardiomyocyte clusters grown on aligned conductive nanofibrous meshes for their synchronized beating. Biomaterials 2013, 34, 1063–1072. [Google Scholar] [CrossRef] [Green Version]
  4. Qazi, T.H.; Rai, R.; Dippold, D.; Roether, J.E.; Schubert, D.W.; Rosellini, E.; Barbani, N.; Boccaccini, A.R. Development and characterization of novel electrically conductive PANI–PGS composites for cardiac tissue engineering applications. Acta Biomater. 2014, 10, 2434–2445. [Google Scholar] [CrossRef] [PubMed]
  5. Webster, T.J.; Stout, D.A.; Yoo, J.; Santiago-Miranda, A.N. Mechanisms of greater cardiomyocyte functions on conductive nanoengineered composites for cardiovascular application. Int. J. Nanomed. 2012, 7, 5653–5669. [Google Scholar] [CrossRef] [PubMed] [Green Version]
  6. Wang, L.; Wu, Y.; Hu, T.; Guo, B.; Ma, P.X. Electrospun conductive nanofibrous scaffolds for engineering cardiac tissue and 3D bioactuators. Acta Biomater. 2017, 59, 68–81. [Google Scholar] [CrossRef] [PubMed]
  7. Liu, Y.; Lu, J.; Xu, G.; Wei, J.; Zhang, Z.; Li, X. Tuning the conductivity and inner structure of electrospun fibers to promote cardiomyocyte elongation and synchronous beating. Mater. Sci. Eng. C 2016, 69, 865–874. [Google Scholar] [CrossRef]
  8. Chen, M.-C.; Sun, Y.-C.; Chen, Y.-H. Electrically conductive nanofibers with highly oriented structures and their potential application in skeletal muscle tissue engineering. Acta Biomater. 2013, 9, 5562–5572. [Google Scholar] [CrossRef] [PubMed]
  9. Xu, J.; Xie, Y.; Zhang, H.; Ye, Z.; Zhang, W. Fabrication of PLGA/MWNTs composite electrospun fibrous scaffolds for improved myogenic differentiation of C2C12 cells. Colloids Surf. B Biointerfaces 2014, 123, 907–915. [Google Scholar] [CrossRef]
  10. Hosseinzadeh, S.; Mahmoudifard, M.; Mohamadyar-Toupkanlou, F.; Dodel, M.; Hajarizadeh, A.; Adabi, M.; Soleimani, M. The nanofibrous PAN-PANi scaffold as an efficient substrate for skeletal muscle differentiation using satellite cells. Bioprocess. Biosyst. Eng. 2016, 39, 1163–1172. [Google Scholar] [CrossRef]
  11. Jeong, S.I.; Jun, I.D.; Choi, M.J.; Nho, Y.C.; Lee, Y.M.; Shin, H. development of electroactive and elastic nanofibers that contain Polyaniline and Poly(L-lactide-co-ε-caprolactone) for the Control of Cell Adhesion. Macromol. Biosci. 2008, 8, 627–637. [Google Scholar] [CrossRef]
  12. Sun, X.-D.; Peng, J.; Zhou, J.-F.; Wang, Y.-G.; Cheng, L.; Wu, Z. Preparation of polypyrrole-embedded electrospun poly (lactic acid) nanofibrous scaffolds for nerve tissue engineering. Neural Regen. Res. 2016, 11, 1644–1652. [Google Scholar] [CrossRef]
  13. Zha, F.; Chen, W.; Hao, L.; Wu, C.; Lu, M.; Zhang, L.; Yu, D. Electrospun cellulose-based conductive polymer nanofibrous mats: Composite scaffolds and their influence on cell behavior with electrical stimulation for nerve tissue engineering. Soft Matter 2020, 16, 6591–6598. [Google Scholar] [CrossRef] [PubMed]
  14. Gattazzo, F.; De Maria, C.; Whulanza, Y.; Taverni, G.; Ahluwalia, A.; Vozzi, G. Realisation and characterization of conductive hollow fibers for neuronal tissue engineering. J. Biomed. Mater. Res. Part. B Appl. Biomater. 2014, 103, 1107–1119. [Google Scholar] [CrossRef] [PubMed]
  15. Runge, M.B.; Dadsetan, M.; Baltrusaitis, J.; Knight, A.M.; Ruesink, T.; Lazcano, E.A.; Lu, L.; Windebank, A.J.; Yaszemski, M.J. The development of electrically conductive polycaprolactone fumarate–polypyrrole composite materials for nerve regeneration. Biomaterials 2010, 31, 5916–5926. [Google Scholar] [CrossRef] [PubMed] [Green Version]
  16. Shao, S.; Zhou, S.; Li, L.; Li, J.; Luo, C.; Wang, J.; Li, X.; Weng, J. Osteoblast function on electrically conductive electrospun PLA/MWCNTs nanofibers. Biomaterials 2011, 32, 2821–2833. [Google Scholar] [CrossRef] [PubMed]
  17. Rodrigues, B.V.; Silva, A.S.; Melo, G.F.; Vasconscellos, L.M.; Marciano, F.R.; Lobo, A.O. Influence of low contents of superhydrophilic MWCNT on the properties and cell viability of electrospun poly (butylene adipate-co-terephthalate) fibers. Mater. Sci. Eng. C Mater. Biol. Appl. 2016, 59, 782–791. [Google Scholar] [CrossRef] [PubMed] [Green Version]
  18. Gizdavic-Nikolaidis, M.; Ray, S.; Bennett, J.R.; Easteal, A.J.; Cooney, R.P. Electrospun functionalized polyaniline copolymer-based nanofibers with potential application in tissue engineering. Macromol. Biosci. 2010, 10, 1424–1431. [Google Scholar] [CrossRef]
  19. Collier, J.H.; Camp, J.P.; Hudson, T.W.; Schmidt, C.E. Synthesis and characterization of polypyrrole-hyaluronic acid composite biomaterials for tissue engineering applications. J. Biomed. Mater. Res. 2000, 50, 574–584. [Google Scholar] [CrossRef]
  20. Lim, T.H.; Lee, S.H.; Yeo, S.Y. Highly conductive polymer/metal/carbon nanotube composite fiber prepared by the melt-spinning process. Text. Res. J. 2016, 87, 593–606. [Google Scholar] [CrossRef]
  21. Li, Y.; Zhou, B.; Zheng, G.; Liu, X.; Li, T.; Yan, C.; Cheng, C.; Dai, K.; Liu, C.; Shen, C.; et al. Continuously prepared highly conductive and stretchable SWNT/MWNT synergistically composited electrospun thermoplastic polyurethane yarns for wearable sensing. J. Mater. Chem. C 2017, 6, 2258–2269. [Google Scholar] [CrossRef]
  22. Watanabe, H.; Takahashi, H.; Nakao, M.; Walton, K.; Llinás, R.R. Intravascular neural interface with nanowire electrode. Electron. Commun. Jpn. 2009, 92, 29–37. [Google Scholar] [CrossRef] [PubMed] [Green Version]
  23. Hong, C.-H.; Ki, S.-J.; Jeon, J.-H.; Che, H.-L.; Park, I.-K.; Kee, C.-D.; Oh, I. Electroactive bio-composite actuators based on cellulose acetate nanofibers with specially chopped polyaniline nanoparticles through electrospinning. Compos. Sci. Technol. 2013, 87, 135–141. [Google Scholar] [CrossRef]
  24. Lee, R.-J.; Temmer, R.; Tamm, T.; Aabloo, A.; Kiefer, R. Renewable antioxidant properties of suspensible chitosan–polypyrrole composites. React. Funct. Polym. 2013, 73, 1072–1077. [Google Scholar] [CrossRef]
  25. Pinto, N.J.; Johnson, A.T.; MacDiarmid, A.G.; Mueller, C.H.; Theofylaktos, N.; Robinson, D.C.; Miranda, F.A. Electrospun polyaniline/polyethylene oxide nanofiber field-effect transistor. Appl. Phys. Lett. 2003, 83, 4244–4246. [Google Scholar] [CrossRef] [Green Version]
  26. McKeon, K.D.; Lewis, A.; Freeman, J.W. Electrospun poly (D,L-lactide) and polyaniline scaffold characterization. J. Appl. Polym. Sci. 2009, 115, 1566–1572. [Google Scholar] [CrossRef]
  27. Kang, T.S.; Lee, S.W.; Joo, J.; Lee, J.Y. Electrically conducting polypyrrole fibers spun by electrospinning. Synth. Met. 2005, 153, 61–64. [Google Scholar] [CrossRef]
  28. Bognitzki, M.; Becker, M.; Graeser, M.; Massa, W.; Wendorff, J.H.; Schaper, A.; Weber, D.; Beyer, A.; Gölzhäuser, A.; Greiner, A. Preparation of sub-micrometer copper fibers via electrospinning. Adv. Mater. 2006, 18, 2384–2386. [Google Scholar] [CrossRef]
  29. Han, G.Y.; Guo, B.; Zhang, L.W.; Yang, B.S. Conductive gold films assembled on electrospun poly (methyl methacrylate) fibrous mats. Adv. Mater. 2006, 18, 1709–1712. [Google Scholar] [CrossRef]
  30. Ju, Y.-W.; Park, J.-H.; Jung, H.-R.; Lee, W.-J. Electrochemical properties of polypyrrole/sulfonted SEBS composite nanofibers prepared by electrospinning. Electrochimica Acta 2007, 52, 4841–4847. [Google Scholar] [CrossRef]
  31. Ostrovidov, S.; Shi, X.; Zhang, L.; Liang, X.; Kim, S.B.; Fujie, T.; Ramalingam, M.; Chen, M.; Nakajima, K.; Al-Hazmi, F.; et al. Myotube formation on gelatin nanofibers–Multi-walled carbon nanotubes hybrid scaffolds. Biomaterials 2014, 35, 6268–6277. [Google Scholar] [CrossRef]
  32. Rafique, J.; Yu, J.; Yu, J.; Fang, G.; Wong, K.W.; Zheng, Z.; Ong, H.C.; Lau, W.M. Electrospinning highly aligned long polymer nanofibers on large scale by using a tip collector. Appl. Phys. Lett. 2007, 91, 063126. [Google Scholar] [CrossRef]
  33. Long, Y.-Z.; Yu, M.; Sun, B.; Gu, C.-Z.; Fan, Z. Recent advances in large-scale assembly of semiconducting inorganic nanowires and nanofibers for electronics, sensors and photovoltaics. Chem. Soc. Rev. 2012, 41, 4560–4580. [Google Scholar] [CrossRef] [PubMed]
  34. Christopherson, G.T.; Song, H.; Mao, H.-Q. The influence of fiber diameter of electrospun substrates on neural stem cell differentiation and proliferation. Biomaterials 2009, 30, 556–564. [Google Scholar] [CrossRef] [PubMed]
  35. Willis, M.R. Dielectric and electronic properties of biological materials by R Pethig. pp 376. John Wiley & Sons, Chichester and New York. 1979. £15. Biochem. Educ. 1980, 8, 31. [Google Scholar] [CrossRef]
  36. Tsai, B.; Xue, H.; Birgersson, E.; Ollmar, S.; Birgersson, U. Dielectrical properties of living epidermis and dermis in the frequency range from 1 kHz to 1 MHz. J. Electr. Bioimpedance 2019, 10, 14–23. [Google Scholar] [CrossRef] [PubMed] [Green Version]
  37. Gabriel, C. Dielectric properties of biological tissue: Variation with age. Bioelectromagnetics 2005, 26, S12–S18. [Google Scholar] [CrossRef]
  38. Stafiej, P.; Küng, F.; Thieme, D.; Czugala, M.; Kruse, F.E.; Schubert, D.W.; Fuchsluger, T.A. Adhesion and metabolic activity of human corneal cells on PCL based nanofiber matrices. Mater. Sci. Eng. C Mater. Biol. Appl. 2017, 71, 764–770. [Google Scholar] [CrossRef] [PubMed]
  39. Nishizawa, M.; Nozaki, H.; Kaji, H.; Kitazume, T.; Kobayashi, N.; Ishibashi, T.; Abe, T. Electrodeposition of anchored polypyrrole film on microelectrodes and stimulation of cultured cardiac myocytes. Biomaterials 2007, 28, 1480–1485. [Google Scholar] [CrossRef]
  40. Roshanbinfar, K.; Vogt, L.; Greber, B.; Diecke, S.; Boccaccini, A.R.; Scheibel, T.; Engel, F.B. Electroconductive biohybrid hydrogel for enhanced maturation and beating properties of engineered cardiac tissues. Adv. Funct. Mater. 2018, 28, 1803951. [Google Scholar] [CrossRef] [Green Version]
  41. Roshanbinfar, K.; Vogt, L.; Ruther, F.; Roether, J.A.; Boccaccini, A.R.; Engel, F.B. Nanofibrous composite with tailorable electrical and mechanical properties for cardiac tissue engineering. Adv. Funct. Mater. 2019, 30, 1908612. [Google Scholar] [CrossRef] [Green Version]
  42. Bassett, C.A.L.; Becker, R.O. Generation of electric potentials by bone in response to mechanical stress. Science 1962, 137, 1063–1064. [Google Scholar] [CrossRef] [PubMed]
  43. Leppik, L.; ZhiHua, H.; Mobini, S.; Parameswaran, V.T.; Eischen-Loges, M.; Slavici, A.; Helbing, J.; Pindur, L.; Oliveira, K.M.C.; Bhavsar, M.; et al. Combining electrical stimulation and tissue engineering to treat large bone defects in a rat model. Sci. Rep. 2018, 8, 6307. [Google Scholar] [CrossRef]
  44. Nguyen-Truong, M.; Li, Y.; Wang, Z. Mechanical Considerations of electrospun scaffolds for myocardial tissue and regenerative engineering. Bioengineering 2020, 7, 122. [Google Scholar] [CrossRef] [PubMed]
  45. Jazayeri, M.; Shokrgozar, M.A.; Haghighipour, N.; Mahdian, R.; Farrokhi, M.; Bonakdar, S.; Mirahmadi, F.; Abbariki, T.N. Evaluation of mechanical and chemical stimulations on osteocalcin and runx2 expression in mesenchymal stem cells. Mol. Cell. Biomech. MCB 2015, 12, 197–213. [Google Scholar] [PubMed]
  46. Richardson-Burns, S.M.; Hendricks, J.L.; Foster, B.; Povlich, L.K.; Kim, D.-H.; Martin, D.C. Polymerization of the conducting polymer poly (3,4-ethylenedioxythiophene) (PEDOT) around living neural cells. Biomaterials 2007, 28, 1539–1552. [Google Scholar] [CrossRef] [PubMed] [Green Version]
  47. Ramanathan, K.; Bangar, M.A.; Yun, M.; Chen, W.; Myung, N.V.; Mulchandani, A. Bioaffinity sensing using biologically functionalized conducting-polymer nanowire. J. Am. Chem. Soc. 2005, 127, 496–497. [Google Scholar] [CrossRef]
  48. Lu, X.; Wang, C.; Wei, Y. One-dimensional composite nanomaterials: Synthesis by electrospinning and their applications. Small 2009, 5, 2349–2370. [Google Scholar] [CrossRef] [PubMed]
  49. Xue, J.; Wu, T.; Dai, Y.; Xia, Y. Electrospinning and electrospun nanofibers: Methods, materials, and applications. Chem. Rev. 2019, 119, 5298–5415. [Google Scholar] [CrossRef]
  50. Arter, J.A.; Taggart, D.K.; McIntire, T.M.; Penner, R.M.; Weiss, G.A. Virus-PEDOT nanowires for biosensing. Nano Lett. 2010, 10, 4858–4862. [Google Scholar] [CrossRef] [Green Version]
  51. Munawar, M.A.; Schubert, D.W. highly oriented electrospun conductive nanofibers of biodegradable polymers-revealing the electrical percolation thresholds. ACS Appl. Polym. Mater. 2021, 3, 2889–2901. [Google Scholar] [CrossRef]
  52. Doergens, A.; Roether, J.A.; Dippold, D.; Boccaccini, A.R.; Schubert, D.W. Identifying key processing parameters for the electrospinning of aligned polymer nanofibers. Mater. Lett. 2014, 140, 99–102. [Google Scholar] [CrossRef]
  53. Schubert, D.W. Revealing novel power laws and quantization in electrospinning considering jet splitting—toward predicting fiber diameter and its distribution. Macromol. Theory Simul. 2019, 28, 1900006. [Google Scholar] [CrossRef]
  54. Schubert, D.W.; Allen, V.; Dippel, U. Revealing novel power laws and quantization in electrospinning considering jet splitting—Toward predicting fiber diameter and its distribution part ii experimental. Adv. Eng. Mater. 2021, 23, 2001161. [Google Scholar] [CrossRef]
  55. McLachlan, D.S.; Blaszkiewicz, M.; Newnham, R.E. Electrical resistivity of composites. J. Am. Ceram. Soc. 1990, 73, 2187–2203. [Google Scholar] [CrossRef]
  56. Kirkpatrick, S. Percolation and conduction. Rev. Mod. Phys. 1973, 45, 574–588. [Google Scholar] [CrossRef]
  57. Yu, P.; Li, Y.; Zhao, X.; Wu, L.; Zhang, Q. Graphene-wrapped polyaniline nanowire arrays on nitrogen-doped carbon fabric as novel flexible hybrid electrode materials for high-performance supercapacitor. Langmuir 2014, 30, 5306–5313. [Google Scholar] [CrossRef]
  58. Cao, J.; Wang, C. Highly conductive and flexible silk fabric via electrostatic self assemble between reduced graphene oxide and polyaniline. Org. Electron. 2018, 55, 26–34. [Google Scholar] [CrossRef]
  59. Huang, T.-M.; Batra, S.; Hu, J.; Miyoshi, T.; Cakmak, M. Chemical cross-linking of conducting poly(3,4-ethylenedioxythiophene): Poly (styrenesulfonate) (PEDOT:PSS) using poly(ethylene oxide) (PEO). Polymer 2013, 54, 6455–6462. [Google Scholar] [CrossRef]
  60. Massaglia, G.; Chiodoni, A.; Marasso, S.L.; Pirri, C.F.; Quaglio, M. Electrical Conductivity Modulation of Crosslinked Composite Nanofibers Based on PEO and PEDOT:PSS. J. Nanomater. 2018, 2018, 3286901. [Google Scholar] [CrossRef]
  61. Khan, W.S.; Asmatulu, R.; Rodriguez, V.; Ceylan, M. Enhancing thermal and ionic conductivities of electrospun PAN and PMMA nanofibers by graphene nanoflake additions for battery-separator applications. Int. J. Energy Res. 2014, 38, 2044–2051. [Google Scholar] [CrossRef]
  62. Scholes, D.T.; Yee, P.Y.; Lindemuth, J.R.; Kang, H.; Onorato, J.; Ghosh, R.; Luscombe, C.K.; Spano, F.C.; Tolbert, S.H.; Schwartz, B.J. The effects of crystallinity on charge transport and the structure of sequentially processed F4TCNQ-doped conjugated polymer films. Adv. Funct. Mater. 2017, 27, 1702654. [Google Scholar] [CrossRef]
  63. Richard-Lacroix, M.; Pellerin, C. Molecular orientation in electrospun fibers: From mats to single fibers. Macromolecules 2013, 46, 9473–9493. [Google Scholar] [CrossRef]
  64. Yano, T.; Higaki, Y.; Tao, D.; Murakami, D.; Kobayashi, M.; Ohta, N.; Koike, J.-I.; Horigome, M.; Masunaga, H.; Ogawa, H.; et al. Orientation of poly (vinyl alcohol) nanofiber and crystallites in non-woven electrospun nanofiber mats under uniaxial stretching. Polymer 2012, 53, 4702–4708. [Google Scholar] [CrossRef]
Figure 1. Panel (a) shows SEM image with high orientation of electrospun fibers. Panel (b) shows directionality analysis with the histogram and normal distribution curve (Gauss Fit) of orientation angle. The class width is approximately 5°. 90° is positioned in the middle of the class because the fibers were aligned to the machine direction MD.
Ijms 22 10295 g001
Figure 2. SEM images with their fiber-diameter histograms for Case 1: PEO-PANi:CSA fibers (panels a,b), Case 2: PCL-PANi:CSA fibers (panels c,d), and Case 3: PLA-PANi:CSA fibers (panels e,f), respectively. The concentration of filler PANi (φPANi ≈ 10%) is the same for all cases, and all fibers are un-annealed.
Ijms 22 10295 g002
Figure 3. The Panels (aj) represent the SEM analysis for PEO-300 kD, PEO-600 kD, PEO-900 kD, PEO-2000 kD, and PEO-4000 kD fibers with their fiber-diameter histograms, respectively. The concentration of PEO matrix is fixed up to 2% (φPEO ≈ 2%) in spinning solutions for all molar masses (300–4000 kD). Note: A small misalignment of fibers is an issue when handling fibers during preparation of samples for SEM measurements.
Ijms 22 10295 g003
Figure 4. Logarithm of conductivity (log σ) against percentage volume fraction (φ%) of PANi for PEO(900kD)-PANi:CSA fibers (Case 1), PCL-PANi:CSA fibers (Case 2), and PLA-PANi:CSA fibers (Case 3), respectively. Panel (a) shows the comparison between all three cases (Case 1–Case 3). Panels (bd) show the storage-time dependence for Case 1, Case 2, and Case 3, respectively. The samples are stored at room temperature for 24 h. The dotted lines show the closest fits to the GEM model (Equation (2)).
Ijms 22 10295 g004
Figure 5. Schematic representation of percolation phenomenon within electrospun conductive nanofibers with and without annealing. Panel (a) elaborates the incomplete continuous path between PANi particles (below the critical concentration/percolation threshold). Panel (b) shows the completion of continuous path between ICPs particles for percolation phenomenon (at percolation threshold). Panel (c) shows that continuous pathways increase with increasing filler concentration. Panel (d) shows the development of continuous path due to generation of additional conductive channels among PANi particles during annealing. Panel (e) shows continuous paths doubling after annealing. Panel (f) shows continuous paths doubling due to physical/chemical interactions among PANi, CSA and PEO/PCL/PLA species with or without the removal of molecules at higher annealing temperature (above 100 °C). Panels (g,h) show the freshly prepared (un-stored) and stored (storage at room temperature for 24 h) conductive fibers. In stored conductive fibers, the water molecules provide a medium between PANi particles for electron travelling.
Ijms 22 10295 g005
Figure 6. Logarithm of conductivity (log σ) against percentage volume fraction (φ%) of PANi for PEO-PANi:CSA fibers. Panel (a) shows the trend in φc for PEO-PANi:CSA fibers for different molar masses of PEO (300 kD, 600 kD, 900 kD, 2000 kD, and 4000 kD). Panel (b) shows the power law correlation between molar mass (M) and fiber diameter (df) with a coefficient g = 0.13 and exponent h = 1.27. The inset graph shows the linear fit of Log df − Log M. Panel (c) shows a power law correlation between fiber diameter (df) and percolation threshold (φc) with a coefficient m = 1.06 and exponent n = 0.35. Panel (d) shows a power law dependence of percolation threshold φc on molar mass M for PEO-PANi:CSA fibers with coefficient a = 0.62 and exponent b = 0.43. Panel (e) shows the temperature T dependence on percolation threshold φc of PEO(900 kD)-PANi:CSA fibers. The annealing is conducted at 50, 60, 65, 70, and 75 °C for 24 h. The linear relation between natural logarithm of percolation threshold (Ln φc%) and inverse of the annealing temperature (1/T in Kelvin) indicates an Arrhenius activation process (f).
Ijms 22 10295 g006
Figure 7. Panels (ae) show the force-strain curves for PEO-PANi:CSA fibers using 300 kD–4000 kD molar mass of PEO. The percentage volume fraction (φ%) of PANi varies from 0–31% for each molar mass of PEO. The bold double red lines (ae) represent the average of all force-strain curves. Panel (f) shows elastic Young’s modulus (E) as a function of percentage volume fraction (φ%) of PANi for PEO-PANi:CSA fibers at each molar mass of PEO (300 kD–4000 kD). The dotted circles (f) represent the maximum elastic Young’s modulus (Emax) for each molar mass.
Ijms 22 10295 g007
Figure 8. Panels (ac) show the force-strain curves for PEO (900 kD)-PANi:CSA fibers using 50, 60, and 70 °C annealing temperatures, respectively. The percentage volume fraction (φ%) of PANi varies from 0–31%. The bold double red lines (ac) represent the average of all force-strain curves. Panel (d) shows elastic Young’s modulus (E) as a function of percentage volume fraction (φ%) of PANi for PEO(900 kD)-PANi:CSA fibers at 25 (un-annealed), 50, 60, and 70 °C annealing temperature. The dotted circles (d) represent the maximum elastic Young’s modulus (Emax) for each annealing temperature.
Ijms 22 10295 g008
Figure 9. Panel (a) shows a negative exponential correlation between maximum Young’s modulus (Emax) and molar mass (M) with Eo = 87 MPa (at M 0), E = 46 Mpa (at M  ∞) and characteristic molar mass M ˜ . Panel (b) shows the sigmoidal fit function between Emax and temperature T with lower (EL = 72 MPa) and upper (EU = 327 MPa) asymptotes, while To is the characteristic value of temperature and z describes the slope of fit function.
Ijms 22 10295 g009
Figure 10. The comparison of conductivities of conductive fibers in this study (PEO-PANi:CSA fibers, PCL-PANi:CSA fibers, and PLA-PANi:CSA fibers) and stated in the literature for various tissue and technical applications. The PEO-PANi:CSA fibers contain conductive fibers for different molar masses of PEO (300–4000) kD. The PEO (900 kD)-PANi:CSA fibers were annealed at 50, 60, and 70 °C for 24 h.
Ijms 22 10295 g010
Figure 11. The comparison of Young’s moduli of conductive fibers in this study (PEO-PANi:CSA fibers with 300 kD–4000 kD molar mass of PEO) and stated in the literature for various biomedical applications. The PEO (900 kD)-PANi:CSA fibers were annealed at 50, 60, and 70 °C for 24 h.
Ijms 22 10295 g011
Figure 12. Schematic representation of the procedure for the preparation of spinning solutions.
Ijms 22 10295 g012
Figure 13. Schematic of electrospinning set-up and procedure for measurement of conductivity and mechanical strength of electrospun conductive fibers. Panels (ac) show the feeding pump, high-voltage (HV) power supply, and rotating wheel collector, respectively. The wheel covered with electrospun fibers is aligned to machine direction (MD). Panels (df) show the glass slide (GS), two-point probe set-up, and Ohmmeter for resistance R measurement, respectively. Panels (g,h) show annealing process and resistance R measurement of annealed fibers, respectively. Panels (il) show the rolling of fibers into a bundle, clamping of a fiber bundle (within red marks), SEM image of a fiber bundle, and testing of a fiber bundle, respectively, using single-fiber tensile testing machine (m). Panels (n,o) show fiber bundles on SEM holders and weighing of tested sample within marked length, respectively.
Ijms 22 10295 g013
Figure 14. The schematic of a single fiber (length L and radius r) with n number of fibers and a single bundle of n fibers for derivation of equations of electrical conductivity (σ) and elastic Young’s modulus (E) of ECFCs, respectively.
Ijms 22 10295 g014
Table 1. Characteristics and properties of materials used.
MaterialsMolar Mass (Mw)Melting Point (mp)Density (ρ) at 25 °CConductivity (σ)
(kDa)(°C)(g cm−3)(S cm−1)
PEO300
600
900
2000
4000
65
65
65
65
65
1.26
1.26
1.21
1.21
1.21
(8.14 ± 0.3) × 10−8
(8.14 ± 0.3) × 10−8
(8.14 ± 0.3) × 10−8
(8.14 ± 0.3) × 10−8
(8.14 ± 0.3) × 10−8
PCL121601.145(9.62 ± 1.4) × 10−8
PLA1091701.24(81.4 ± 0.9) × 10−7
PANi-EB65>3501.101(1.1 ± 0.3) × 10−9 (pressed pellet, ASTM F8)
PANi:CSA (1:1) ≈ (100 ± 5)
CSA232.30 Da2001.302-
H2O18.02 Da-1.000 at 3.98 °C≤(0.05) × 10−6
CF119.38 Da-1.48≤(0.02) × 10−6
Et-OH46.07 Da-0.816Non-conductive
DMF73.09 Da-0.944≤(0.3) × 10−6
Publisher’s Note: MDPI stays neutral with regard to jurisdictional claims in published maps and institutional affiliations.

