
Resveratrol and Quercetin as Regulators of Inflammatory and Purinergic Receptors to Attenuate Liver Damage Associated to Metabolic Syndrome

 , , ,
, , ,
Abstract
: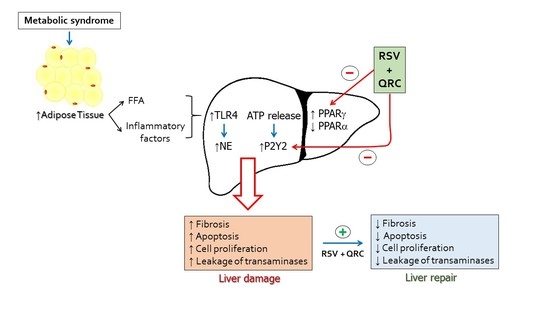
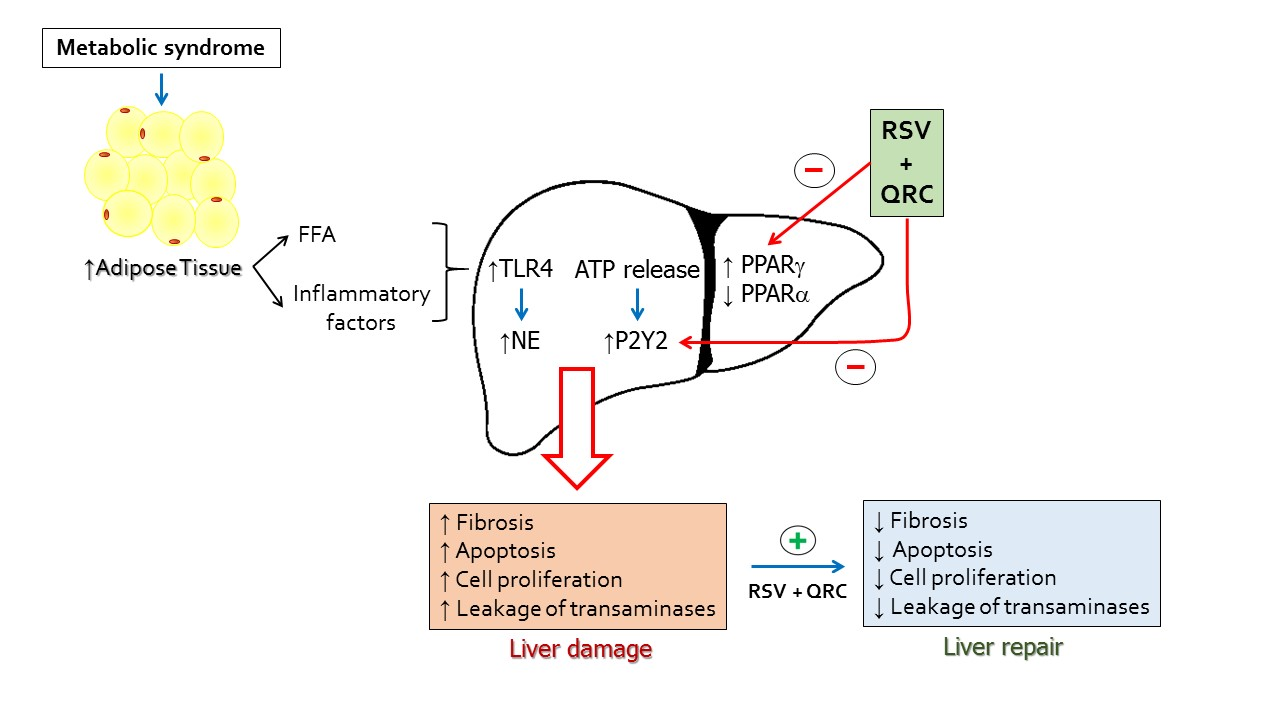
1. Introduction
2. Results
2.1. Metabolic Syndrome
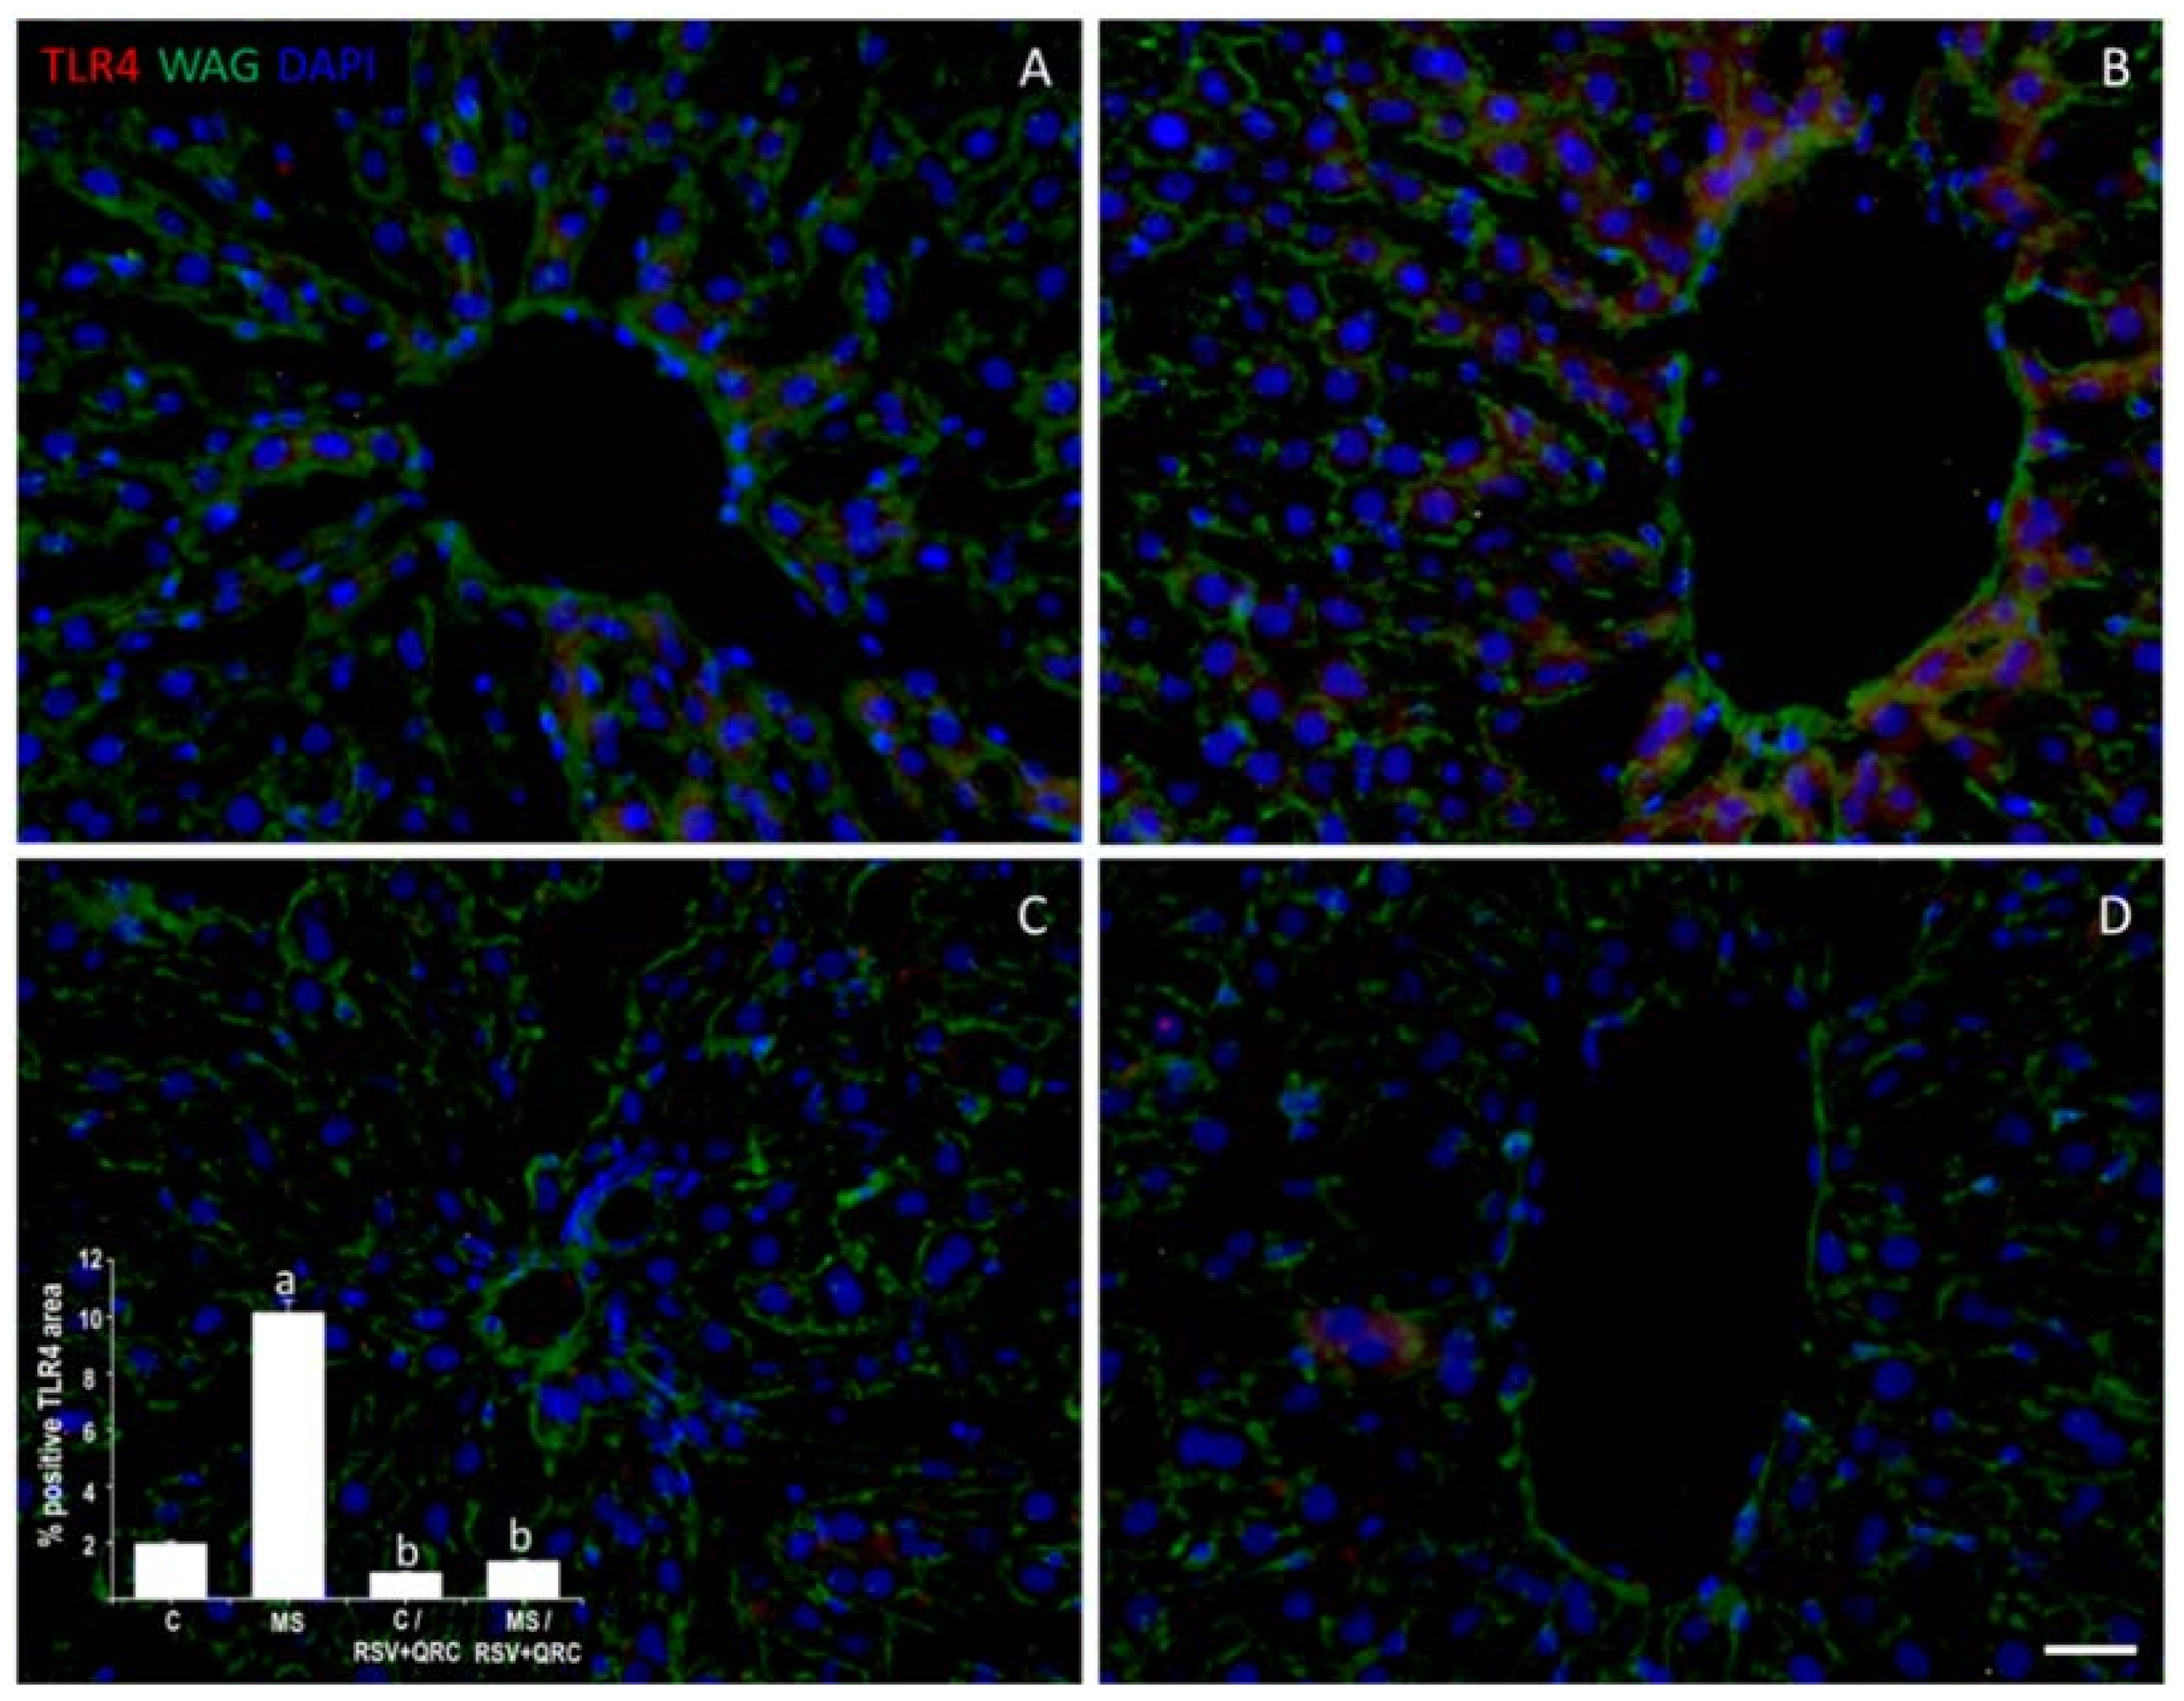
2.2. TLR4 Expression
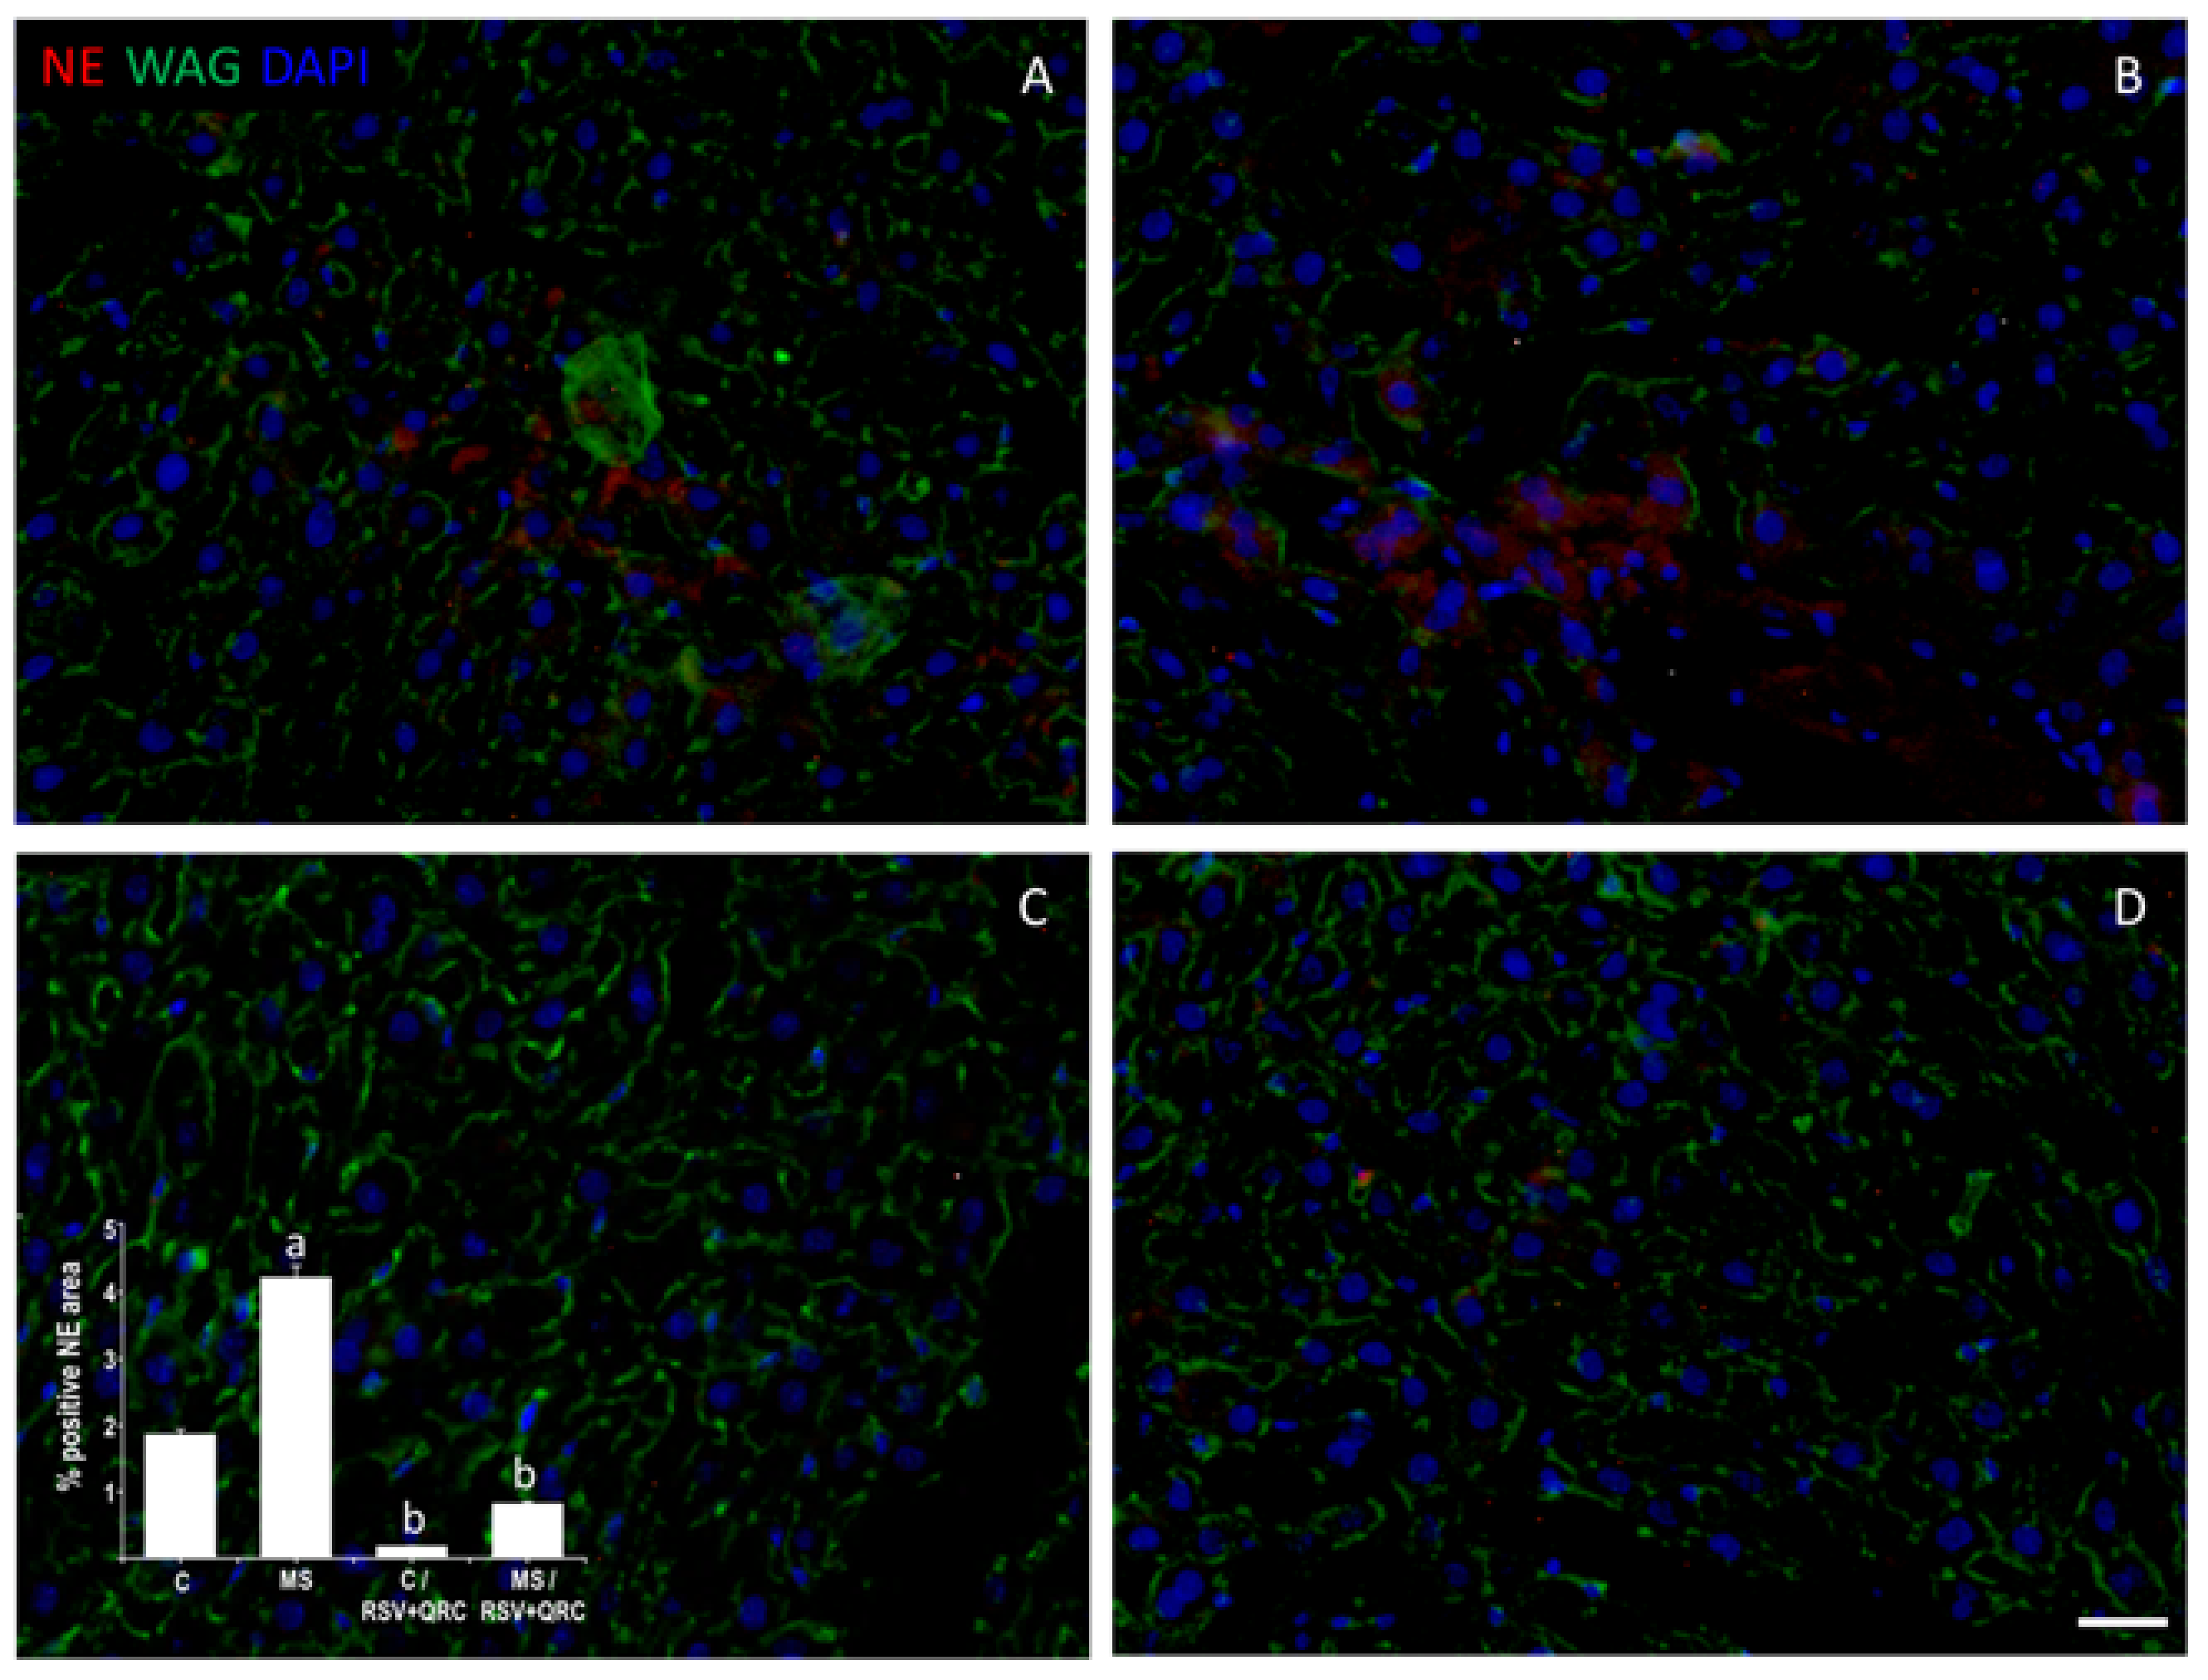
2.3. Neutrophil Elastase (NE) Expression
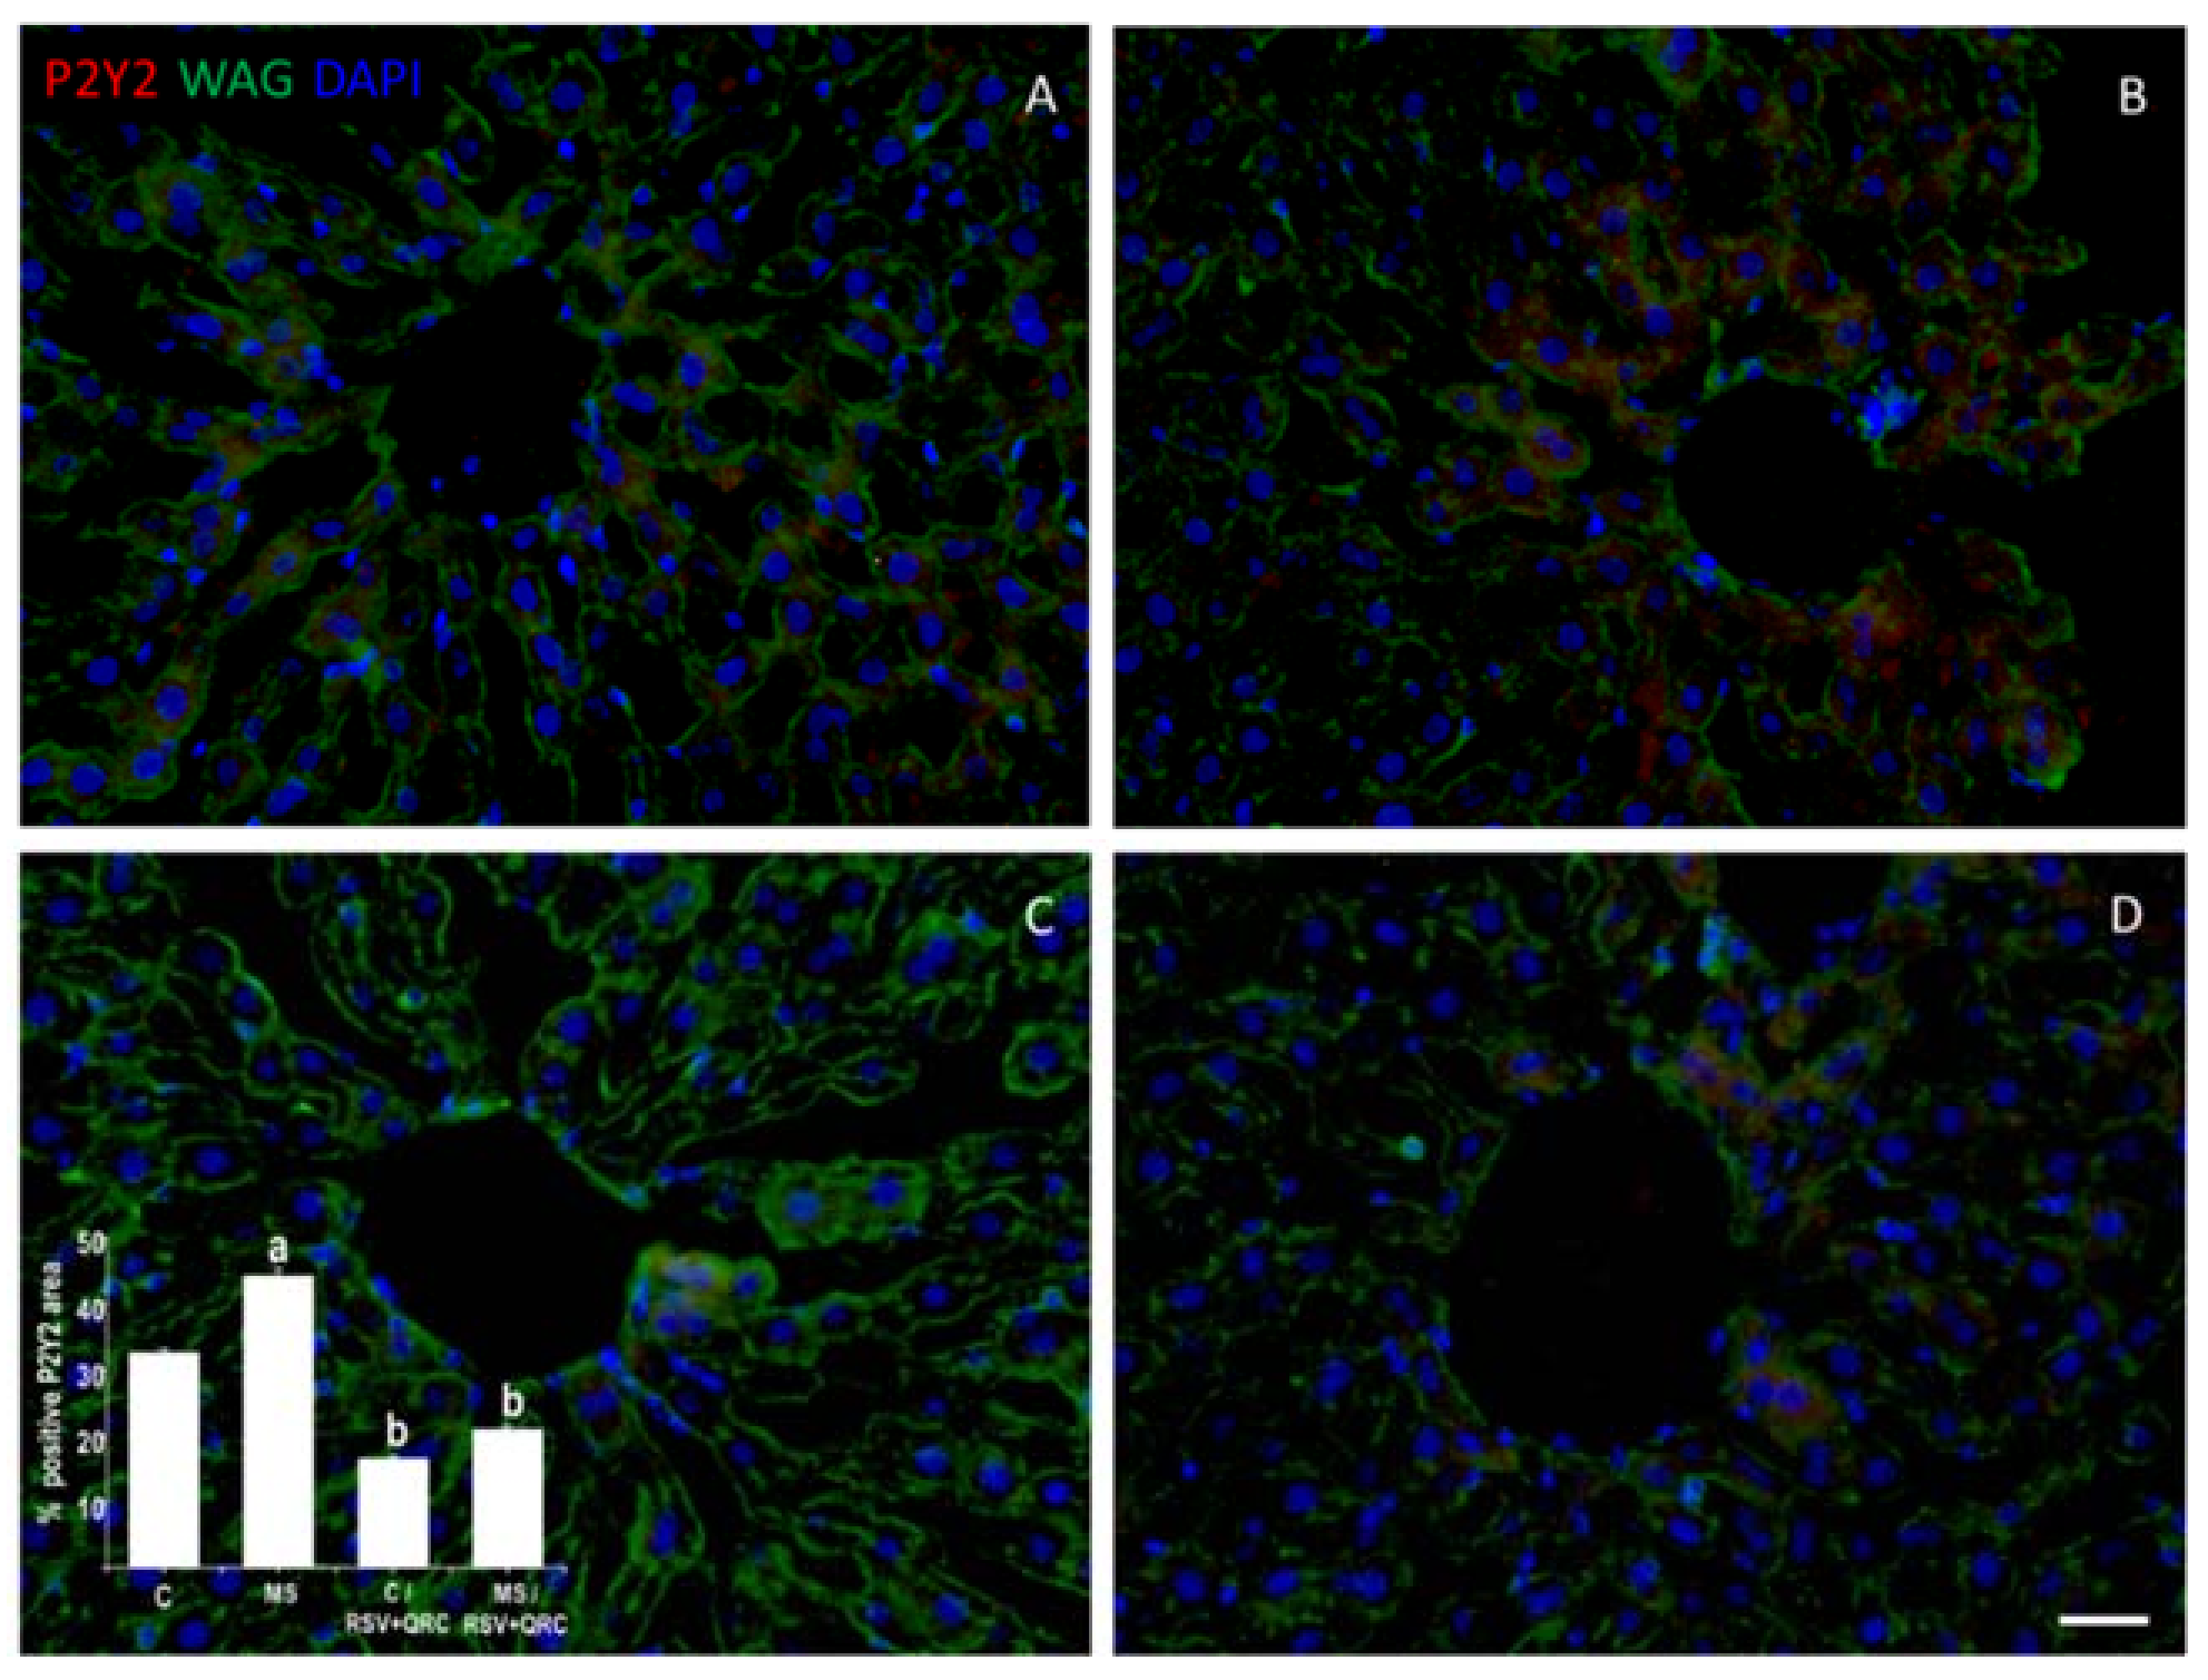
2.4. P2Y2 Expression
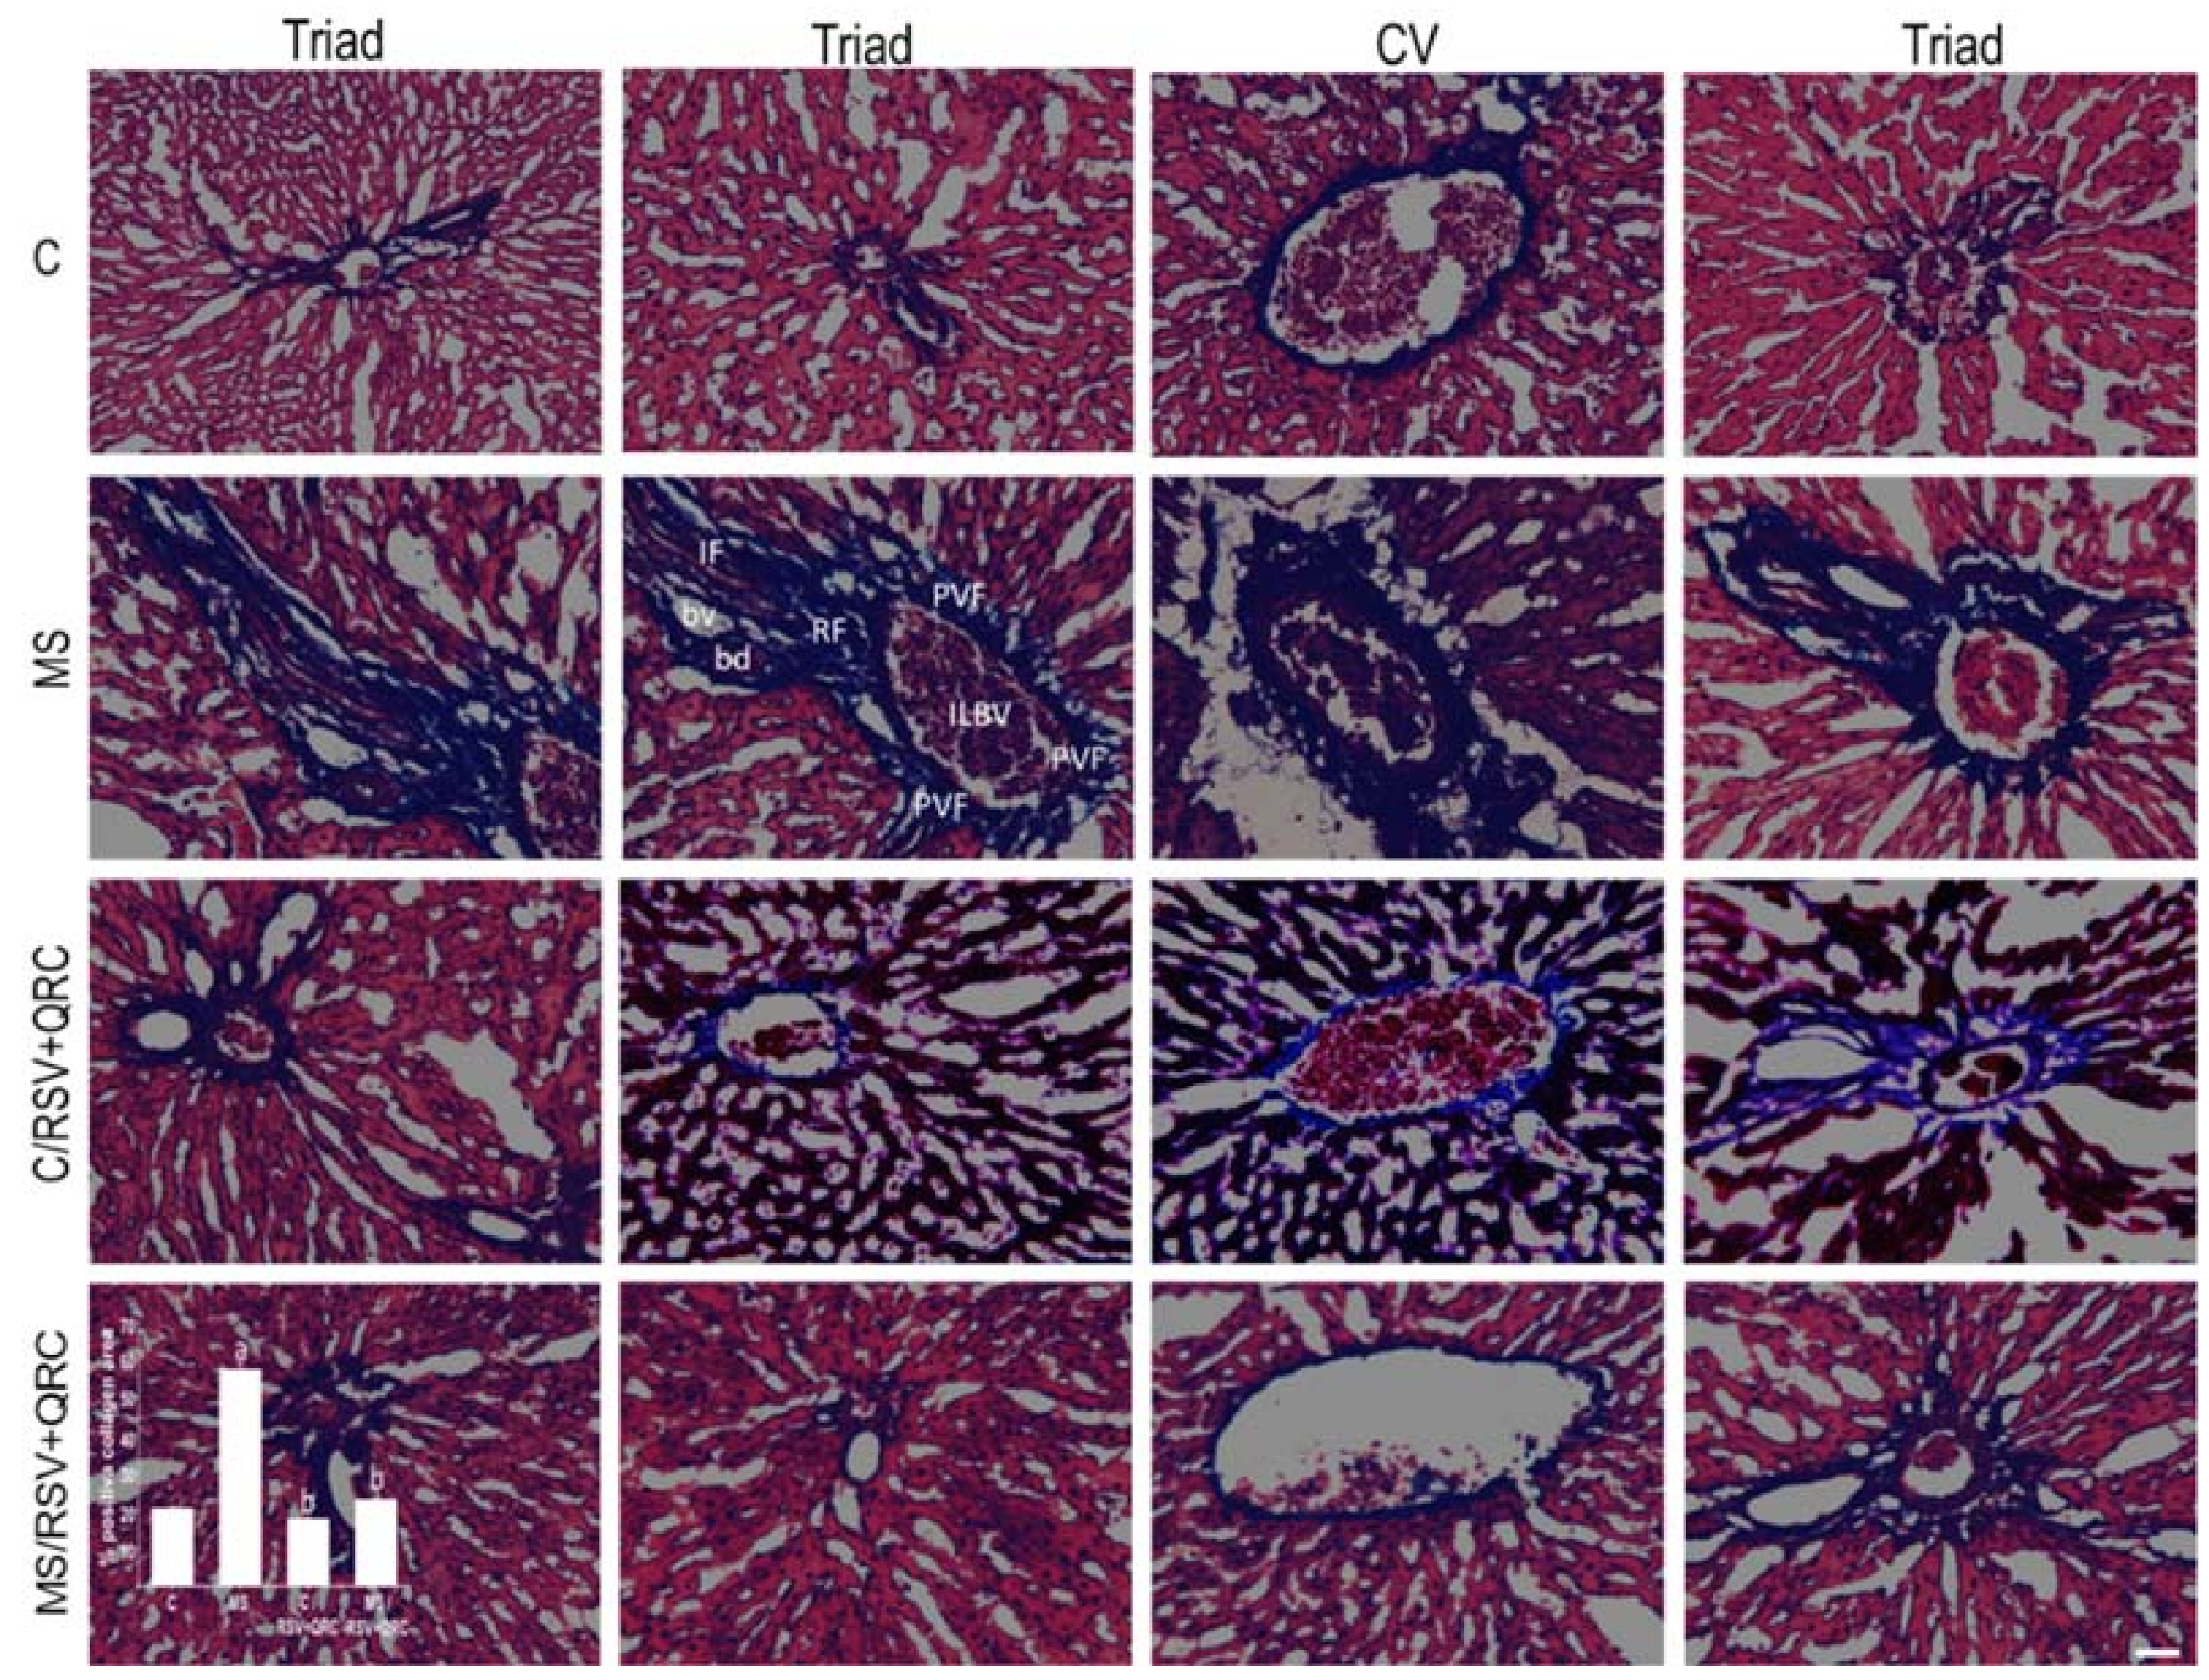
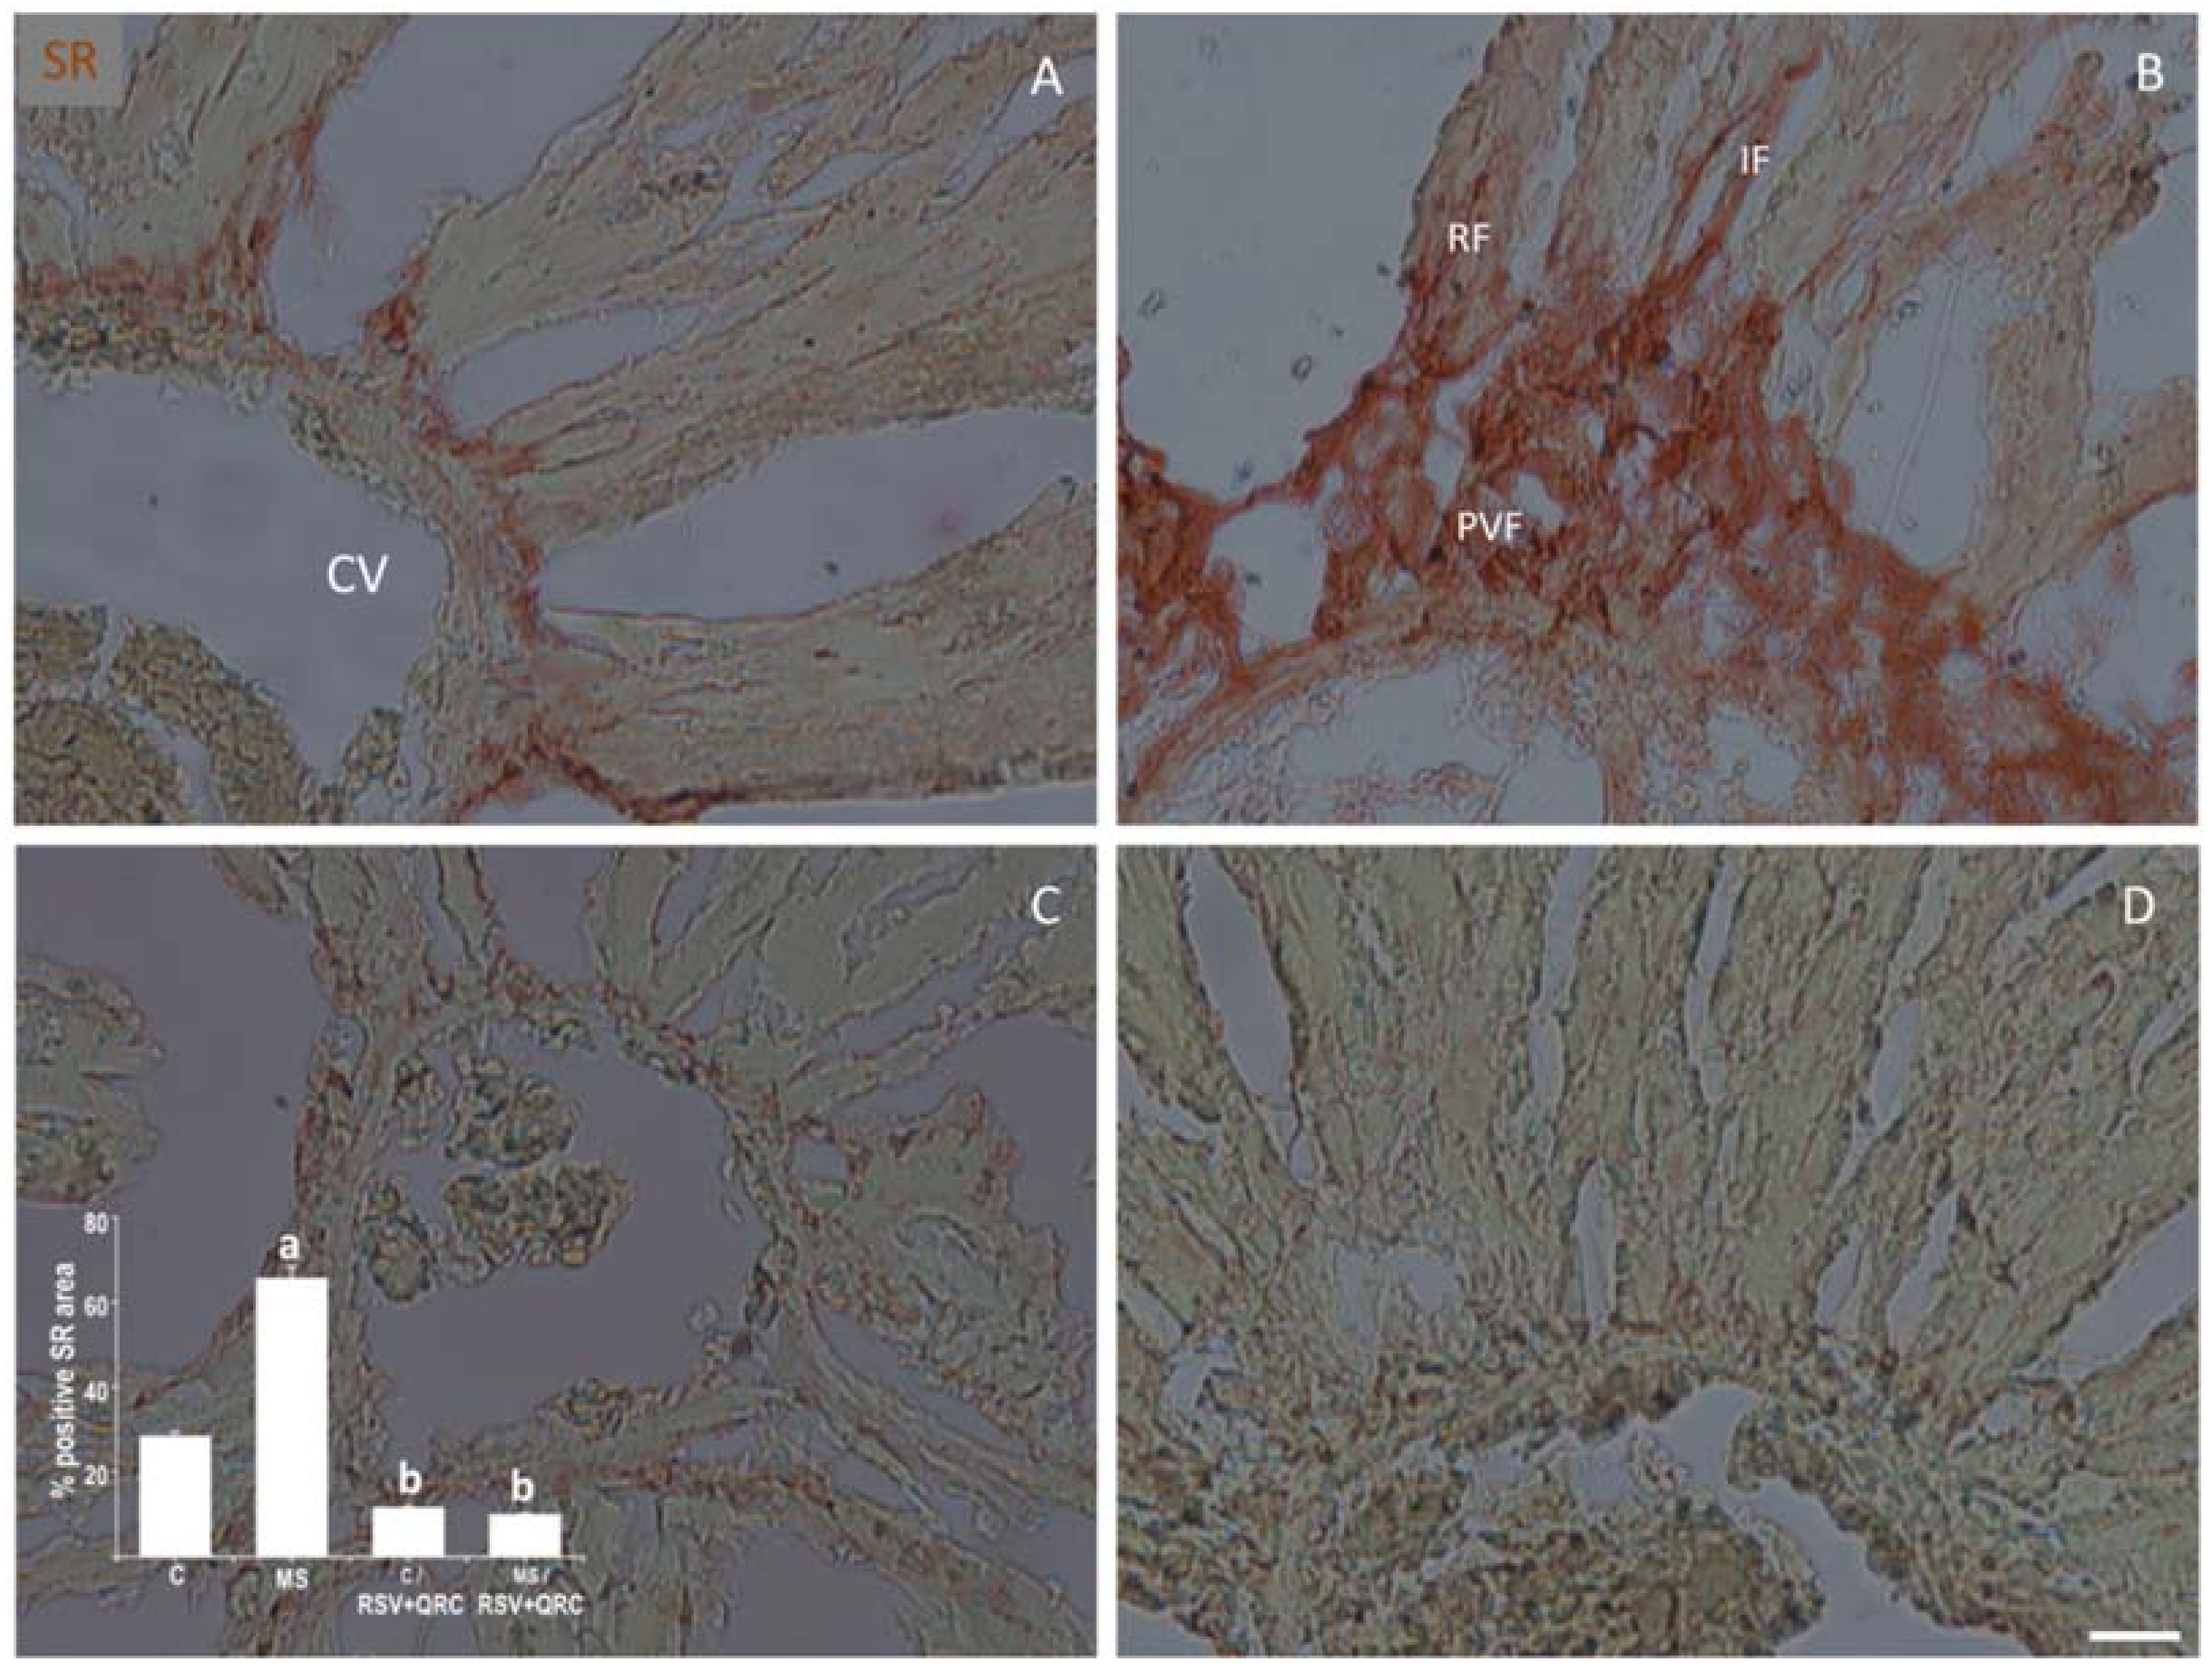
2.5. Fibrosis
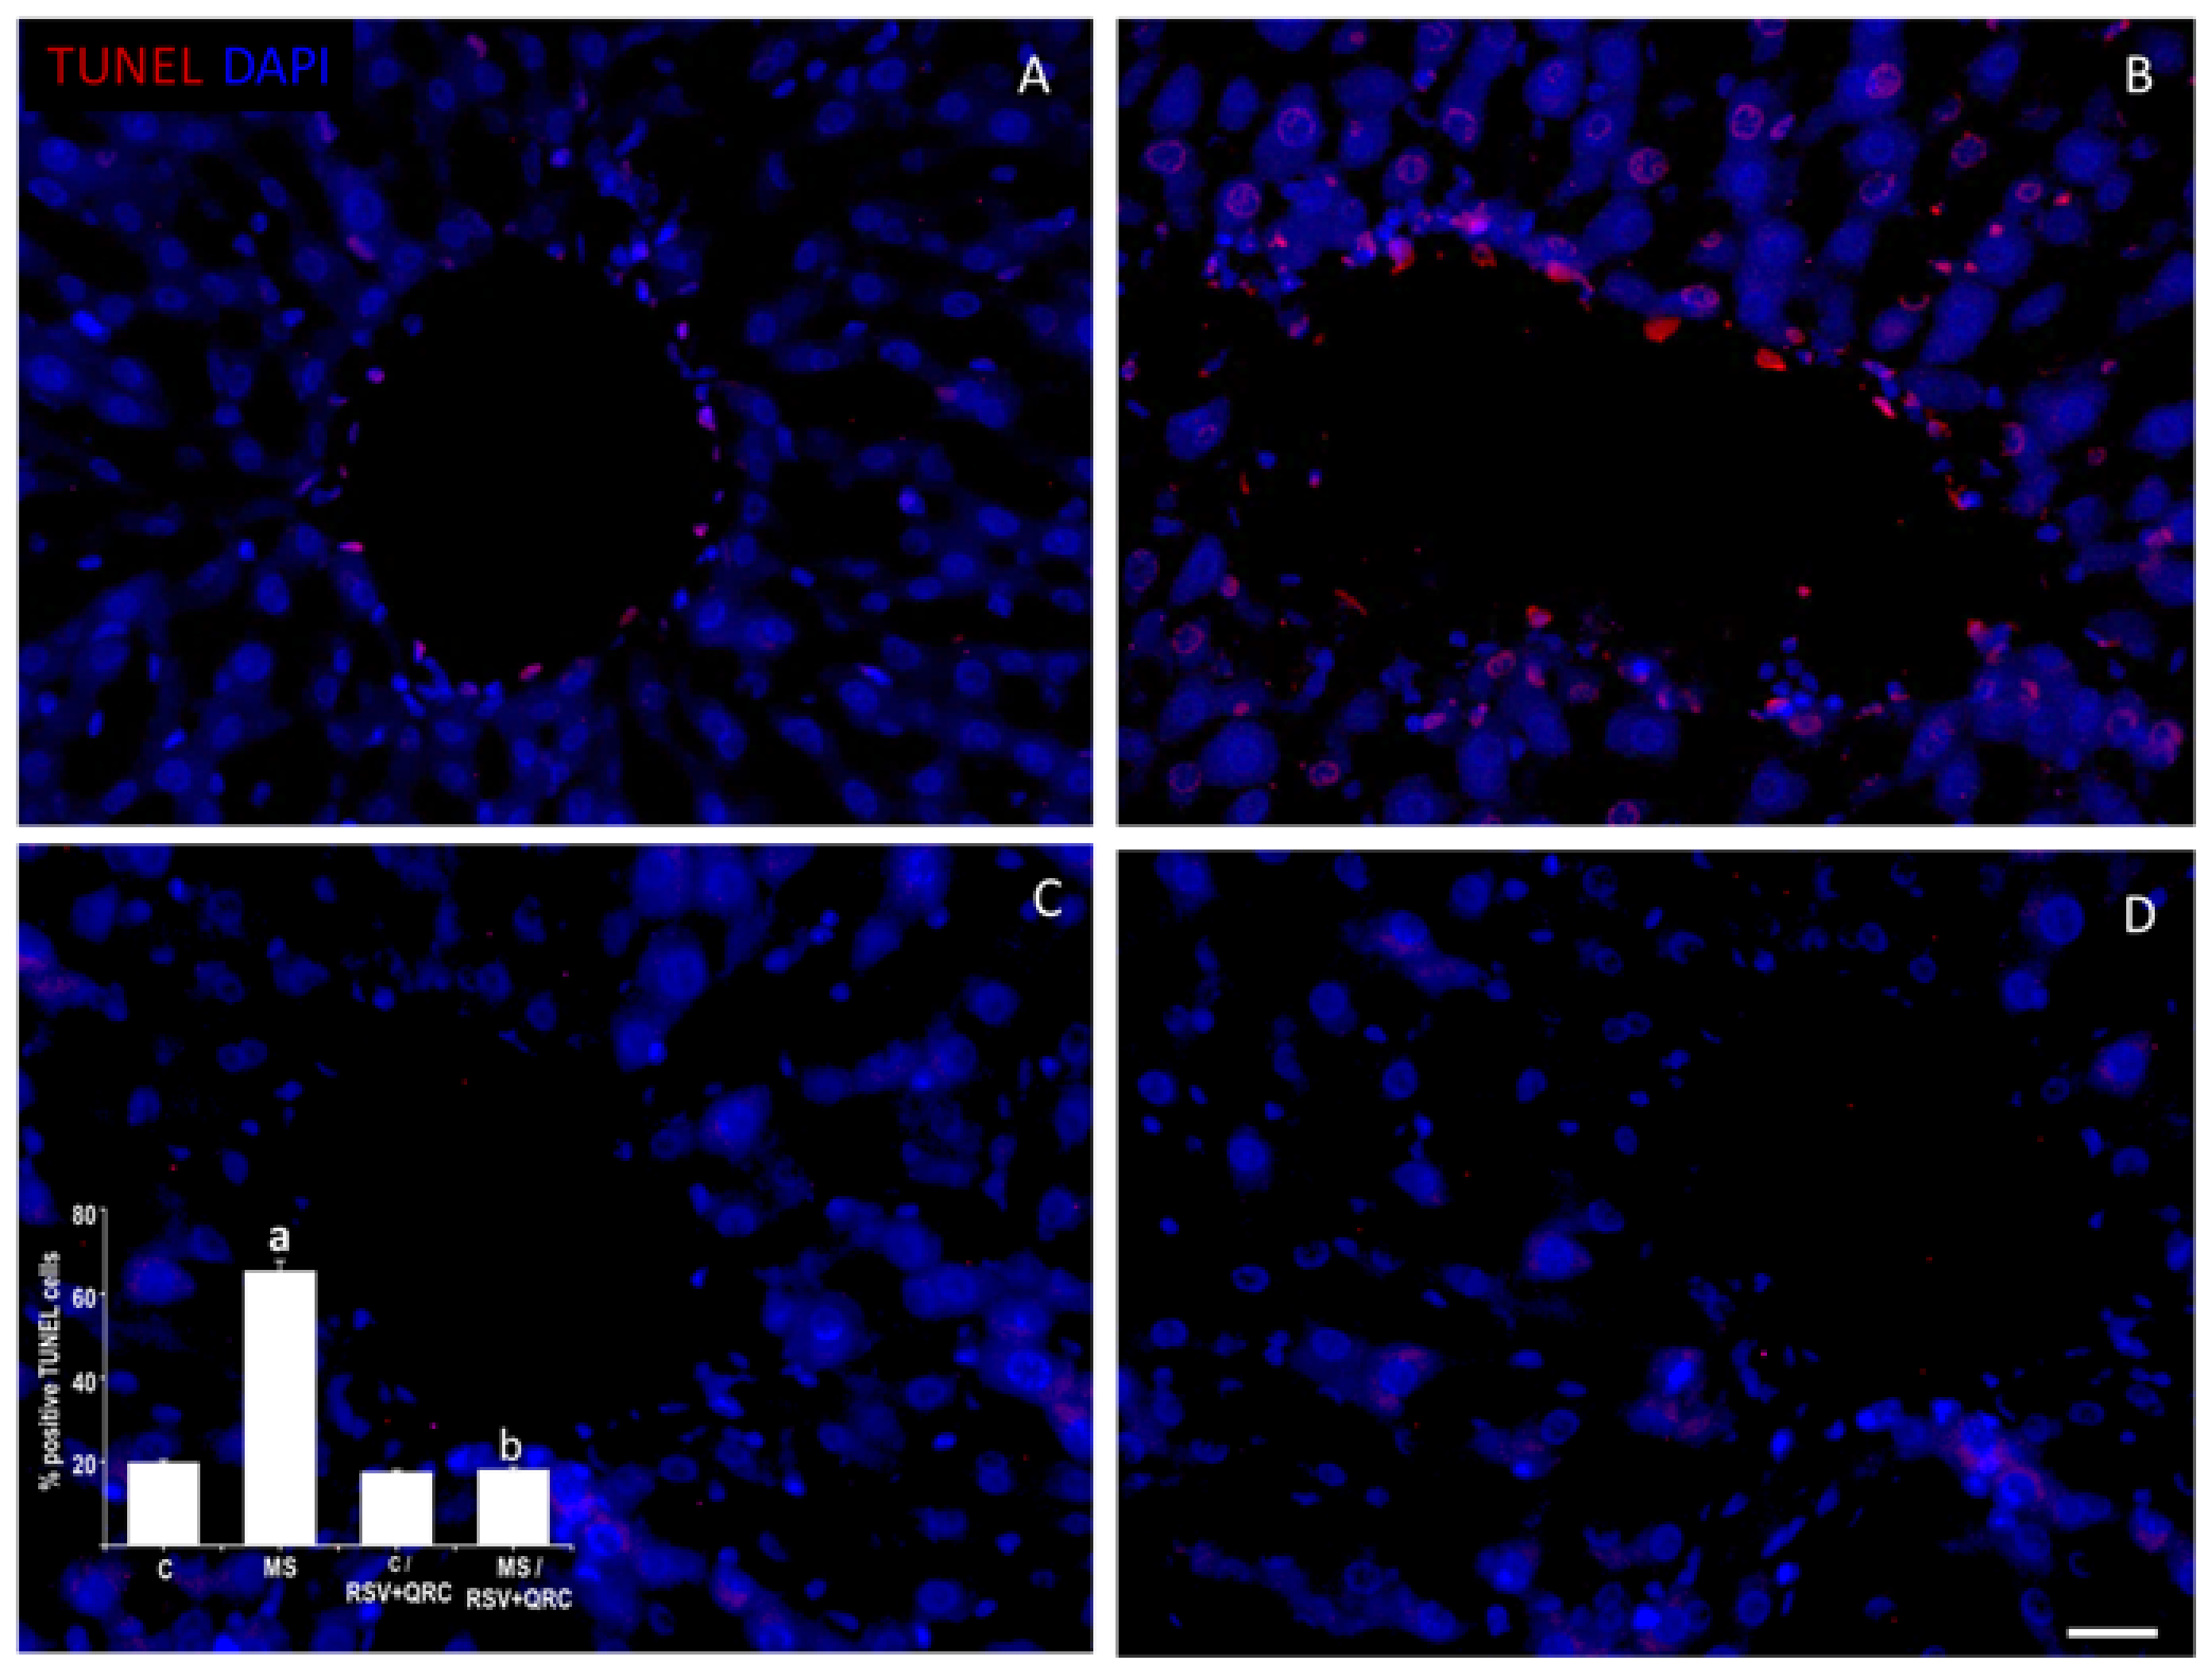
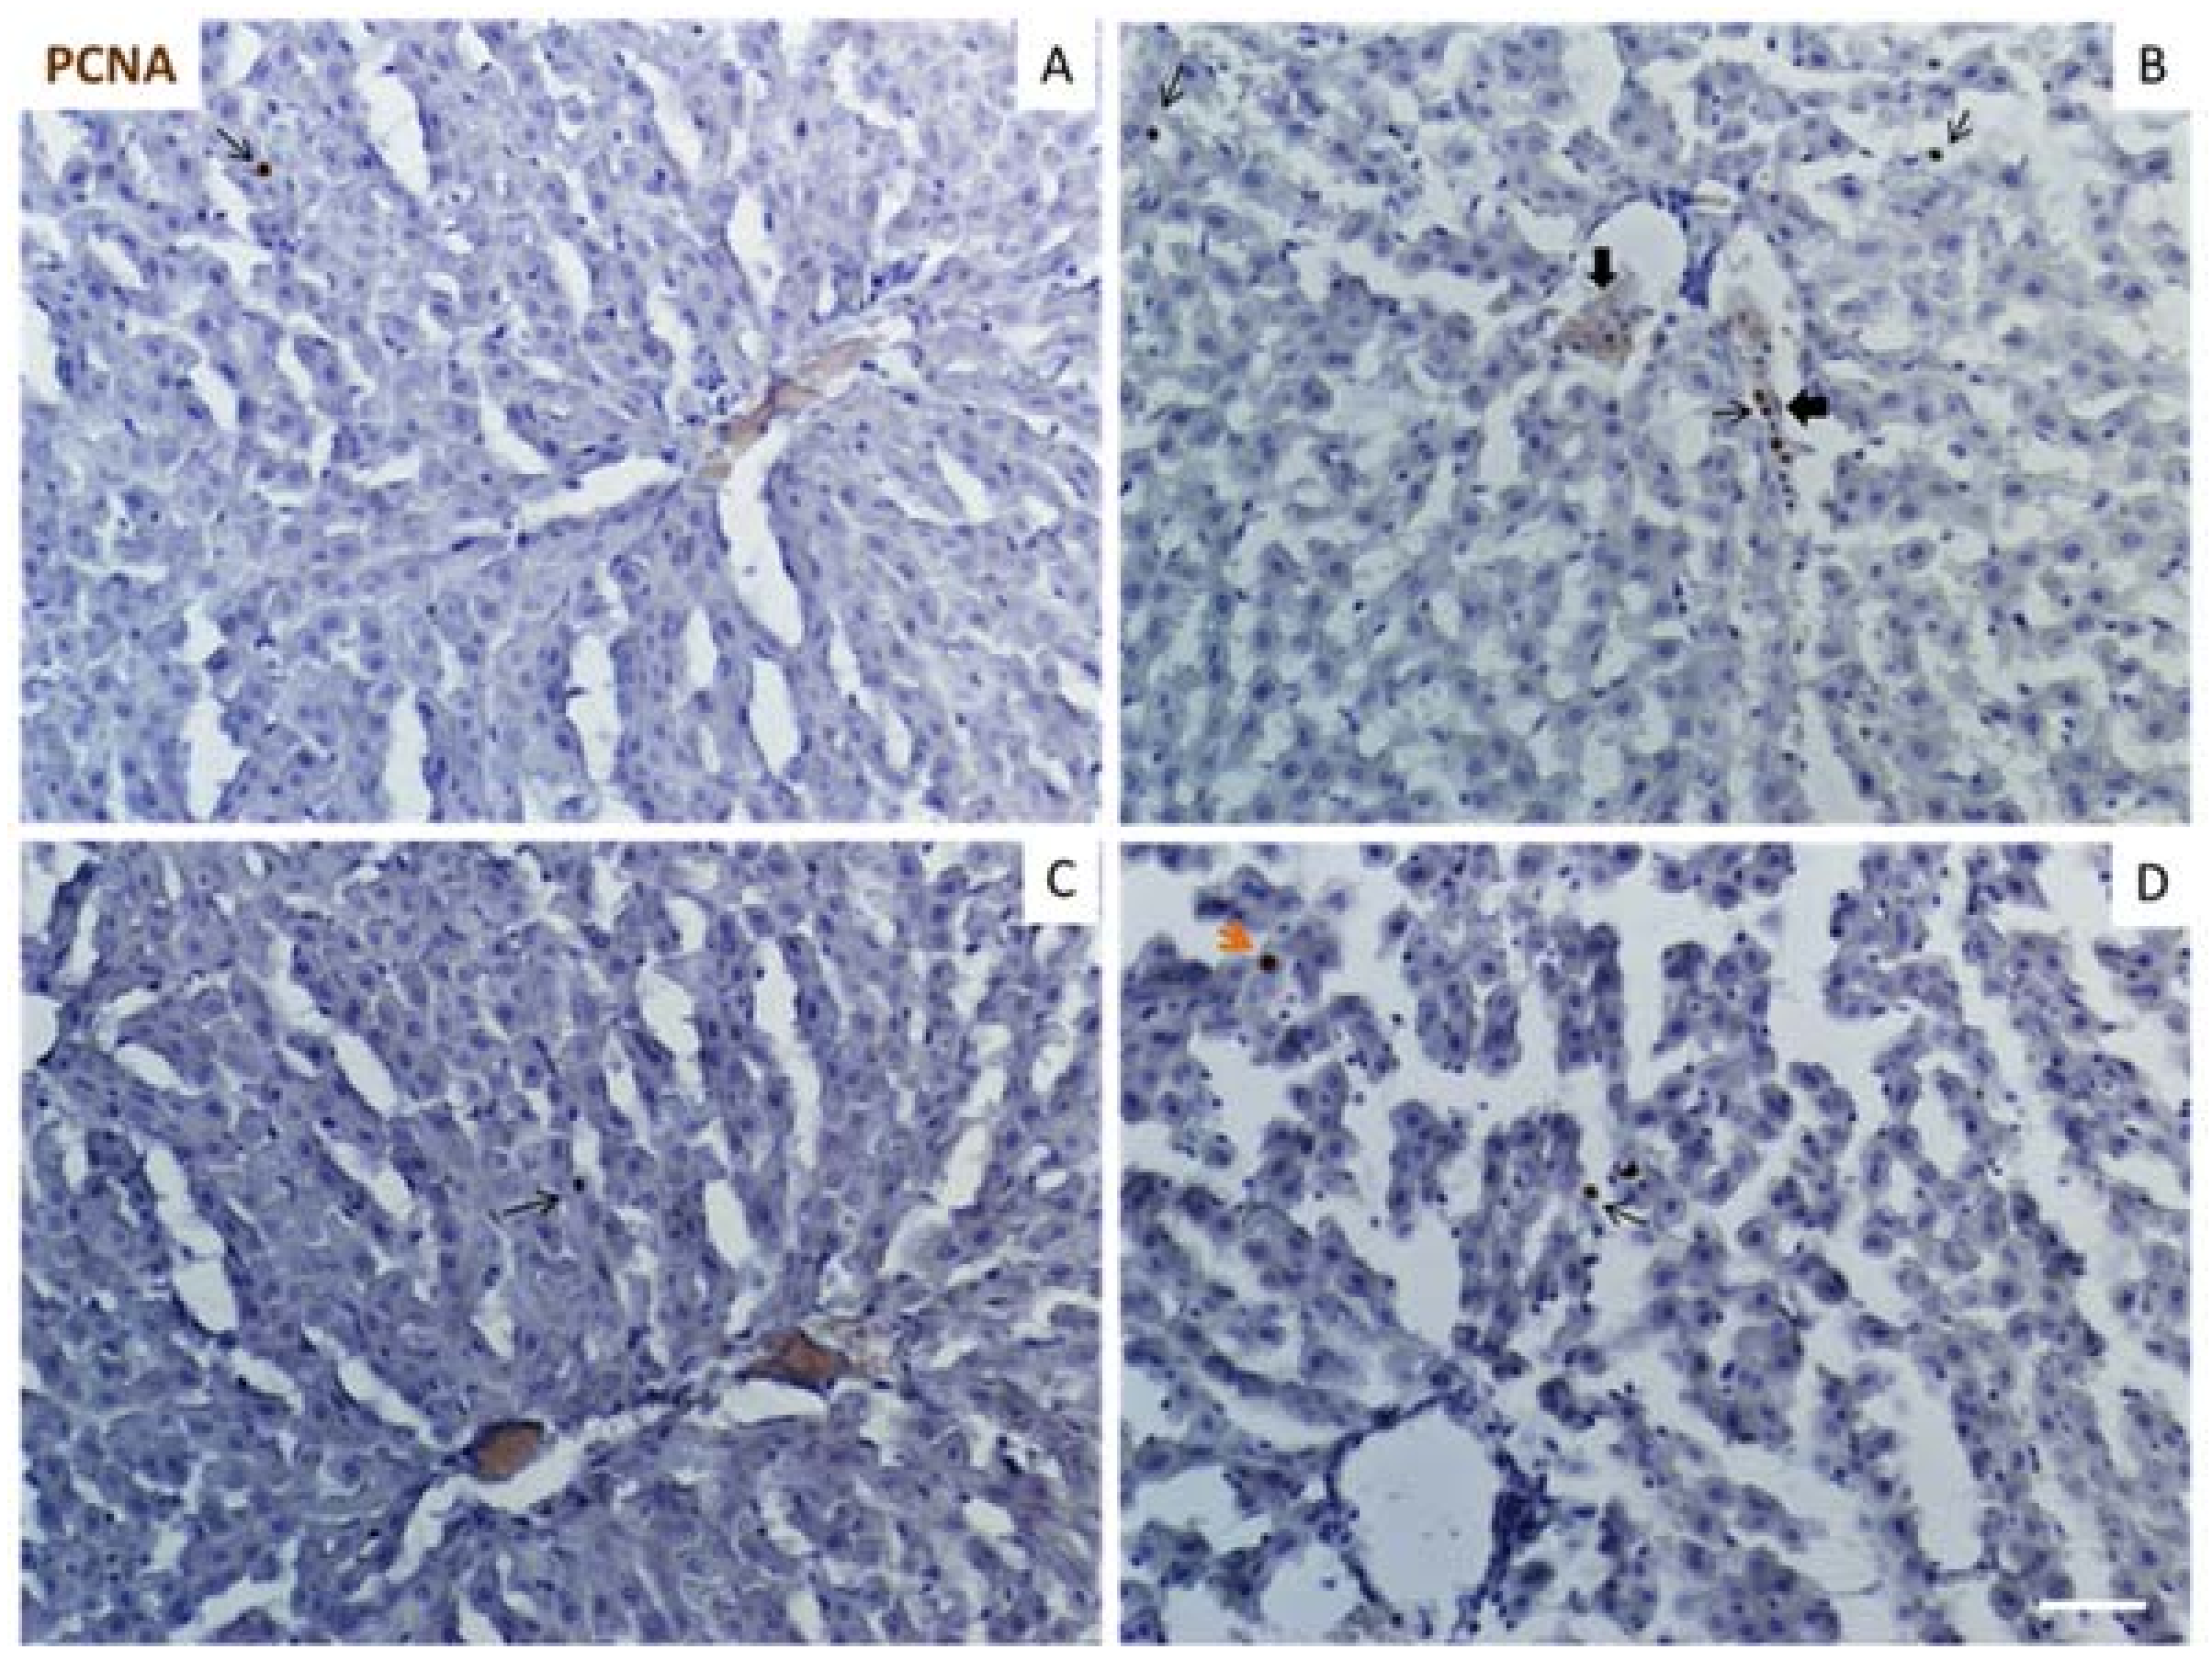
2.6. Apoptosis and Proliferation
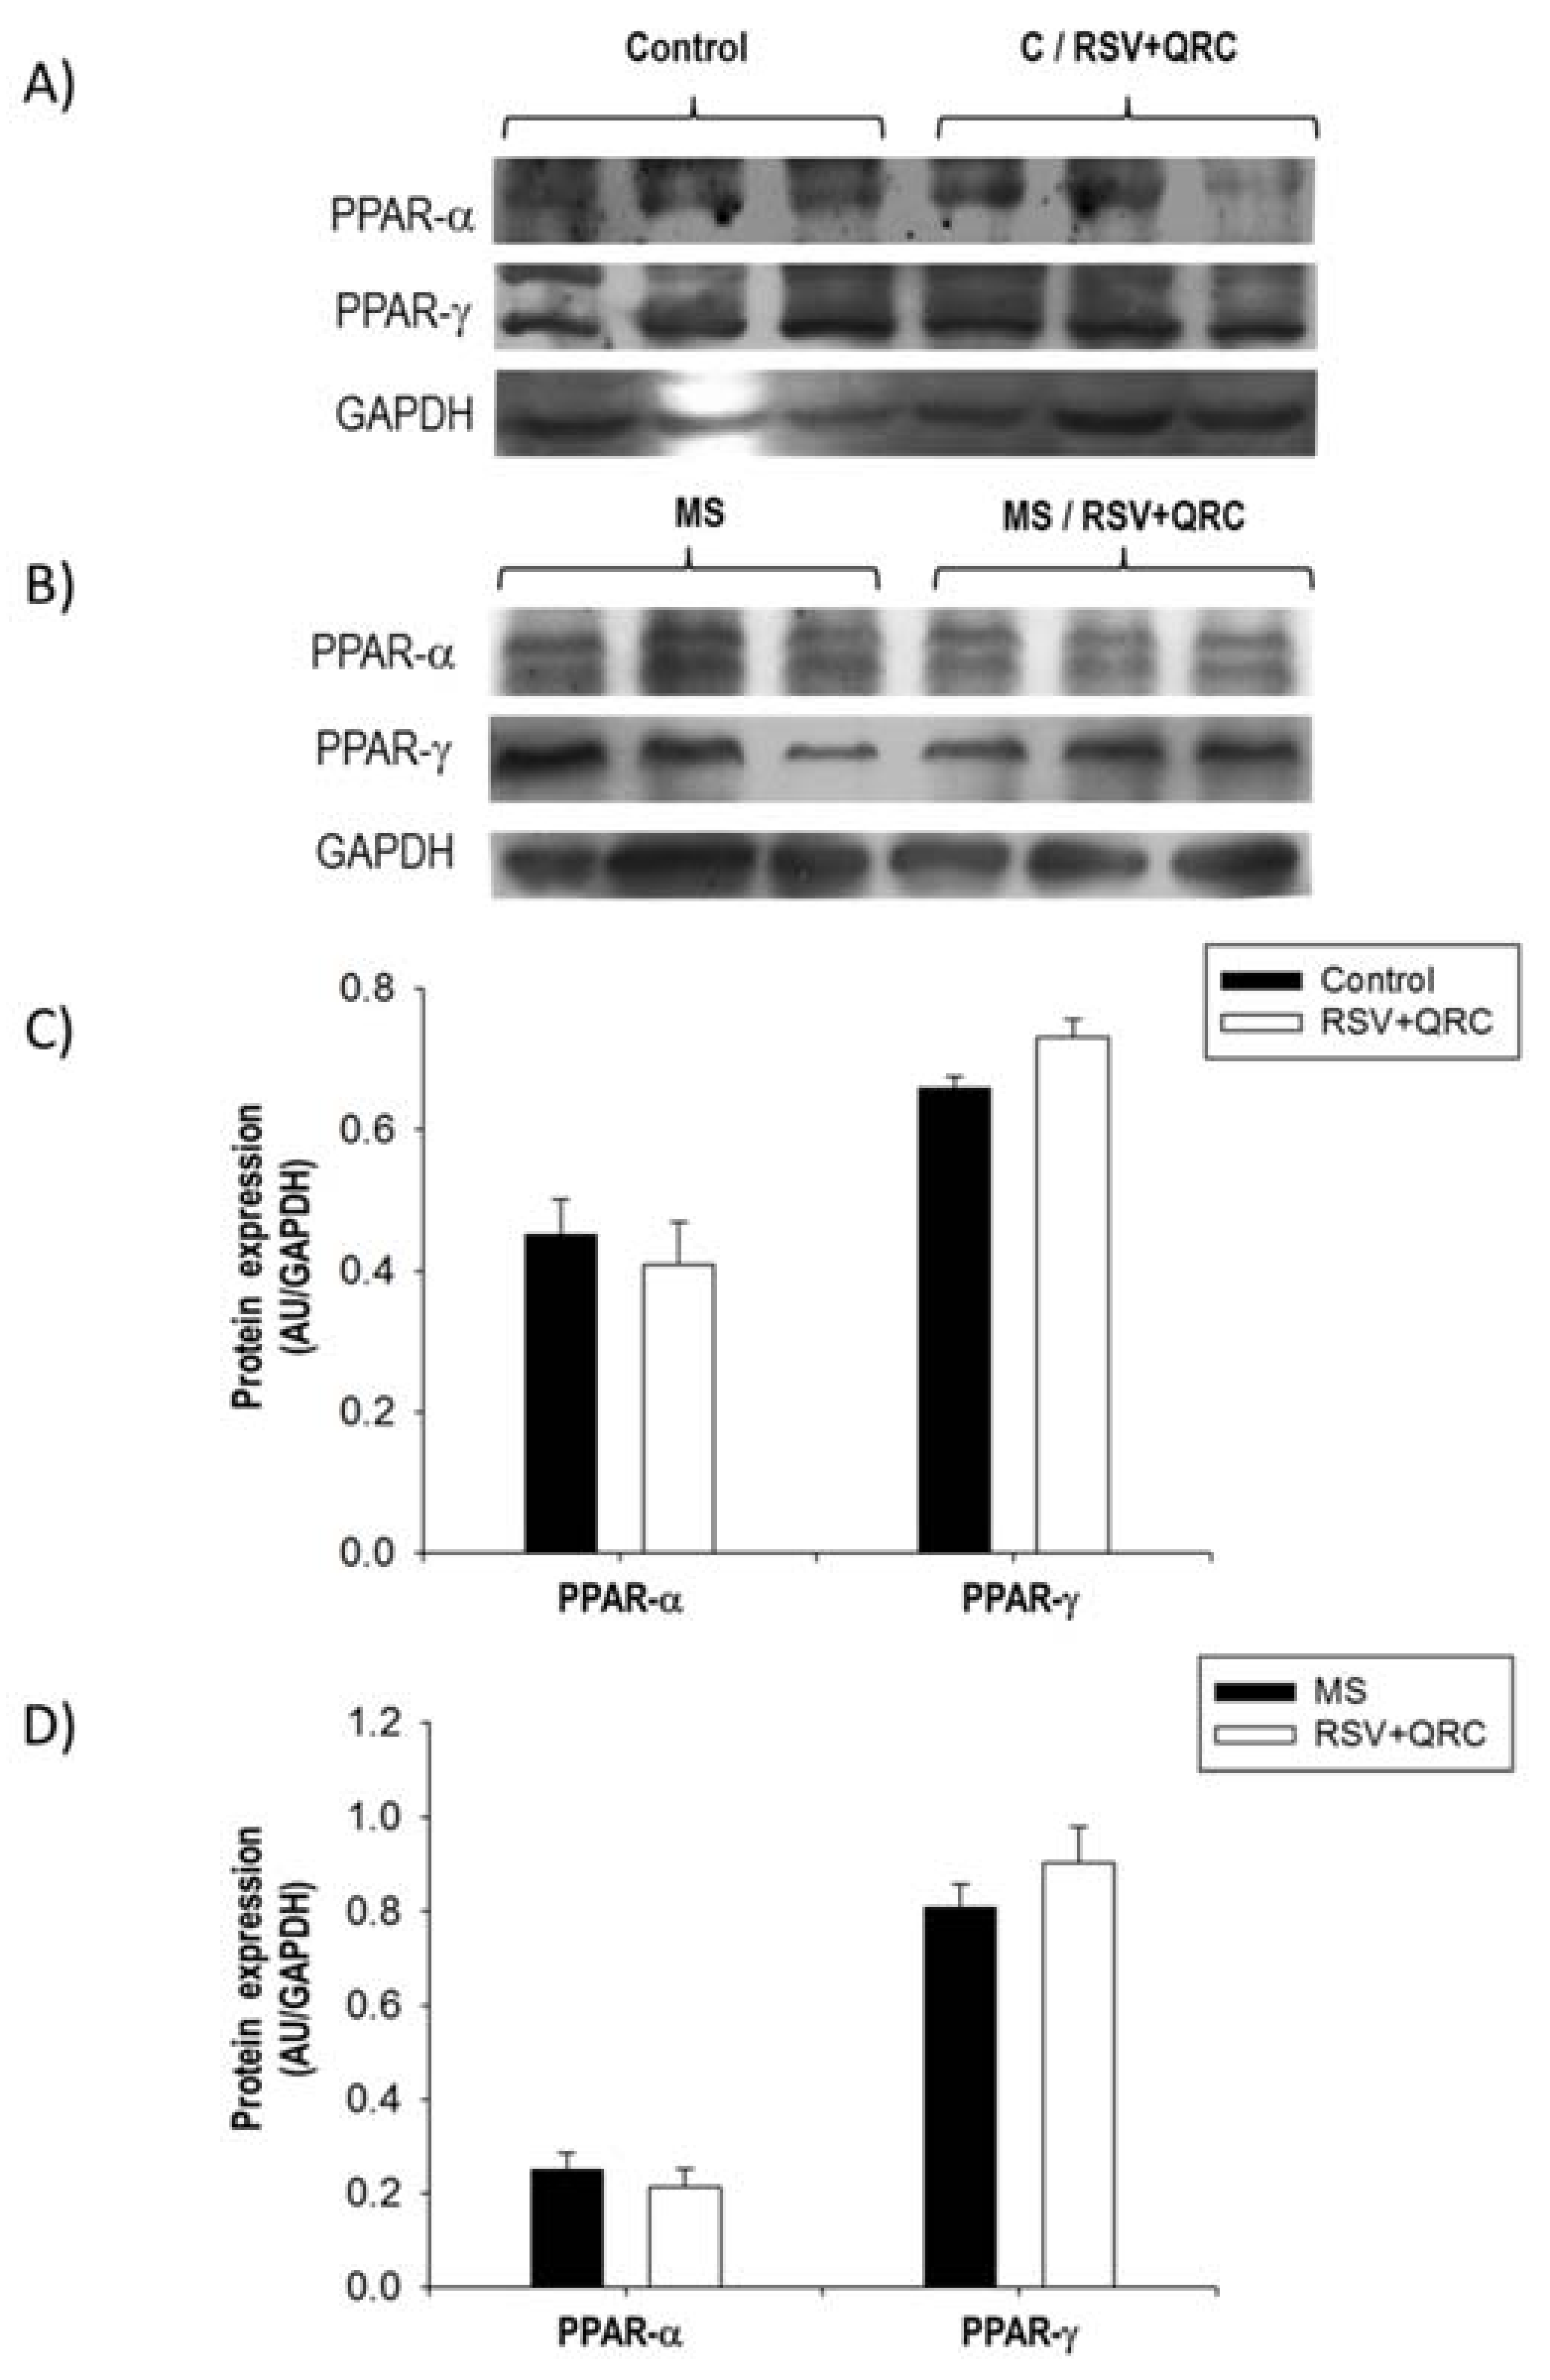
2.7. Expression of PPARs
2.8. Activity of Transaminases
3. Discussion
4. Materials and Methods
4.1. Animals and Surgical Procedures
4.2. Measurement of Serum Biochemical Parameters
4.3. Liver Tissue Preparation and Histological Examinations
4.3.1. Fibrosis Detection
4.3.2. Immunofluorescence
4.3.3. Apoptosis and Proliferation Analysis
4.4. Western Blotting Analysis
4.5. Statistical Analysis
5. Conclusions
Author Contributions
Funding
Institutional Review Board Statement
Informed Consent Statement
Data Availability Statement
Acknowledgments
Conflicts of Interest
References
- Castrejón-Téllez, V.; Villegas-Romero, M.; Rubio-Ruiz, M.E.; Pérez-Torres, I.; Carreón-Torres, E.; Díaz-Díaz, E.; Guarner-Lans, V. Effect of a Resveratrol/Quercetin mixture on the reversion of hypertension induced by a short-term exposure to high sucrose levels near weaning and a long-term exposure that leads to metabolic syndrome in rats. Int. J. Mol Sci. 2020, 21, 2231. [Google Scholar] [CrossRef] [PubMed] [Green Version]
- Rubio-Ruiz, M.E.; Guarner-Lans, V. Inflammation and the use of anti-inflammatory agents in signs and cardiovascular consequences of metabolic syndrome. In Handbook on Metabolic Syndrome. Classification, Risk Factors and Health Impact; Lopez-García, C., Pérez-González, P., Eds.; Nova Biomedical, Nova Science Publishers: New York, NY, USA, 2012; pp. 169–188. [Google Scholar]
- Porras, D.; Nistal, E.; Martínez-Flórez, S.; Pisonero-Vaquero, S.; Olcoz, J.L.; Jover, R.; González-Gallego, J.; García-Mediavilla, M.V.; Sánchez-Campos, S. Protective effect of quercetin on high-fat diet-induced non-alcoholic fatty liver disease in mice is mediated by modulating intestinal microbiota imbalance and related gut-liver axis activation. Free Radic. Biol. Med. 2017, 102, 188–202. [Google Scholar] [CrossRef] [PubMed]
- Lasker, S.; Rahman, M.M.; Parvez, F.; Zamila, M.; Miah, P.; Nahar, K.; Kabir, F.; Sharmin, S.B.; Subhan, N.; Ahsan, G.U.; et al. High-fat diet-induced metabolic syndrome and oxidative stress in obese rats are ameliorated by yogurt supplementation. Sci. Rep. 2019, 9, 20026. [Google Scholar] [CrossRef] [PubMed]
- Jia, L.; Vianna, C.R.; Fukuda, M.; Berglund, E.D.; Liu, C.; Tao, C.; Sun, K.; Liu, T.; Harper, M.J.; Lee, C.E.; et al. Hepatocyte Toll-like receptor 4 regulates obesity-induced inflammation and insulin resistance. Nat. Commun. 2014, 5, 3878. [Google Scholar] [CrossRef] [Green Version]
- Davis, J.E.; Gabler, N.K.; Walker-Daniels, J.; Spurlock, M.E. Tlr-4 deficiency selectively protects against obesity induced by diets high in saturated fat. Obesity 2008, 16, 1248–1255. [Google Scholar] [CrossRef]
- Chaurasia, B.; Talbot, C.L.; Summers, S.A. Adipocyte ceramides-the nexus of inflammation and metabolic disease. Front. Immunol. 2020, 11, 576347. [Google Scholar] [CrossRef]
- Saghazadeh, A.; Rezaei, N. Introductory Chapter: Toll-like Receptors; IntechOpen: London, UK, 2020. [Google Scholar] [CrossRef] [Green Version]
- Kim, J.J.; Sears, D.D. TLR4 and insulin resistance. Gastroenterol. Res. Pract. 2010, 212563. [Google Scholar] [CrossRef] [Green Version]
- Melzig, M.F.; Löser, B.; Ciesielski, S. Inhibition of neutrophil elastase activity by phenolic compounds from plants. Pharmazie 2001, 56, 967–970. [Google Scholar]
- Mansuy-Aubert, V.; Zhou, Q.L.; Xie, X.; Gong, Z.; Huang, J.Y.; Khan, A.R.; Aubert, G.; Candelaria, K.; Thomas, S.; Shin, D.J.; et al. Imbalance between neutrophil elastase and its inhibitor α1-antitrypsin in obesity alters insulin sensitivity, inflammation, and energy expenditure. Cell Metab. 2013, 17, 534–548. [Google Scholar] [CrossRef] [Green Version]
- Talukdar, S.; Oh, D.Y.; Bandyopadhyay, G.; Li, D.; Xu, J.; McNelis, J.; Lu, M.; Li, P.; Yan, Q.; Zhu, Y.; et al. Neutrophils mediate insulin resistance in mice fed a high-fat diet through secreted elastase. Nat. Med. 2012, 18, 1407–1412. [Google Scholar] [CrossRef] [Green Version]
- Huang, Z.; Xie, N.; Illes, P.; Di Virgilio, F.; Ulrich, H.; Semyanov, A.; Verkhratsky, A.; Sperlagh, B.; Yu, S.G.; Huang, C.; et al. From purines to purinergic signalling: Molecular functions and human diseases. Signal Transduct. Target. Ther. 2021, 6, 162. [Google Scholar] [CrossRef]
- Linden, J.; Koch-Nolte, F.; Dahl, G. Purine release, metabolism, and signaling in the inflammatory response. Annu. Rev. Immunol. 2019, 37, 325–347. [Google Scholar] [CrossRef] [PubMed]
- Säve, S.; Persson, K. Extracellular ATP and P2Y receptor activation induce a proinflammatory host response in the human urinary tract. Infect. Immun. 2010, 78, 3609–3615. [Google Scholar] [CrossRef] [Green Version]
- Merz, J.; Albrecht, P.; von Garlen, S.; Ahmed, I.; Dimanski, D.; Wolf, D.; Hilgendorf, I.; Härdtner, C.; Grotius, K.; Willecke, F.; et al. Purinergic receptor Y2 (P2Y2)-dependent VCAM-1 expression promotes immune cell infiltration in metabolic syndrome. Basic Res. Cardiol. 2018, 113, 45. [Google Scholar] [CrossRef] [PubMed]
- Zhang, Y.; Ecelbarger, C.M.; Lesniewski, L.A.; Müller, C.E.; Kishore, B.K. P2Y2 receptor promotes high-fat diet-induced obesity. Front. Endocrinol. 2020, 11, 341. [Google Scholar] [CrossRef] [PubMed]
- Wang, Y.; Nakajima, T.; Gonzalez, F.J.; Tanaka, N. PPARs as metabolic regulators in the liver: Lessons from liver-specific PPAR-null mice. Int. J. Mol Sci. 2020, 21, 2061. [Google Scholar] [CrossRef] [PubMed] [Green Version]
- Mirza, A.Z.; Althagafi, I.I.; Shamshad, H. Role of PPAR receptor in different diseases and their ligands: Physiological importance and clinical implications. Eur. J. Med. Chem. 2019, 166, 502–513. [Google Scholar] [CrossRef]
- Shen, W.; Gao, Y.; Lu, B.; Zhang, Q.; Hu, Y.; Chen, Y. Negatively regulating TLR4/NF-κB signaling via PPARα in endotoxin-induced uveitis. Biochim. Biophys. Acta. 2014, 1842, 1109–1120. [Google Scholar] [CrossRef] [Green Version]
- Necela, B.M.; Su, W.; Thompson, E.A. Toll-like receptor 4 mediates cross-talk between peroxisome proliferator-activated receptor gamma and nuclear factor-kappaB in macrophages. Immunology 2008, 125, 344–358. [Google Scholar] [CrossRef]
- Peredo-Escárcega, A.E.; Guarner-Lans, V.; Pérez-Torres, I.; Ortega-Ocampo, S.; Carreón-Torres, E.; Castrejón-Tellez, V.; Díaz-Díaz, E.; Rubio-Ruiz, M.E. The combination of resveratrol and quercetin attenuates Metabolic Syndrome in rats by modifying the serum fatty acid composition and by upregulating SIRT 1 and SIRT 2 expression in white adipose tissue. Evid. Based Complement. Alternat. Med. 2015, 2015, 474032. [Google Scholar] [CrossRef] [Green Version]
- Faghihzadeh, F.; Hekmatdoost, A.; Adibi, P. Resveratrol and liver: A systematic review. J. Res. Med. Sci. 2015, 20, 797–810. [Google Scholar] [CrossRef] [PubMed]
- Rubio-Ruiz, M.E.; Guarner-Lans, V.; Cano-Martínez, A.; Díaz-Díaz, E.; Manzano-Pech, L.; Gamas-Magaña, A.; Castrejón-Tellez, V.; Tapia-Cortina, C.; Pérez-Torres, I. Resveratrol and Quercetin administration improves antioxidant DEFENSES and reduces fatty liver in metabolic syndrome rats. Molecules 2019, 24, 1297. [Google Scholar] [CrossRef] [PubMed] [Green Version]
- Burnstock, G. Purinergic signalling: Therapeutic developments. Front. Pharmacol. 2017, 8, 661. [Google Scholar] [CrossRef] [PubMed] [Green Version]
- Kaulich, M.; Streicher, F.; Mayer, R.; Müller, I.; Müller, E. Flavonoids F novel lead compounds for the development of P2Y2 receptor antagonists. Drug Dev. Res. 2003, 59, 72–81. [Google Scholar] [CrossRef]
- Faria, R.; Ferreira, L.; Bezerra, R.; Frutuoso, V.; Alves, L. Action of natural products on p2 receptors: A reinvented era for drug discovery. Molecules 2012, 17, 13009–13025. [Google Scholar] [CrossRef] [Green Version]
- Izzo, C.; Annunziata, M.; Melara, G.; Sciorio, R.; Dallio, M.; Masarone, M.; Federico, A.; Persico, M. The role of resveratrol in liver disease: A comprehensive review from in vitro to clinical trials. Nutrients 2021, 13, 933. [Google Scholar] [CrossRef] [PubMed]
- Castrejón-Tellez, V.; Rodríguez-Pérez, J.M.; Pérez-Torres, I.; Pérez-Hernández, N.; Cruz-Lagunas, A.; Guarner-Lans, V.; Vargas-Alarcón, G.; Rubio-Ruiz, M.E. The effect of resveratrol and quercetin treatment on PPAR mediated uncoupling protein (UCP-) 1, 2, and 3 expression in visceral white adipose tissue from metabolic syndrome rats. Int. J. Mol. Sci. 2016, 17, 1069. [Google Scholar] [CrossRef] [Green Version]
- Benomar, Y.; Taouis, M. Molecular mechanisms underlying obesity-induced hypothalamic inflammation and insulin resistance: Pivotal role of resistin/TLR4 pathways. Front. Endocrinol. 2019, 10, 140. [Google Scholar] [CrossRef] [Green Version]
- Ma, J.Q.; Li, Z.; Xie, W.R.; Liu, C.M.; Liu, S.S. Quercetin protects mouse liver against CCl4-induced inflammation by the TLR2/4 and MAPK/NF-κB pathway. Int. Immunopharmacol. 2015, 28, 531–539. [Google Scholar] [CrossRef]
- Xiong, G.; Ji, W.; Wang, F.; Zhang, F.; Xue, P.; Cheng, M.; Sun, Y.; Wang, X.; Zhang, T. Quercetin inhibits inflammatory response induced by LPS from Porphyromonas gingivalis in human gingival fibroblasts via suppressing NF-κB signaling pathway. BioMed Res. Int. 2019, 2019, 6282635. [Google Scholar] [CrossRef] [PubMed] [Green Version]
- Zhang, Y.; Li, X.; Zhang, H.; Zhao, Z.; Peng, Z.; Wang, Z.; Liu, G.; Li, X. Non-Esterified Fatty Acids over-activate the TLR2/4-NF-Κb signaling pathway to increase inflammatory cytokine synthesis in neutrophils from ketotic cows. Cell Physiol. Biochem. 2018, 48, 827–837. [Google Scholar] [CrossRef] [PubMed]
- Gimeno-Mallench, L.; Mas-Bargues, C.; Inglés, M.; Olaso, G.; Borras, C.; Gambini, J.; Vina, J. Resveratrol shifts energy metabolism to increase lipid oxidation in healthy old mice. Biomed. Pharmacother. 2019, 118, 109130. [Google Scholar] [CrossRef] [PubMed]
- Uchida, Y.; Freitas, M.C.; Zhao, D.; Busuttil, R.W.; Kupiec-Weglinski, J.W. The inhibition of neutrophil elastase ameliorates mouse liver damage due to ischemia and reperfusion. Liver Transpl. 2009, 15, 939–947. [Google Scholar] [CrossRef] [PubMed] [Green Version]
- Coutinho-Silva, R.; Stahl, L.; Cheung, K.K.; de Campos, N.E.; de Oliveira Souza, C.; Ojcius, D.M.; Burnstock, G. P2X and P2Y purinergic receptors on human intestinal epithelial carcinoma cells: Effects of extracellular nucleotides on apoptosis and cell proliferation. Am. J. Physiol. Gastrointest. Liver Physiol. 2005, 288, G1024–G1035. [Google Scholar] [CrossRef] [Green Version]
- Wang, P.; Jia, J.; Zhang, D. Purinergic signalling in liver diseases: Pathological functions and therapeutic opportunities. JHEP Rep. 2020, 2, 100165. [Google Scholar] [CrossRef]
- Li, X.; Jin, Q.; Yao, Q.; Xu, B.; Li, L.; Zhang, S.; Tu, C. The flavonoid quercetin ameliorates liver inflammation and fibrosis by regulating hepatic macrophages activation and polarization in mice. Front. Pharmacol. 2018, 9, 72. [Google Scholar] [CrossRef] [Green Version]
- Araújo Miguel, N.; Franco Andrade, S.; Nai, G.; Braga Laposy, C.; Franco Nascimento, F.; Rangel Dinallo, H.; Melchert, A. Effects of resveratrol on liver function of obese female wistar rats. Cienc. Anim. Bras. 2016, 17, 402–410. [Google Scholar] [CrossRef] [Green Version]
- Zhu, M.; Zhou, X.; Zhao, J. Quercetin prevents alcohol-induced liver injury through targeting of PI3K/Akt/nuclear factor-κB and STAT3 signaling pathway. Exp. Ther. Med. 2017, 14, 6169–6175. [Google Scholar] [CrossRef] [Green Version]
- Okay, E.; Simsek, T.; Subasi, C.; Gunes, A.; Duruksu, G.; Gurbuz, Y.; Gacar, G.; Karaoz, E. Cross effects of resveratrol and mesenchymal stem cells on liver regeneration and homing in partially hepatectomized rats. Stem. Cell Rev. Rep. 2015, 11, 322–331. [Google Scholar] [CrossRef]
- Sun, H.; Zhu, X.; Lin, W.; Zhou, Y.; Cai, W.; Qiu, L. Interactions of TLR4 and PPARγ, dependent on AMPK signalling pathway contribute to anti-inflammatory effects of Vaccariae hypaphorine in endothelial cells. Cell Physiol. Biochem. 2017, 42, 1227–1239. [Google Scholar] [CrossRef] [Green Version]
- Hassan, N.F.; Nada, S.A.; Hassan, A.; El-Ansary, M.R.; Al-Shorbagy, M.Y.; Abdelsalam, R.M. Saroglitazar deactivates the hepatic LPS/TLR4 signaling pathway and ameliorates adipocyte dysfunction in rats with high-fat emulsion/LPS model-induced Non-alcoholic steatohepatitis. Inflammation 2019, 42, 1056–1070. [Google Scholar] [CrossRef] [PubMed]
- Montagner, A.; Polizzi, A.; Fouché, E.; Ducheix, S.; Lippi, Y.; Lasserre, F.; Barquissau, V.; Régnier, M.; Lukowicz, C.; Benhamed, F.; et al. Liver PPARα is crucial for whole-body fatty acid homeostasis and is protective against NAFLD. Gut 2016, 65, 1202–1214. [Google Scholar] [CrossRef] [Green Version]
- Li, J.; Guo, C.; Wu, J. The agonists of Peroxisome Proliferator-Activated Receptor-γ for liver fibrosis. Drug Des. Devel. Ther. 2021, 15, 2619–2628. [Google Scholar] [CrossRef]
- Stienstra, R.; Saudale, F.; Duval, C.; Keshtkar, S.; Groener, J.E.; van Rooijen, N.; Staels, B.; Kersten, S.; Müller, M. Kupffer cells promote hepatic steatosis via interleukin-1beta-dependent suppression of peroxisome proliferator-activated receptor alpha activity. Hepatology 2010, 51, 511–522. [Google Scholar] [CrossRef]
- Brocker, C.N.; Yue, J.; Kim, D.; Qu, A.; Bonzo, J.A.; Gonzalez, F.J. Hepatocyte-specific PPARA expression exclusively promotes agonist-induced cell proliferation without influence from nonparenchymal cells. Am. J. Physiol. Gastrointest. Liver Physiol. 2017, 312, G283–G299. [Google Scholar] [CrossRef] [PubMed]
- Xu, Y.; Han, J.; Dong, J.; Fan, X.; Cai, Y.; Li, J.; Wang, T.; Zhou, J.; Shang, J. Metabolomics characterizes the effects and mechanisms of Quercetin in nonalcoholic fatty liver disease development. Int. J. Mol. Sci. 2019, 20, 1220. [Google Scholar] [CrossRef] [Green Version]
- Bergmeyer, H.U.; Hørder, M.; Rej, R. International Federation of Clinical Chemistry (IFCC) Scientific Committee, Analytical Section: Approved recommendation (1985) on IFCC methods for the measurement of catalytic concentration of enzymes. Part 2. IFCC method for aspartate aminotransferase (L-aspartate: 2-oxoglutarate aminotransferase, EC 2.6.1.1). J. Clin. Chem. Clin. Biochem. 1986, 24, 497–510. [Google Scholar]
- Bradford, M.M. A rapid and sensitive method for the quantitation of microgram quantities of protein utilizing the principle of protein-dye binding. Anal. Biochem. 1976, 72, 248–254. [Google Scholar] [CrossRef]


| Control | Control/RSV + QRC | MS | MS/RSV + QRC | |
|---|---|---|---|---|
| Weight (g) | 492.7 ± 11.2 | 507.3 ± 15.7 | 583.3 ± 12.9 a | 441.3 ± 9.3 b |
| Central adiposity (g) | 5.2 ± 0.7 | 6.1 ± 0.9 | 13.1 ± 0.5 a | 8.1 ± 1.4 b |
| Blood pressure (mm Hg) | 101.7 ± 2.5 | 106.7 ± 2.4 | 143.6 ± 1.0 a | 113.2 ± 1.3 b |
| Glucose (mg/dL) | 92.1 ± 0.9 | 91.7 ± 0.8 | 96.5 ± 1.9 | 93.3 ± 1.0 |
| Total Cholesterol (mg/dL) | 56.2 ± 1.7 | 59.4 ± 3.2 | 64.1 ± 1.4 | 62.1 ± 0.8 |
| Triglycerides (mg/dL) | 83.6 ± 6.7 | 78.9 ± 4.2 | 145.2 ± 6.2 a | 98.3 ± 5.2 b |
| Insulin (ng/mL) | 0.15 ± 0.04 | 0.13 ± 0.02 | 0.48 ± 0.05 a | 0.17 ± 0.02 b |
| HOMA index | 0.91 ± 0.2 | 0.62 ± 0.12 | 2.41 ± 0.3 a | 0.7 ± 0.06 b |
| Leptin (ng/dL) | 2.6 ± 0.3 | 2.3 ± 0.1 | 5.3 ± 0.4 a | 4.1 ± 0.8 |
| Adiponectin (μg/mL) | 4.2 ± 0.3 | 3.8 ± 0.1 | 6.5 ± 0.5 a | 5.9 ± 0.3 |
| Control | Control/RSV + QRC | MS | MS/RSV + QRC | |
|---|---|---|---|---|
| ALT (U/L) | 17.6 ± 3.2 | 21.0 ± 1.7 | 42.2 ± 9.1 a | 14.2 ± 2.5 b |
| AST (U/L) | 114.4 ± 8.4 | 87.2 ± 16.5 | 112.3 ± 15.6 | 103.7 ± 13.3 |
| GGT (U/L) | 4.8 ± 1.2 | 2.4 ± 1.5 | 4.8 ± 1.2 | 2.4 ± 1.5 |
| ALP (U/L) | 55.5 ± 3.7 | 60.0 ± 7.8 | 73.0 ± 5.4 a | 50 ± 4.0 b |
Publisher’s Note: MDPI stays neutral with regard to jurisdictional claims in published maps and institutional affiliations. |
© 2021 by the authors. Licensee MDPI, Basel, Switzerland. This article is an open access article distributed under the terms and conditions of the Creative Commons Attribution (CC BY) license (https://creativecommons.org/licenses/by/4.0/).
Share and Cite
Cano-Martínez, A.; Bautista-Pérez, R.; Castrejón-Téllez, V.; Carreón-Torres, E.; Pérez-Torres, I.; Díaz-Díaz, E.; Flores-Estrada, J.; Guarner-Lans, V.; Rubio-Ruíz, M.E. Resveratrol and Quercetin as Regulators of Inflammatory and Purinergic Receptors to Attenuate Liver Damage Associated to Metabolic Syndrome. Int. J. Mol. Sci. 2021, 22, 8939. https://doi.org/10.3390/ijms22168939
Cano-Martínez A, Bautista-Pérez R, Castrejón-Téllez V, Carreón-Torres E, Pérez-Torres I, Díaz-Díaz E, Flores-Estrada J, Guarner-Lans V, Rubio-Ruíz ME. Resveratrol and Quercetin as Regulators of Inflammatory and Purinergic Receptors to Attenuate Liver Damage Associated to Metabolic Syndrome. International Journal of Molecular Sciences. 2021; 22(16):8939. https://doi.org/10.3390/ijms22168939
Chicago/Turabian StyleCano-Martínez, Agustina, Rocío Bautista-Pérez, Vicente Castrejón-Téllez, Elizabeth Carreón-Torres, Israel Pérez-Torres, Eulises Díaz-Díaz, Javier Flores-Estrada, Verónica Guarner-Lans, and María Esther Rubio-Ruíz. 2021. "Resveratrol and Quercetin as Regulators of Inflammatory and Purinergic Receptors to Attenuate Liver Damage Associated to Metabolic Syndrome" International Journal of Molecular Sciences 22, no. 16: 8939. https://doi.org/10.3390/ijms22168939