
A New Smoothened Antagonist Bearing the Purine Scaffold Shows Antitumour Activity In Vitro and In Vivo

 , , , , , , ,
Abstract
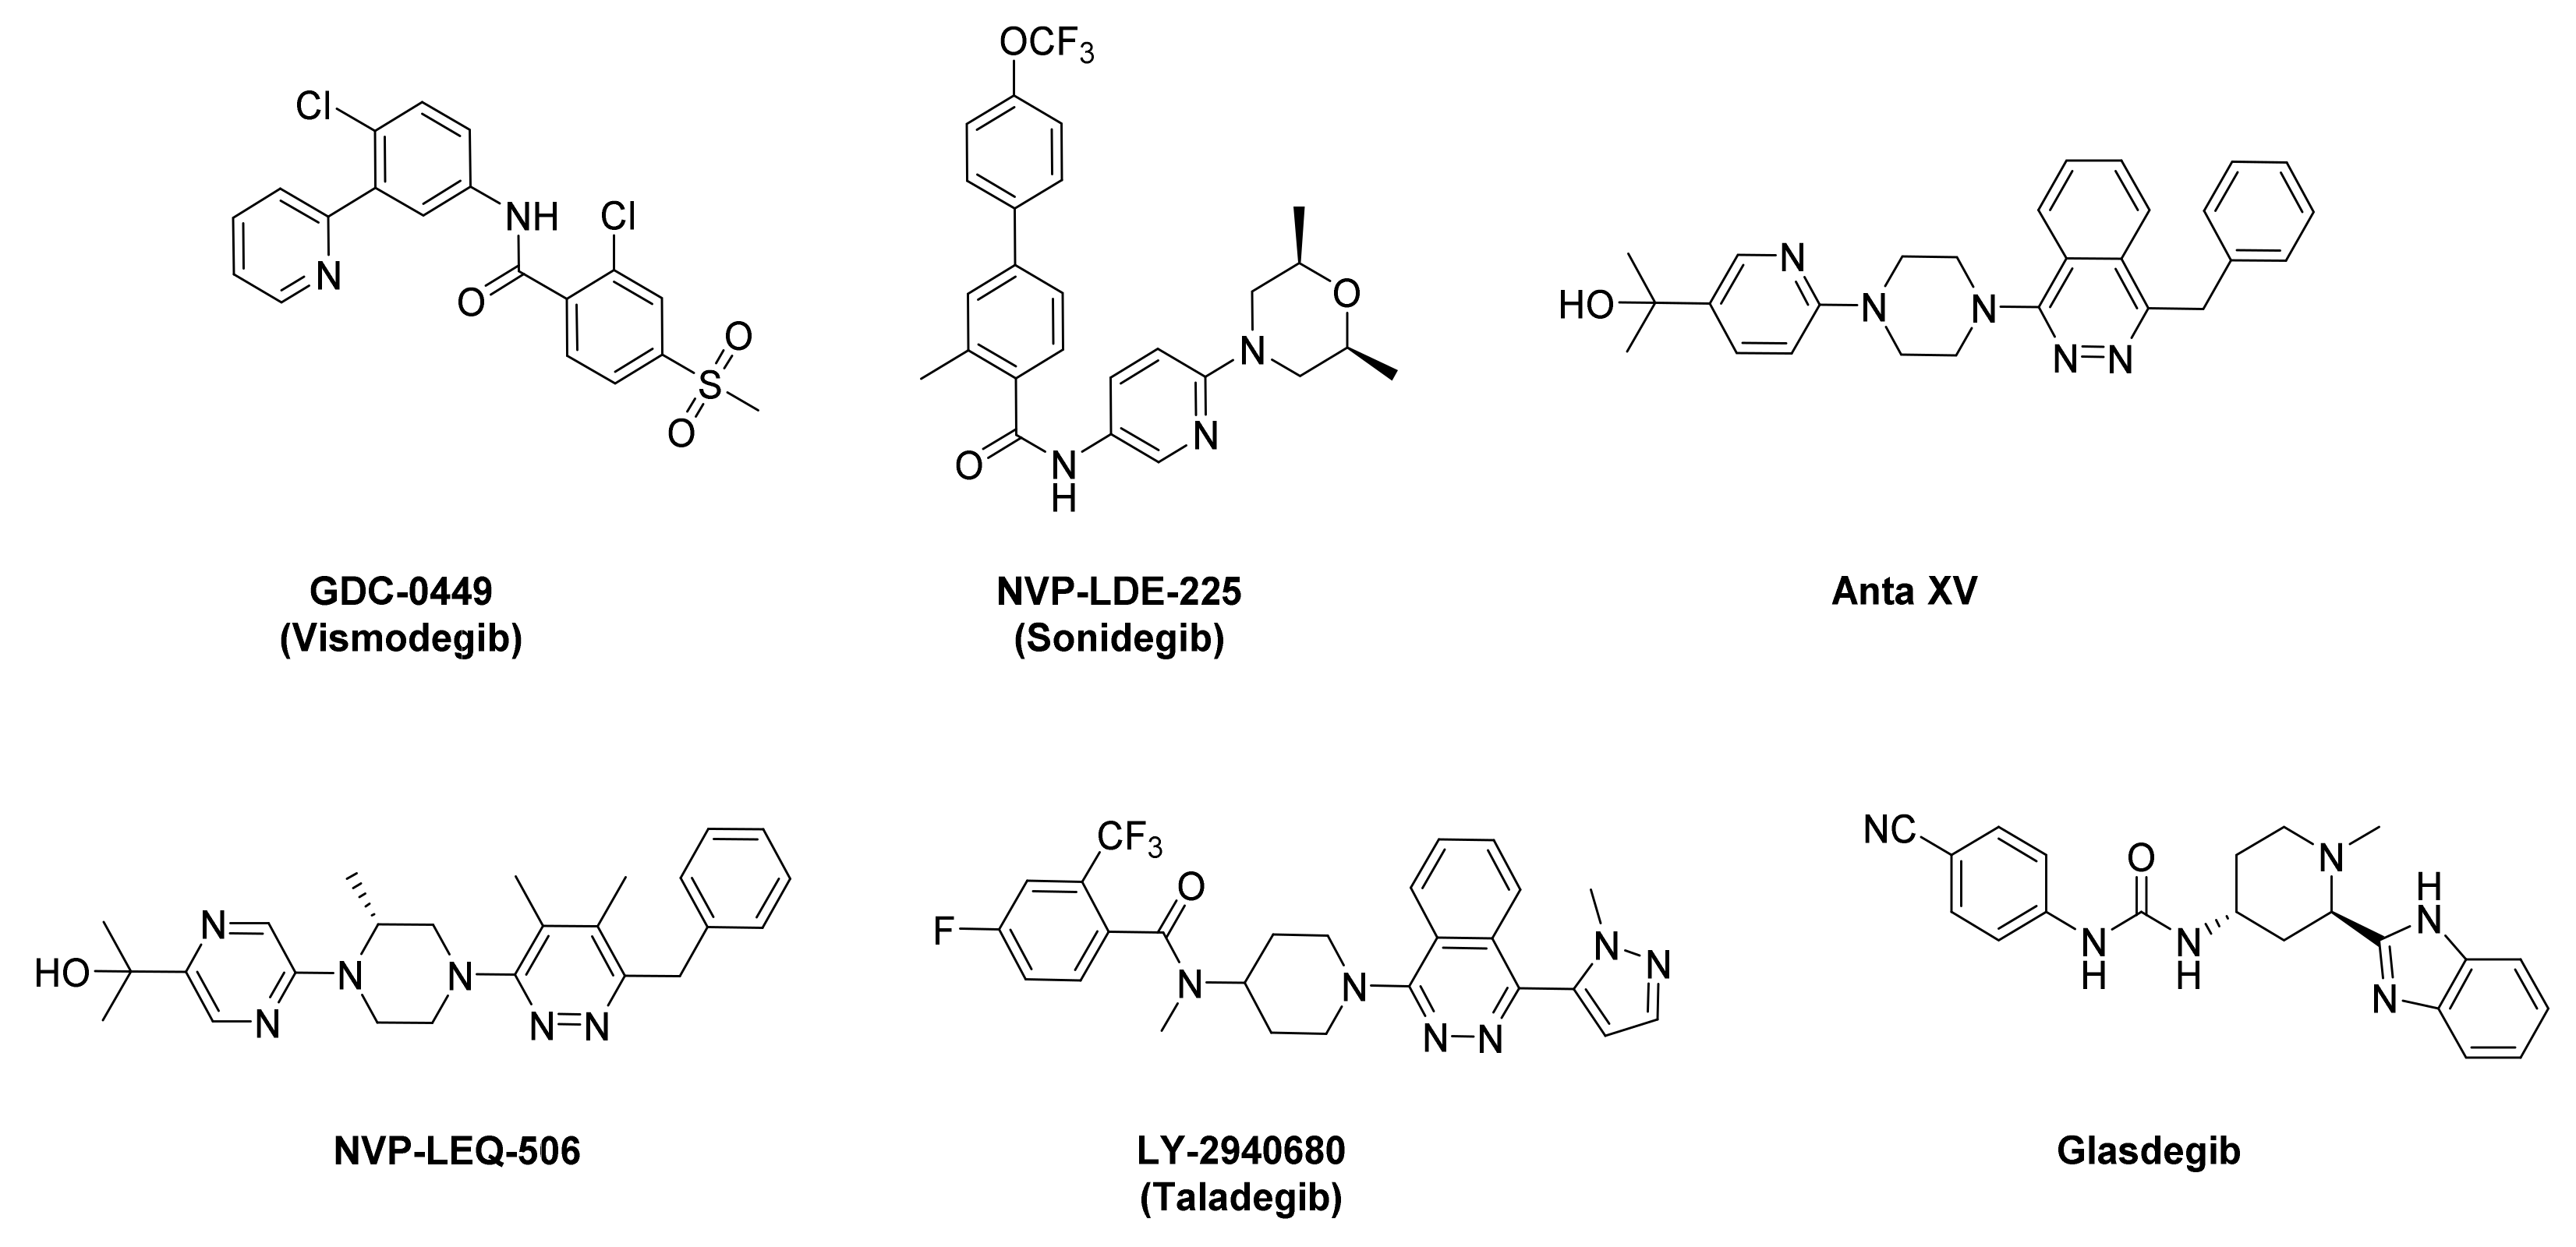
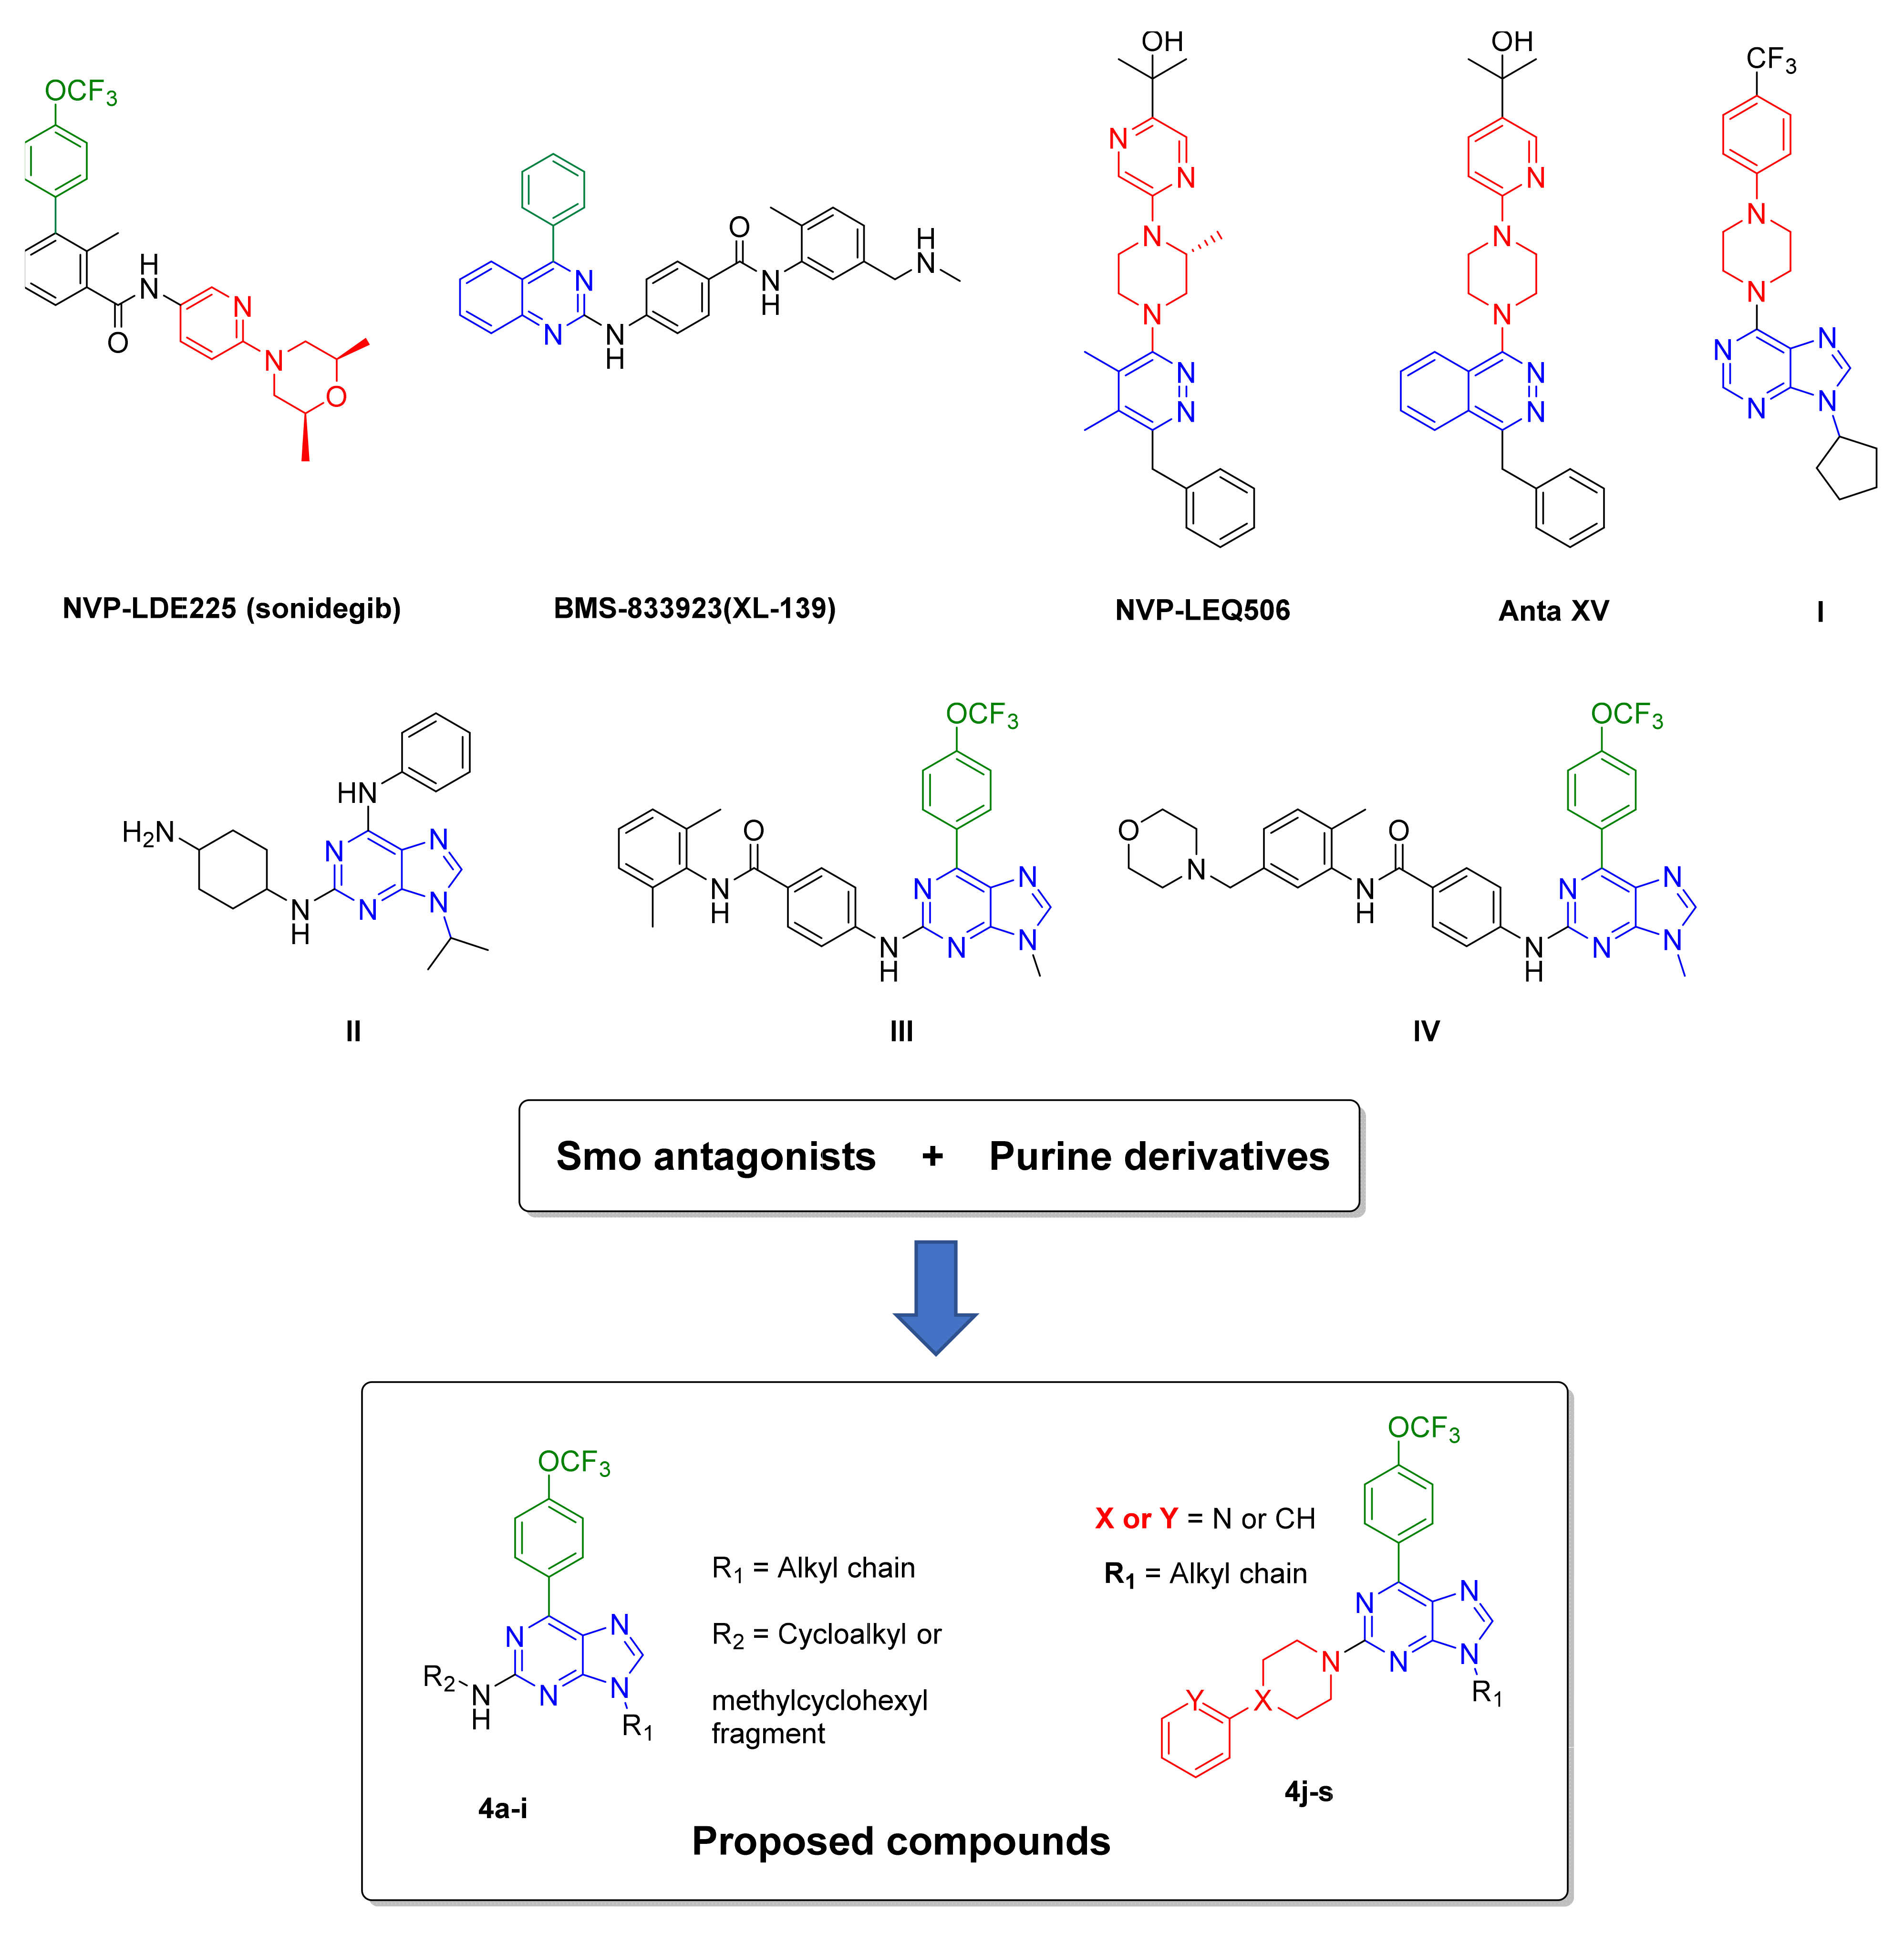
:1. Introduction
2. Results
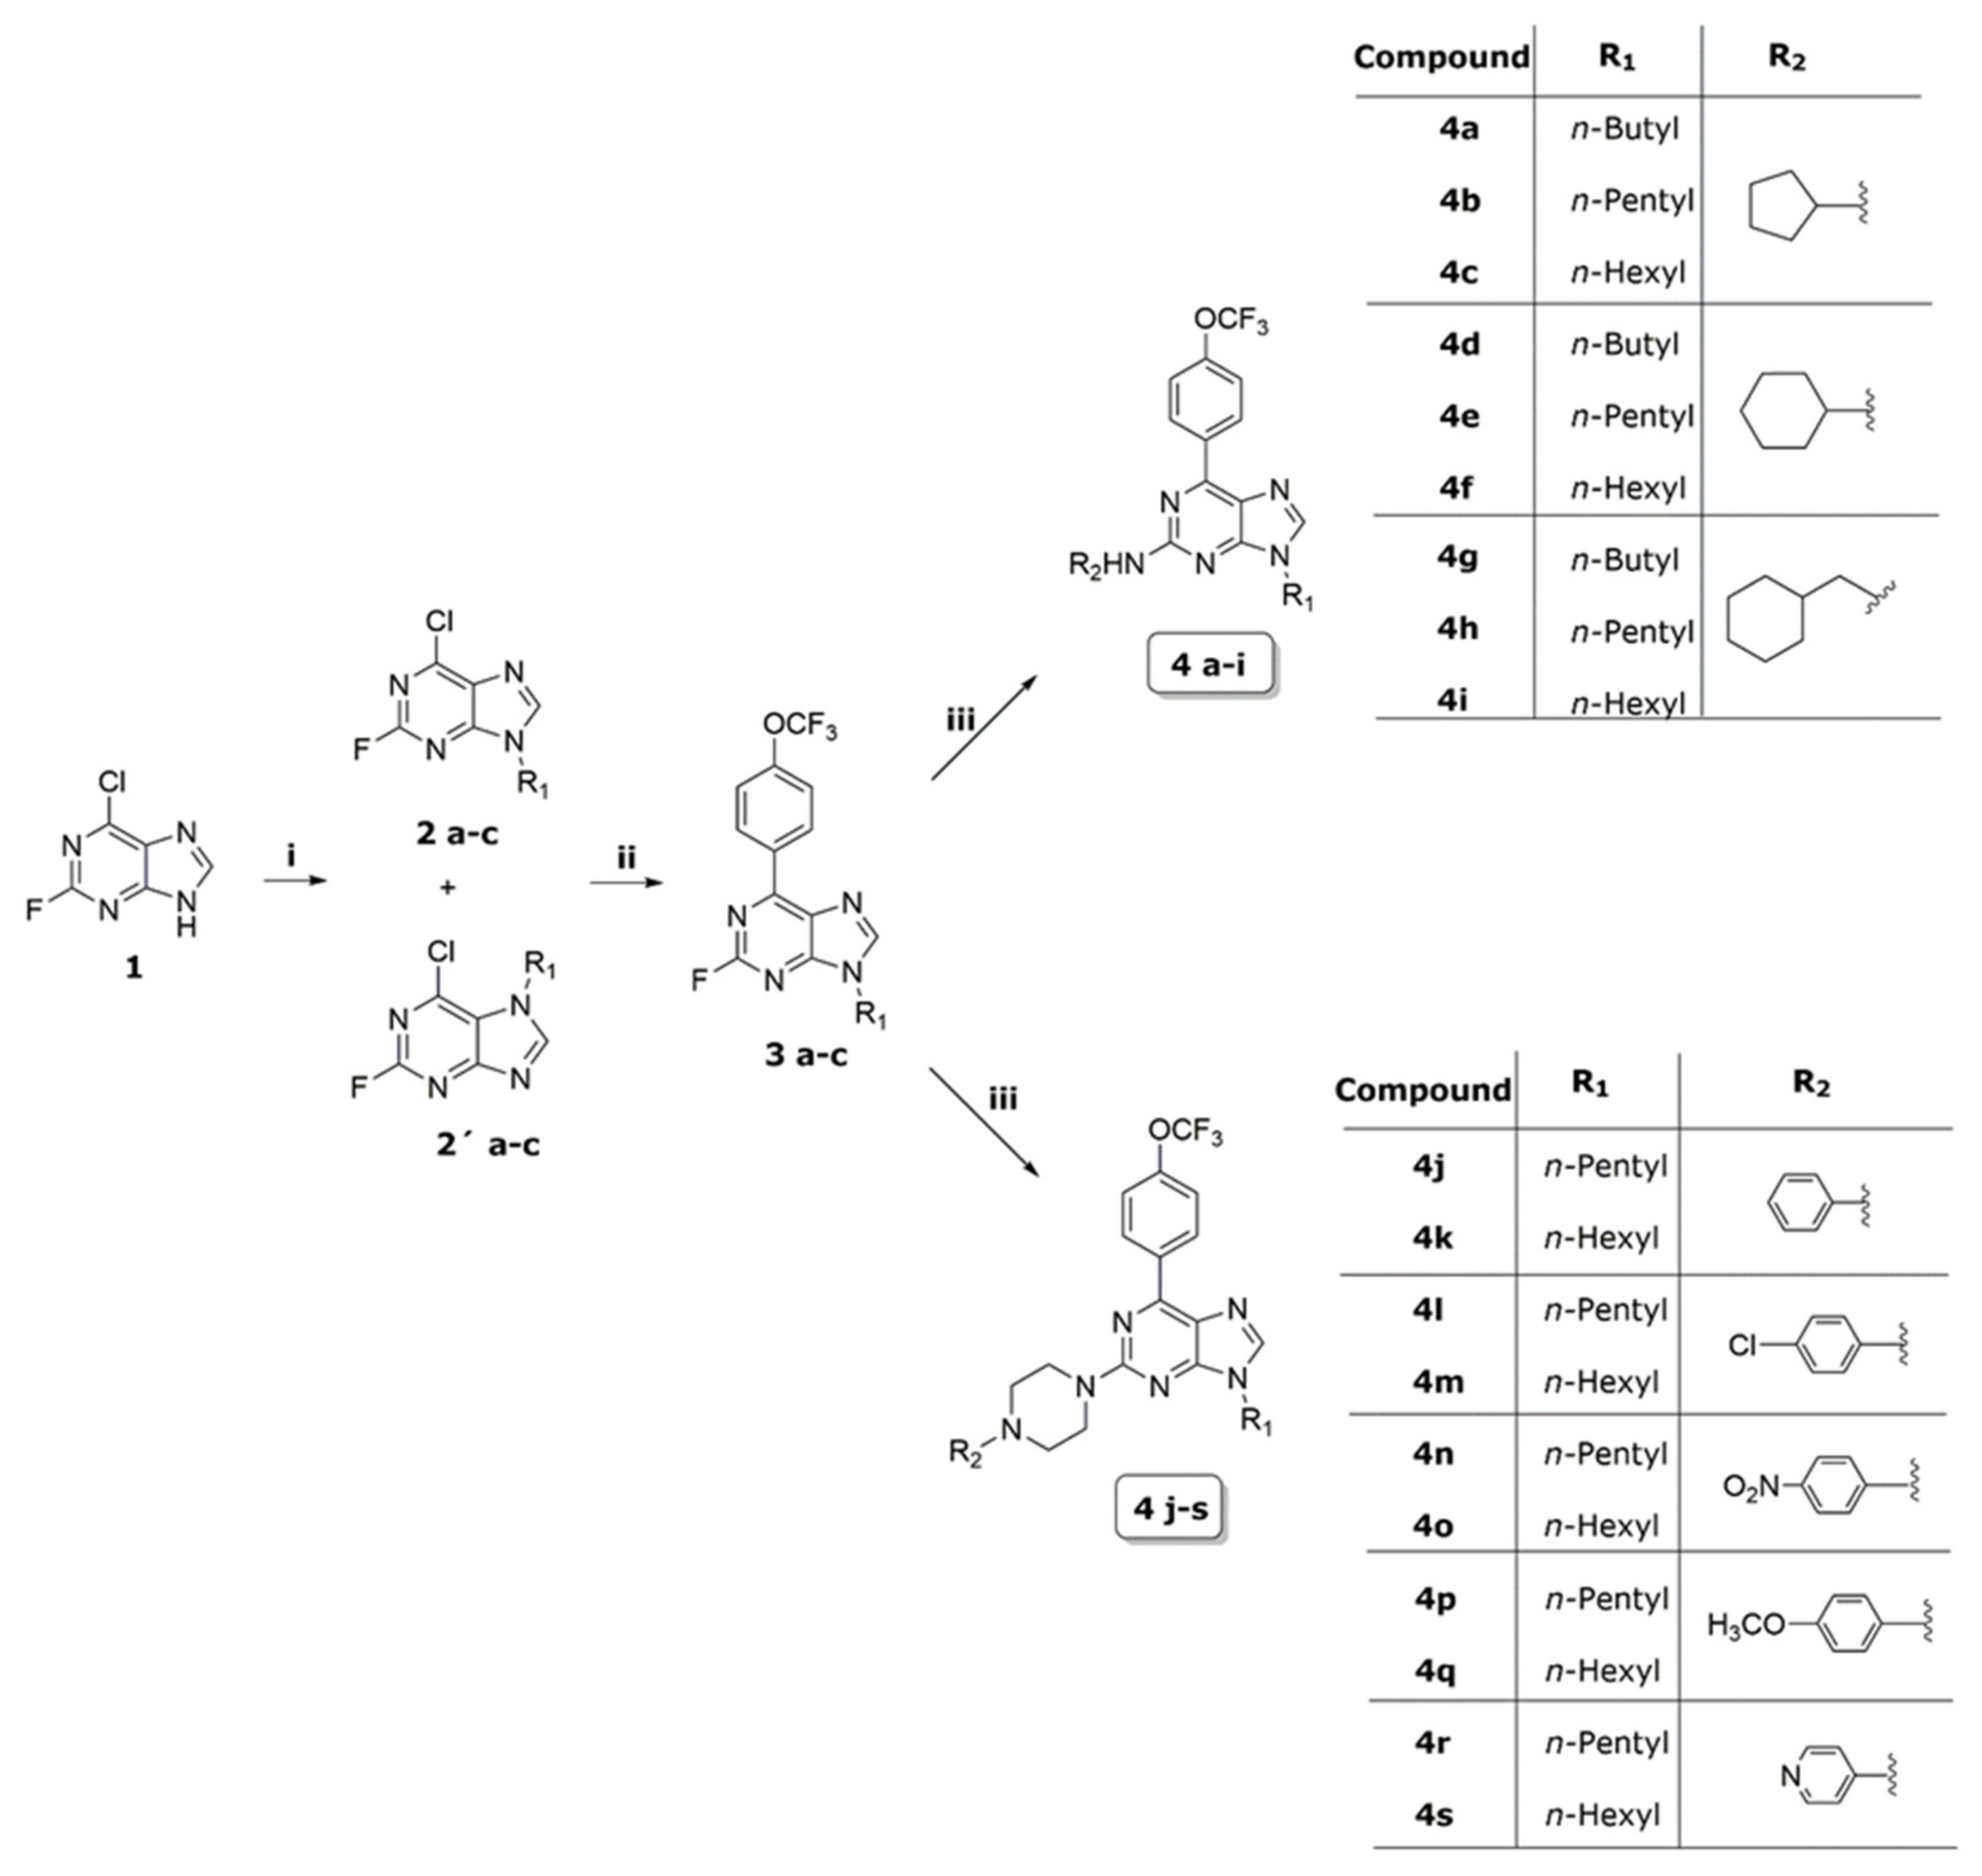
2.1. Synthesis
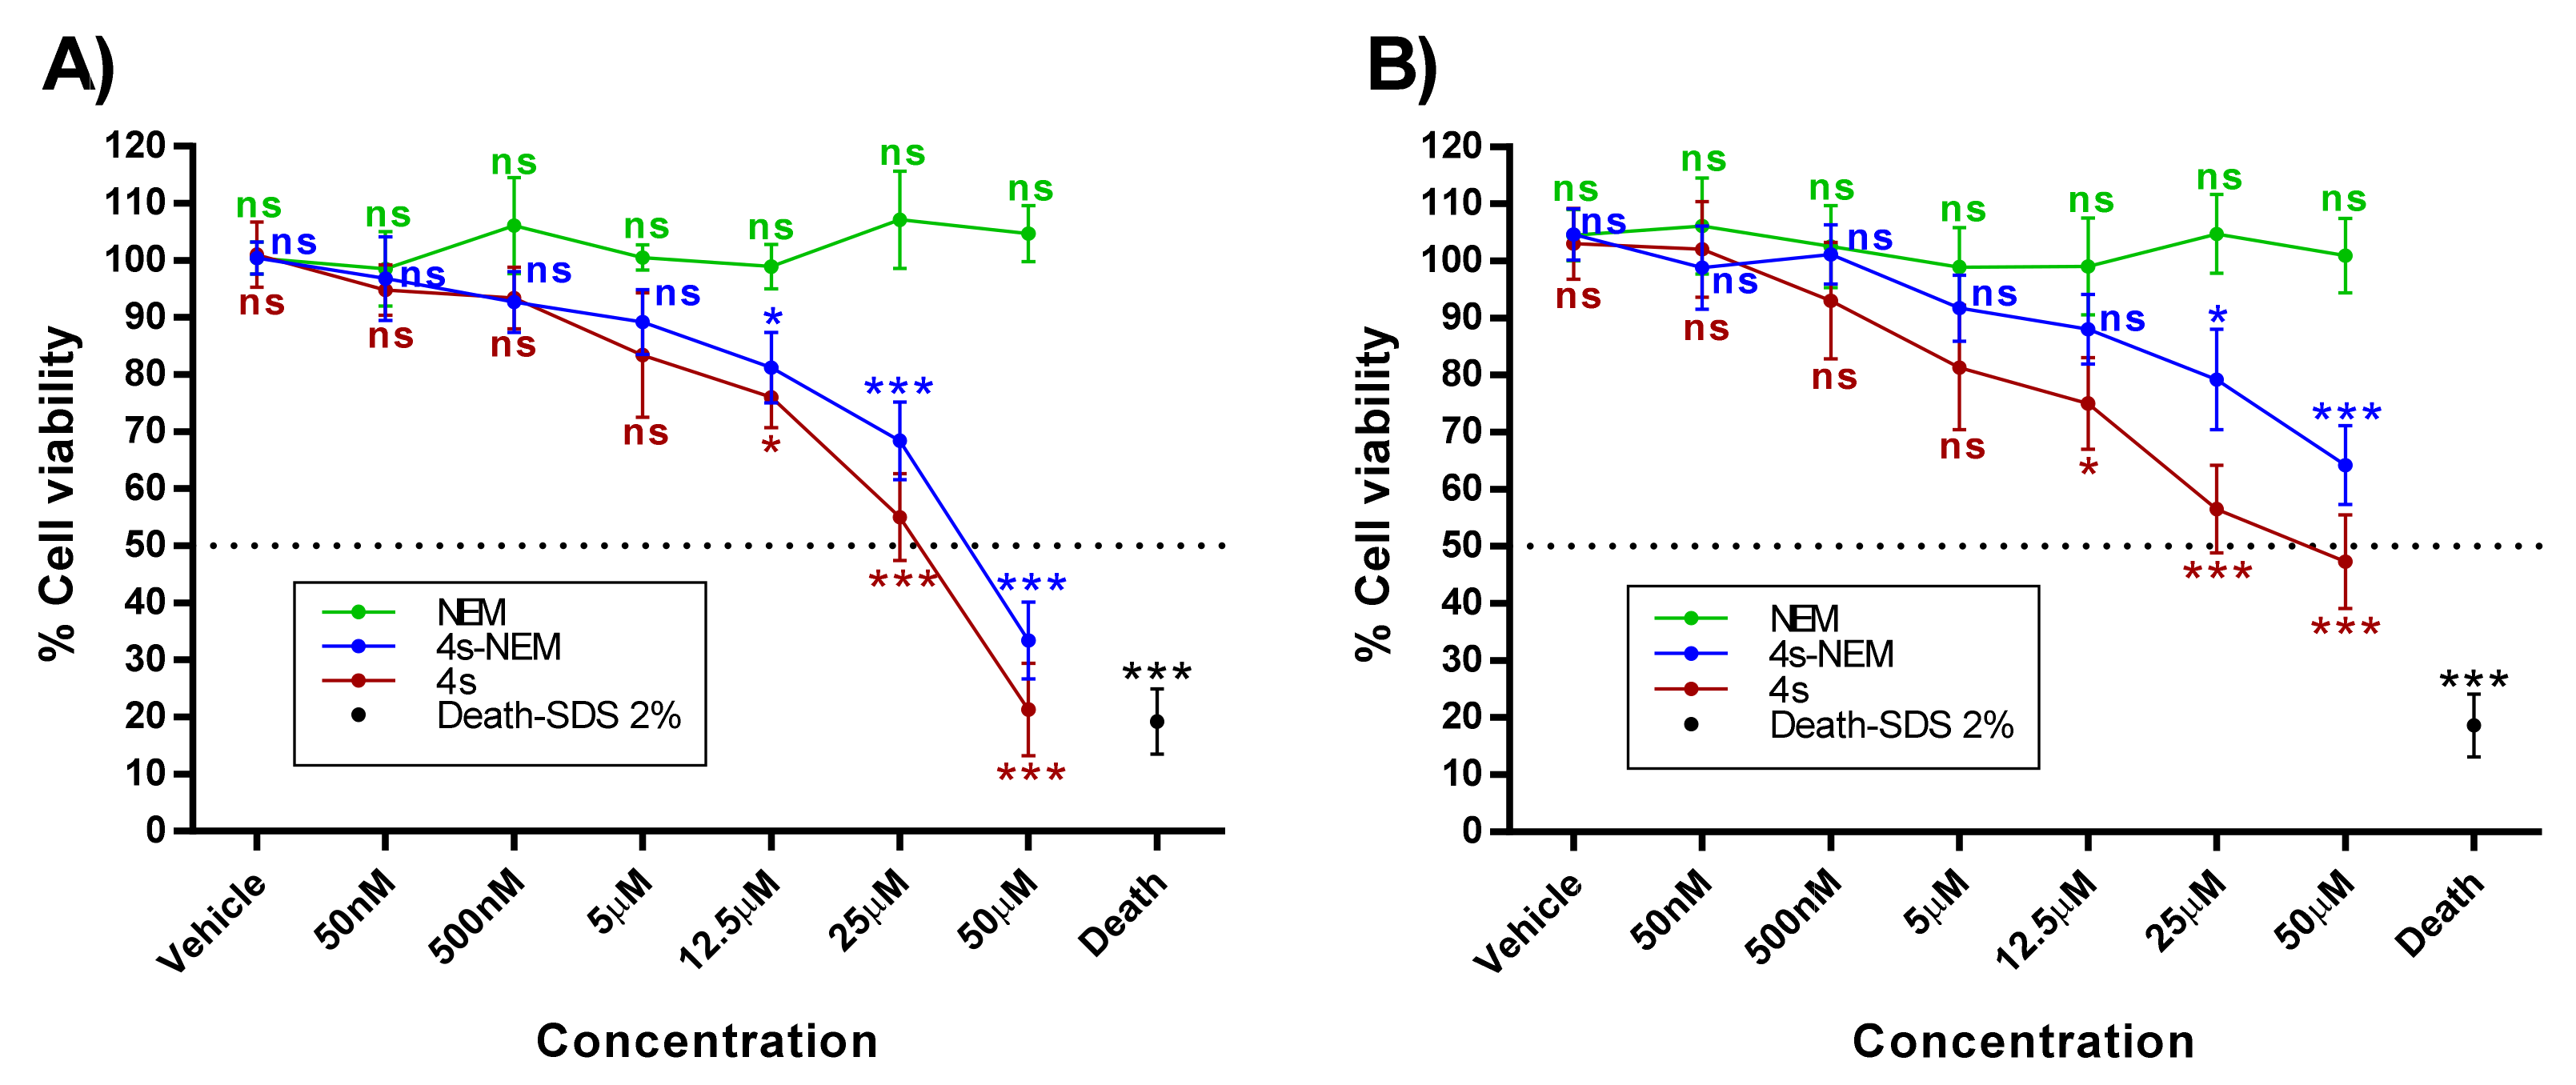
2.2. Cytotoxic Studies
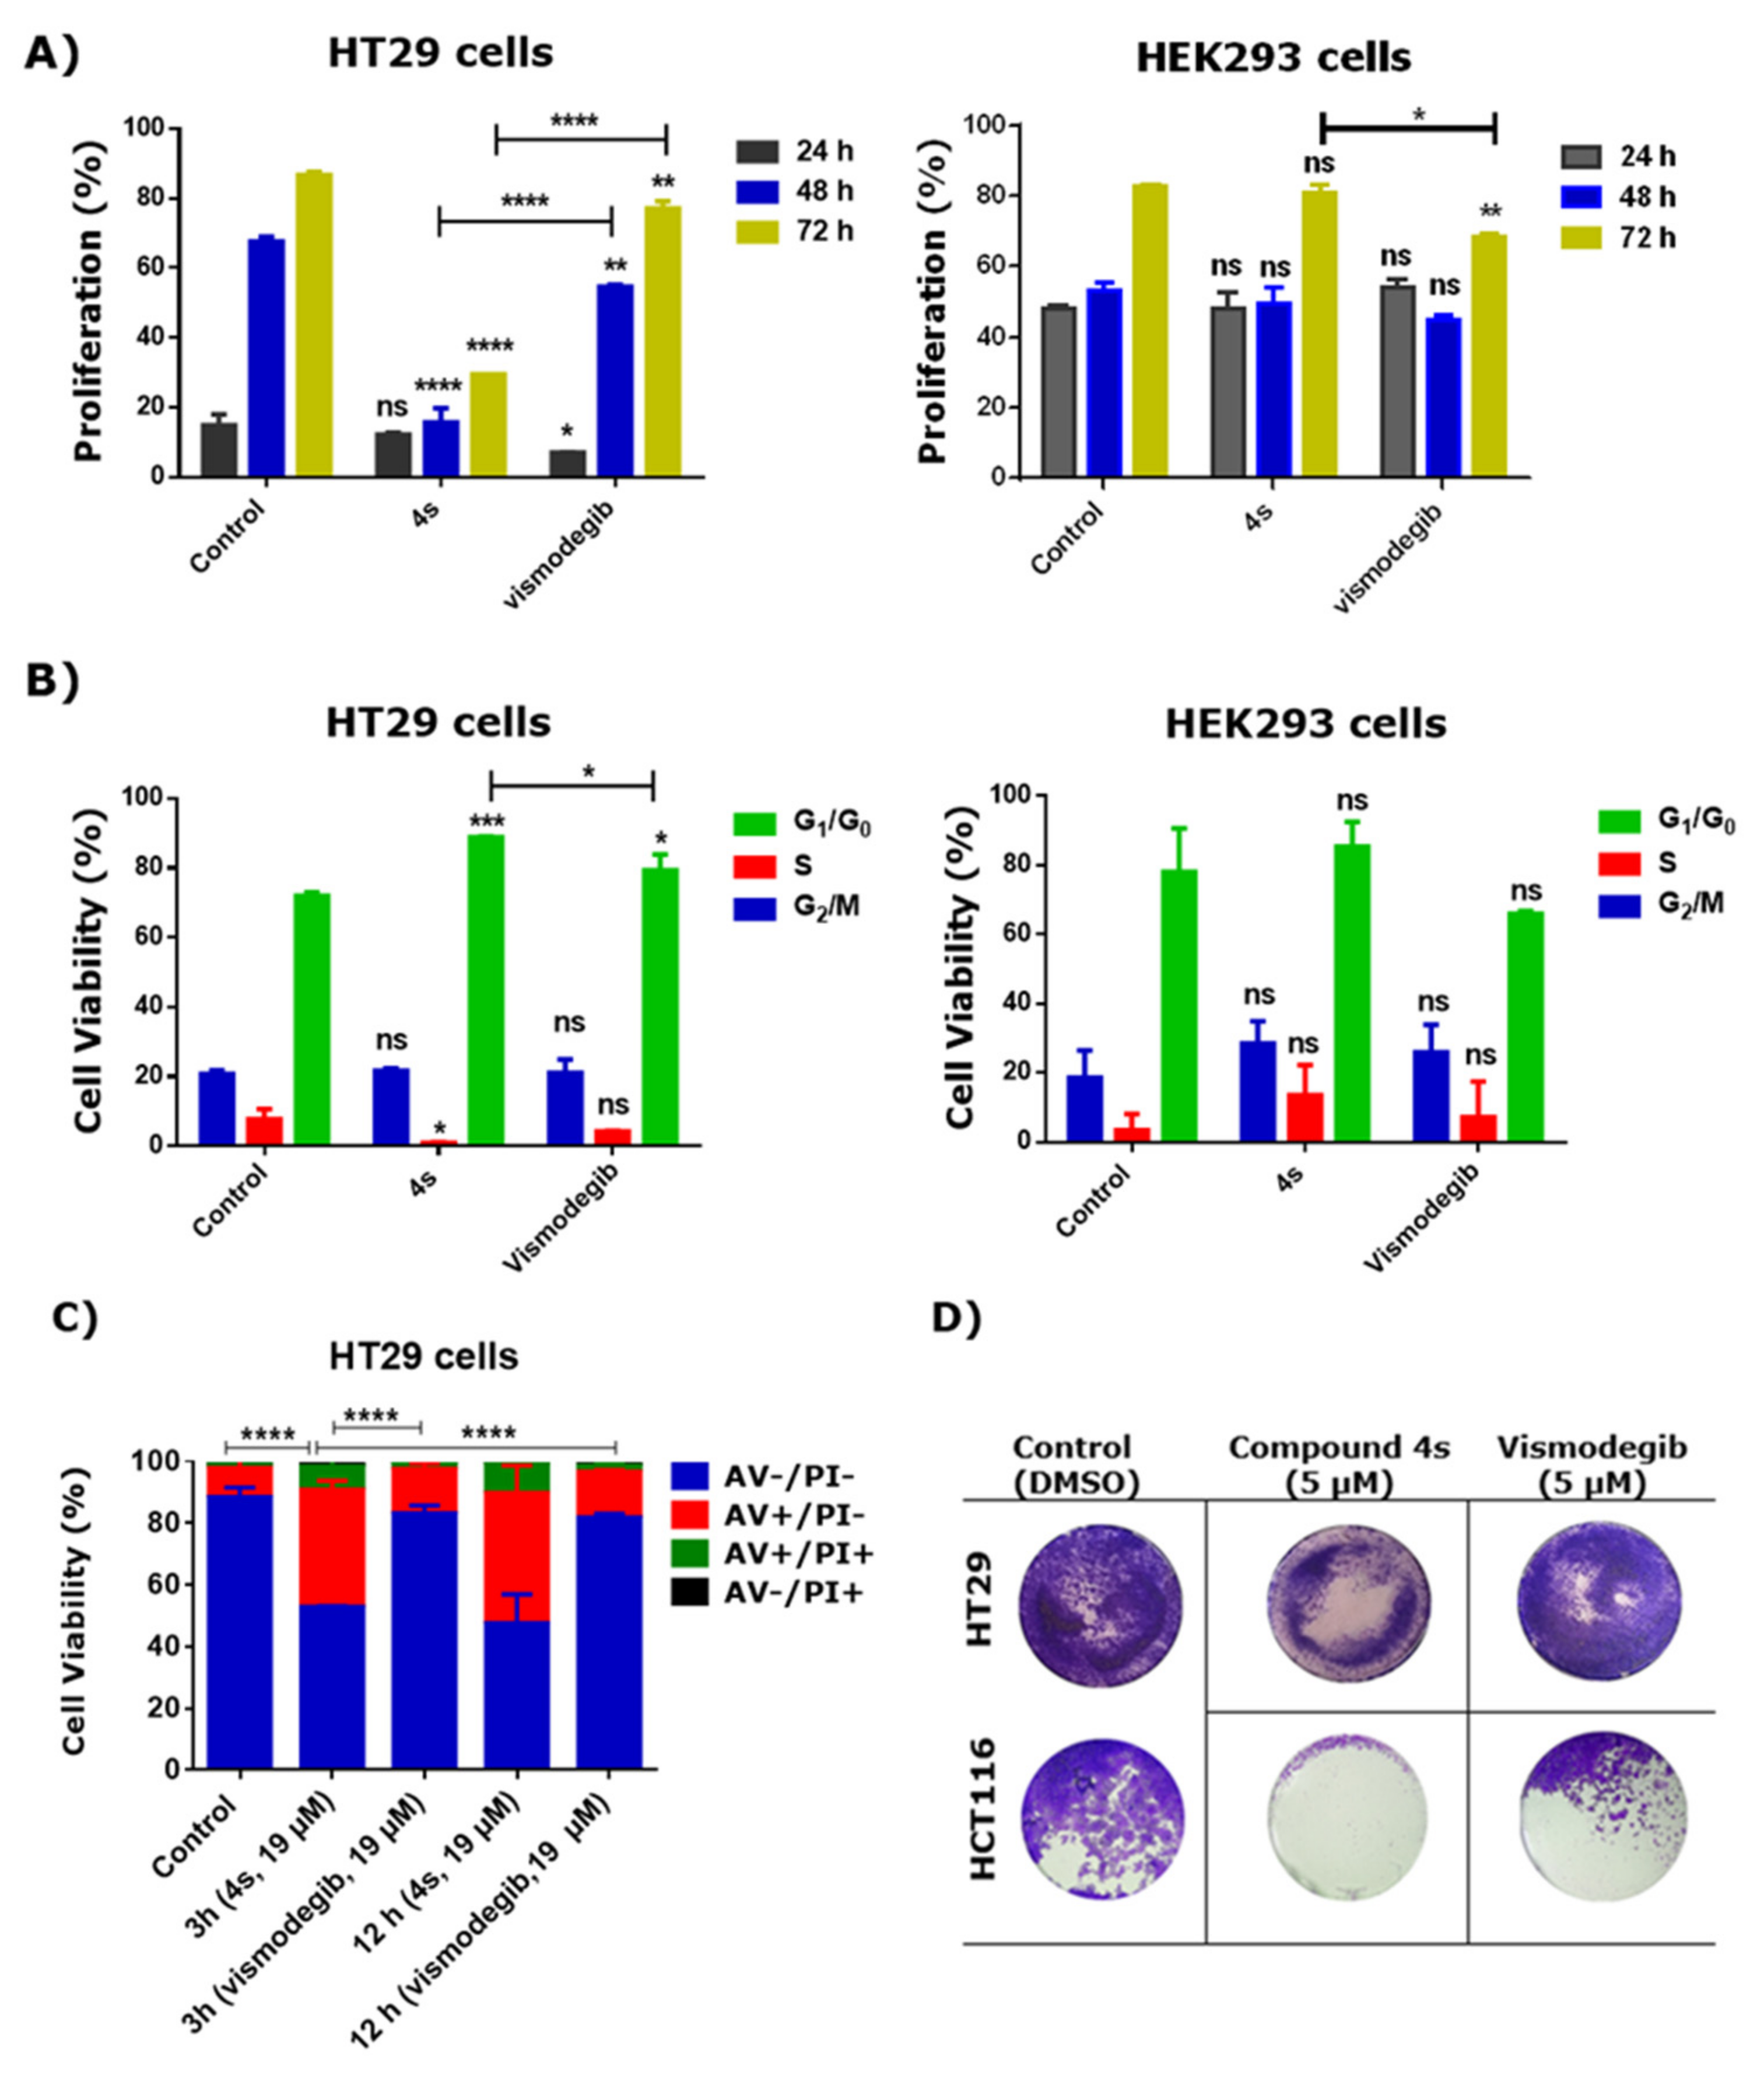
2.3. Effect of 4s in Proliferation, Cell Cycle, Apoptosis and Colony Formation of Cancer Cells
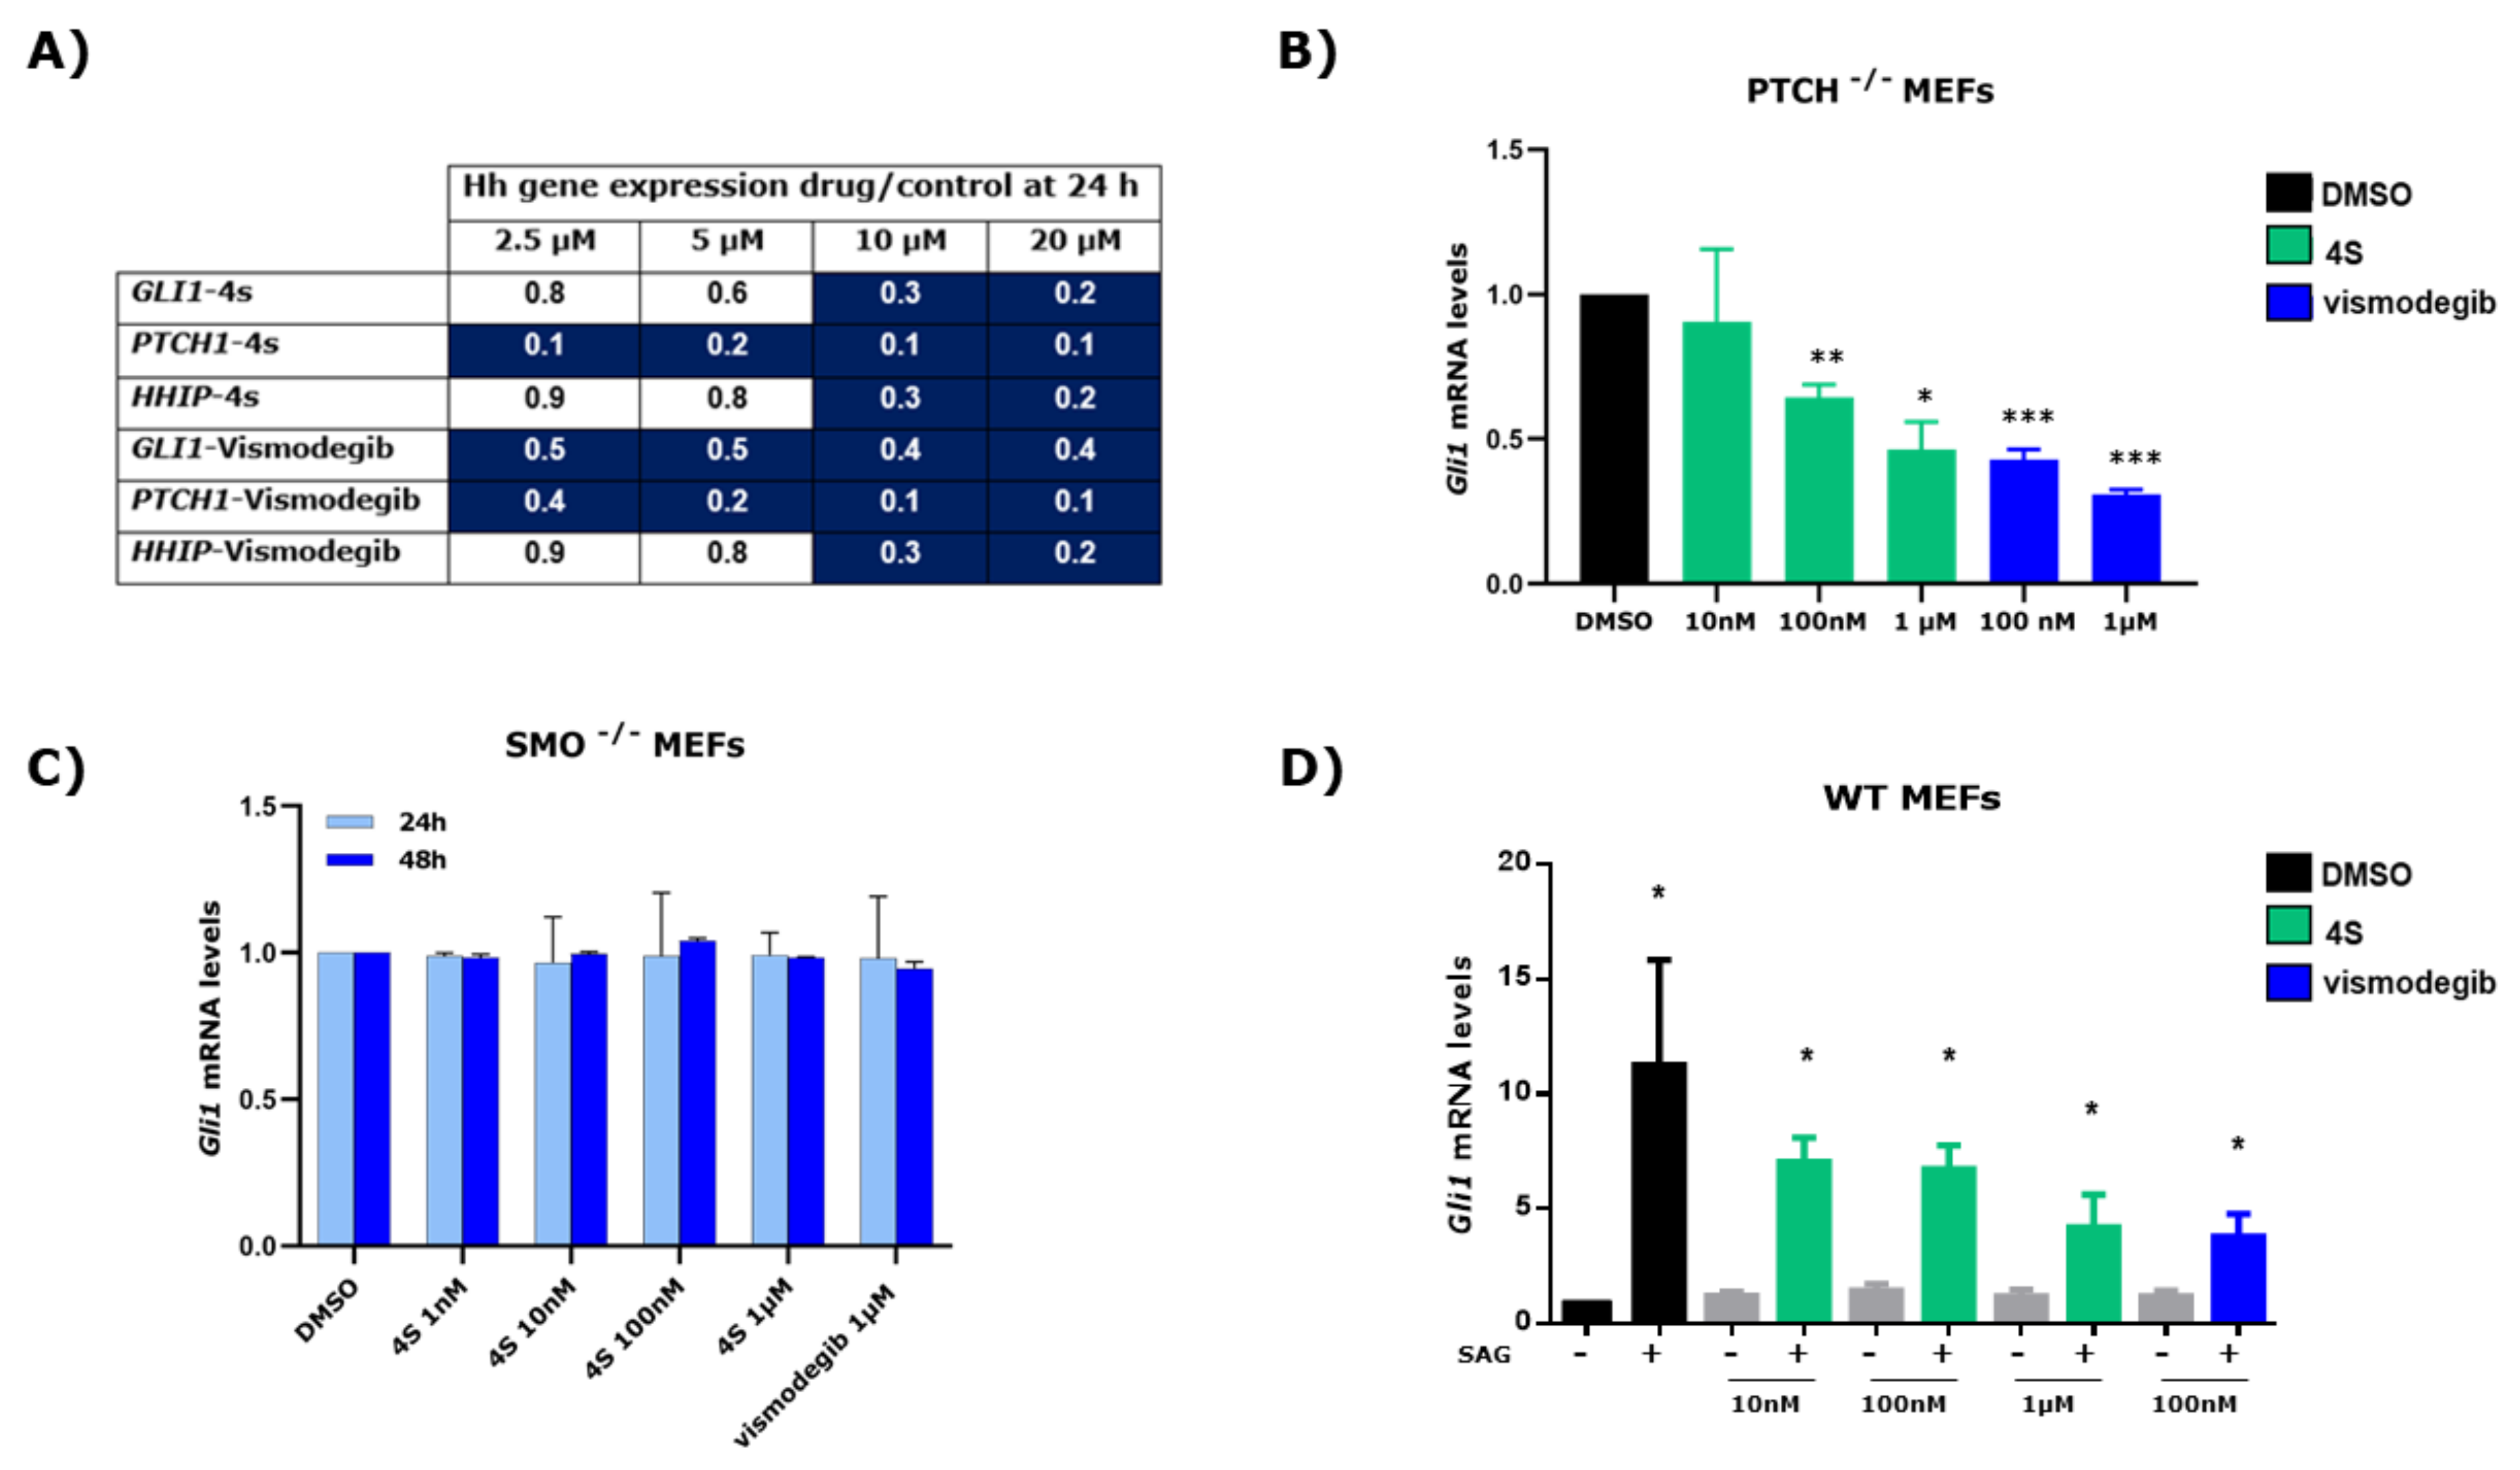
2.4. Effect of 4s on the Expression of HH Signalling Pathway Target Genes
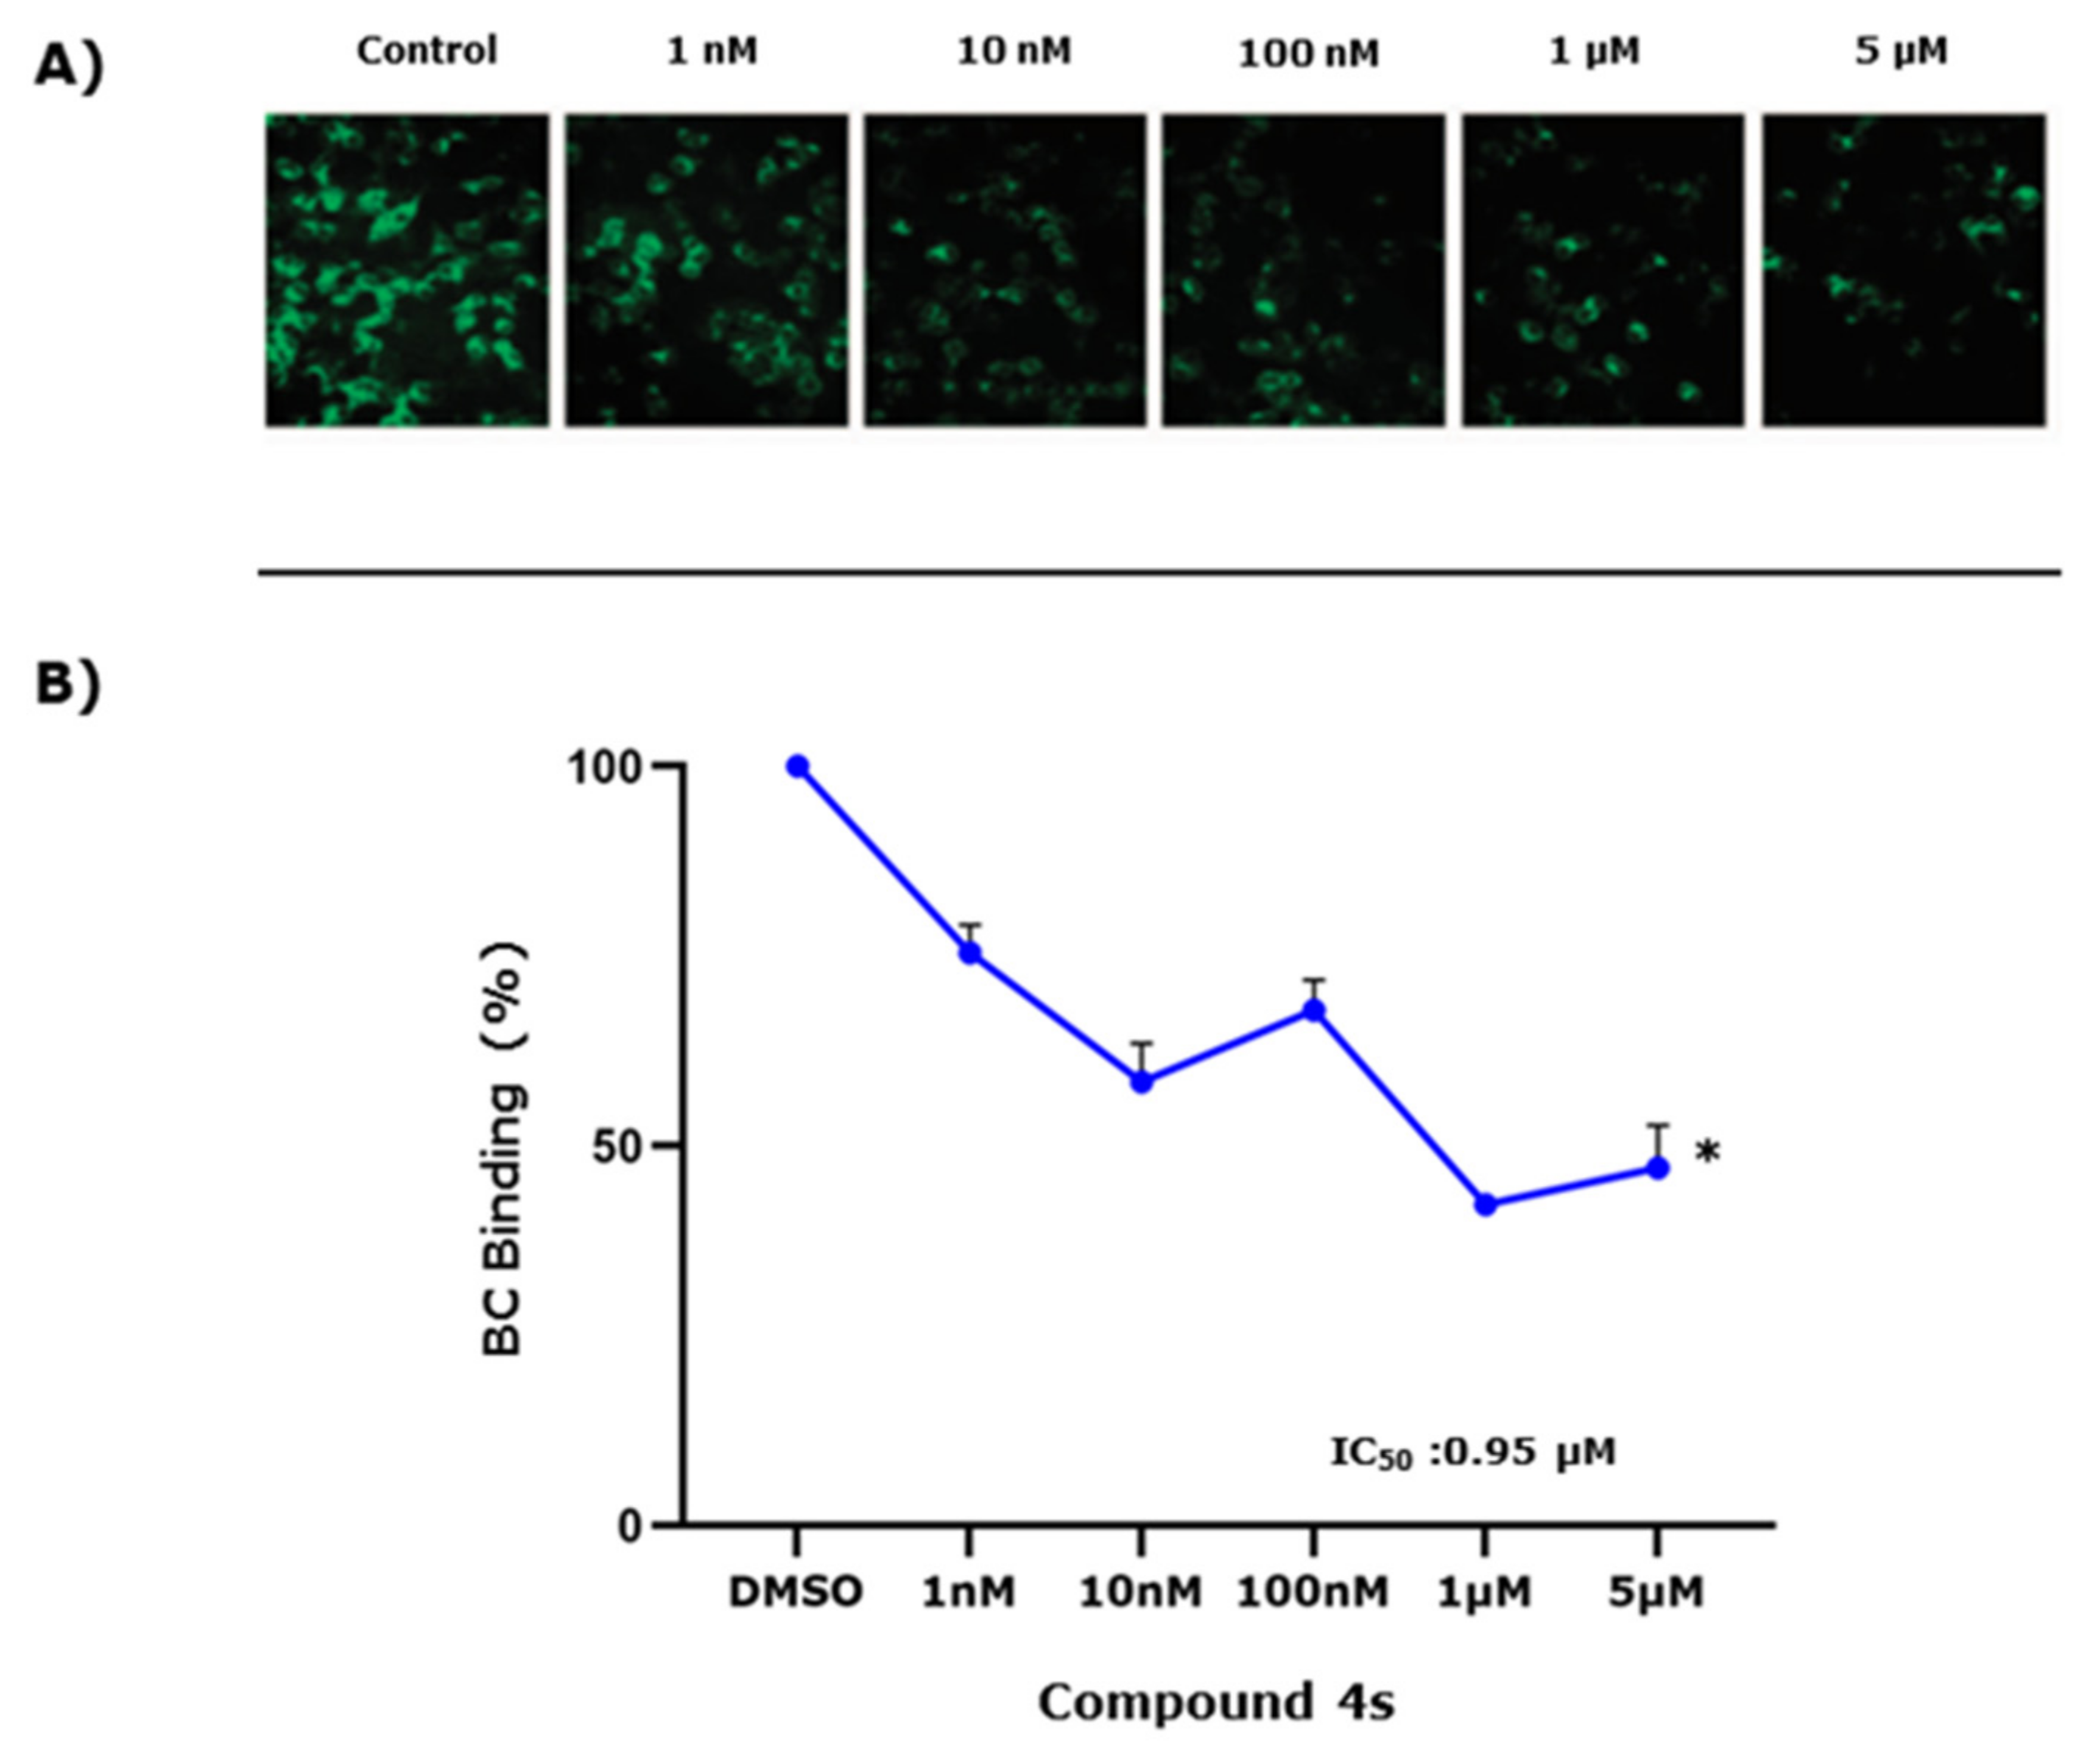
2.5. Study of 4s as Antagonist of the SMO Receptor
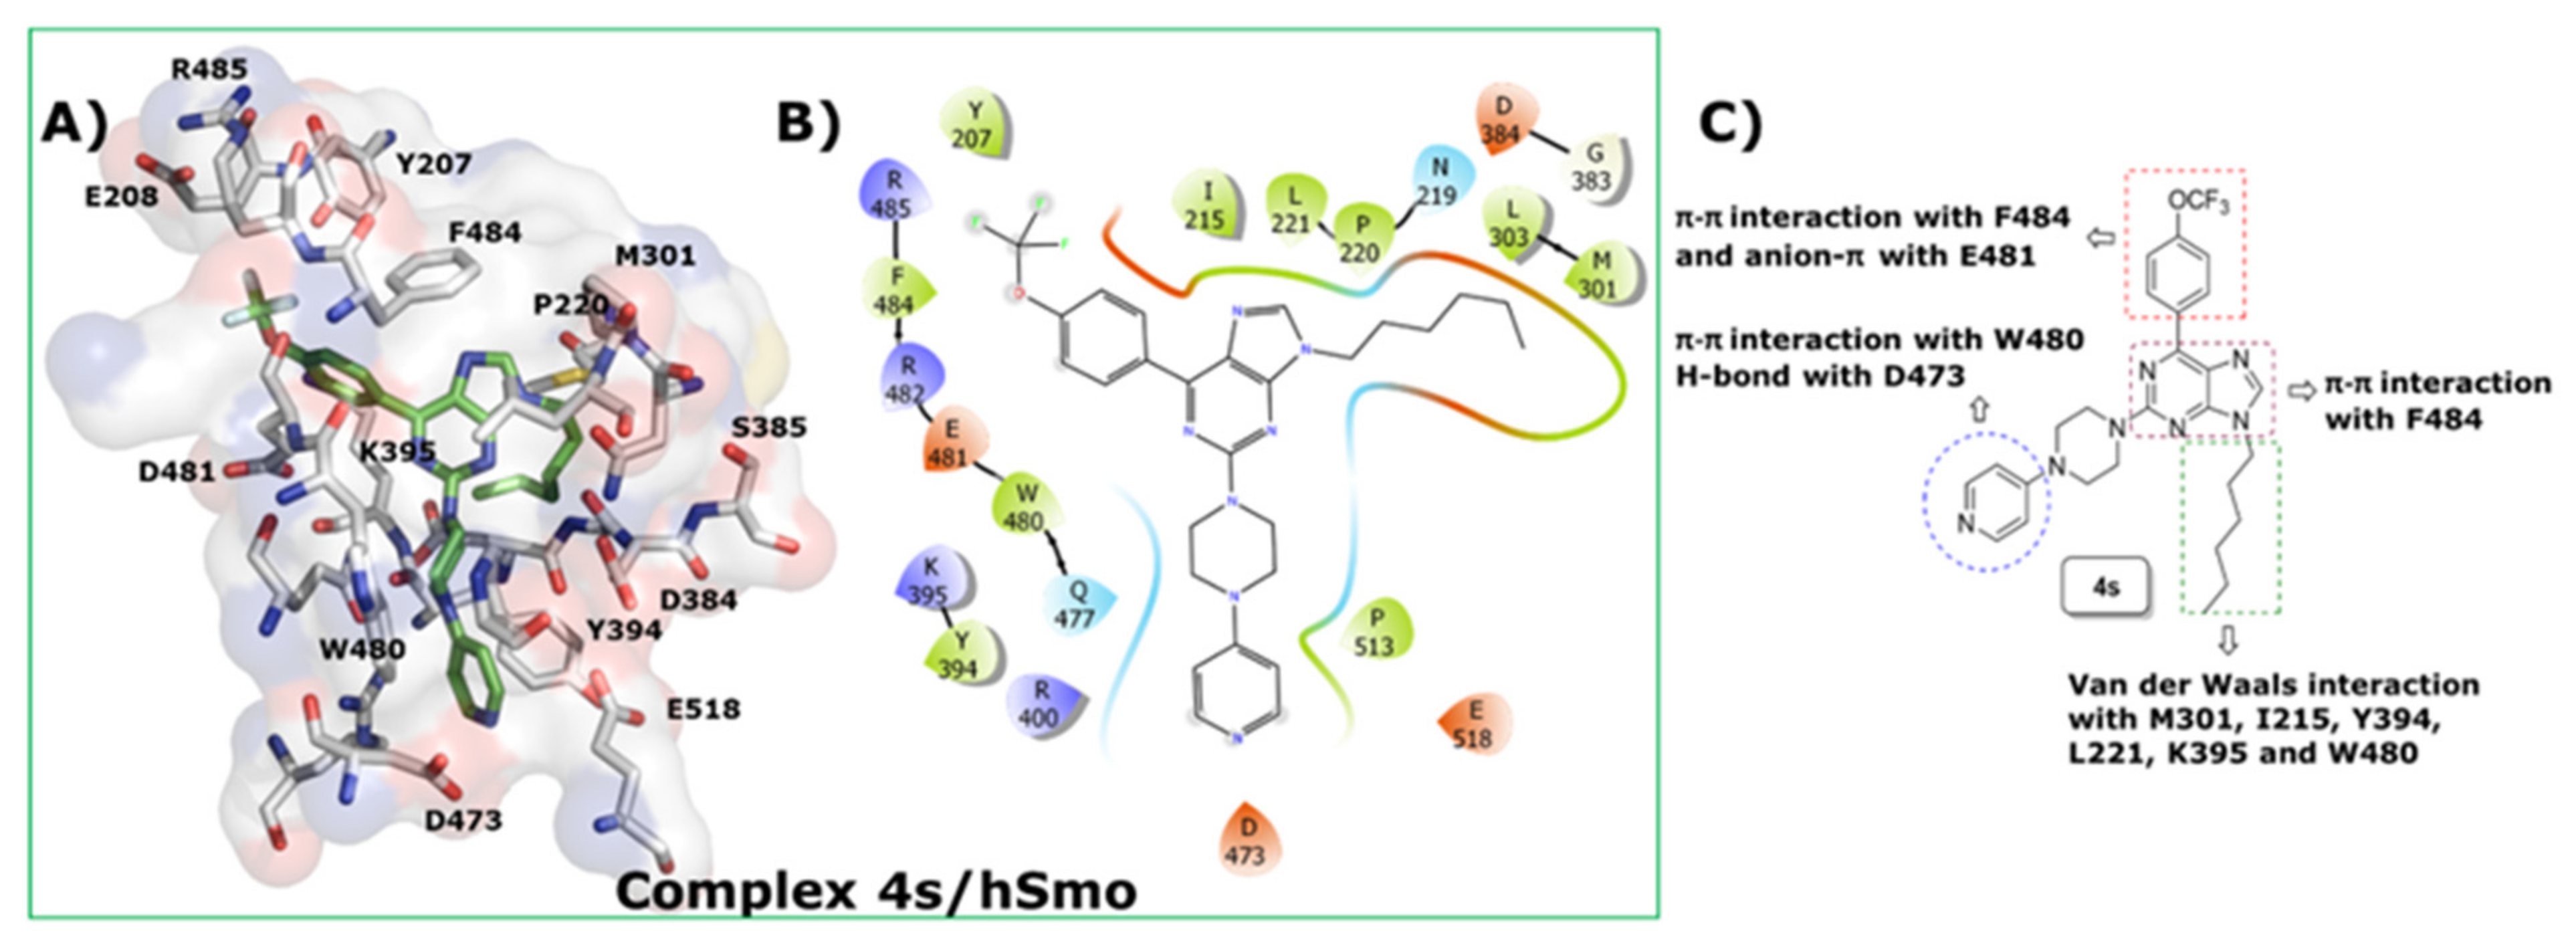
2.6. Docking Studies of 4s into SMO Receptor
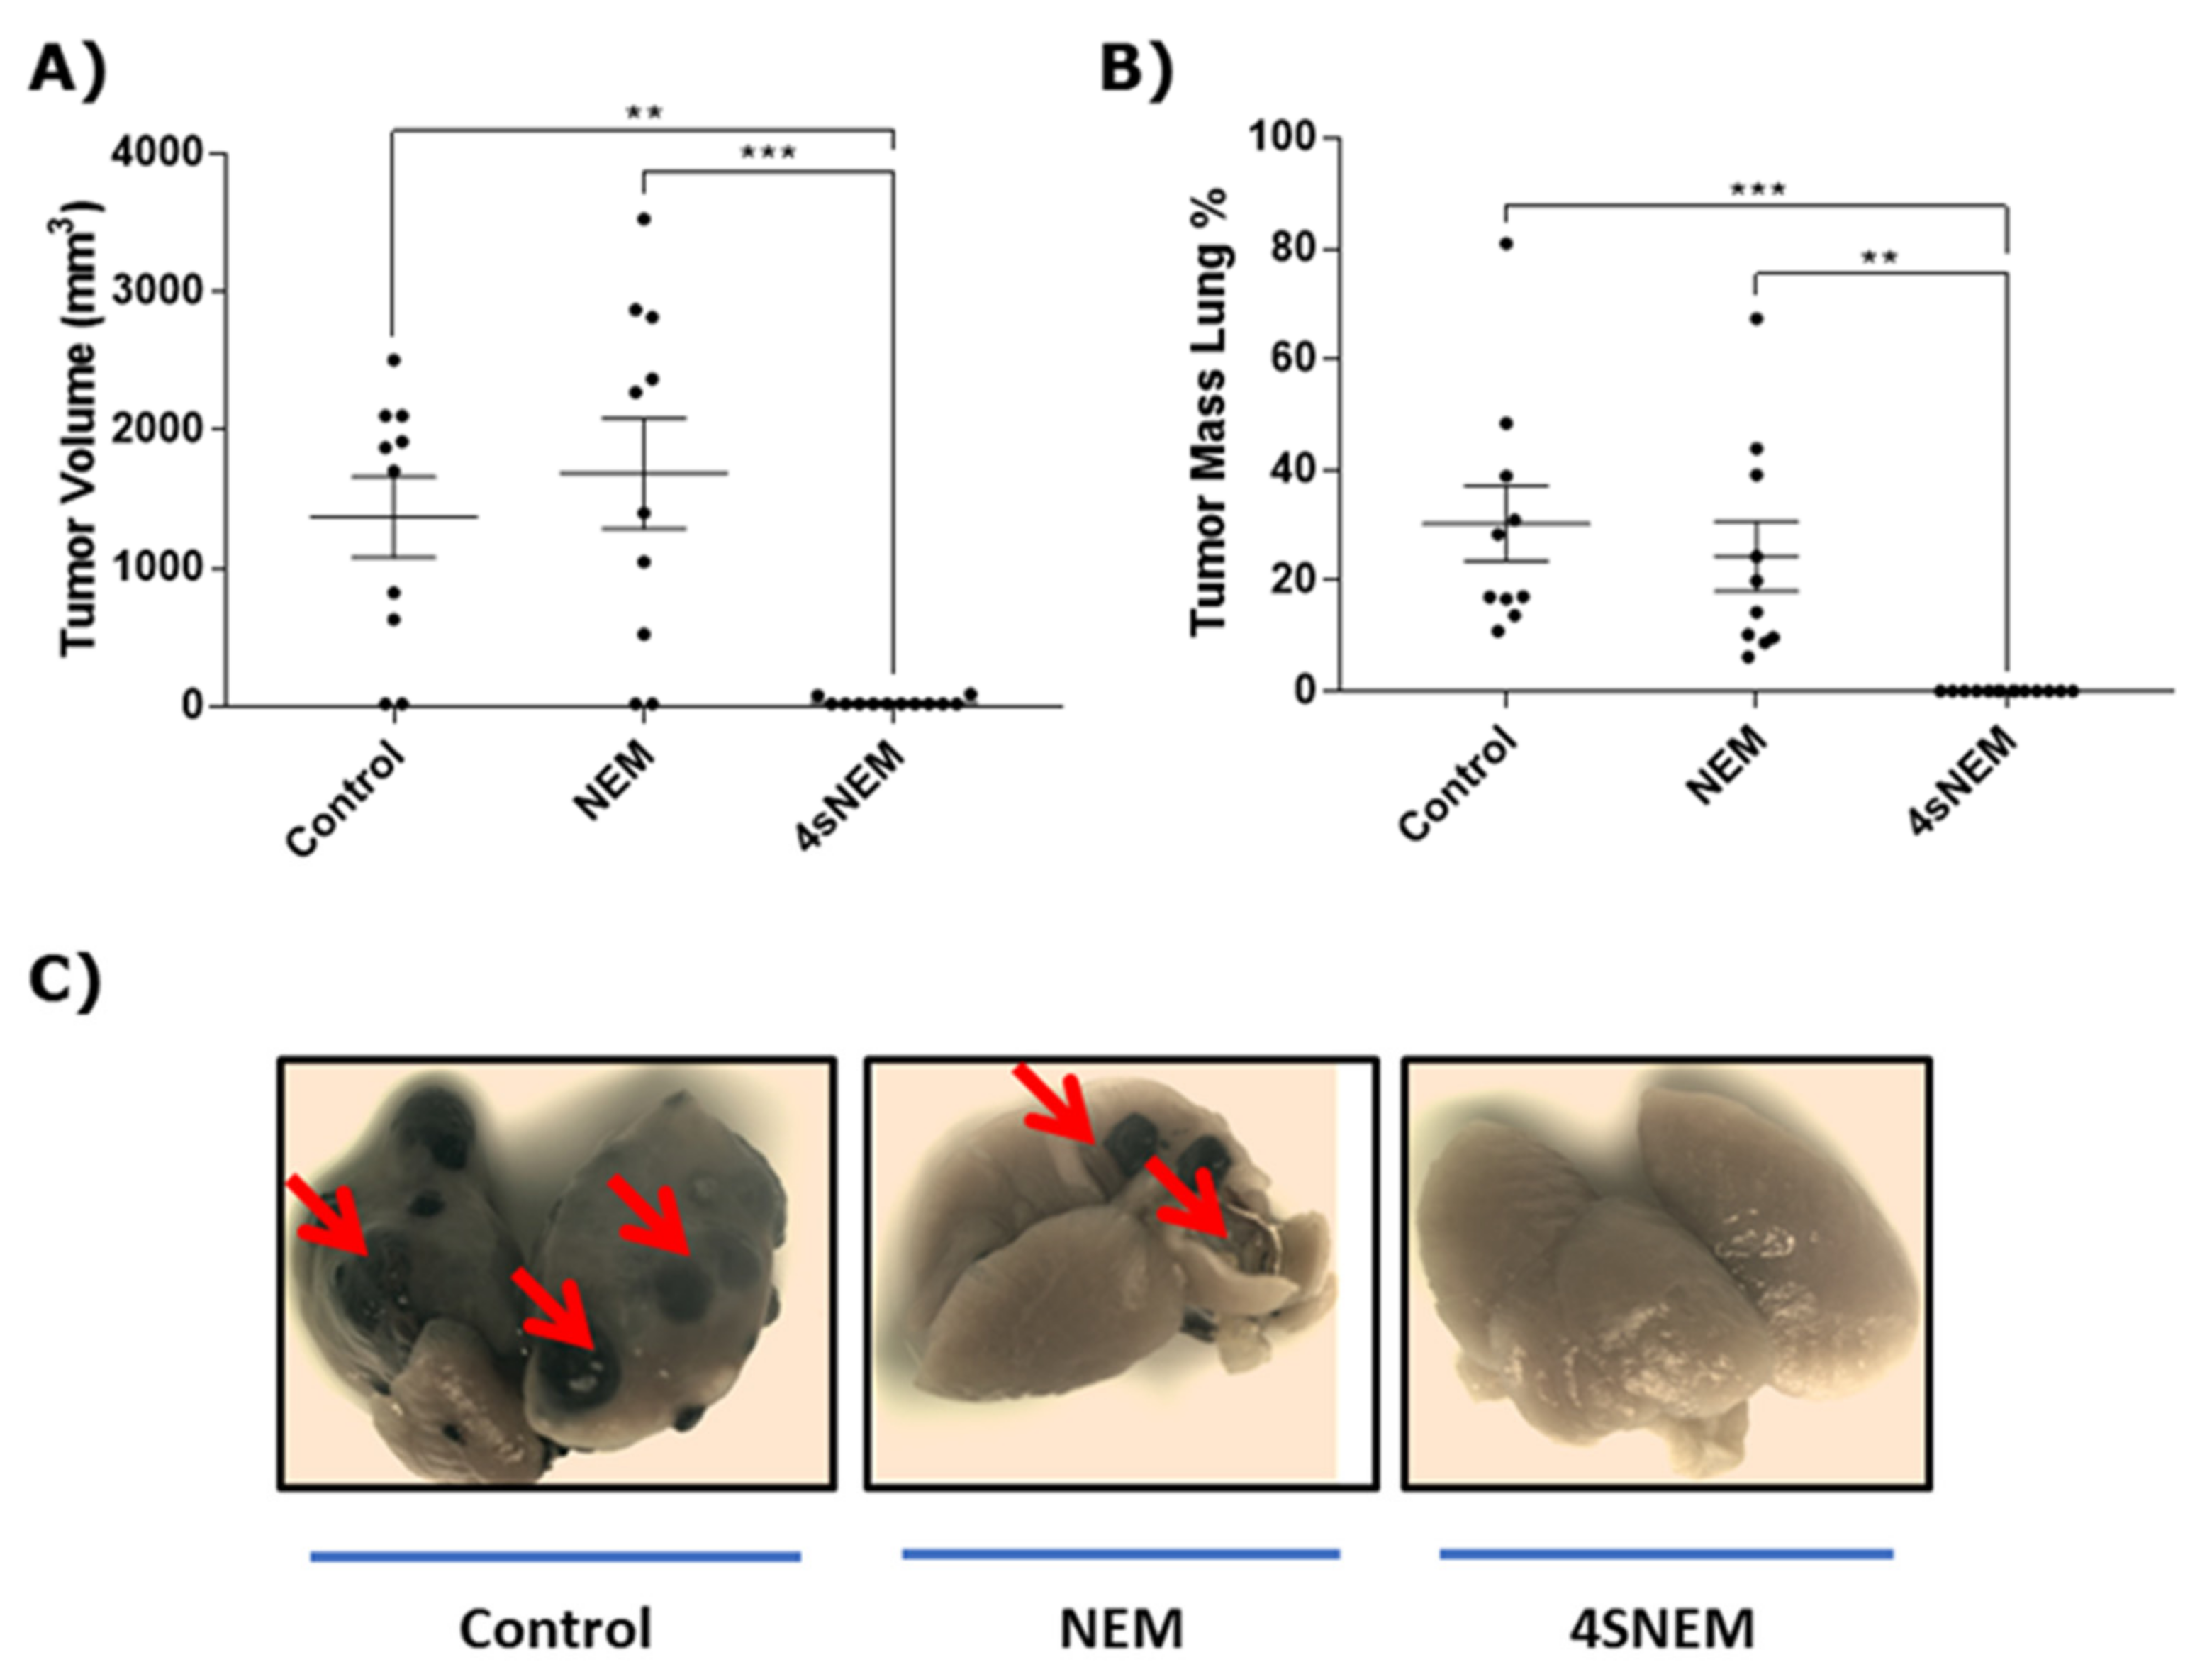
2.7. Effect of 4s on Tumour Growth and Metastasis In Vivo
3. Discussion
4. Conclusions
5. Materials and Methods
5.1. Chemistry
5.1.1. Materials
5.1.2. General Procedure of the Synthesis for Compounds 2a–2c and 2a′–2c′
5.1.3. General Procedure for the Synthesis of Compounds 3a–3c
5.1.4. General Procedure for the Synthesis of Compounds 4a–4s
5.2. Biology: In Vitro Assays
5.2.1. Materials
5.2.2. Cell Culture and Treatment
5.2.3. Cytotoxicity Study
5.2.4. Proliferation Assays
5.2.5. Cell Cycle Analysis
5.2.6. Cell Viability Assessed by Annexin /PI Assay
5.2.7. Determination of Tumour Colony Formation
5.2.8. BODIPY-Cyclopamine Binding Assay
5.2.9. Cell Cultures, Transfection and Treatments
5.2.10. HH-Dependent Luciferase Reporter Assay
5.2.11. Analysis of Gene Expression: mRNA levels
- Ptch1 F: 5′-CCA CAG AAG CGC TCC TAC A-3′
- Ptch1 R: 5′-CTG TAA TTT CGC CCC TTC C-3′
- GLi1 F: 5′-GGG ATG ATC CCA CAT CCT CAG TC-3′
- GLi1 R: 5′-CTG GAG CAG CCC CCC CAG T-3′
- HHIP F: 5′-CCC ACA CTT CAA CAG CAC CA-3′
- HHIP R: 5′-GCT TTG TCA CAG GAC TTT GC-3′
- TBP F: 5′-TGC ACA GGA GCC AAG AGT GAA-3′
- TBP R: 5′-CAC ATC ACA GCT CCC CAC CA-3′
- HMBS F: 5′-AAG TGC GAG CCA AGG ACC AG-3′
- HMBS R: 5′-TTA CGA GCA TGA TGC CTA CCA AC-3′
- HPRT F: 5′-GCT TCC TCC TCA GAC CGC TT-3′
- HPRT R: 5′-GG TCA TAA CCT GGT TCA TCA TCG-3′
5.3. In Silico Studies: Molecular Docking
5.4. Preparation and Physicochemical Characterisation of Nanoemulsions Loaded with 4s (4s-NEM)
5.5. In Vivo Studies
5.5.1. Animals
5.5.2. Recurrent Tumour Growth and Lung Metastasis in Animal Models
5.5.3. Statistical Analysis
Supplementary Materials
Author Contributions
Funding
Institutional Review Board Statement
Informed Consent Statement
Data Availability Statement
Acknowledgments
Conflicts of Interest
Abbreviations
| SMO | Smoothened receptor |
| HH | Hedgehog |
| GLI1 | Glioma1 |
| SHH | Sonic Hedgehog |
| IHH | Indian Hedgehog |
| DHH | Desert Hedgehog |
| PTCH1 | patched1 |
| BCL2 | B-cell lymphoma 2 |
| c-MYC | c-MYC oncogene |
| SNAIL | Snail transcriptional factor |
| BMI1 | B lymphoma Mo-MLV insertion region 1 |
| BCC | basal cell carcinoma |
| MB | medulloblastoma |
| CDKs | cyclin-dependent kinases |
| Src | Src oncogene |
| VEGFR2 | vascular endothelial growth factor receptor-2 |
| 5-FU | 5-fluorouracil |
| MTT | 3-(4,5-dymethylthiazol-2-yl)-2,5-diphenyl tetrazolium bromide |
| CFSE | carboxyfluorescein diacetate succinimidyl ester |
| PI | propidium iodide |
| HPRT | hypoxanthine guanine phosphoribosyltransferase |
| MEFs | murine embryonic fibroblasts |
| BC | BODIPY-cyclopamine |
| 4s-NEM | 4s-nanoemulsion |
| Ras-MEK/AKT | Ras-MEK/AKT signal transduction pathway |
References
- Ingham, P.W. Hedgehog signaling: A tale of two lipids. Science 2001, 294, 1879–1881. [Google Scholar] [CrossRef] [PubMed]
- Chari, N.S.; McDonnell, T.J. The sonic hedgehog signaling network in development and neoplasia. Adv. Anat. Pathol. 2007, 14, 344–352. [Google Scholar] [CrossRef] [PubMed]
- Briscoe, J.; Therond, P.P. The mechanisms of Hedgehog signalling and its roles in development and disease. Nat. Rev. Mol. Cell Biol. 2013, 14, 416–429. [Google Scholar] [CrossRef] [PubMed]
- Ruiz i Altaba, A. Hedgehog signaling and the Gli code in stem cells, cancer, and metastases. Sci. Signal. 2011, 4, pt9. [Google Scholar] [CrossRef]
- Di Marcotullio, L.; Ferretti, E.; Greco, A.; De Smaele, E.; Screpanti, I.; Gulino, A. Multiple ubiquitin-dependent processing pathways regulate hedgehog/gli signaling: Implications for cell development and tumorigenesis. Cell Cycle 2007, 6, 390–393. [Google Scholar] [CrossRef] [Green Version]
- Scales, S.J.; de Sauvage, F.J. Mechanisms of Hedgehog pathway activation in cancer and implications for therapy. Trends Pharmacol. Sci. 2009, 30, 303–312. [Google Scholar] [CrossRef]
- Ruiz i Altaba, A.; Mas, C.; Stecca, B. The Gli code: An information nexus regulating cell fate, stemness and cancer. Trends Cell Biol. 2007, 17, 438–447. [Google Scholar] [CrossRef] [Green Version]
- Teglund, S.; Toftgard, R. Hedgehog beyond medulloblastoma and basal cell carcinoma. Biochim. Biophys. Acta 2010, 1805, 181–208. [Google Scholar] [CrossRef]
- Bilir, Y.; Gokce, E.; Ozturk, B.; Deresoy, F.A.; Yuksekkaya, R.; Yaman, E. Metastatic Basal cell carcinoma accompanying gorlin syndrome. Case Rep. Oncol. Med. 2014, 2014, 362932. [Google Scholar] [CrossRef] [Green Version]
- Rudin, C.M.; Hann, C.L.; Laterra, J.; Yauch, R.L.; Callahan, C.A.; Fu, L.; Holcomb, T.; Stinson, J.; Gould, S.E.; Coleman, B.; et al. Treatment of medulloblastoma with hedgehog pathway inhibitor GDC-0449. N. Engl. J. Med. 2009, 361, 1173–1178. [Google Scholar] [CrossRef] [Green Version]
- Available online: https://www.accessdata.fda.gov/drugsatfda_docs/label/2012/203388lbl.pdf (accessed on 30 July 2021).
- Available online: https://www.accessdata.fda.gov/drugsatfda_docs/label/2015/205266s000lbl.pdf (accessed on 30 July 2021).
- Guha, M. Hedgehog inhibitor gets landmark skin cancer approval, but questions remain for wider potential. Nat. Rev. Drug Discov. 2012, 11, 257–258. [Google Scholar] [CrossRef]
- Rimkus, T.K.; Carpenter, R.L.; Qasem, S.; Chan, M.; Lo, H.W. Targeting the Sonic Hedgehog Signaling Pathway: Review of Smoothened and GLI Inhibitors. Cancers 2016, 8, 22. [Google Scholar] [CrossRef] [Green Version]
- Zhang, H.; Sun, Z.; Liu, Z.; Song, C. Overcoming the emerging drug resistance of smoothened: An overview of small-molecule SMO antagonists with antiresistance activity. Future Med. Chem. 2018, 10, 2855–2875. [Google Scholar] [CrossRef]
- Li, Q.R.; Zhao, H.; Zhang, X.S.; Lang, H.; Yu, K. Novel-smoothened inhibitors for therapeutic targeting of naive and drug-resistant hedgehog pathway-driven cancers. Acta Pharmacol. Sin. 2019, 40, 257–267. [Google Scholar] [CrossRef]
- Hoy, S.M. Glasdegib: First Global Approval. Drugs 2019, 79, 207–213. [Google Scholar] [CrossRef]
- Wolska-Washer, A.; Robak, T. Glasdegib in the treatment of acute myeloid leukemia. Future Oncol. 2019, 15, 3219–3232. [Google Scholar] [CrossRef]
- Thomas, X.; Heiblig, M. An evaluation of glasdegib for the treatment of acute myelogenous leukemia. Expert Opin. Pharmacother. 2020, 21, 523–530. [Google Scholar] [CrossRef]
- Espinosa-Bustos, C.; Mella, J.; Soto-Delgado, J.; Salas, C.O. State of the art of Smo antagonists for cancer therapy: Advances in the target receptor and new ligand structures. Future Med. Chem. 2019, 11, 617–638. [Google Scholar] [CrossRef]
- Miller-Moslin, K.; Peukert, S.; Jain, R.K.; McEwan, M.A.; Karki, R.; Llamas, L.; Yusuff, N.; He, F.; Li, Y.H.; Sun, Y.C.; et al. 1-Amino-4-benzylphthalazines as Orally Bioavailable Smoothened Antagonists with Antitumor Activity. J. Med. Chem. 2009, 52, 3954–3968. [Google Scholar] [CrossRef]
- Peukert, S.; He, F.; Dai, M.; Zhang, R.; Sun, Y.C.; Miller-Moslin, K.; McEwan, M.; Lagu, B.; Wang, K.; Yusuff, N.; et al. Discovery of NVP-LEQ506, a Second-Generation Inhibitor of Smoothened. ChemMedChem 2013, 8, 1261–1265. [Google Scholar] [CrossRef]
- Bender, M.H.; Hipskind, P.A.; Capen, A.R.; Cockman, M.; Credille, K.M.; Gao, H.; Bastian, J.A.; Clay, J.M.; Lobb, K.L.; Sall, D.J.; et al. Identification and characterization of a novel smoothened antagonist for the treatment of cancer with deregulated hedgehog signaling. Cancer Res. 2011, 71, 2819. [Google Scholar] [CrossRef]
- Jin, G.; Sivaraman, A.; Lee, K. Development of taladegib as a sonic hedgehog signaling pathway inhibitor. Arch. Pharm. Res. 2017, 40, 1390–1393. [Google Scholar] [CrossRef]
- Welsch, M.E.; Snyder, S.A.; Stockwell, B.R. Privileged scaffolds for library design and drug discovery. Curr. Opin. Chem. Biol. 2010, 14, 347–361. [Google Scholar] [CrossRef] [Green Version]
- Legraverend, M.; Grierson, D.S. The purines: Potent and versatile small molecule inhibitors and modulators of key biological targets. Bioorg. Med. Chem. 2006, 14, 3987–4006. [Google Scholar] [CrossRef]
- Zhao, H.; Dietrich, J. Privileged scaffolds in lead generation. Expert Opin. Drug Discov. 2015, 10, 781–790. [Google Scholar] [CrossRef]
- Morales, F.; Ramirez, A.; Conejo-Garcia, A.; Morata, C.; Marchal, J.A.; Campos, J.M. Anti-proliferative activity of 2,6-dichloro-9- or 7-(ethoxycarbonylmethyl)-9H- or 7H-purines against several human solid tumour cell lines. Eur. J. Med. Chem. 2014, 76, 118–124. [Google Scholar] [CrossRef]
- Demir, Z.; Guven, E.B.; Ozbey, S.; Kazak, C.; Atalay, R.C.; Tuncbilek, M. Synthesis of novel substituted purine derivatives and identification of the cell death mechanism. Eur. J. Med. Chem. 2015, 89, 701–720. [Google Scholar] [CrossRef]
- Wang, Y.; Metcalf, C.A.; Shakespeare, W.C.; Sundaramoorthi, R.; Keenan, T.P.; Bohacek, R.S.; van Schravendijk, M.R.; Violette, S.M.; Narula, S.S.; Dalgarno, D.C.; et al. Bone-Targeted 2,6,9-Trisubstituted purines: Novel inhibitors of Src tyrosine kinase for the treatment of bone diseases. Bioorg. Med. Chem. Lett. 2003, 13, 3067–3070. [Google Scholar] [CrossRef]
- Patel, R.V.; Park, S.W. An evolving role of piperazine moieties in drug design and discovery. Mini Rev. Med. Chem. 2013, 13, 1579–1601. [Google Scholar] [CrossRef]
- Zhang, L.; Xin, M.; Shen, H.; Wen, J.; Tang, F.; Tu, C.; Zhao, X.; Wei, P. Five-membered heteroaromatic ring fused-pyrimidine derivatives: Design, synthesis, and hedgehog signaling pathway inhibition study. Bioorg. Med. Chem. Lett. 2014, 24, 3486–3492. [Google Scholar] [CrossRef]
- Zaidi, A.H.; Komatsu, Y.; Kelly, L.A.; Malhotra, U.; Rotoloni, C.; Kosovec, J.E.; Zahoor, H.; Makielski, R.; Bhatt, A.; Hoppo, T.; et al. Smoothened Inhibition Leads to Decreased Proliferation and Induces Apoptosis in Esophageal Adenocarcinoma Cells. Cancer Investig. 2013, 31, 480–489. [Google Scholar] [CrossRef] [PubMed]
- Du, J.; Chen, W.; Yang, L.; Dai, J.; Guo, J.; Wu, Y.; Gong, K.; Zhang, J.; Yu, N.; Xie, Z.; et al. Disruption of SHH signaling cascade by SBE attenuates lung cancer progression and sensitizes DDP treatment. Sci. Rep. 2017, 7, 1899. [Google Scholar] [CrossRef] [PubMed] [Green Version]
- Calderon-Arancibia, J.; Espinosa-Bustos, C.; Canete-Molina, A.; Tapia, R.A.; Faundez, M.; Torres, M.J.; Aguirre, A.; Paulino, M.; Salas, C.O. Synthesis and pharmacophore modelling of 2,6,9-trisubstituted purine derivatives and their potential role as apoptosis-inducing agents in cancer cell lines. Molecules 2015, 20, 6808–6826. [Google Scholar] [CrossRef] [PubMed] [Green Version]
- Salas, C.O.; Zarate, A.M.; Kryštof, V.; Mella, J.; Faundez, M.; Brea, J.; Loza, M.I.; Brito, I.; Hendrychová, D.; Jorda, R.; et al. Promising 2,6,9-Trisubstituted Purine Derivatives for Anticancer Compounds: Synthesis, 3D-QSAR, and Preliminary Biological Assays. Int. J. Mol. Sci. 2020, 21, 161. [Google Scholar] [CrossRef] [Green Version]
- Miyaura, N.; Suzuki, A. Palladium-catalyzed cross-coupling reactions of organoboron compounds. Chem. Rev. 1995, 95, 2457–2483. [Google Scholar] [CrossRef] [Green Version]
- Ivanov, D.P.; Coyle, B.; Walker, D.A.; Grabowska, A.M. In vitro models of medulloblastoma: Choosing the right tool for the job. J. Biotechnol. 2016, 236, 10–25. [Google Scholar] [CrossRef]
- Lin, Z.; Li, S.; Sheng, H.; Cai, M.; Ma, L.Y.; Hu, L.; Xu, S.; Yu, L.S.; Zhang, N. Suppression of GLI sensitizes medulloblastoma cells to mitochondria-mediated apoptosis. J. Cancer Res. Clin. Oncol. 2016, 142, 2469–2478. [Google Scholar] [CrossRef] [Green Version]
- Triscott, J.; Lee, C.; Foster, C.; Manoranjan, B.; Pambid, M.R.; Berns, R.; Fotovati, A.; Venugopal, C.; O’Halloran, K.; Narendran, A.; et al. Personalizing the treatment of pediatric medulloblastoma: Polo-like kinase 1 as a molecular target in high-risk children. Cancer Res. 2013, 73, 6734–6744. [Google Scholar] [CrossRef] [Green Version]
- Mazumdar, T.; DeVecchio, J.; Agyeman, A.; Shi, T.; Houghton, J.A. The GLI genes as the molecular switch in disrupting Hedgehog signaling in colon cancer. Oncotarget 2011, 2, 638–645. [Google Scholar] [CrossRef] [Green Version]
- Shi, T.; Mazumdar, T.; Devecchio, J.; Duan, Z.H.; Agyeman, A.; Aziz, M.; Houghton, J.A. cDNA microarray gene expression profiling of hedgehog signaling pathway inhibition in human colon cancer cells. PLoS ONE 2010, 5, e13054. [Google Scholar] [CrossRef]
- Fan, J.; Zhang, X.; Wang, S.; Chen, W.; Li, Y.; Zeng, X.; Wang, Y.; Luan, J.; Li, L.; Wang, Z.; et al. Regulating autophagy facilitated therapeutic efficacy of the sonic Hedgehog pathway inhibition on lung adenocarcinoma through GLI2 suppression and ROS production. Cell Death Dis. 2019, 10, 626. [Google Scholar] [CrossRef] [Green Version]
- Mazumdar, T.; DeVecchio, J.; Shi, T.; Jones, J.; Agyeman, A.; Houghton, J.A. Hedgehog signaling drives cellular survival in human colon carcinoma cells. Cancer Res. 2011, 71, 1092–1102. [Google Scholar] [CrossRef] [Green Version]
- Xiao, X.; Tang, J.J.; Peng, C.; Wang, Y.; Fu, L.; Qiu, Z.P.; Xiong, Y.; Yang, L.F.; Cui, H.W.; He, X.L.; et al. Cholesterol Modification of Smoothened Is Required for Hedgehog Signaling. Mol. Cell 2017, 66, 154–162.e10. [Google Scholar] [CrossRef] [Green Version]
- Gotschel, F.; Berg, D.; Gruber, W.; Bender, C.; Eberl, M.; Friedel, M.; Sonntag, J.; Rungeler, E.; Hache, H.; Wierling, C.; et al. Synergism between Hedgehog-GLI and EGFR signaling in Hedgehog-responsive human medulloblastoma cells induces downregulation of canonical Hedgehog-target genes and stabilized expression of GLI1. PLoS ONE 2013, 8, e65403. [Google Scholar] [CrossRef]
- Lospinoso Severini, L.; Quaglio, D.; Basili, I.; Ghirga, F.; Bufalieri, F.; Caimano, M.; Balducci, S.; Moretti, M.; Romeo, I.; Loricchio, E.; et al. A Smo/Gli Multitarget Hedgehog Pathway Inhibitor Impairs Tumor Growth. Cancers 2019, 11, 1518. [Google Scholar] [CrossRef] [Green Version]
- Sinha, S.; Chen, J.K. Purmorphamine activates the Hedgehog pathway by targeting Smoothened. Nat. Chem. Biol. 2006, 2, 29–30. [Google Scholar] [CrossRef]
- Singh, B.N.; Fu, J.; Srivastava, R.K.; Shankar, S. Hedgehog signaling antagonist GDC-0449 (Vismodegib) inhibits pancreatic cancer stem cell characteristics: Molecular mechanisms. PLoS ONE 2011, 6, e27306. [Google Scholar] [CrossRef] [Green Version]
- Pricl, S.; Cortelazzi, B.; Dal Col, V.; Marson, D.; Laurini, E.; Fermeglia, M.; Licitra, L.; Pilotti, S.; Bossi, P.; Perrone, F. Smoothened (SMO) receptor mutations dictate resistance to vismodegib in basal cell carcinoma. Mol. Oncol. 2015, 9, 389–397. [Google Scholar] [CrossRef]
- Infante, P.; Alfonsi, R.; Ingallina, C.; Quaglio, D.; Ghirga, F.; D’Acquarica, I.; Bernardi, F.; Di Magno, L.; Canettieri, G.; Screpanti, I. Inhibition of Hedgehog-dependent tumors and cancer stem cells by a newly identified naturally occurring chemotype. Cell Death Dis. 2016, 7, e2376. [Google Scholar] [CrossRef] [Green Version]
- Wang, C.; Wu, H.; Evron, T.; Vardy, E.; Han, G.W.; Huang, X.-P.; Hufeisen, S.J.; Mangano, T.J.; Urban, D.J.; Katritch, V. Structural basis for Smoothened receptor modulation and chemoresistance to anticancer drugs. Nat. Commun. 2014, 5, 4355. [Google Scholar] [CrossRef] [Green Version]
- O’Reilly, K.E.; de Miera, E.V.; Segura, M.F.; Friedman, E.; Poliseno, L.; Han, S.W.; Zhong, J.; Zavadil, J.; Pavlick, A.; Hernando, E.; et al. Hedgehog pathway blockade inhibits melanoma cell growth in vitro and in vivo. Pharmaceuticals 2013, 6, 1429–1450. [Google Scholar] [CrossRef]
- Stecca, B.; Mas, C.; Clement, V.; Zbinden, M.; Correa, R.; Piguet, V.; Beermann, F.; Ruiz i Altaba, A. Melanomas require HEDGEHOG-GLI signaling regulated by interactions between GLI1 and the RAS-MEK/AKT pathways. Proc. Natl. Acad. Sci. USA 2007, 104, 5895–5900. [Google Scholar] [CrossRef] [Green Version]
- Pietrobono, S.; Santini, R.; Gagliardi, S.; Dapporto, F.; Colecchia, D.; Chiariello, M.; Leone, C.; Valoti, M.; Manetti, F.; Petricci, E.; et al. Targeted inhibition of Hedgehog-GLI signaling by novel acylguanidine derivatives inhibits melanoma cell growth by inducing replication stress and mitotic catastrophe. Cell Death Dis. 2018, 9, 142. [Google Scholar] [CrossRef]
- Guerrero, S.; Inostroza-Riquelme, M.; Contreras-Orellana, P.; Diaz-Garcia, V.; Lara, P.; Vivanco-Palma, A.; Cárdenas, A.; Miranda, V.; Robert, P.; Leyton, L.; et al. Curcumin-loaded nanoemulsion: A new safe and effective formulation to prevent tumor reincidence and metastasis. Nanoscale 2018, 10, 22612–22622. [Google Scholar] [CrossRef]
- Oyarzun-Ampuero, F.A.; Brea, J.; Loza, M.I.; Torres, D.; Alonso, M.J. Chitosan-hyaluronic acid nanoparticles loaded with heparin for the treatment of asthma. Int. J. Pharm. 2009, 381, 122–129. [Google Scholar] [CrossRef]
- Oyarzun-Ampuero, F.A.; Rivera-Rodriguez, G.R.; Alonso, M.J.; Torres, D. Hyaluronan nanocapsules as a new vehicle for intracellular drug delivery. Eur. J. Pharm. Sci. 2013, 49, 483–490. [Google Scholar] [CrossRef]
- Lollo, G.; Hervella, P.; Calvo, P.; Aviles, P.; Guillen, M.J.; Garcia-Fuentes, M.; Alonso, M.J.; Torres, D. Enhanced in vivo therapeutic efficacy of plitidepsin-loaded nanocapsules decorated with a new poly-aminoacid-PEG derivative. Int. J. Pharm. 2015, 483, 212–219. [Google Scholar] [CrossRef] [PubMed]
- Lollo, G.; Rivera-Rodriguez, G.R.; Bejaud, J.; Montier, T.; Passirani, C.; Benoit, J.P.; Garcia-Fuentes, M.; Alonso, M.J.; Torres, D. Polyglutamic acid-PEG nanocapsules as long circulating carriers for the delivery of docetaxel. Eur. J. Pharm. Biopharm. 2014, 87, 47–54. [Google Scholar] [CrossRef] [PubMed] [Green Version]
- Rivera-Rodriguez, G.R.; Lollo, G.; Montier, T.; Benoit, J.P.; Passirani, C.; Alonso, M.J.; Torres, D. In vivo evaluation of poly-l-asparagine nanocapsules as carriers for anti-cancer drug delivery. Int. J. Pharm. 2013, 458, 83–89. [Google Scholar] [CrossRef] [PubMed] [Green Version]
- Alarcón-Alarcón, C.; Inostroza-Riquelme, M.; Torres-Gallegos, C.; Araya, C.; Miranda, M.; Sánchez-Caamaño, J.C.; Moreno-Villoslada, I.; Oyarzun-Ampuero, F.A. Protection of astaxanthin from photodegradation by its inclusion in hierarchically assembled nano and microstructures with potential as food. Food Hydrocol. 2018, 83, 36–44. [Google Scholar] [CrossRef]
- Machado, D.; Shishido, S.M.; Queiroz, K.C.; Oliveira, D.N.; Faria, A.L.; Catharino, R.R.; Spek, C.A.; Ferreira, C.V. Irradiated riboflavin diminishes the aggressiveness of melanoma in vitro and in vivo. PLoS ONE 2013, 8, e54269. [Google Scholar] [CrossRef] [Green Version]
- Lobos-Gonzalez, L.; Aguilar-Guzman, L.; Fernandez, J.G.; Munoz, N.; Hossain, M.; Bieneck, S.; Silva, V.; Burzio, V.; Sviderskaya, E.V.; Bennett, D.C.; et al. Caveolin-1 is a risk factor for postsurgery metastasis in preclinical melanoma models. Melanoma Res. 2014, 24, 108–119. [Google Scholar] [CrossRef] [Green Version]
- Lobos-Gonzalez, L.; Aguilar, L.; Diaz, J.; Diaz, N.; Urra, H.; Torres, V.A.; Silva, V.; Fitzpatrick, C.; Lladser, A.; Hoek, K.S.; et al. E-cadherin determines Caveolin-1 tumor suppression or metastasis enhancing function in melanoma cells. Pigment Cell Melanoma Res. 2013, 26, 555–570. [Google Scholar] [CrossRef] [Green Version]
- Pal, R.; Mamidi, M.K.; Das, A.K.; Bhonde, R. Diverse effects of dimethyl sulfoxide (DMSO) on the differentiation potential of human embryonic stem cells. Arch. Toxicol. 2012, 86, 651–661. [Google Scholar] [CrossRef]
- Hanslick, J.L.; Lau, K.; Noguchi, K.K.; Olney, J.W.; Zorumski, C.F.; Mennerick, S.; Farber, N.B. Dimethyl sulfoxide (DMSO) produces widespread apoptosis in the developing central nervous system. Neurobiol. Dis. 2009, 34, 1–10. [Google Scholar] [CrossRef] [Green Version]
- Baillon, L.; Basler, K. Reflections on cell competition. Semin. Cell Dev. Biol. 2014, 32, 137–144. [Google Scholar] [CrossRef]
- Sanchez, I.; Dynlacht, B.D. New insights into cyclins, CDKs, and cell cycle control. Semin. Cell Dev. Biol. 2005, 16, 311–321. [Google Scholar] [CrossRef]
- Yoo, Y.A.; Kang, M.H.; Lee, H.J.; Kim, B.H.; Park, J.K.; Kim, H.K.; Kim, J.S.; Oh, S.C. Sonic hedgehog pathway promotes metastasis and lymphangiogenesis via activation of Akt, EMT, and MMP-9 pathway in gastric cancer. Cancer Res. 2011, 71, 7061–7070. [Google Scholar] [CrossRef] [Green Version]
- Fan, H.X.; Wang, S.; Zhao, H.; Liu, N.; Chen, D.; Sun, M.; Zheng, J.H. Sonic hedgehog signaling may promote invasion and metastasis of oral squamous cell carcinoma by activating MMP-9 and E-cadherin expression. Med. Oncol. 2014, 31, 41. [Google Scholar] [CrossRef]
- Das, S.; Samant, R.S.; Shevde, L.A. The hedgehog pathway conditions the bone microenvironment for osteolytic metastasis of breast cancer. Int. J. Breast Cancer 2012, 2012, 298623. [Google Scholar] [CrossRef] [Green Version]
- Wu, C.; Zhu, X.; Liu, W.; Ruan, T.; Tao, K. Hedgehog signaling pathway in colorectal cancer: Function, mechanism, and therapy. OncoTargets Ther. 2017, 10, 3249–3259. [Google Scholar] [CrossRef] [Green Version]
- Varnat, F.; Duquet, A.; Malerba, M.; Zbinden, M.; Mas, C.; Gervaz, P.; Ruiz i Altaba, A. Human colon cancer epithelial cells harbour active HEDGEHOG-GLI signalling that is essential for tumour growth, recurrence, metastasis and stem cell survival and expansion. EMBO Mol. Med. 2009, 1, 338–351. [Google Scholar] [CrossRef]
- Varnat, F.; Siegl-Cachedenier, I.; Malerba, M.; Gervaz, P.; Ruiz i Altaba, A. Loss of WNT-TCF addiction and enhancement of HH-GLI1 signalling define the metastatic transition of human colon carcinomas. EMBO Mol. Med. 2010, 2, 440–457. [Google Scholar] [CrossRef]
- Kumar, V.; Chaudhary, A.K.; Dong, Y.; Zhong, H.A.; Mondal, G.; Lin, F.; Kumar, V.; Mahato, R.I. Design, Synthesis and Biological Evaluation of novel Hedgehog Inhibitors for treating Pancreatic Cancer. Sci. Rep. 2017, 7, 1665. [Google Scholar] [CrossRef] [Green Version]
- Athar, M.; Li, C.; Tang, X.; Chi, S.; Zhang, X.; Kim, A.L.; Tyring, S.K.; Kopelovich, L.; Hebert, J.; Epstein, E.H., Jr.; et al. Inhibition of smoothened signaling prevents ultraviolet B-induced basal cell carcinomas through regulation of Fas expression and apoptosis. Cancer Res. 2004, 64, 7545–7552. [Google Scholar] [CrossRef] [Green Version]
- Filocamo, G.; Brunetti, M.; Colaceci, F.; Sasso, R.; Tanori, M.; Pasquali, E.; Alfonsi, R.; Mancuso, M.; Saran, A.; Lahm, A.; et al. MK-4101, a Potent Inhibitor of the Hedgehog Pathway, Is Highly Active against Medulloblastoma and Basal Cell Carcinoma. Mol. Cancer Ther. 2016, 15, 1177–1189. [Google Scholar] [CrossRef] [Green Version]
- Jalili, A.; Mertz, K.D.; Romanov, J.; Wagner, C.; Kalthoff, F.; Stuetz, A.; Pathria, G.; Gschaider, M.; Stingl, G.; Wagner, S.N. NVP-LDE225, a potent and selective SMOOTHENED antagonist reduces melanoma growth in vitro and in vivo. PLoS ONE 2013, 8, e69064. [Google Scholar] [CrossRef]
- Spartan’10, Version 1.1.0; Wavefunction, Inc.: Irvine, CA, USA, 2010.
- Morris, G.M.; Huey, R.; Lindstrom, W.; Sanner, M.F.; Belew, R.K.; Goodsell, D.S.; Olson, A.J. AutoDock4 and AutoDockTools4: Automated docking with selective receptor flexibility. J. Comput. Chem. 2009, 30, 2785–2791. [Google Scholar] [CrossRef] [Green Version]
- Schrödinger LLC. The PyMOL Molecular Graphics System, Version 1.8; Schrödinger LLC: New York, NY, USA, 2015.
- Schrödinger LLC. Schrödinger Release 2018-1: Maestro, Schrödinger LLC: New York, NY, USA, 2018.


| IC50 (µM) | |||||||||||||
|---|---|---|---|---|---|---|---|---|---|---|---|---|---|
| Compound | HH-Dependent Cell Lines | HH-Independent Cell Lines | |||||||||||
| HCT116 a | SI | HT29 b | SI | Daoy d | SI | H1975 c | SI | AsPC-1 e | SI | BxPC-3 f | SI | HEK293 g | |
| 4a | 32 ± 0.3 | 1.6 | >50 | - | 18 ± 0.2 | 2.7 | 34 ± 0.9 | 1.5 | 20.1 ± 0.3 | 2.5 | >50 | - | >50 |
| 4b | 47 ± 0.9 | 1.1 | >50 | - | >50 | - | 30 ± 1.0 | 1.7 | 23.2 ± 0.2 | 2.2 | >50 | - | >50 |
| 4c | >50 | - | >50 | - | 31 ± 0.9 | 0.9 | 19 ± 0.8 | 2.6 | >50 | 1.0 | >50 | - | >50 |
| 4e | >50 | - | >50 | - | >50 | - | 23 ± 0.3 | 2.2 | >50 | 1.0 | >50 | - | >50 |
| 4h | >50 | - | >50 | - | 19 ± 1.1 | 2.6 | 39 ± 1.2 | 1.3 | >50 | 1.0 | >50 | - | >50 |
| 4r | 19 ± 0.8 | 2.6 | >50 | - | 6.5 ± 0.4 | 7.7 | 7.7 ± 0.4 | 6.5 | >50 | 1.0 | >50 | - | >50 |
| 4s | 1.3 ± 0.4 | 38 | 15 ± 1.2 | 3.3 | 1.4 ± 0.2 | 36 | 1.5 ± 0.3 | 33 | 1.7 ± 0.05 | >29 | 4.1 ± 0.9 | 12 | >50 |
| Vismodegib | >50 | - | >50 | - | >50 | - | >50 | - | >50 | - | >50 | - | >50 |
| Etoposide | 9.8 ± 0.5 | 0.9 | - | - | - | - | 40 ± 0.2 | 0.2 | - | - | - | - | 8.4 ± 0.7 |
| Cisplatin | - | - | - | - | 12 ± 0.7 | 1.0 | - | - | - | - | - | - | 12 ± 1.4 |
| 5-FU | 31 ± 0.3 | 0.03 | 0.51 ± 0.06 | 1.6 | - | - | - | - | - | - | - | 0.83 ± 0.07 | |
| Gemcitabine | - | - | - | - | - | - | - | - | 0.3 ± 0.09 | 25 | 0.2 ± 0.07 | 38 | 7.5 ± 0.6 |
Publisher’s Note: MDPI stays neutral with regard to jurisdictional claims in published maps and institutional affiliations. |
© 2021 by the authors. Licensee MDPI, Basel, Switzerland. This article is an open access article distributed under the terms and conditions of the Creative Commons Attribution (CC BY) license (https://creativecommons.org/licenses/by/4.0/).
Share and Cite
Zárate, A.M.; Espinosa-Bustos, C.; Guerrero, S.; Fierro, A.; Oyarzún-Ampuero, F.; Quest, A.F.G.; Di Marcotullio, L.; Loricchio, E.; Caimano, M.; Calcaterra, A.; et al. A New Smoothened Antagonist Bearing the Purine Scaffold Shows Antitumour Activity In Vitro and In Vivo. Int. J. Mol. Sci. 2021, 22, 8372. https://doi.org/10.3390/ijms22168372
Zárate AM, Espinosa-Bustos C, Guerrero S, Fierro A, Oyarzún-Ampuero F, Quest AFG, Di Marcotullio L, Loricchio E, Caimano M, Calcaterra A, et al. A New Smoothened Antagonist Bearing the Purine Scaffold Shows Antitumour Activity In Vitro and In Vivo. International Journal of Molecular Sciences. 2021; 22(16):8372. https://doi.org/10.3390/ijms22168372
Chicago/Turabian StyleZárate, Ana María, Christian Espinosa-Bustos, Simón Guerrero, Angélica Fierro, Felipe Oyarzún-Ampuero, Andrew F. G. Quest, Lucia Di Marcotullio, Elena Loricchio, Miriam Caimano, Andrea Calcaterra, and et al. 2021. "A New Smoothened Antagonist Bearing the Purine Scaffold Shows Antitumour Activity In Vitro and In Vivo" International Journal of Molecular Sciences 22, no. 16: 8372. https://doi.org/10.3390/ijms22168372