Article

Comparison of Gut Bacterial Communities of Grapholita molesta (Lepidoptera: Tortricidae) Reared on Different Host Plants

1
Key Laboratory of Integrated Pest Management on Crops in Northwestern Loess Plateau, Ministry of Agriculture, Northwest A&F University, Yangling 712100, China
2
Key Laboratory of Plant Protection Resources and Pest Management, Ministry of Education, Northwest A&F University, Yangling 712100, China
3
Department of Entomology, Cornell University, Ithaca, NY 14850, USA
*
Author to whom correspondence should be addressed.
Int. J. Mol. Sci. 2021, 22(13), 6843; https://doi.org/10.3390/ijms22136843
Submission received: 12 May 2021 / Revised: 14 June 2021 / Accepted: 22 June 2021 / Published: 25 June 2021
(This article belongs to the Special Issue Host-Microbe Interaction 3.0)

Abstract

:
Intestinal symbiotic bacteria have played an important role in the digestion, immunity detoxification, mating, and reproduction of insects during long-term coevolution. The oriental fruit moth, Grapholita molesta, is an important fruit tree pest worldwide. However, the composition of the G. molesta microbial community, especially of the gut microbiome, remains unclear. To explore the differences of gut microbiota of G. molesta when reared on different host plants, we determined the gut bacterial structure when G. molesta was transferred from an artificial diet to different host plants (apples, peaches, nectarines, crisp pears, plums, peach shoots) by amplicon sequencing technology. The results showed that Proteobacteria and Firmicutes are dominant in the gut microbiota of G. molesta. Plum-feeding G. molesta had the highest richness and diversity of gut microbiota, while apple-feeding G. molesta had the lowest. PCoA and PERMANOVA analysis revealed that there were significant differences in the gut microbiota structure of G. molesta on different diets. PICRUSt2 analysis indicated that most of the functional prediction pathways were concentrated in metabolic and cellular processes. Our results confirmed that gut bacterial communities of G. molesta can be influenced by host diets and may play an important role in host adaptation.

1. Introduction

All metazoans harbor substantial numbers of commensal microorganisms in the gut [1]. In the process of long-term coevolution, insects and gut microorganisms have formed an interdependent symbiotic relationship. Insects provide a stable living environment and essential nutrients for intestinal microorganisms, which are also involved in a variety of insect metabolic processes, providing some nutrients for insects and digesting complex carbohydrates [2]. It has been widely confirmed that symbiotic microorganisms participate in the metabolism of the host [3,4], degrade exogenous biological toxins [5,6,7], help the host absorb nutrients [8], regulate the host’s adaptability [4,9], protect the host from pathogens [10,11], regulate mating and reproduction [12,13], promote growth and development [14], and affect the transmission efficiency of vector insects [15,16].
Grapholita molesta, known as the oriental fruit moth, is an important fruit tree pest widely distributed in the fruit-growing areas of Asia, Europe, America, Australia, and Africa [17,18,19,20]. It has the characteristic of host shifting. Larvae usually harm the tender shoots of peach trees first, which causes the shoots’ dieback. It will then drill into and eat the fruits of peaches, pears, and apples, resulting in fruit shedding, which seriously affects the product and quality of fruits, causing a great loss of economy [19,21,22,23]. The fruit- and shoot-boring habit makes conventional insecticides poorly effective [22]. In addition, the widespread use of conventional insecticides could lead to many problems, for example, resistance to conventional insecticides, environmental pollution, human health impacts, and injury to beneficial insects. Bacillus thuringiensis, as a biological agent with insecticidal activity, has been widely used in the pest control of agriculture and forestry. However, the sensitivity of larvae to B. thuringiensis varies due to the specificity of insect hosts and the diversity of gut microbiota. Indigenous gut bacteria increased the susceptibility of larvae to B. thuringiensis and contributed to B. thuringiensis insecticidal activity in Lymantria dispar, Vanessa cardui, Manduca sexta, Pieris rapae, and Spodoptera littoralis [24,25,26], while in Galleria mellonella and Homona magnanima, indigenous gut bacteria increased the tolerance of larvae to B. thuringiensis toxin [27,28]. Moreover, the resistance of larvae to entomopathogenic bacterium B. thuringiensis is also affected by the maturity of the host plant. Research by Martemyanov showed that when larvae feed on mature leaves, the negative effects of B. thuringiensis were eliminated [29]. Therefore, intestinal microorganism is an important entry point to reveal the adaptation mechanism between different hosts of G. molesta.
The composition of the gut microbiota of insects can be affected by many factors, such as host species, genotype, diet, and the host living environment. Inhibition of Caudal gene expression of Drosophila by RNA interference led to overexpression of antimicrobial peptides, which in turn changed the gut bacterial community [30]. The structures of gut microbiota of G. molesta and Carposina sasakii were significantly different, even when fed with the same Fuji apples and under the same conditions [31]. The 16S rDNA amplicon sequencing of spider mite populations from five different regions in China found that Flavobacterium, Glutamicibacter, Bosea, Xanthobacter, Acinetobacter, Stenotrophomonas, and Caulobacter showed host-species specificity [32]. Yang et al. revealed that the diversity of gut microbes in Plutella xylostella was significantly decreased after the host shifted from radishes to peas and was raised for 17 generations [7]. There have been some studies on the gut microbiota of G. molesta [20,31,33], but as far as we know, there are few reports about the structure of the gut bacterial communities when G. molesta feed on the fruits or young shoots of Rosaceae hosts.
To explore the impact of host plants on the gut communities of G. molesta, we used 16S rDNA sequencing to investigate the structure of the gut communities of G. molesta fed on artificial diets, apples, pears, nectarines, peaches, plums, and peach shoots. We found that the structure of the gut communities of G. molesta changes significantly after transfer from an artificial diet to the four host fruits of apples, pears, nectarines, and peaches and peach shoots, and the abundance of Proteobacteria increases significantly, especially when feeding on apples and peaches. After transfer from an artificial diet to plums, the diversity of the gut communities of G. molesta increased. The relative abundance of Firmicutes and Bacteroidota significantly increased, and that of Proteobacteria was decreased. Our results suggest that both the diversity and relative abundance of G. molesta gut bacterial communities are influenced by the host plant.

2. Results

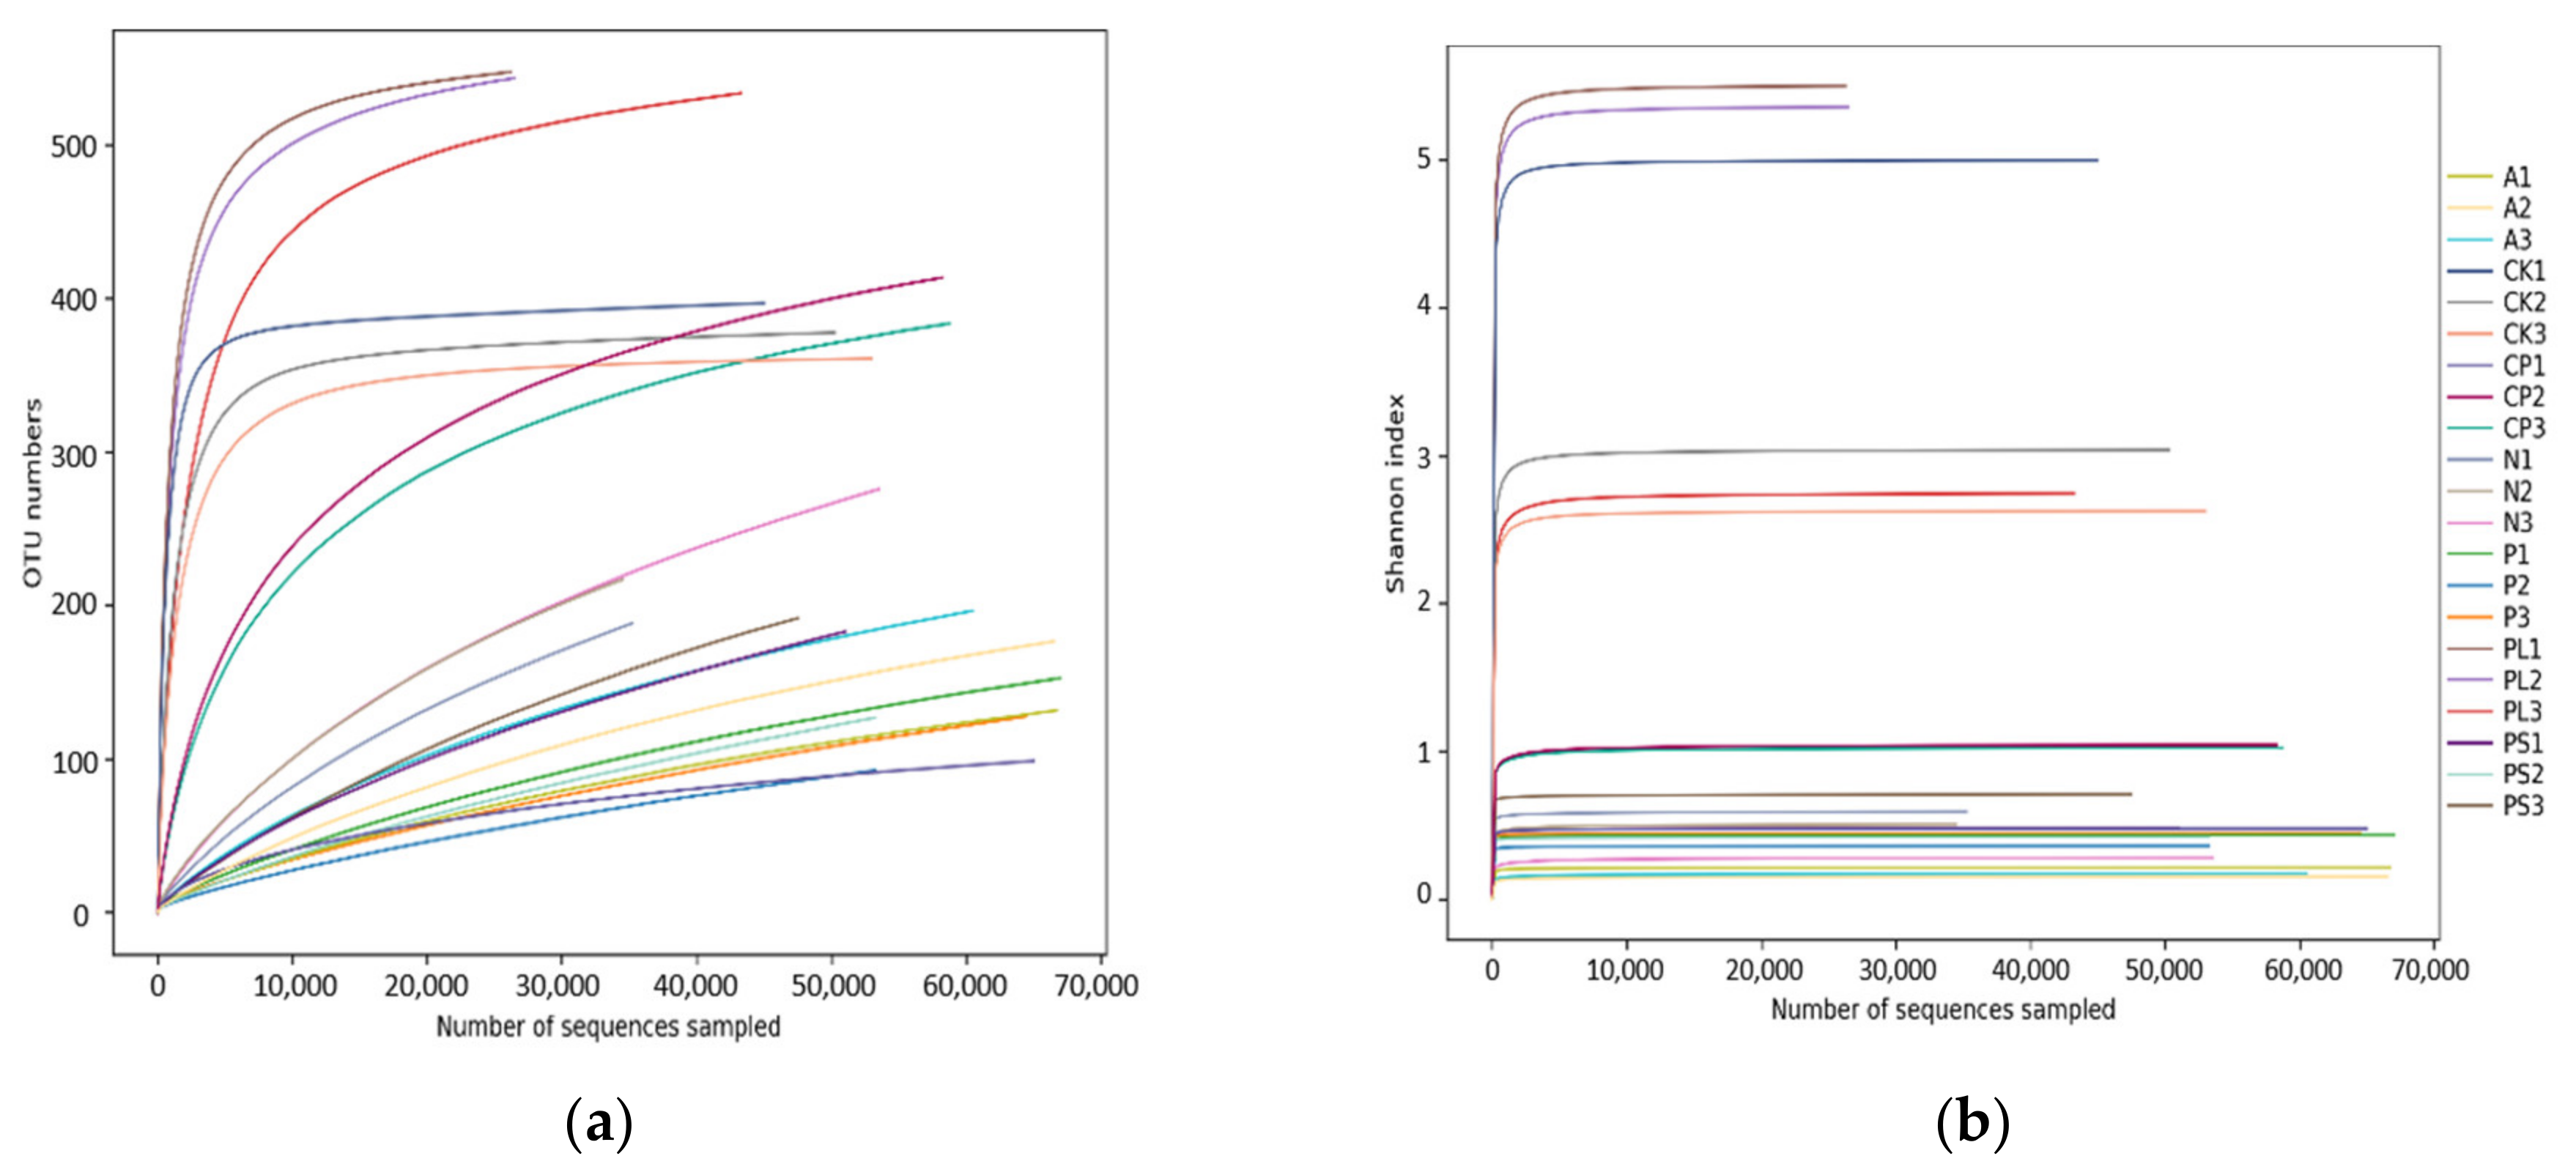
2.1. Analysis of 16S rDNA Sequencing Results

Seven groups of 21 samples were sequenced by Illumina HiSeq 2500 to obtain 1,531,209 pairs of reads. A total of 1,285,740 clean tags were generated after double-ended read stitching and filtering. Each sample generated at least 36,618 clean tags and an average of 61,226 clean tags (Table 1). Cluster analysis (based on 97% sequence similarity) obtained a total of 645 OTUs, including 18 phyla, 30 classes, 80 orders, 127 families, 224 genera, and 292 species. The sample rarefaction curve (Figure 1a) and the Shannon index rarefaction curve (Figure 1b) indicate that the sequencing volume is sufficient and the sequencing depth is saturated and that increasing the sample volume will not produce more OTUs. Meanwhile, we used Good’s coverage to check the completeness of sequencing. The results showed that the coverage of each sample was above 99%, indicating that most species in the sample were identified.

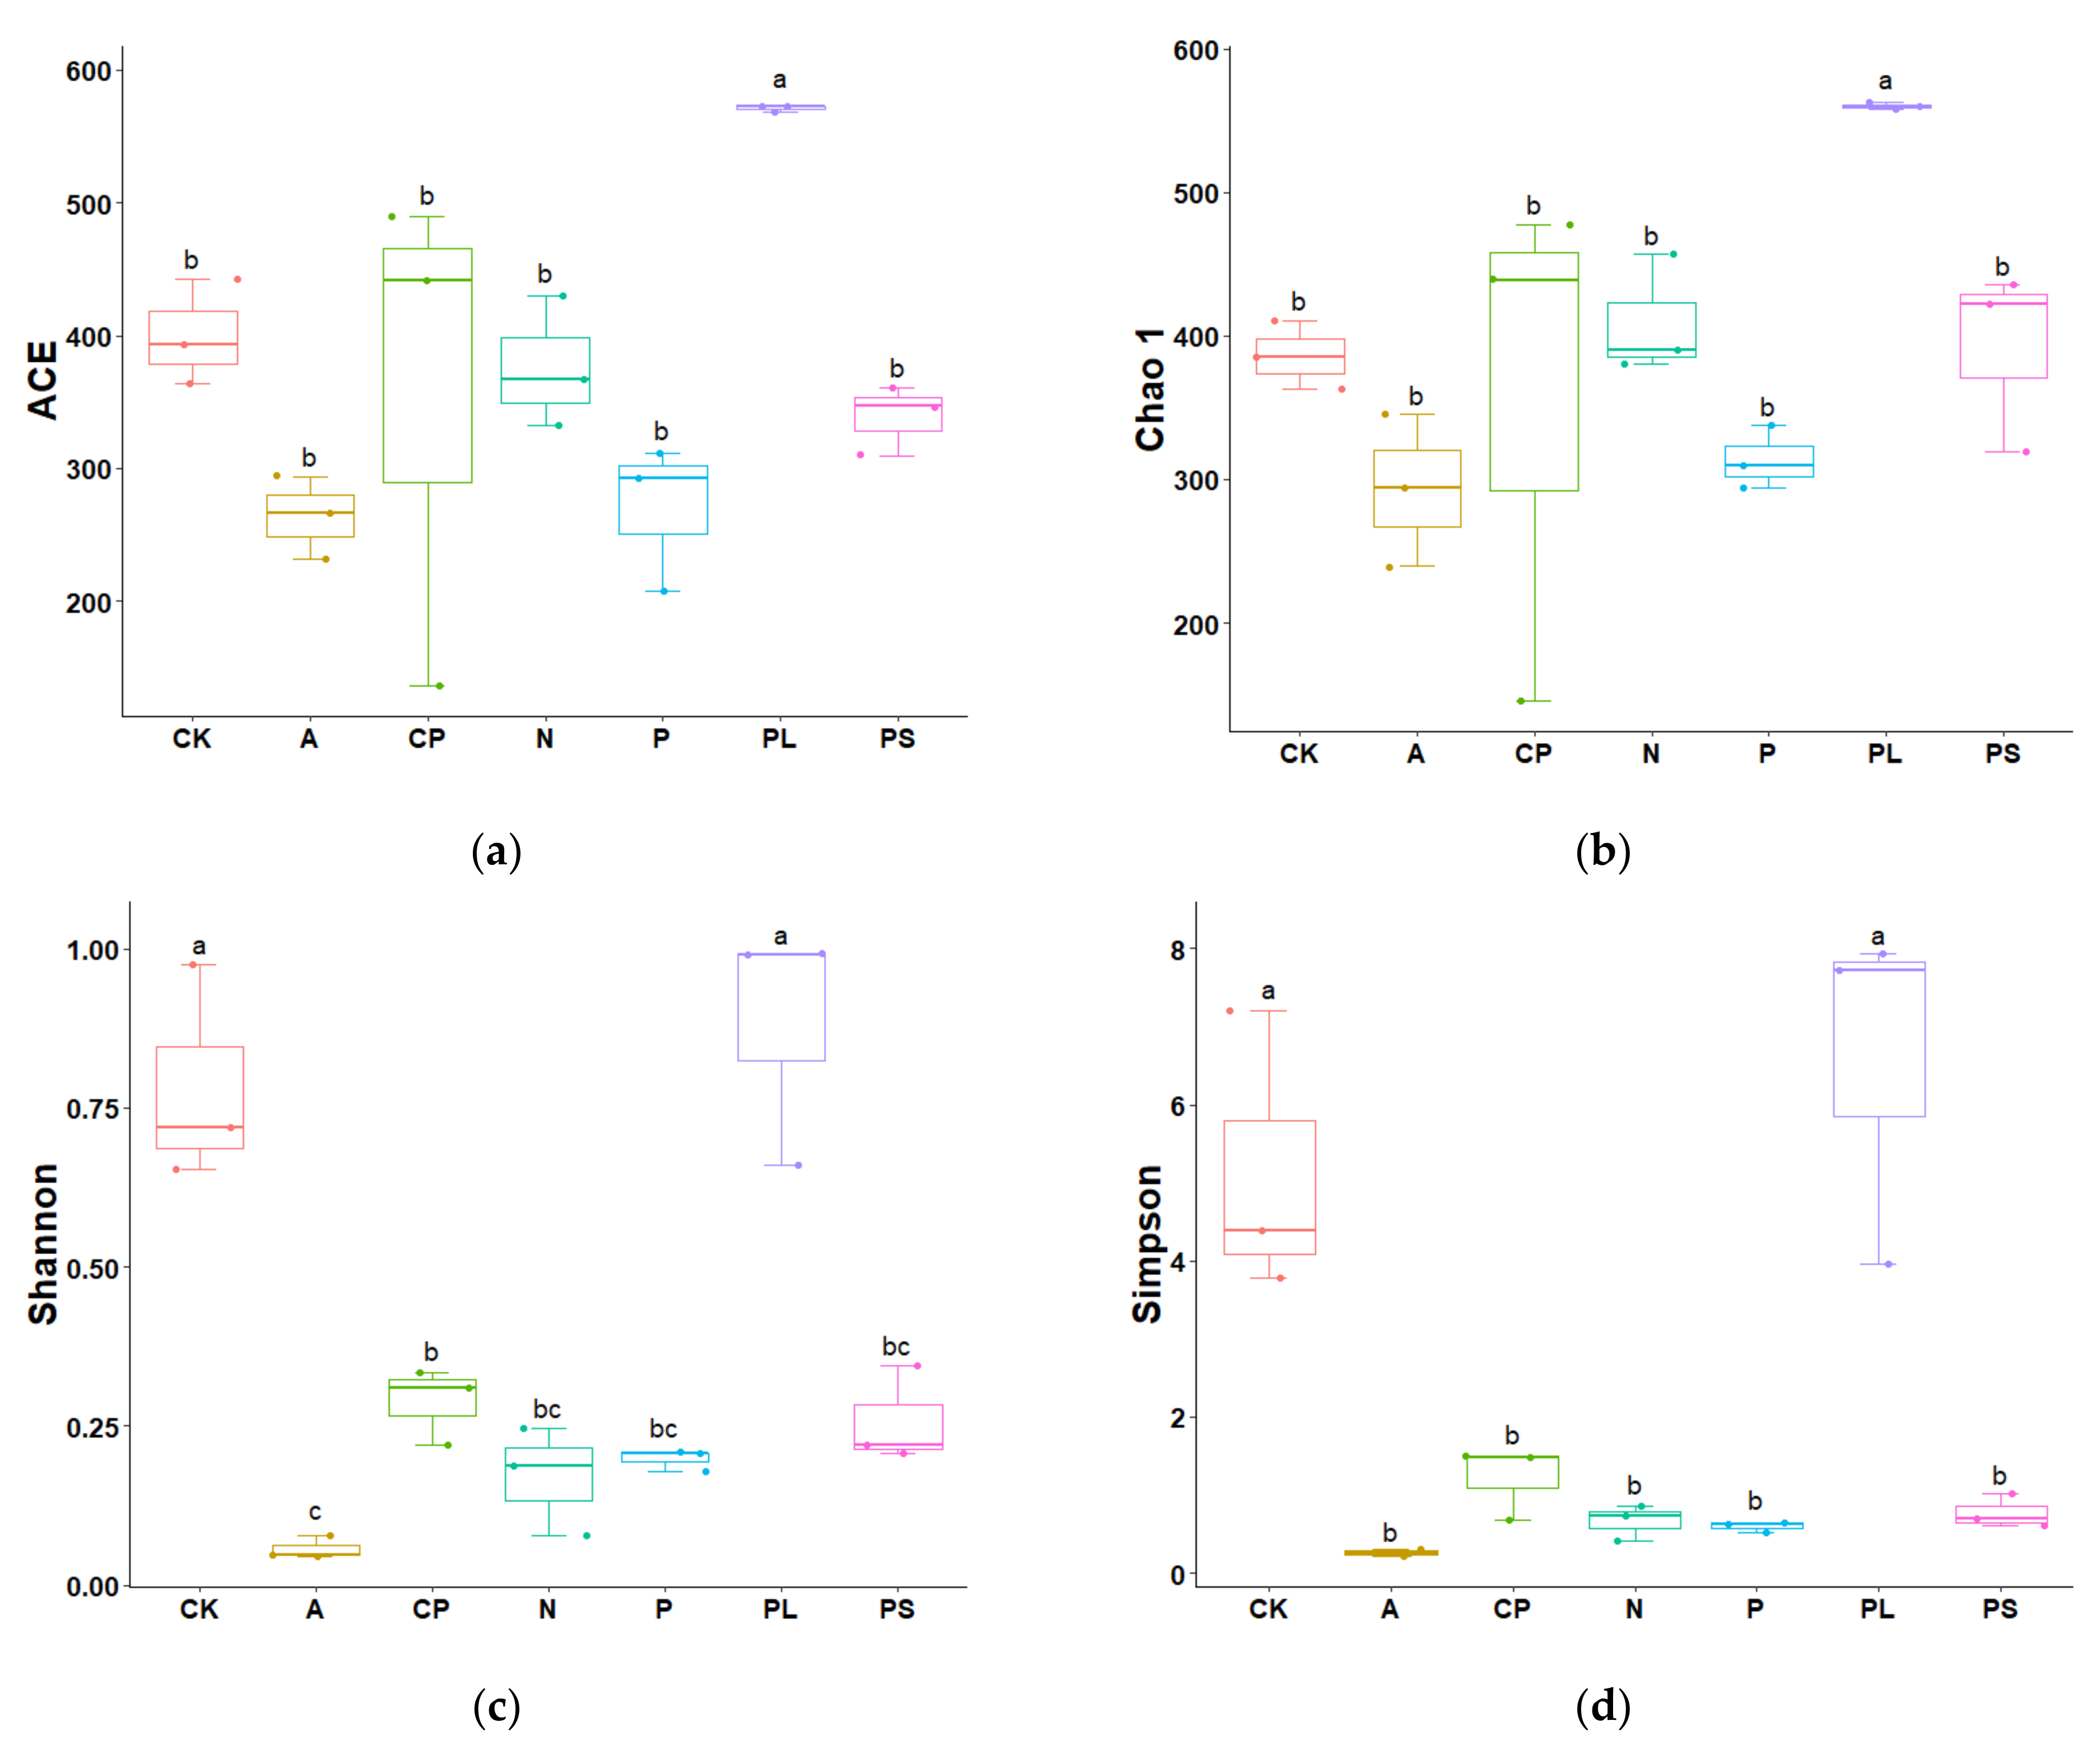
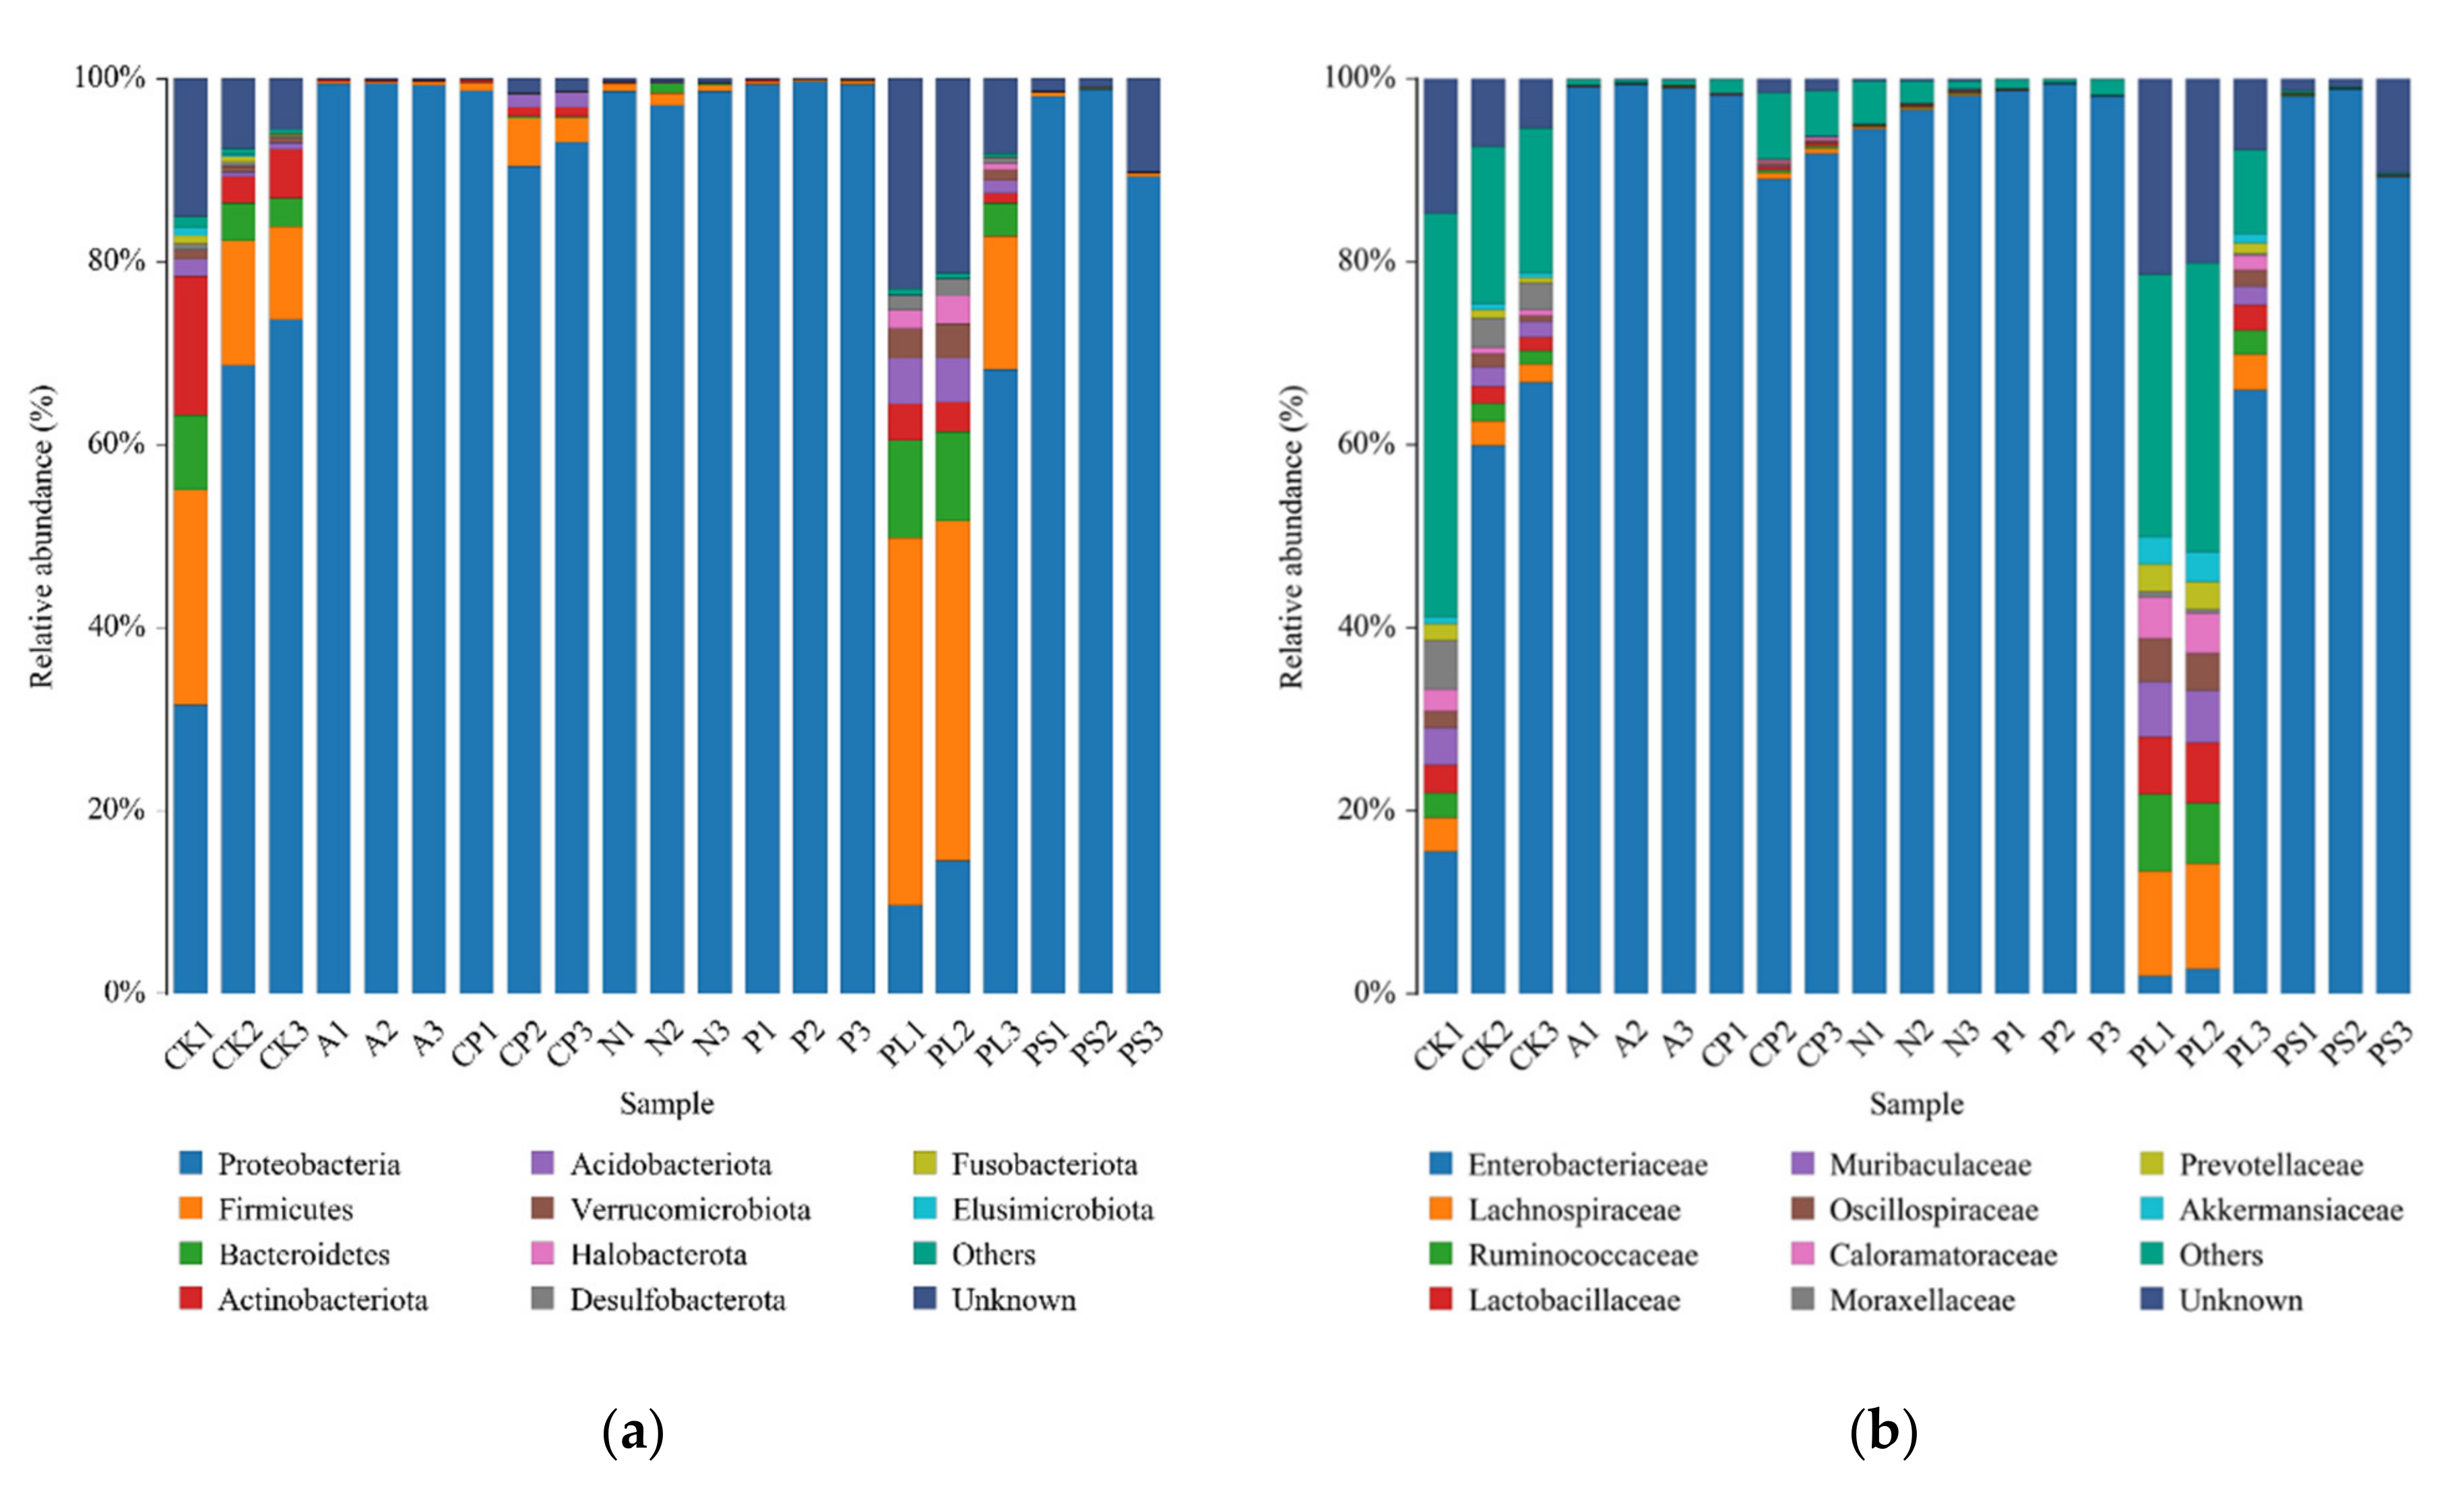
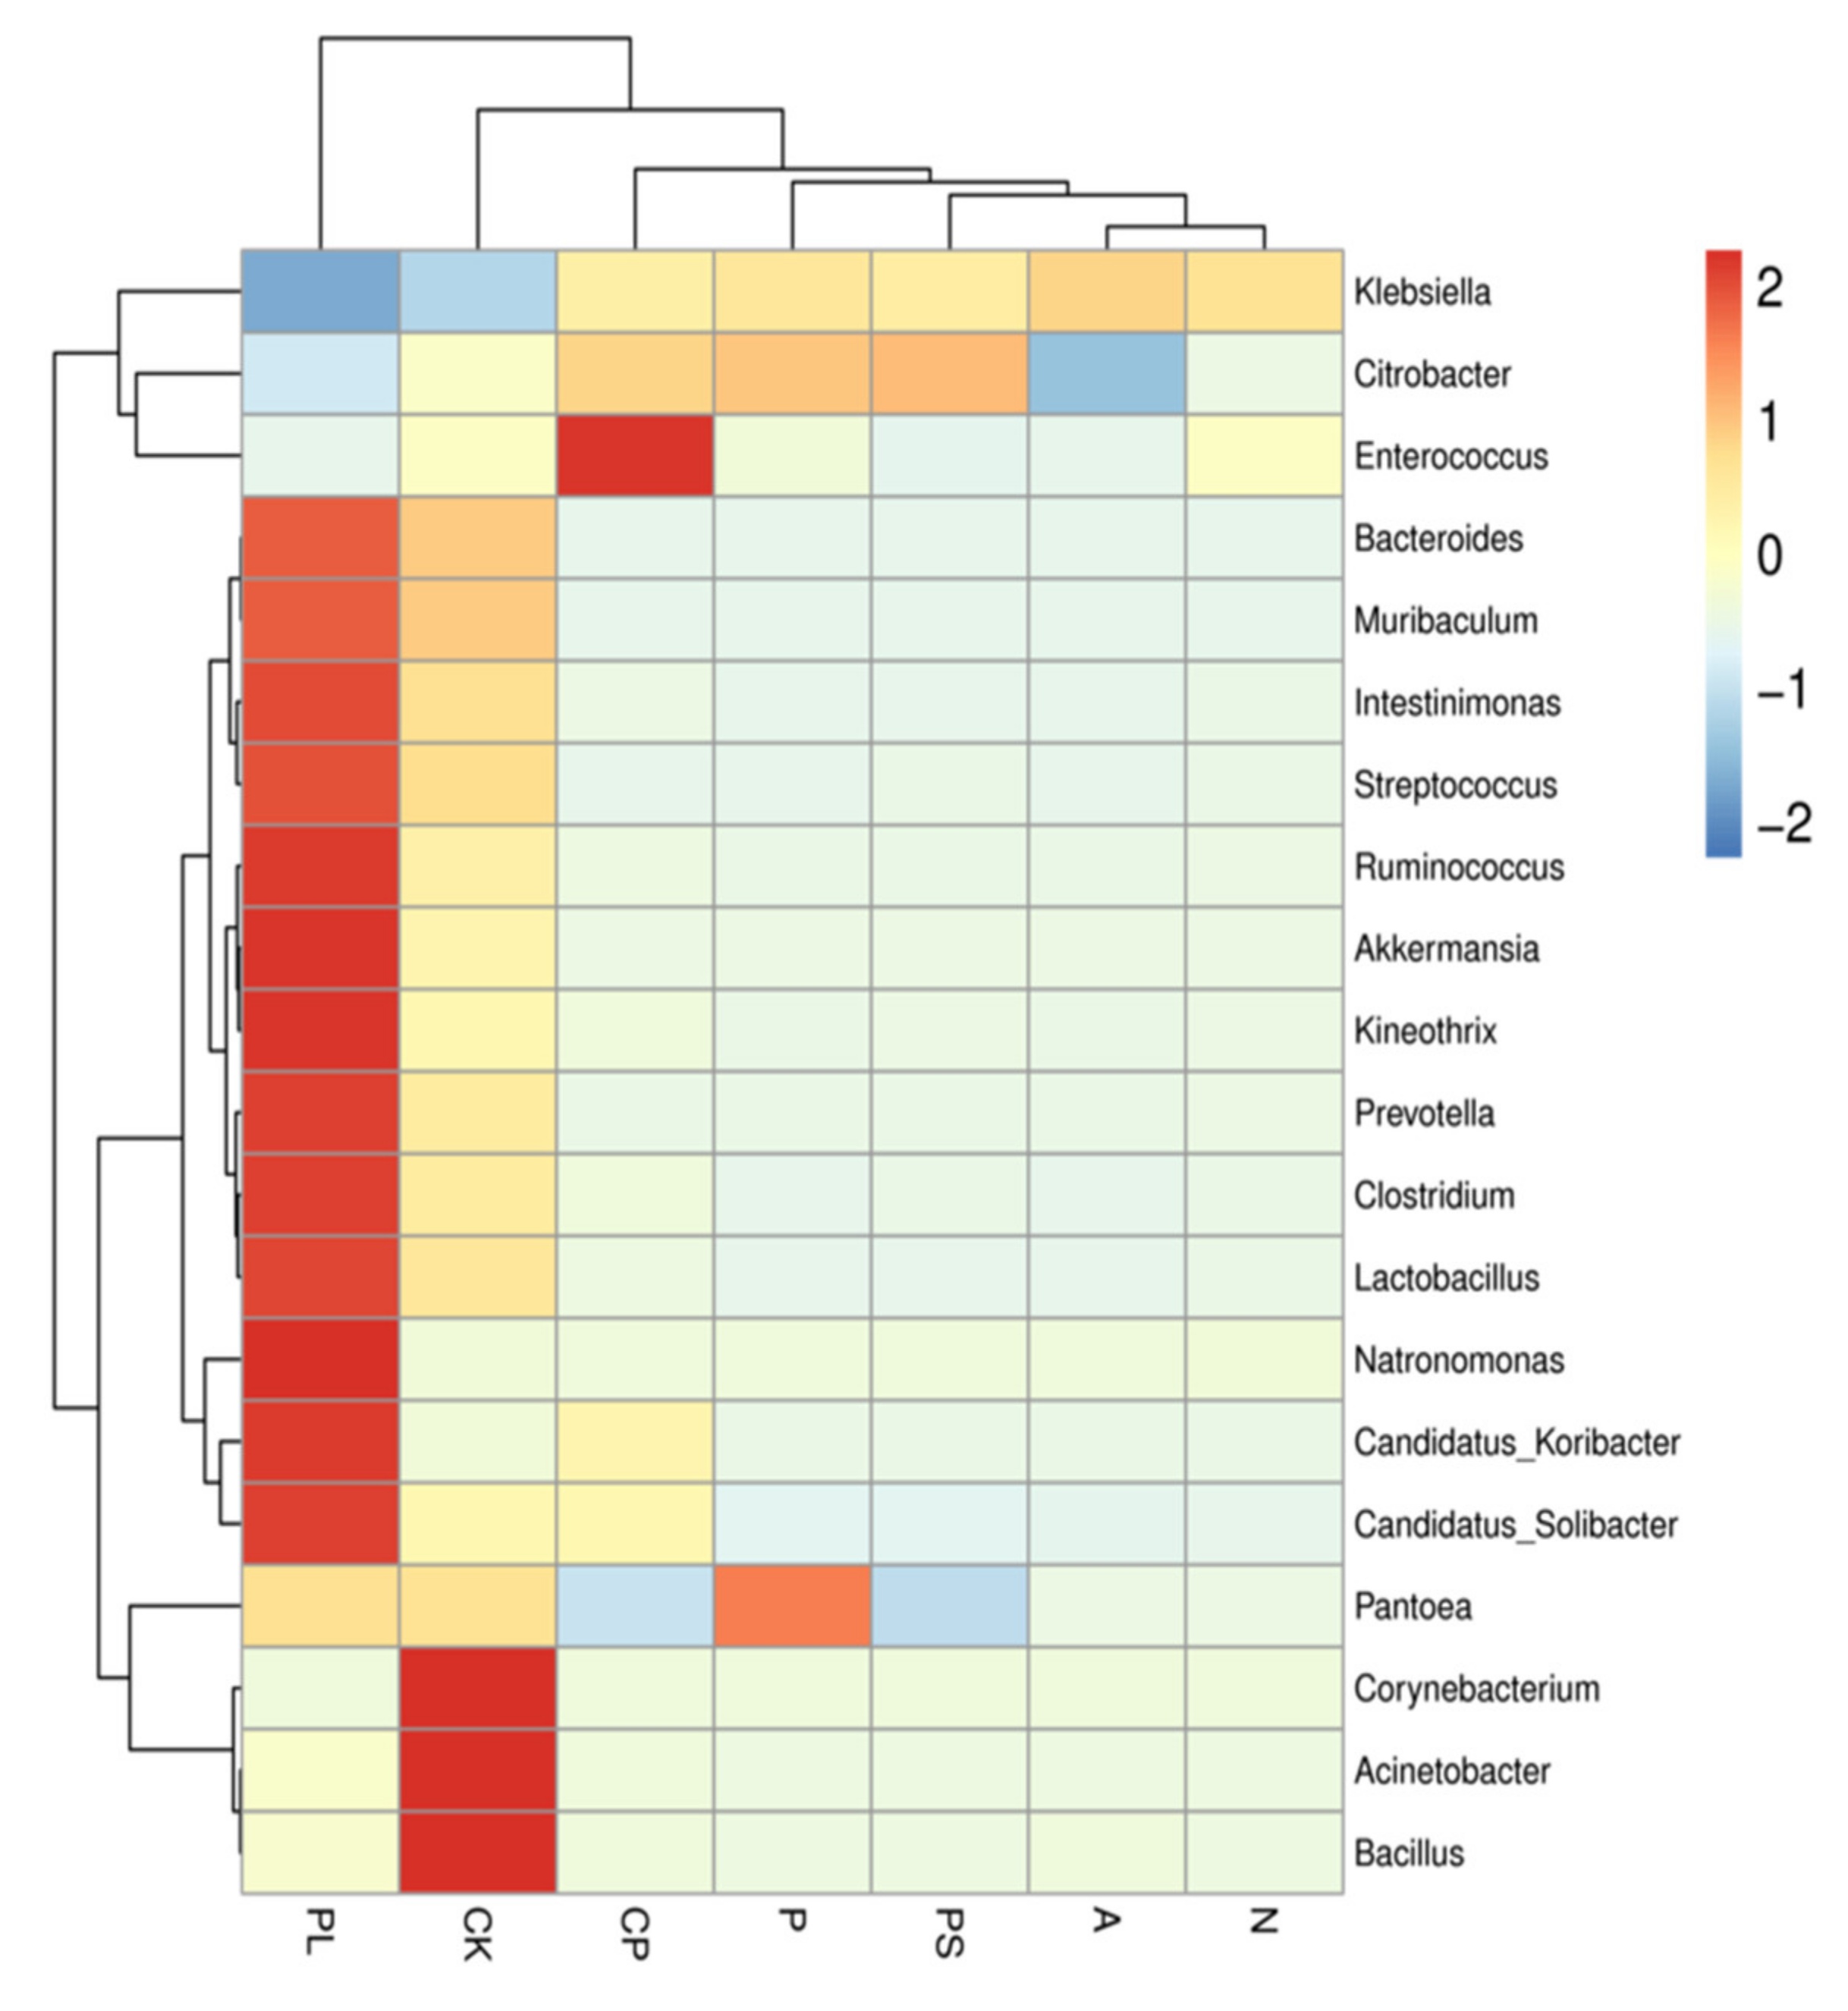
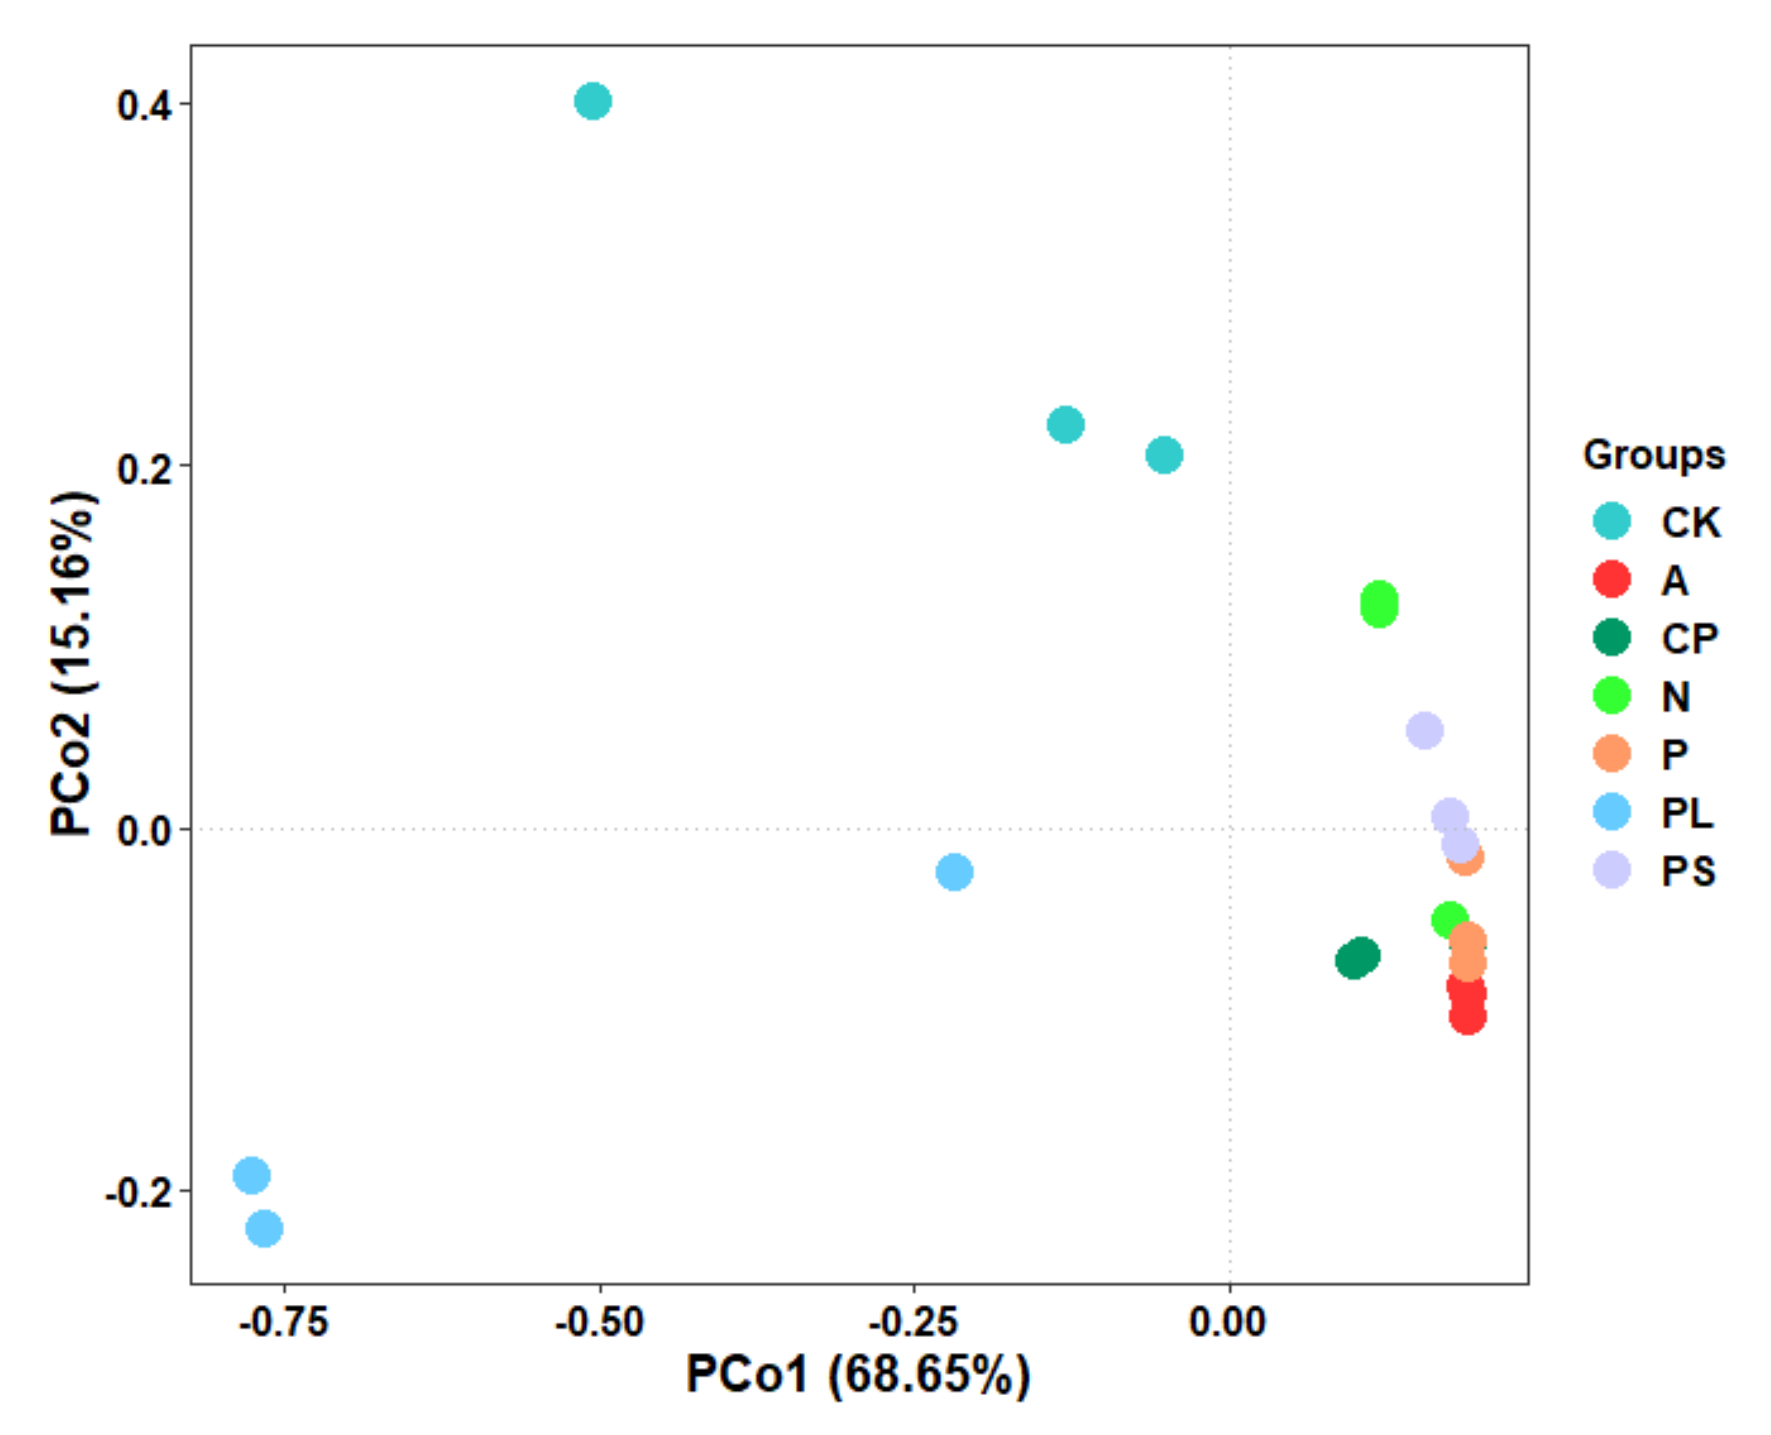
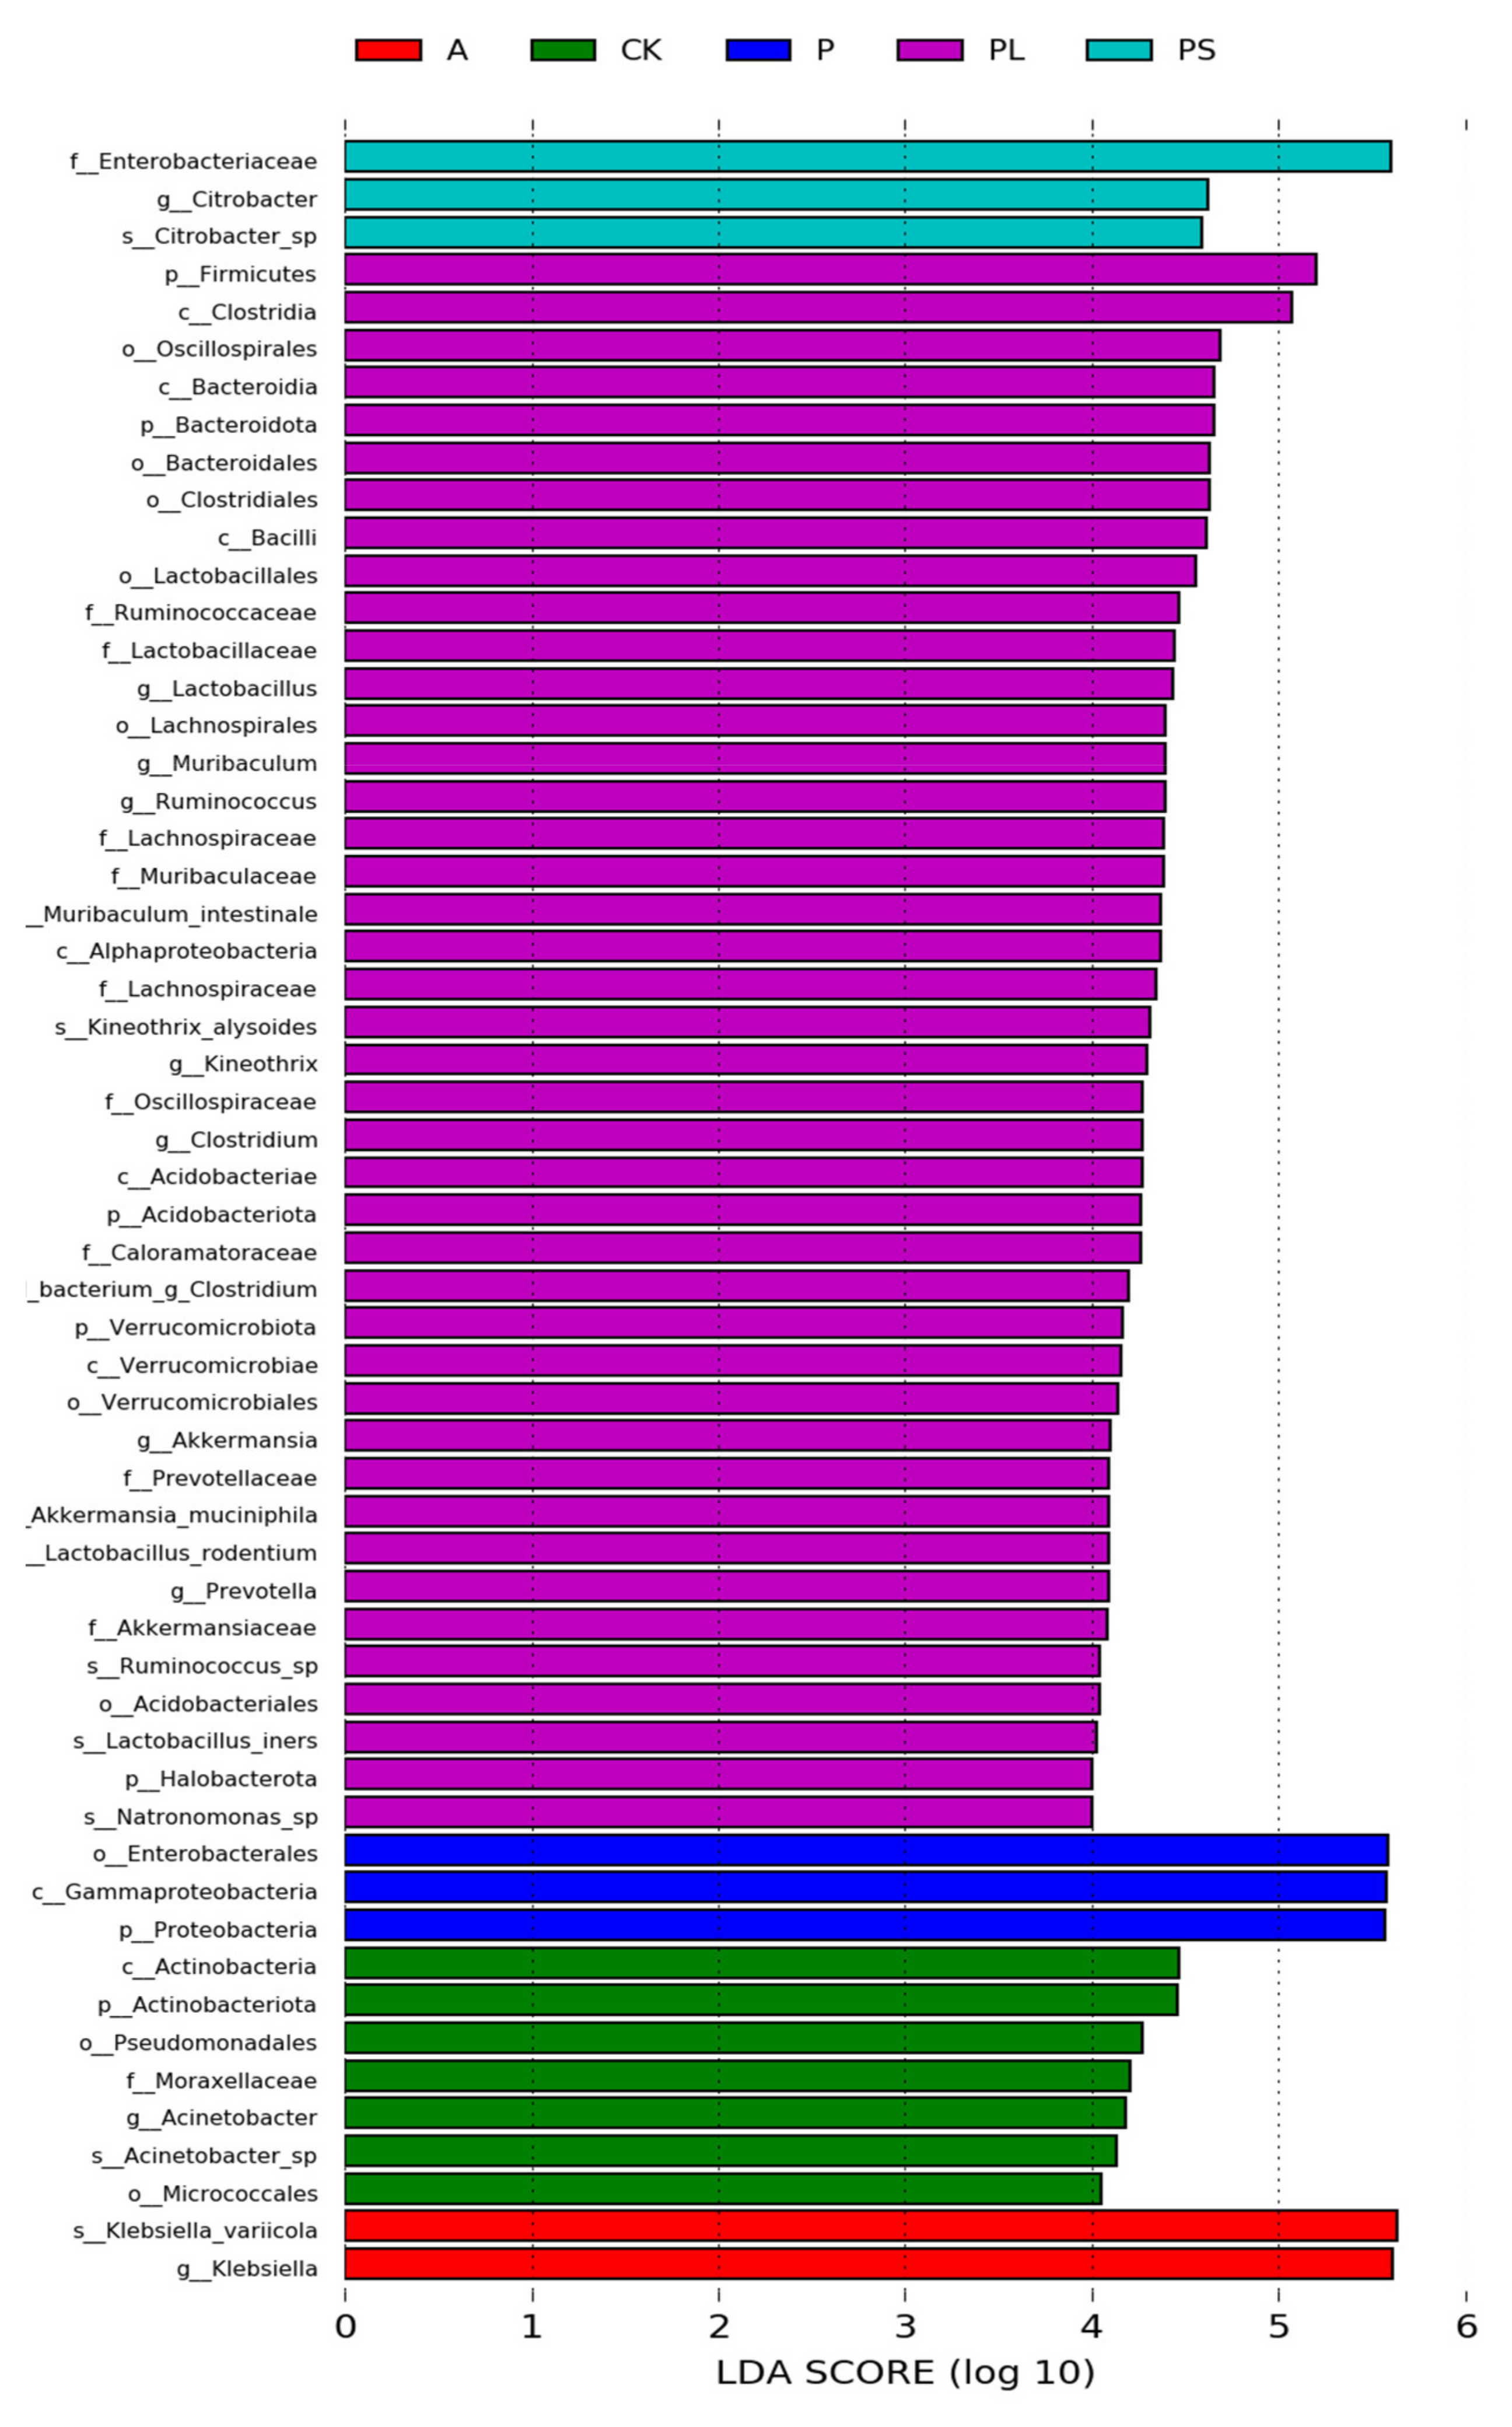
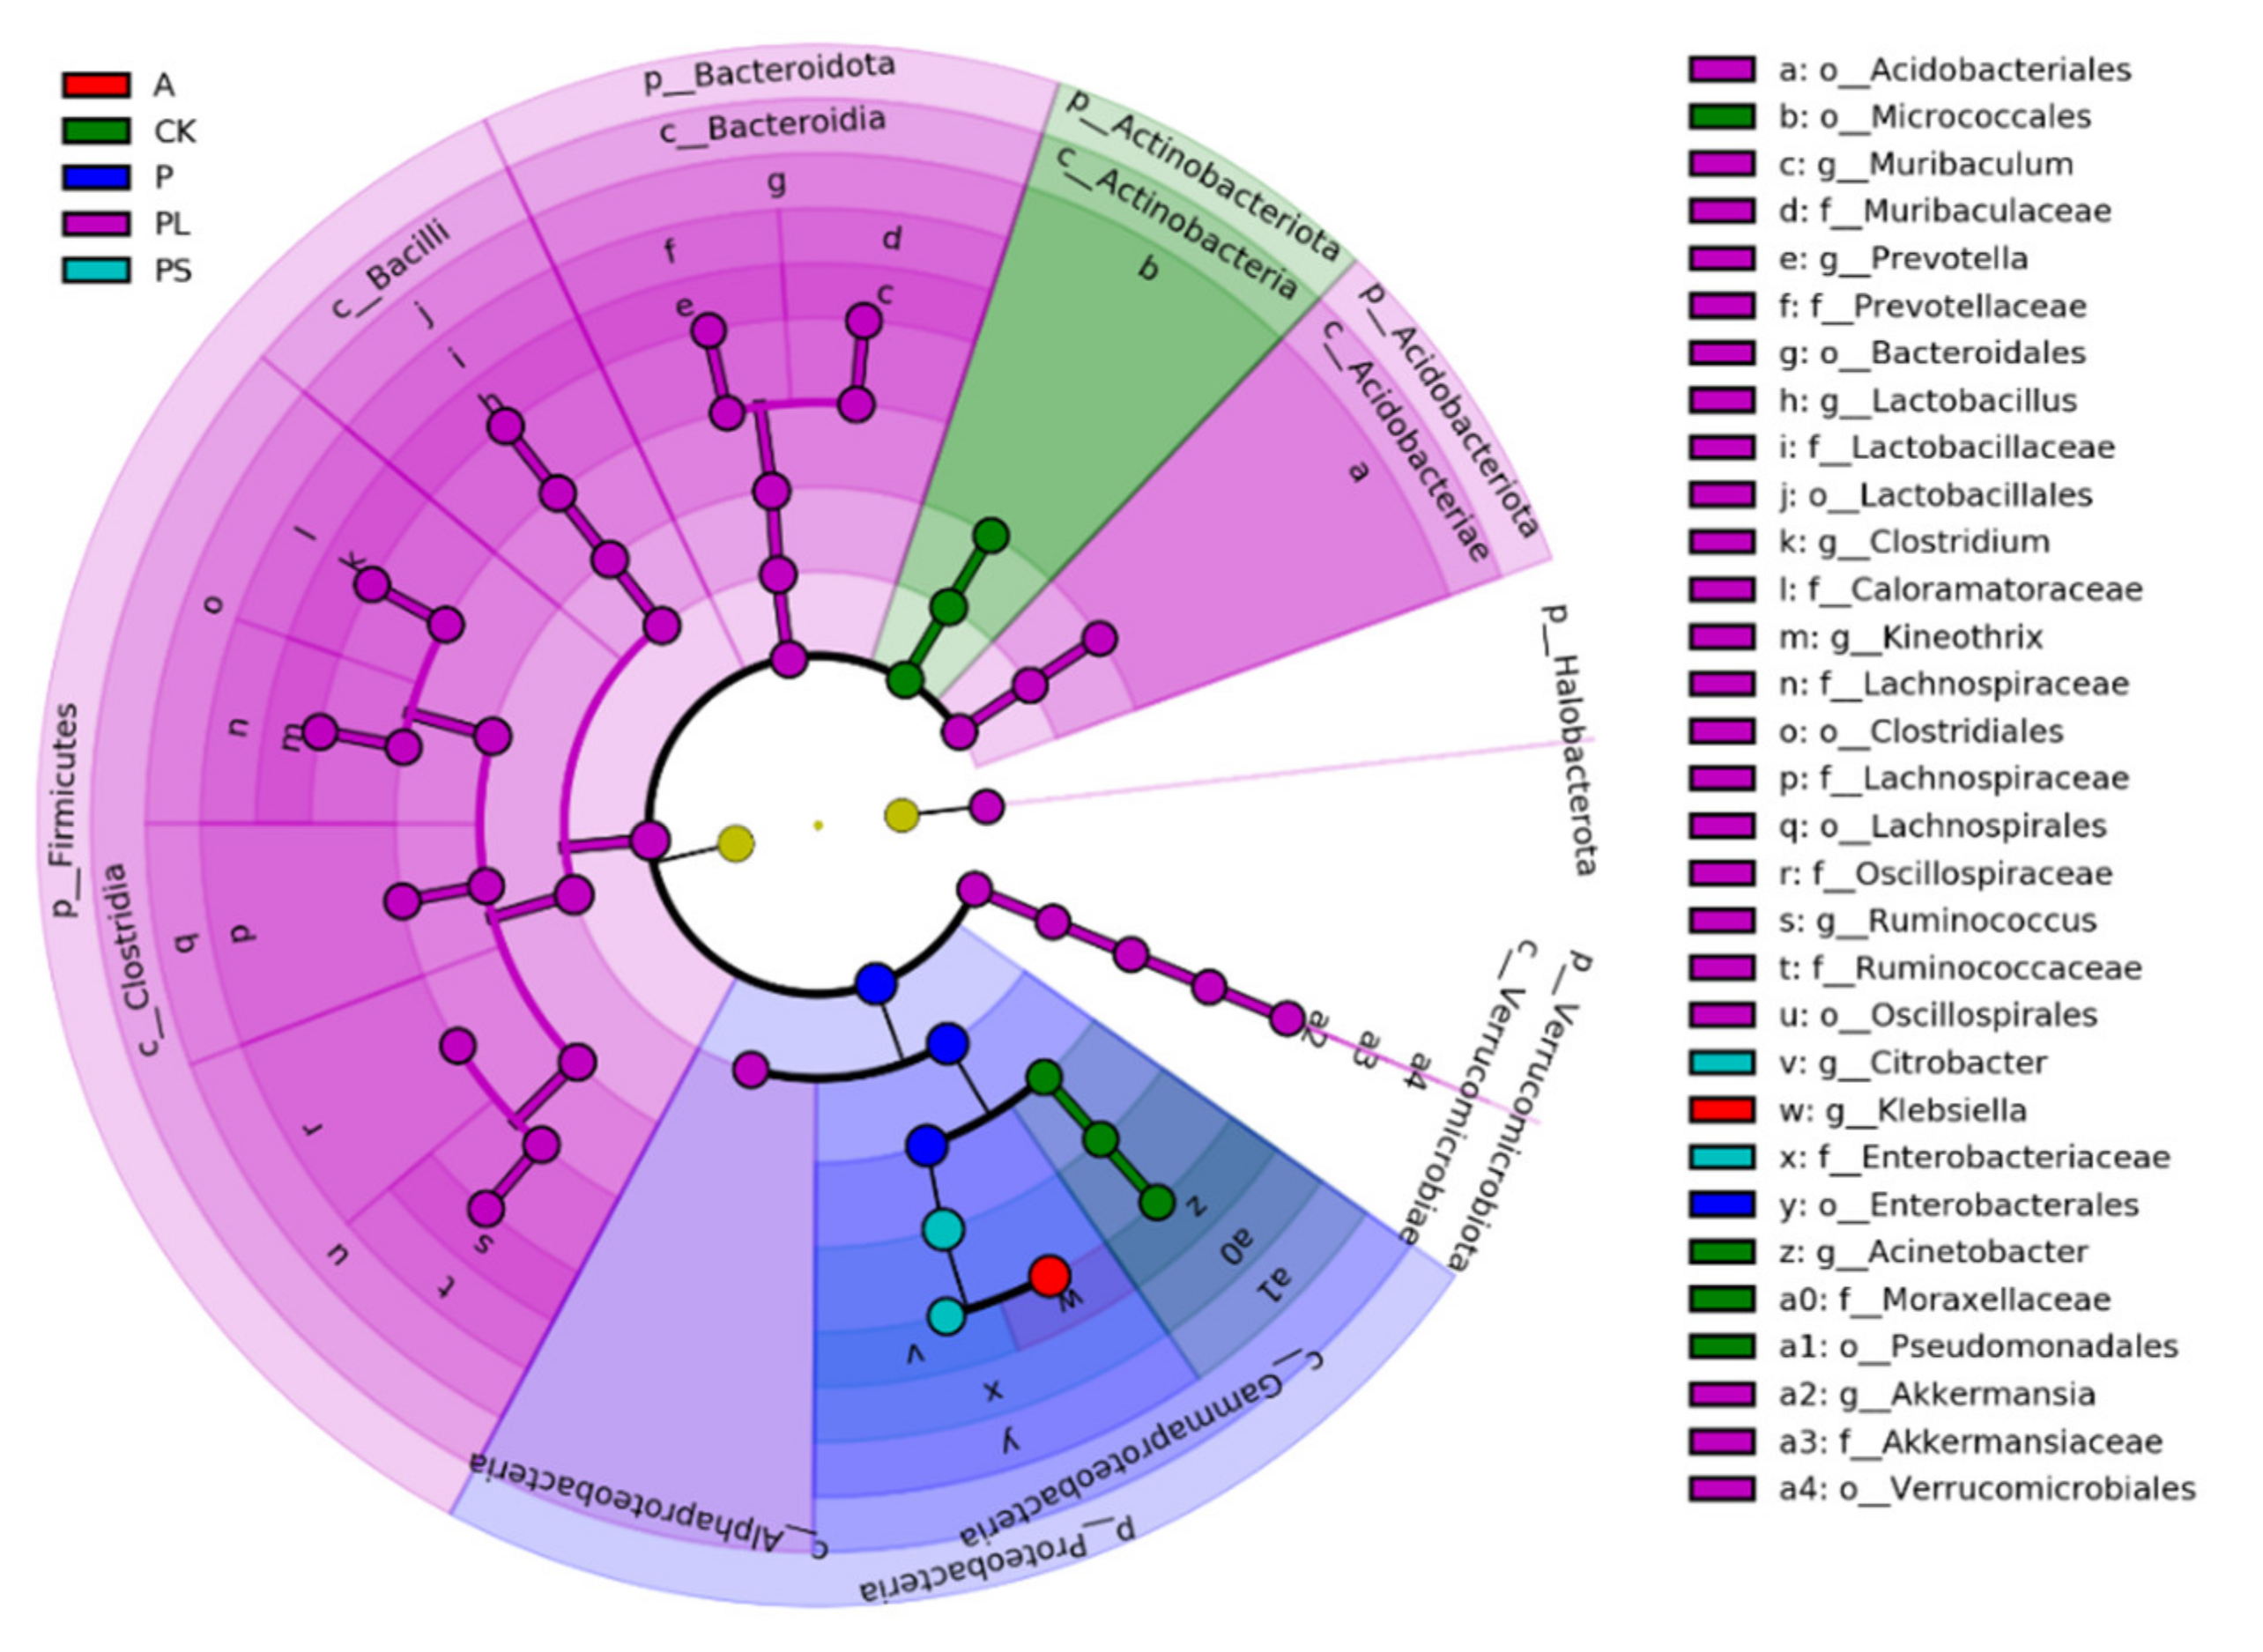
2.2. Comparison of the Gut Microbiota between Different Diets

The alpha diversity index shows that there are differences in the gut microbiota of G. molesta feeding on different host plants. The ACE and Chao 1 indices showed that the richness of gut microbiota of the G. molesta feeding on plums (PL) was significantly higher than that of other groups. The apple-feeding group (A) had the lowest values in both ACE and Chao 1 (Figure 2a,b). There was no significant difference in Shannon and Simpson’s indices between the G. molesta fed on plums (PL) and an artificial diet (CK), but these two groups were significantly higher than that of the other five treatments (p < 0.05). Similarly, the apple-feeding group (A) had the lowest values in both Shannon and Simpson’s (Figure 2c,d). Thus, the richness of gut microbiota of G. molesta feeding on plums (PL) increased after G. molesta was transferred from an artificial diet to plums. Additional the diversity decreased in different degrees after G. molesta was transferred from an artificial diet to the other five plants, except plums, especially to apples in Rosaceae.
We removed the extremely low abundance OTUs with species abundance less than 0.005%, compared the representative sequence of OTUs with the microbial reference database to obtain the species classification information corresponding to each OTU, and then at each level (phylum, class, order, family, genus, species), we counted the composition of each sample community. At the phylum level (Figure 3a), Proteobacteria, Firmicutes, Bacteroidota, Actinobacteriota, Acidobacteriota, Verrucomicrobiota, Halobacterota, Desulfobacterota, Patescibacteria, and Fusobacteriota were the top 10 phyla in relative abundance. Among them, Proteobacteria was the absolute dominant phylum, having the highest relative abundance in the peach-feeding group (P), 99.52 ± 0.12%. The relative abundances in other groups were as follows: 59.18 ± 13.26% in artificial diet-feeding (CK), 99.43 ± 0.07% in apple-feeding (A), 94.34 ± 0.32% in crisp pear-feeding (CP), 98.13 ± 0.60% in nectarine-feeding (N), 32.75 ± 18.59% in plum-feeding (PL), and 95.63 ± 2.93% in peach shoot-feeding (PS). Firmicutes, Bacteroidota, and Actinobacteriota were also dominant in artificial diet-feeding (CK) and plum-feeding groups (PL), and the relative abundances were 17.74 ± 4.85% and 32.92 ± 8.90%, 8.32 ± 2.56% and 15.06 ± 4.06%, and 7.85 ± 3.79% and 2.80 ± 0.86%, respectively (Table 2). At the family level (Figure 3b), Enterobacteriaceae was ubiquitous in most samples. The plum-feeding group (PL) had the lowest relative abundance of Enterobacteriaceae. However, the relative abundances of Lachnospiraceae (8.97 ± 2.53%), Ruminococcaceae (5.86 ± 1.71%), Lactobacillaceae (5.21 ± 1.21%), Muribaculaceae (4.59 ± 1.30%), Oscillospiraceae (3.53 ± 0.87%), Caloramatoraceae (3.50 ± 0.94%), Prevotellaceae (2.39 ± 0.62%), and Akkermansiaceae (2.41 ± 0.69%) in the plum-feeding group (PL) were significantly higher than that in the other six groups (Table 3).
In order to reveal the dynamic changes in the gut microbiota of G. molesta feeding on different host plants, we selected the top 20 genera with relative abundances to draw a relative abundance cluster heat map. Clustering is based on the similarity of species abundance, horizontal clustering is sample information, and vertical clustering is species information. The gut microbiota of G. molesta feeding on plums (PL) and an artificial feed (CK) were similar in composition at the genus level; those feeding on crisp pears (CP), peaches (P), peach shoots (PS), apples (A), and nectarines (N) were in different branches. Enterococcus was the main component of the gut microbiota of G. molesta feeding on crisp pears, and the relative abundance of Enterococcus in the gut bacterial community of G. molesta feeding on crisp pears was higher than that for the other groups and the same for Pantoea in the peach-feeding group and Acinetobacter, Bacillus, and Corynebacterium in the artificial diet-feeding group (Figure 4).
The PCoA analysis based on the Bray−Curtis distance was used to compare the community similarities between samples. The PCoA scatter plot showed that the abscissa and ordinate represent the two characteristic values that contribute to the largest differences between the samples, and their influence degrees were 68.65% and 15.16%, respectively (Figure 5). PERMANOVA analyses show that there are significant differences between the different groups (PERMANOVA: R2 = 0.787, p = 0.001). The structure of the gut microbiota of G. molesta fed on an artificial diet (CK) and apples (A) was significantly different (PERMANOVA: R2 = 0.654, p = 0.001), but there was no significant difference between the artificial diet-feeding group (CK) and the plum-feeding group (PL) (PERMANOVA: R2 = 0.501, p = 0.101). Interestingly, there was no significant difference in the structure of the gut microbiota of G. molesta that fed on peaches (P) and nectarines (N) (PERMANOVA: R2 = 0.550, p = 0.101), but the difference between the peach-feeding group (P) and the peach shoot-feeding group (PS) was significant (PERMANOVA: R2 = 0.564, p = 0.001).
In order to find biomarkers with statistical differences between different groups, we used linear discriminant analysis (LDA) effect size (LEfSe) to screen out different taxa at various levels (kingdom, phylum, class, order, family, genus, species) between different groups based on a standard LDA value greater than four (Figure 6). Meanwhile, we drew the cladogram from phylum to genus to fully understand the distribution of these different taxa at various taxonomic levels (Figure 7). In the plum-feeding group (PL), the gut microbiota of G. molesta had the most different taxa (LDA > 4). There were 34 taxa mainly concentrated in Firmicutes, Bacteroidota, Verrucomicrobiota, and Acidobacteriota. Six different taxa differed significantly in the gut microbiota of G. molesta feeding on an artificial diet (CK), three of them exclusive to Actinobacteriota and the other three belonging to Proteobacteria. Three and two taxa, mainly concentrated in the phylum Proteobacteria, were in the gut microbiota in the peach-feeding (P) and peach shoot-feeding (PS) groups, respectively. The dominant Enterobacteriaceae was also the most highly discriminating taxon in the peach shoot-feeding (PS) group. Finally, Klebsiella in the gut microbiota of the apple-feeding group (A) belonged to the phylum Proteobacteria. Overall, these analyses confirmed the effect of host diets on the gut community structure in G. molesta, similar to what was observed in other herbivores in Lepidoptera.

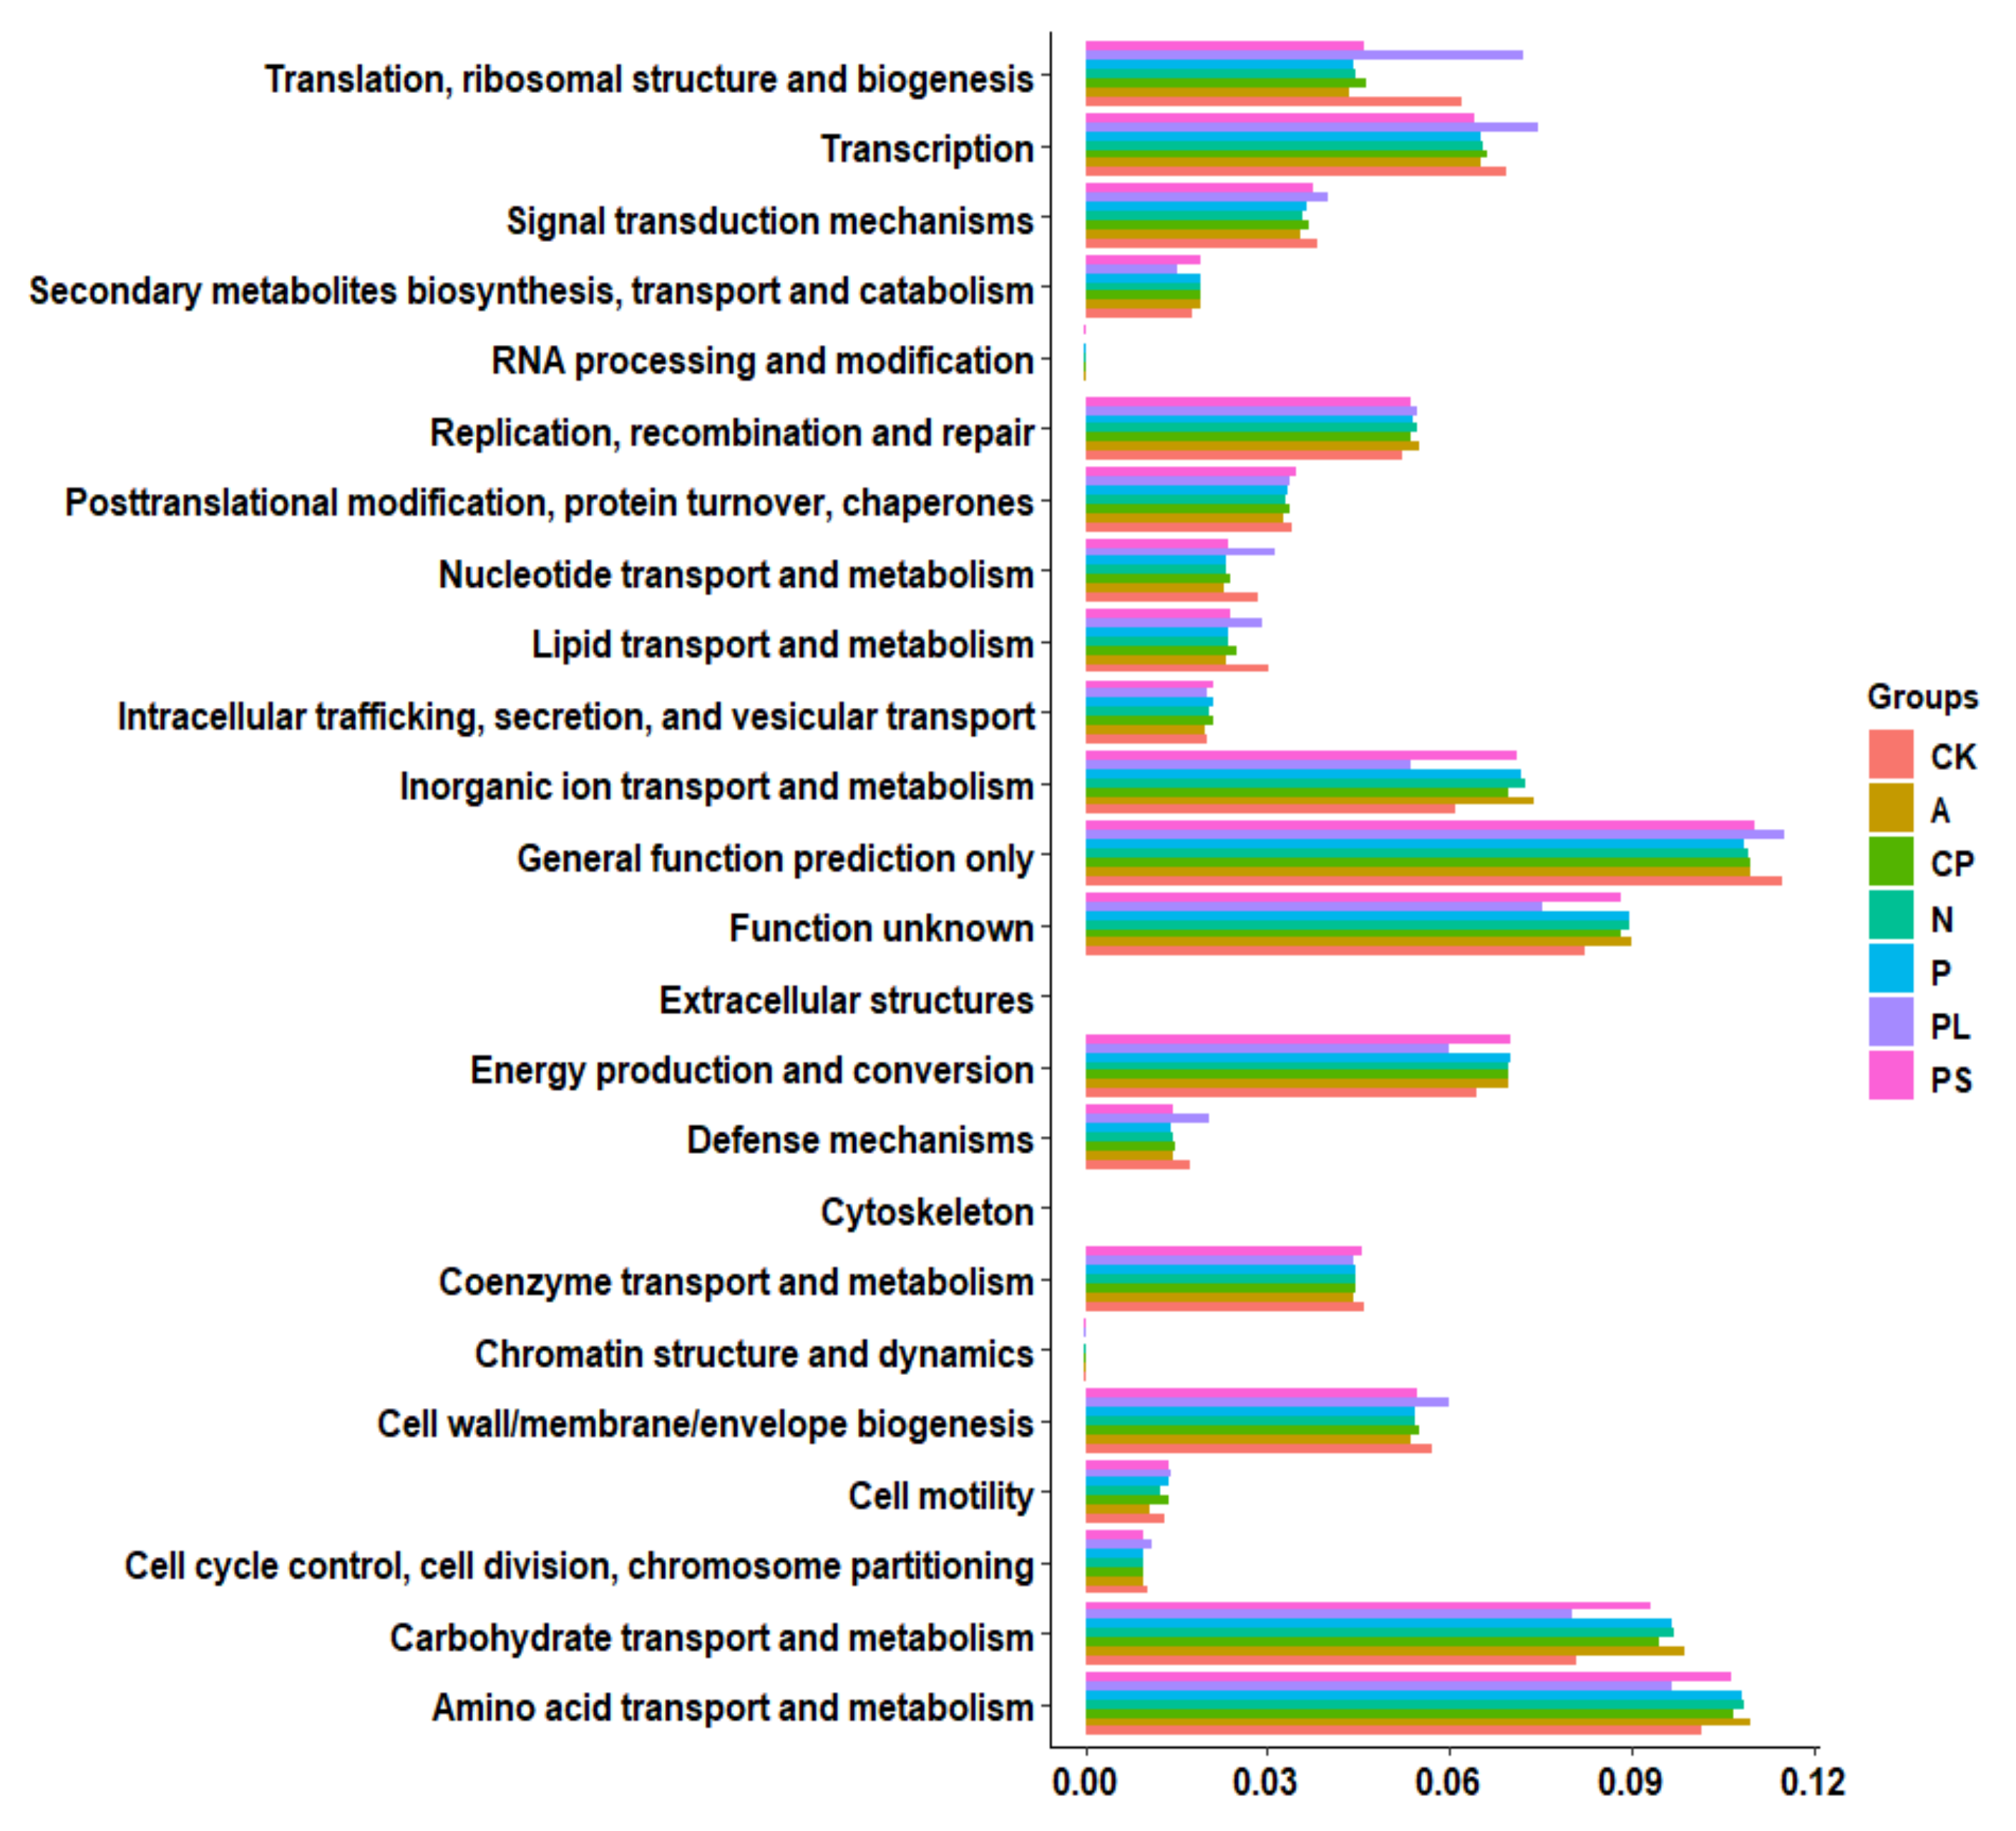
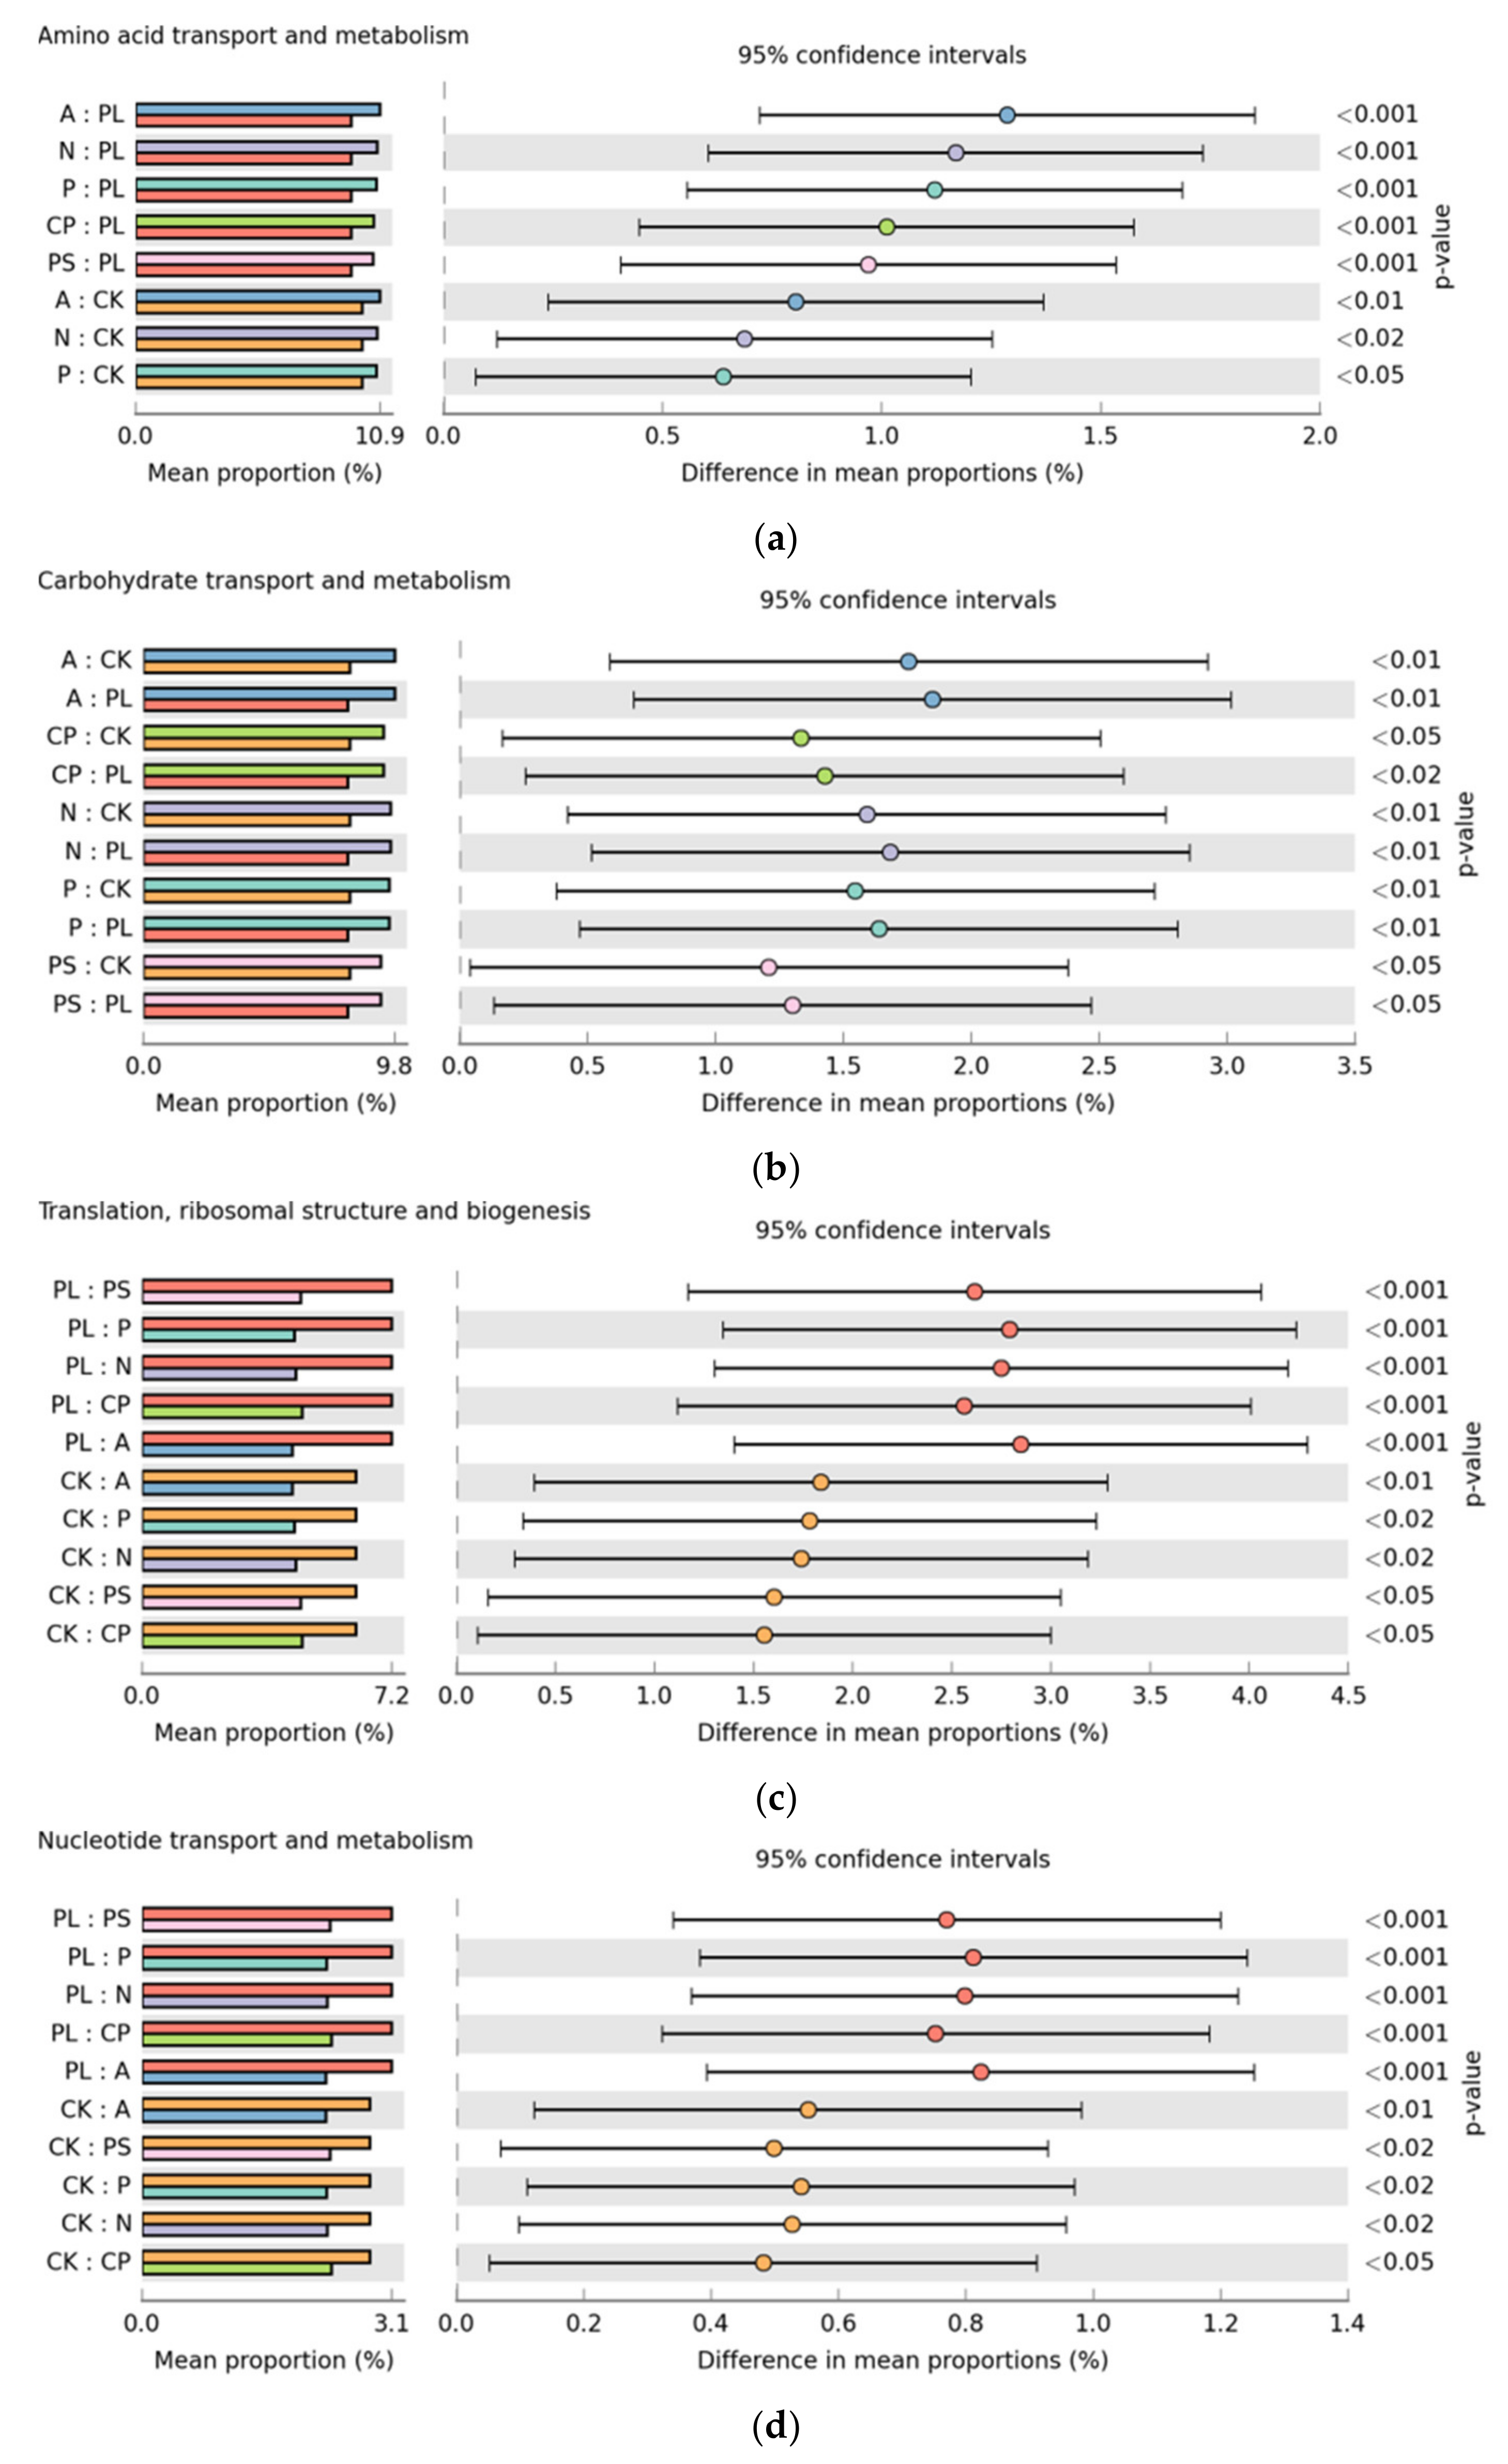
2.3. Functional Prediction of Gut Microbiota

In order to better understand the important role of the gut microbiota of G. molesta, we used PICRUSt2 software to predict the functional gene compositions of samples based on 16S rDNA sequencing data and compared them with the Cluster of Orthologous Groups (COG) database. The results showed that most functional prediction categories are related to metabolic and cellular processes. The main metabolic functions include amino acid transport and metabolism, carbohydrate transport and metabolism, inorganic ion transport and metabolism, energy production and conversion, transcription, replication, and recombination and repair and represent the most active functions inside the gut (Figure 8).
As the largest functional prediction category, the plum-feeding group proved to have the lowest proportion of amino acid transport and metabolism (9.66 ± 0.35%) and differed from the apple-feeding (10.95 ± 0.02%), crisp pear-feeding (10.67 ± 0.05%), nectarine-feeding (10.83 ± 0.06), peach-feeding (10.78 ± 0.01%), and peach shoot-feeding (10.63 ± 0.15%) groups dramatically. The artificial diet-feeding group had the second lowest percentages (10.14 ± 0.20%), which were significantly less than the apple-feeding, nectarine-feeding, and peach-feeding groups (Figure 9a). Similarly, for carbohydrate transport and metabolism, the proportions in the apple-feeding (9.84 ± 0.01%), crisp pear-feeding (9.42 ± 0.12%), nectarine-feeding (9.68 ± 0.09), peach-feeding (9.63 ± 0.02%), and peach shoot-feeding (9.30 ± 0.36%) groups were significantly higher than in the artificial diet-feeding (8.09 ± 0.58%) and plum-feeding (7.99 ± 0.58%) groups (Figure 9b). Nevertheless, for translation, ribosomal structure, and biogenesis, the proportions in the plum-feeding (7.19 ± 0.89%) and artificial diet-feeding (6.18 ± 0.63%) groups were distinct from the apple-feeding (4.34 ± 0.01%), crisp pear-feeding (4.63 ± 0.15%), nectarine-feeding (4.44 ± 0.04), peach-feeding (4.40 ± 0.02%), and peach shoot-feeding (4.58 ± 0.20%) groups. The proportions were increased after G. molesta was transferred from the artificial diet to plums, but it was not significant (Figure 9c). For nucleotide transport and metabolism, the proportions were basically the same as for translation, ribosomal structure, and biogenesis (Figure 9d). These results indicate that the gut microbiota accelerated the transport and metabolism of nutriment after G. molesta was transferred from the artificial diet to natural plants, except plums, and enhanced the cellular processes and signaling and information processing after being transferred to plums.

3. Discussion

As a kind of fruit tree pest, which is seasonally transferred, G. molesta can damage different species of fruit trees of the Rosaceae family in the same or different generations in 1 year. We have studied the gut bacterial diversity and community composition of G. molesta larvae feeding on different host plants of the Rosaceae family and on artificial feed. The experimental results have given us a more comprehensive understanding of the relationship between G. molesta and its symbiotic microorganisms. According to our experimental data, we can preliminarily conclude that the diversity and abundance of the gut bacterial community of G. molesta are affected by the host diet. These results reveal a complex symbiotic community in the gut bacteria of G. molesta larvae and provide a theoretical basis for understanding the adaptation mechanism of G. molesta and its host plants.
Previous studies have shown that the structure of insect gut bacterial communities can be affected by the host species and the host diet [7,31,34,35,36,37,38], and the influences of the host diet are much greater than those of the host species [39,40]. The diversity of gut bacteria has changed to varying degrees, with diversity increasing in plums and decreasing in the other four hosts after switching from the artificial feed to different host plants. Similar to the research that gut bacterial diversity in P. xylostella decreased after the host shift from radishes to peas, the structure of the gut bacteria varies with the diet [7].
At the phylum level, there were no significant differences in the bacterial composition of G. molesta across the five diets of apples, peaches, nectarines, crisp pears, and peach shoots, but the diversity of gut bacteria was significantly lower than that of the artificial feed and plums. In these five treatments, Proteobacteria was the absolute dominant phylum, and its relative abundances were more than 90%, similar to previous researches [20,31,33]. However, in the two treatment groups that fed on an artificial feed and plums, the following four phyla were dominant: Proteobacteria, Firmicutes, Bacteroidota, and Actinobacteriota. Many studies have reported that Proteobacteria and Firmicutes are the dominant bacterial phyla in insect gut bacterial communities, especially Lepidoptera [34,41,42,43,44]. They play a key role in carbohydrate metabolism, amino acid metabolism, and membrane transport pathways of the host [20,45,46]. Stably colonized gut bacteria, such as Proteobacteria, could be functionally crucial for insects to adapt to specific host plants [7]. Our research demonstrates this important role in host metabolic pathways and adaptation. Future research needs to combine metabolomics to explore how the gut bacteria affect host metabolic processes.
Enterobacteriaceae, which has been reported to appear in the gut bacteria of many insects [37,47,48], dominates almost every sample. Studies have shown that Enterobacteriaceae not only plays an important role in the host’s sugar metabolism and protects against parasites and pathogens in the insect gut [49], but also contributes to courtship, reproduction, and even degradation of polyethylene [13,31,50]. It has been reported that the high abundance of Enterobacteriaceae may be related to host adaptability, suggesting the importance of Enterobacteriaceae in the fitness of G. molesta [4,31]. The most abundant genus in Enterobacteriaceae is Klebsiella, which occurs widely in the guts of Lepidoptera and other herbivores and is a potentially beneficial, nonpathogenic microbe [51,52,53]. Klebsiella can degrade cellulose and sugarcane residues in Diatraea saccharalis [54,55], provide usable nitrogen for apple maggot flies, increase immunity in Ceratitis capitata, and promote the development of larvae [8,14,56,57].
Lactobacillus and Clostridium were also detected in our study with high relative abundance in the artificial feed (CK) and plum (PL) diets, similar to Enterococcus in the crisp pear-feeding (CP) group and Acinetobacter, Bacillus, and Corynebacterium in the artificial diet (CK) group. These results suggest that the content of the gut microbiota varies by host plants, even when they are in the same family Rosaceae. Gut bacterial composition shifts qualitatively and quantitatively according to the host’s functional needs [7]. Enterococcus has been found to be the most common gut bacteria in Lepidoptera, such as Spodoptera littoralis, Busseola fusca, Helicoverpa armigera, and Brithys crini [51,58,59,60]. As a kind of insect symbiotic bacteria that can be stably maintained during metamorphosis [61], Enterococcus was reported to confer a protection against pathogens [10], fixing toxic molecules of the plants [62], increasing host fitness [9], and increasing the tolerance of a toxic diet [60].
PCoA analysis revealed a distinct difference in the compositions of gut bacterial communities in the larvae of G. molesta (PERMANOVA: R2 = 0.787, p = 0.001). We found that the structure of the gut microbiota of G. molesta fed on the artificial diet (CK) and apples (A) was significantly different (PERMANOVA: R2 = 0.654, p = 0.001), but there was no significant difference between the artificial diet-feeding group (CK) and the plum-feeding group (PL) (PERMANOVA: R2 = 0.501, p = 0.101). One possible conjecture to explain this is that plum and artificial feeds have similar nutritional components and contain more amino acids and nutrients required for the growth of G. molesta, which can thus better meet the growth needs of G. molesta. The secondary metabolites in plants and the nutrient requirements of the host affect the composition of the gut microbiota [7]. Furthermore, previous studies have shown that G. molesta feeding on an artificial diet produces more eggs when they feed on host plums than when they feed on apples and peaches [17]. The previous research in our laboratory also found that, among the host species of apples (Gala, Qinguan), begonias, peaches, nectarines, and plums, the finite rate of increase (λ) of G. molesta on plum was the largest and the population doubling time (td) was the shortest (unpublished). Therefore, we hypothesized that plums might be the most suitable host for G. molesta. However, the host selection of insects is affected by many factors, such as environment, maturity, and volatiles of host plants, so this hypothesis needs to be further confirmed. Interestingly, there was no significant difference in the structure of the gut microbiota of G. molesta fed on peaches (P) and nectarines (N) (PERMANOVA: R2 = 0.550, p = 0.101), but that of the peach-feeding group (P) and the peach shoot-feeding group (PS) was significantly different (PERMANOVA: R2 = 0.564, p = 0.001), indicating that the gut microbiota of G. molesta that eats fruits of different species are more similar, while there are significant distinctions between those of G. molesta eating fruits and shoots from the same species. An alternative explanation may be that the gut microbiota are influenced by the nature of the host plant. There was also evidence that the change in gut microbiota is a gradual process [7]. In our study, only one generation was observed after host transference, which is a limitation. Observing the composition of G. molesta gut microbiota in successive generations will help us understand the changes in G. molesta gut microbiota in host metastasis better in the future. At the same time, the structure and important functions of gut microbiota in the adaptability of different Rosaceae hosts should be explored by combining metabonomics and metagenomics.
In conclusion, our results confirmed that the gut bacterial structure of G. molesta can be influenced by the host plant. After G. molesta feeding on an artificial diet was transferred to plums, the diversity increased and the relative abundances of Firmicutes and Bacteroidota increased significantly. After being transferred to apples, crisp pears, peaches, nectarines, and peach shoots, the diversity decreased and the relative abundance of Proteobacteria increased prominently. Gut bacterial communities were influenced by host diets and may play an important role in host adaptation. However, there were still many limitations in our study. Future experiments should be designed to observe the changes in gut bacterial communities in G. molesta adaptation to different hosts for successive generations, and the important functions of gut bacterial communities in host adaptation should be elucidated with the methods of multi-omics, so as to find new targets for controlling fruit tree pests. Our study provides a theoretical basis for the study of gut symbiotic bacteria in G. molesta.

4. Materials and Methods

4.1. Insect Rearing and Sample Processing

Eggs used in this experiment were taken from the G. molesta colony, which was maintained on an artificial diet for more than 6 years at 26 ± 0.5 °C 70 ± 10% relative humidity (RH) with a photoperiod (L:D) of 15 h:9 h in the Integrated Pest Management Laboratory of Northwest A&F University in Yangling, Shaanxi, China. Newly hatched larvae were reared by an artificial diet (CK), fresh Gala apples (A), crisp pears (CP), nectarines (N), peaches (P), peach shoots (PS), and plums (PL) until the fourth instar. All host plants were collected during the swelling period from the Economic Arboretum, Northwest A&F University, in July 2020. All samples were collected for this experiment from the fourth-instar larvae.

4.2. DNA Extraction

The larvae were selected and surface-sterilized in 75% ethanol for 60 s, followed by 3 washes in sterile water for 30 s. Midgut tissues were dissected with sterile forceps in a sterile petri dish with a diameter of 90 mm and rinsed again in sterile phosphate buffered saline (PBS) [7,20,31,33]. Fifty midguts were collected per sample using a sterile centrifuge tube. Each treatment had 3 replicates. The total DNA of all samples was extracted by using the MN NucleoSpin 96 Soil DNA kit (MACHEREY-NAGEL, Düren, Germany). DNA quantity and quality were measured on a NanoDrop 2000 spectrophotometer (Thermo Fisher Technology (China) Co., Ltd., Shanghai, China). The total DNA was preserved at −80 °C.

4.3. PCR Amplification and High-Throughput Sequencing

The universal primer pair, 338F (5′-ACTCCTACGGGAGGCAGCA-3′) and 806R (5′-GGACTACHVGGGTWTCTAAT-3′), with a sequencing adapter at the end, were used to amplify the V3-V4 hypervariable region of the bacterial 16s rDNA gene. First-round tailed polymerase chain reaction (PCR) amplification was performed in a volume of 10 µL with the following reaction components: 50 ng of genome DNA, 1 μL of 10 μM primer F, 0.3 μL of the 10 μM primer R, 5 μL of KOD FX Neo Buffer, 2 μL of dNTP, and 0.2 μL of KOD FX Neo. PCR cycling parameters were 95 °C for 5 min, followed by 25 amplification cycles of 95 °C for 30 s, 50 °C for 30 s, and 72 °C for 40 s, with a 7 min final extension at 72 °C. In order to add indices and adapter sequences, the second-round tailed PCR amplification was performed under the following conditions: 98 °C for 30 s, followed by 10 cycles of 98 °C for 10 s, 65 °C for 30 s, 72 °C for 30 s, and a 5 min final extension at 72 °C. The reaction system was a volume of 20 μL comprised of 5 μL for the products of first-round PCR, 2.5 μL of MPPI-a, 2.5 μL of MPPI-b, and 10μL of 2 × Q5 HF MM. The PCR products were detected on 1.8% agarose gels and purified, quantified, and homogenized to form a sequencing library. Qualified libraries were sequenced using Illumina HiSeq 2500 by Biomarker Co., Ltd. (Beijing, China).

4.4. Statistical and Bioinformatics Analysis

A total of 1,531,209 paired-end reads were generated to survey the bacterial communities. The raw data were first analyzed using Trimmomatic (version 0.33, Golm, Germany). We then used cutadapt (version 1.9.1, TU Dortmund, Germany) software to identify and remove primer sequences for high-quality reads that did not contain primer sequences. The high-quality reads of each sample were spliced through overlap by FLASH (version 1.2.7, Baltimore, MD, USA) software, and the resulting splicing sequence was clean reads. We used UCHIME (version 4.2, http://drive5.com/usearch/manual/uchime_algo.html (accessed on 24 June 2021)) for identifying and removing the chimera sequence and obtained the final valid data as effective reads. According to the similarity of the sequence, the effective sequence was classified into multiple operational taxonomic units (OTUs) at the similarity level of 97% through the software USEARCH (version 10.0, http://drive5.com/usearch/ (accessed on 24 June 2021)), and the OTUs were filtered by 0.005% of the sequence numbers of all sequences. All representative sequences were annotated and blasted against Silva database version 123 (http://www.arb-silva.de (accessed on 24 June 2021)) using RDP Classifier (https://sourceforge.net/projects/rdpclassifier/ (accessed on 24 June 2021)) with a confidence threshold at 80%. Principal coordinate analysis (PCoA) based on the Bray−Curtis distance was applied to reveal the differences in bacterial communities between groups. Permutational multivariate analysis of variance (PERMANOVA) was performed for pairwise comparison. Here, the Bray−Curtis distance was used as a metric of similarity between the bacterial communities based on the abundance of OTUs between samples. Linear discriminant analysis (LDA) was used to screen the biomarkers for statistical differences between different groups with LDA scores greater than 4. A cladogram was drawn to show the distribution of these biomarkers at different taxonomic levels by Galaxy (http://huttenhower.org/galaxy/ (accessed on 24 June 2021)). Microbiota functions were predicted by annotating pathways of OTUs against the COG database using PICRUSt2. We used extended error bars in STAMP software (https://beikolab.cs.dal.ca/software/STAMP (accessed on 24 June 2021)) to show the significant differences in several functions at the second level of Cluster of Orthologous Groups (COG) between different groups.
Differences were considered significant when p < 0.05 and extremely significant when p < 0.01. SPSS 26.0 (https://www.ibm.com/products/spss-statistics (accessed on 24 June 2021)) was used for statistical analysis.

Supplementary Materials

The following are available online at https://www.mdpi.com/article/10.3390/ijms22136843/s1, Tables S1–S5: Supporting data sets.

Author Contributions

Conceptualization, Y.L., X.Y. and X.Z.; investigation, X.Z. and X.L.; methodology, X.Z. and X.L.; software, X.Z., Y.D. and Z.Y.; writing—original draft preparation, X.Z.; writing—review and editing, X.Y. and P.W.; visualization, X.Z. and D.L.; project administration, X.Y. and Y.L. All authors have read and agreed to the published version of the manuscript.

Funding

This research was funded by National Natural Science Foundation of China (31871971, 31772503) and Key Science and Technology Project of Shaanxi Province (2020zdzx03-03-02) in China.

Institutional Review Board Statement

Not applicable.

Informed Consent Statement

Not applicable.

Data Availability Statement

The data presented in this study are available in supplementary material here.

Acknowledgments

We are grateful to Shujun Wei of the Institute of Plant Protection and Environmental Protection, Beijing Academy of Agriculture and Forestry Sciences, for his comments on an earlier version of this manuscript and the two reviewers for their valuable comments on this manuscript. We would like to thank the technical support provided by BMKCloud (http://www.biocloud.net/ (accessed on 24 June 2021), 2020.9–2021.3).

Conflicts of Interest

The authors declare no conflict of interest.

References

  1. Shin, S.C.; Kim, S.H.; You, H.; Kim, B.; Kim, A.C.; Lee, K.A.; Yoon, J.H.; Ryu, J.H.; Lee, W.J. Drosophila microbiome modulates host developmental and metabolic homeostasis via insulin signaling. Science 2011, 334, 670–674. [Google Scholar] [CrossRef] [PubMed] [Green Version]
  2. Cazemier, A.E.; Hackstein, J.H.P.; Op Den Camp, H.J.M.; Rosenberg, J.; Van Der Drift, C. Bacteria in the intestinal tract of different species of arthropods. Microb. Ecol. 1997, 33, 189–197. [Google Scholar] [CrossRef]
  3. Ceja-Navarro, J.A.; Vega, F.E.; Karaoz, U.; Hao, Z.; Jenkins, S.; Lim, H.C.; Kosina, P.; Infante, F.; Northen, T.R.; Brodie, E.L. Gut microbiota mediate caffeine detoxification in the primary insect pest of coffee. Nat. Commun. 2015, 6, 7618. [Google Scholar] [CrossRef] [Green Version]
  4. Zhang, S.; Shu, J.; Xue, H.; Zhang, W.; Zhang, Y.; Liu, Y.; Fang, L.; Wang, Y.; Wang, H. The gut microbiota in Camellia Weevils are influenced by plant secondary metabolites and contribute to saponin degradation. Msystems 2020, 5, e00692-19. [Google Scholar] [CrossRef] [Green Version]
  5. Abdelgaffar, H.; Tague, E.D.; Gonzalez, H.F.C.; Campagna, S.R.; Jurat-Fuentes, J.L. Midgut metabolomic profiling of fall armyworm (Spodoptera frugiperda) with field-evolved resistance to Cry1F corn. Insect Biochem. Mol. Biol. 2019, 106, 1–9. [Google Scholar] [CrossRef] [PubMed]
  6. Bai, S.; Yao, Z.C.; Raza, M.F.; Cai, Z.H.; Zhang, H.Y. Regulatory mechanisms of microbial homeostasis in insect gut. Insect Sci. 2020, 28, 286–301. [Google Scholar] [CrossRef] [PubMed]
  7. Yang, F.Y.; Saqib, H.S.A.; Chen, J.H.; Ruan, Q.Q.; Vasseur, L.; He, W.Y.; You, M.S. Differential profiles of gut microbiota and metabolites associated with host shift of Plutella xylostella. Int. J. Mol. Sci. 2020, 21, 6283. [Google Scholar] [CrossRef]
  8. Lauzon, C.R.; Sjogren, R.E.; Prokopy, R.J. Enzymatic capabilities of bacteria associated with apple maggot flies: A postulated role in attraction. J. Chem. Ecol. 2000, 26, 953–967. [Google Scholar] [CrossRef]
  9. Shao, Y.Q.; Chen, B.S.; Sun, C.; Ishida, K.; Hertweck, C.; Boland, W. Symbiont-derived antimicrobials contribute to the control of the Lepidopteran gut microbiota. Cell Chem. Biol. 2017, 24, 66–75. [Google Scholar] [CrossRef] [Green Version]
  10. Johnston, P.R.; Rolff, J. Host and symbiont jointly control gut microbiota during complete metamorphosis. PLoS Pathog. 2015, 11, e1005246. [Google Scholar] [CrossRef] [Green Version]
  11. Su, W.Z.; Liu, J.L.; Bai, P.; Ma, B.C.; Liu, W. Pathogenic fungi-induced susceptibility is mitigated by mutual Lactobacillus plantarum in the Drosophila melanogaster model. BMC Microbiol. 2019, 19, 302. [Google Scholar] [CrossRef] [PubMed] [Green Version]
  12. Cai, Z.H.; Yao, Z.C.; Li, Y.S.; Xi, Z.Y.; Bourtzis, K.; Zhao, Z.; Bai, S.; Zhang, H.Y. Intestinal probiotics restore the ecological fitness decline of Bactrocera dorsalis by irradiation. Evol. Appl. 2018, 11, 1946–1963. [Google Scholar] [CrossRef]
  13. Yong, H.S.; Song, S.L.; Chua, K.O.; Lim, P.E. High diversity of bacterial communities in developmental stages of Bactrocera carambolae (Insecta: Tephritidae) revealed by illumina miSeq sequencing of 16S rRNA gene. Curr. Microbiol. 2017, 74, 1076–1082. [Google Scholar] [CrossRef] [PubMed]
  14. Kyritsis, G.A.; Augustinos, A.A.; Caceres, C.; Bourtzis, K. Medfly Gut Microbiota and enhancement of the sterile insect technique: Similarities and differences of Klebsiella oxytoca and Enterobacter sp. AA26 probiotics during the larval and adult stages of the VIENNA 8(D53+) genetic sexing strain. Front. Microbiol. 2017, 8, 2064. [Google Scholar] [CrossRef]
  15. Cirimotich, C.M.; Dong, Y.M.; Clayton, A.M.; Sandiford, S.L.; Souza-Neto, J.A.; Mulenga, M.; Dimopoulos, G. Natural microbe-mediated refractoriness to Plasmodium infection in Anopheles gambiae. Science 2011, 332, 855–858. [Google Scholar] [CrossRef] [PubMed] [Green Version]
  16. Cirimotich, C.M.; Ramirez, J.L.; Dimopoulos, G. Native microbiota shape insect vector competence for human pathogens. Cell Host Microbe. 2011, 10, 307–310. [Google Scholar] [CrossRef] [Green Version]
  17. Myers, C.T.; Hull, L.A.; Krawczyk, G. Early-season host plant fruit impacts on reproductive parameters of the oriental fruit moth (Lepidoptera: Tortricidae). J. Entomol. Sci. 2006, 41, 65–74. [Google Scholar] [CrossRef]
  18. Myers, C.T.; Hull, L.A.; Krawczyk, G. Effects of orchard host plants on the oviposition preference of the oriental fruit moth (Lepidoptera: Tortricidae). J. Econ. Entomol. 2006, 99, 1176–1183. [Google Scholar] [CrossRef]
  19. Neven, L.G.; Kumar, S.; Yee, W.L.; Wakie, T. Current and future potential risk of establishment of Grapholita molesta (Lepidoptera: Tortricidae) in Washington state. Environ. Entomol. 2018, 47, 448–456. [Google Scholar] [CrossRef] [PubMed]
  20. Wang, X.; Sun, S.; Yang, X.; Cheng, J.; Wei, H.; Li, Z.; Michaud, J.P.; Liu, X. Variability of gut microbiota across the life cycle of Grapholita molesta (Lepidoptera: Tortricidae). Front. Microbiol. 2020, 11, 1366. [Google Scholar] [CrossRef]
  21. Chen, L.H.; Tian, K.; Xu, X.L.; Fang, A.S.; Cheng, W.N.; Wang, G.R.; Liu, W.; Wu, J.X. Detecting host-plant volatiles with odorant receptors from Grapholita molesta (Busck) (Lepidoptera: Tortricidae). J. Agric. Food Chem. 2020, 68, 2711–2717. [Google Scholar] [CrossRef]
  22. Tian, Z.; Li, Y.; Xing, Y.J.; Li, R.C.; Liu, J.Y. Structural insights into two representative conformations of the complex formed by Grapholita molesta (Busck) pheromone binding protein 2 and Z-8-Dodecenyl acetate. J. Agric. Food Chem. 2019, 67, 4425–4434. [Google Scholar] [CrossRef] [PubMed]
  23. Chen, L.H.; Tian, K.; Wang, G.R.; Xu, X.L.; He, K.H.; Liu, W.; Wu, J.X. The general odorant receptor GmolOR9 from Grapholita molesta (Lepidoptera: Tortricidae) is mainly tuned to eight host-plant volatiles. Insect Sci. 2020, 27, 1233–1243. [Google Scholar] [CrossRef]
  24. Broderick, N.A.; Raffa, K.F.; Handelsman, J. Midgut bacteria required for Bacillus thuringiensis insecticidal activity. Proc. Natl. Acad. Sci. USA 2006, 103, 15196–15199. [Google Scholar] [CrossRef] [PubMed] [Green Version]
  25. Broderick, N.A.; Robinson, C.J.; Mcmahon, M.D.; Holt, J.; Handelsman, J.; Raffa, K.F. Contributions of gut bacteria to Bacillus thuringiensis-induced mortality vary across a range of Lepidoptera. BMC Biol. 2009, 7, 11. [Google Scholar] [CrossRef] [Green Version]
  26. Caccia, S.; Di Lelio, I.; La Storia, A.; Marinelli, A.; Varricchio, P.; Franzetti, E.; Banyuls, N.; Tettamanti, G.; Casartelli, M.; Giordana, B.; et al. Midgut microbiota and host immunocompetence underlie Bacillus thuringiensis killing mechanism. Proc. Natl. Acad. Sci. USA 2016, 113, 9486–9491. [Google Scholar] [CrossRef] [PubMed] [Green Version]
  27. Dubovskiy, I.M.; Grizanova, E.V.; Whitten, M.M.; Mukherjee, K.; Greig, C.; Alikina, T.; Kabilov, M.; Vilcinskas, A.; Glupov, V.V.; Butt, T.M. Immuno-physiological adaptations confer wax moth Galleria mellonella resistance to Bacillus thuringiensis. Virulence 2016, 7, 860–870. [Google Scholar] [CrossRef] [PubMed] [Green Version]
  28. Takatsuka, J.; Kunimi, Y. Intestinal bacteria affect growth of Bacillus thuringiensis in larvae of the oriental tea tortrix, Homona magnanima diakonoff (Lepidoptera: Tortricidae). J. Invertebr. Pathol. 2000, 76, 222–226. [Google Scholar] [CrossRef]
  29. Martemyanov, V.V.; Belousova, I.A.; Pavlushin, S.V.; Dubovskiy, I.M.; Ershov, N.I.; Alikina, T.Y.; Kabilov, M.R.; Glupov, V.V. Phenological asynchrony between host plant and gypsy moth reduces insect gut microbiota and susceptibility to Bacillus thuringiensis. Ecol. Evol. 2016, 6, 7298–7310. [Google Scholar] [CrossRef] [PubMed]
  30. Ryu, J.H.; Kim, S.H.; Lee, H.Y.; Bai, J.Y.; Nam, Y.D.; Bae, J.W.; Lee, D.G.; Shin, S.C.; Ha, E.M.; Lee, W.J. Innate immune homeostasis by the homeobox gene caudal and commensal-gut mutualism in Drosophila. Science 2008, 319, 777–782. [Google Scholar] [CrossRef] [PubMed] [Green Version]
  31. Liu, Y.J.; Shen, Z.J.; Yu, J.M.; Li, Z.; Liu, X.X.; Xu, H.L. Comparison of gut bacterial communities and their associations with host diets in four fruit borers. Pest. Manag. Sci. 2020, 76, 1353–1362. [Google Scholar] [CrossRef]
  32. Zhu, Y.X.; Song, Z.R.; Song, Y.L.; Zhao, D.S.; Hong, X.Y. The microbiota in spider mite feces potentially reflects intestinal bacterial communities in the host. Insect Sci. 2020, 27, 859–868. [Google Scholar] [CrossRef] [PubMed]
  33. Gong, Q.; Cao, L.J.; Sun, L.N.; Chen, J.C.; Gong, Y.J.; Pu, D.Q.; Huang, Q.; Hoffmann, A.A.; Wei, S.J. Similar gut bacterial microbiota in two fruit-feeding moth pests collected from different host species and locations. Insects 2020, 11, 840. [Google Scholar] [CrossRef] [PubMed]
  34. Chen, B.; Du, K.; Sun, C.; Vimalanathan, A.; Liang, X.; Li, Y.; Wang, B.; Lu, X.; Li, L.; Shao, Y. Gut bacterial and fungal communities of the domesticated silkworm (Bombyx mori) and wild mulberry-feeding relatives. ISME J. 2018, 12, 2252–2262. [Google Scholar] [CrossRef] [Green Version]
  35. Colman, D.R.; Toolson, E.C.; Takacs-Vesbach, C.D. Do diet and taxonomy influence insect gut bacterial communities? Mol. Ecol. 2012, 21, 5124–5137. [Google Scholar] [CrossRef]
  36. Kudo, R.; Masuya, H.; Endoh, R.; Kikuchi, T.; Ikeda, H. Gut bacterial and fungal communities in ground-dwelling beetles are associated with host food habit and habitat. ISME J. 2019, 13, 676–685. [Google Scholar] [CrossRef] [PubMed]
  37. Wang, H.X.; Jin, L.; Peng, T.; Zhang, H.Y.; Chen, Q.L.; Hua, Y.J. Identification of cultivable bacteria in the intestinal tract of Bactrocera dorsalis from three different populations and determination of their attractive potential. Pest Manag. Sci. 2014, 70, 80–87. [Google Scholar] [CrossRef]
  38. Zhang, Z.; Jiao, S.; Li, X.; Li, M. Bacterial and fungal gut communities of Agrilus mali at different developmental stages and fed different diets. Sci. Rep. 2018, 8, 15634. [Google Scholar] [CrossRef] [Green Version]
  39. Chandler, J.A.; Eisen, J.A.; Kopp, A. Yeast communities of diverse Drosophila species: Comparison of two symbiont groups in the same hosts. Appl. Environ. Microbiol. 2012, 78, 7327–7336. [Google Scholar] [CrossRef] [Green Version]
  40. Chandler, J.A.; Lang, J.M.; Bhatnagar, S.; Eisen, J.A.; Kopp, A. Bacterial communities of diverse Drosophila species: Ecological context of a host-microbe model system. PLoS Genet. 2011, 7, e1002272. [Google Scholar] [CrossRef]
  41. Chen, B.; Xie, S.; Zhang, X.; Zhang, N.; Feng, H.; Sun, C.; Lu, X.; Shao, Y. Gut microbiota metabolic potential correlates with body size between mulberry-feeding lepidopteran pest species. Pest Manag. Sci. 2020, 76, 1313–1323. [Google Scholar] [CrossRef]
  42. Gonzalez-Serrano, F.; Perez-Cobas, A.E.; Rosas, T.; Baixeras, J.; Latorre, A.; Moya, A. The gut microbiota composition of the moth Brithys crini reflects insect metamorphosis. Microb. Ecol. 2020, 79, 960–970. [Google Scholar] [CrossRef] [PubMed]
  43. Sharon, G.; Segal, D.; Ringo, J.M.; Hefetz, A.; Zilber-Rosenberg, I.; Rosenberg, E. Commensal bacteria play a role in mating preference of Drosophila melanogaster. Proc. Natl. Acad. Sci. USA 2010, 107, 20051–20056. [Google Scholar] [CrossRef] [Green Version]
  44. Zhang, X.; Li, T.P.; Zhou, C.Y.; Zhao, D.S.; Zhu, Y.X.; Bing, X.L.; Huang, H.J.; Hong, X.Y. Antibiotic exposure perturbs the bacterial community in the small brown planthopper Laodelphax striatellus. Insect Sci. 2020, 27, 895–907. [Google Scholar] [CrossRef]
  45. Genta, F.A.; Dillon, R.J.; Terra, W.R.; Ferreira, C. Potential role for gut microbiota in cell wall digestion and glucoside detoxification in Tenebrio molitor larvae. J. Insect Physiol. 2006, 52, 593–601. [Google Scholar] [CrossRef]
  46. Warnecke, F.; Luginbuhl, P.; Ivanova, N.; Ghassemian, M.; Richardson, T.H.; Stege, J.T.; Cayouette, M.; Mchardy, A.C.; Djordjevic, G.; Aboushadi, N.; et al. Metagenomic and functional analysis of hindgut microbiota of a wood-feeding higher termite. Nature 2007, 450, 560–565. [Google Scholar] [CrossRef]
  47. Raza, M.F.; Yao, Z.; Bai, S.; Cai, Z.; Zhang, H. Tephritidae fruit fly gut microbiome diversity, function and potential for applications. Bull. Entomol. Res. 2020, 110, 423–437. [Google Scholar] [CrossRef]
  48. Yun, J.H.; Jung, M.J.; Kim, P.S.; Bae, J.W. Social status shapes the bacterial and fungal gut communities of the honey bee. Sci. Rep. 2018, 8, 2019. [Google Scholar] [CrossRef] [PubMed] [Green Version]
  49. Zhao, X.; Zhang, X.; Chen, Z.; Wang, Z.; Lu, Y.; Cheng, D. The divergence in bacterial components associated with Bactrocera dorsalis across developmental stages. Front. Microbiol. 2018, 9, 114. [Google Scholar] [CrossRef] [PubMed] [Green Version]
  50. Yang, J.; Yang, Y.; Wu, W.M.; Zhao, J.; Jiang, L. Evidence of polyethylene biodegradation by bacterial strains from the guts of plastic-eating waxworms. Environ. Sci. Technol. 2014, 48, 13776–13784. [Google Scholar] [CrossRef]
  51. Chen, B.; Teh, B.S.; Sun, C.; Hu, S.; Lu, X.; Boland, W.; Shao, Y. Biodiversity and activity of the gut microbiota across the life history of the insect herbivore Spodoptera littoralis. Sci. Rep. 2016, 6, 29505. [Google Scholar] [CrossRef]
  52. Chu, C.C.; Spencer, J.L.; Curzi, M.J.; Zavala, J.A.; Seufferheld, M.J. Gut bacteria facilitate adaptation to crop rotation in the western corn rootworm. Proc. Natl. Acad. Sci. USA 2013, 110, 11917–11922. [Google Scholar] [CrossRef] [Green Version]
  53. Suen, G.; Scott, J.J.; Aylward, F.O.; Adams, S.M.; Tringe, S.G.; Pinto-Tomas, A.A.; Foster, C.E.; Pauly, M.; Weimer, P.J.; Barry, K.W.; et al. An insect herbivore microbiome with high plant biomass-degrading capacity. PLoS Genet. 2010, 6, e1001129. [Google Scholar] [CrossRef]
  54. Muhammad, A.; Fang, Y.; Hou, Y.; Shi, Z. The gut entomotype of red palm weevil Rhynchophorus ferrugineus Olivier (Coleoptera: Dryophthoridae) and their effect on host nutrition metabolism. Front. Microbiol. 2017, 8, 2291. [Google Scholar] [CrossRef] [Green Version]
  55. Dantur, K.I.; Enrique, R.; Welin, B.; Castagnaro, A.P. Isolation of cellulolytic bacteria from the intestine of Diatraea saccharalis larvae and evaluation of their capacity to degrade sugarcane biomass. Amb. Express. 2015, 5, 15. [Google Scholar] [CrossRef] [PubMed] [Green Version]
  56. Ben Ami, E.; Yuval, B.; Jurkevitch, E. Manipulation of the microbiota of mass-reared mediterranean fruit flies Ceratitis capitata (Diptera: Tephritidae) improves sterile male sexual performance. ISME J. 2010, 4, 28–37. [Google Scholar] [CrossRef] [PubMed]
  57. Hamden, H.; Guerfali, M.M.; Fadhl, S.; Saidi, M.; Chevrier, C. Fitness improvement of mass-reared sterile males of Ceratitis capitata (Vienna 8 strain) (Diptera: Tephritidae) after gut enrichment with probiotics. J. Econ. Entomol. 2013, 106, 641–647. [Google Scholar] [CrossRef]
  58. Snyman, M.; Gupta, A.K.; Bezuidenhout, C.C.; Claassens, S.; Van Den Berg, J. Gut microbiota of Busseola fusca (Lepidoptera: Noctuidae). World J. Microbiol. Biotechnol. 2016, 32, 115. [Google Scholar] [CrossRef]
  59. Xiang, H.; Wei, G.F.; Jia, S.; Huang, J.; Miao, X.X.; Zhou, Z.; Zhao, L.P.; Huang, Y.P. Microbial communities in the larval midgut of laboratory and field populations of cotton bollworm (Helicoverpa armigera). Can. J. Microbiol. 2006, 52, 1085–1092. [Google Scholar] [CrossRef] [PubMed]
  60. Vilanova, C.; Baixeras, J.; Latorre, A.; Porcar, M. The generalist inside the specialist: Gut bacterial communities of two insect species feeding on toxic plants are dominated by Enterococcus sp. Front. Microbiol. 2016, 7, 1005. [Google Scholar] [CrossRef]
  61. Blanco, C.A.; Teran-Vargas, A.P.; Lopez, J.D.; Kauffman, J.V.; Wei, X.K. Densities of Heliothis virescens and Helicoverpa zea (Lepidoptera: Noctuidae) in three plant hosts. Fla. Entomol. 2007, 90, 742–750. [Google Scholar] [CrossRef]
  62. Shao, Y.; Spiteller, D.; Tang, X.; Ping, L.; Colesie, C.; Munchberg, U.; Bartram, S.; Schneider, B.; Budel, B.; Popp, J.; et al. Crystallization of alpha- and beta-carotene in the foregut of Spodoptera larvae feeding on a toxic food plant. Insect Biochem. Mol. Biol. 2011, 41, 273–281. [Google Scholar] [CrossRef]
Figure 1. (a) Sample rarefaction curves and (b) the Shannon index rarefaction curves.
Ijms 22 06843 g001
Figure 2. Box plots of (a) ACE, (b) Chao 1, (c) Shannon, and (d) Simpson’s values of gut microbiota of Grapholita molesta feeding on different host plants. Different capital letters on the abscissa represent different diets: CK, artificial diet; A, apple-feeding; CP, crisp pear-feeding; N, nectarine-feeding; P, peach-feeding; PL, plum-feeding; PS, peach shoot-feeding. Different lowercase letters on boxes indicate significant differences (one-way ANOVA, Tukey post-hoc test, p < 0.05) in the mean values.
Ijms 22 06843 g002
Figure 3. Bacterial composition of the top 10 relative abundances at (a) the phylum level and (b) the family level. Each color represents a species, and the height of the color block indicates the proportion of the species in relative abundance. Other species are incorporated as “Others” shown in the diagram. “Unknown” represents species that have not received a taxonomic annotation.
Ijms 22 06843 g003
Figure 4. Cluster heat map of the 20 most abundant genera in the bacterial community. The columns represent the samples and the rows represent the bacterial OTUs assigned to the genus level. Dendrograms of hierarchical cluster analysis grouping genera and samples are shown on the left and at the top, respectively.
Ijms 22 06843 g004
Figure 5. Principal coordinate analysis (PCoA) based on the Bray−Curtis distance between different host diets. CK, artificial diet; A, apple-feeding; CP, crisp pear-feeding; N, nectarine-feeding; P, peach-feeding; PL, plum-feeding; PS, peach shoot-feeding.
Ijms 22 06843 g005
Figure 6. Bacterial taxa with linear discriminant analysis (LDA) score greater than four in the gut microbiota of G. molesta feeding on different host plants.
Ijms 22 06843 g006
Figure 7. Cladogram of bacterial biomarkers, from the phylum (innermost ring) to genus (outermost ring) level, with an LDA score > 4. Differential bacterial taxa are marked by lowercase letters. Each small circle at different taxonomic levels represents a taxon at that level, and the diameter of the circle is proportional to the relative abundance. The coloring principle is to color the species with no significant difference as yellow, and the other different species as the group with the highest abundance of the species. Different colors represent different groups, and nodes with different colors represent the communities that play an important role in the group represented by the color.
Ijms 22 06843 g007
Figure 8. Comparison of predicted COG functions of gut bacteria of G. molesta feeding on different host plants.
Ijms 22 06843 g008
Figure 9. Significant differences (one-way ANOVA, Tukey–Kramer post-hoc test, p < 0.05.) in functions abundance of (a) Amino acid transport and metabolism, (b) Carbohydrate transport and metabolism, (c) Translation, ribosomal structure and biogenesis and (d) Nucleotide transport and metabolism.
Ijms 22 06843 g009
Table 1. Summary of sequence statistics for the Illumina HiSeq runs of all samples.
Sample IDRaw ReadsClean ReadsEffective ReadsAvgLen (bp)GC (%)Effective (%)
A179884677726753842956.6984.55
A279835679146761842956.7184.70
A373610621306170542956.6983.83
CK179980701176459241854.8980.76
CK280062700186717742355.4183.91
CK380384698866704142355.7383.40
CP180015678146710142956.5983.86
CP279585685696641942656.5383.46
CP379957681446632942656.5882.96
N144803366683623142956.580.87
N256666366183569442956.4962.99
N369729560675524642956.6779.23
P179923678846768742956.6084.69
P263619539835382842956.6284.61
P377451655096520142956.5984.18
PL180101666396205641355.0177.47
PL279776663326123941355.2276.76
PL380136682426431342155.6980.25
PS162578521905191742956.5882.96
PS264642541925396842956.5983.49
PS358473490524866942756.4783.23
Raw reads represent the number of original reads sequenced by Illumina HiSeq. Clean reads are the number of high-quality reads obtained after quality control and splicing. Effective reads indicate the number of effective sequences with non-chimeras. AvgLen (bp) is the average sequence length of all samples. GC (%) is the percentage of G and C type bases in the total base. Effective (%) is the percentage of effective reads in raw reads.
Table 2. The relative abundance of the top four phyla.
Sample IDProteobacteriaFirmicutesBacteroidotaActinobacteriota
CK59.18 ± 13.26 b17.74 ± 4.85 b8.32 ± 2.56 b7.85 ± 3.79 a
A99.43 ± 0.07 a0.27 ± 0.05 c0.08 ± 0.01 c0.11 ± 0.05 b
CP94.34 ± 2.32 a3.02 ± 1.28 c0.20 ± 0.10 c0.67 ± 0.23 b
N98.13 ± 0.60 a0.96 ± 0.24 c0.57 ± 0.34 c0.07 ± 0.01 b
P99.52 ± 0.12 a0.28 ± 0.16 c0.07 ± 0.01 c0.09 ± 0.04 b
PL32.75 ± 18.59 b32.92 ± 8.90 a15.06 ± 4.06 a2.80 ± 0.86 b
PS95.63 ± 2.93 a0.30 ± 0.07 c0.12 ± 0.02 c0.03 ± 0.00 b
Data are the mean ± SE. The a, b and c indicate the significant differences in relative abundance in the same column in the mean values. The same lowercase letter indicates that these is no significant difference between the groups, and different letters indicate that the differences between the groups is significant (one-way ANOVA, Tukey post-hoc test, p < 0.05).
Table 3. The relative abundance of the top 10 families.
Sample IDEnterobacteriaceaeLachnospiraceaeRuminococcaceaeLactobacillaceaeMuribaculaceaeOscillospiraceaeCaloramatoraceaeMoraxellaceaePrevotellaceaeAkkermansiaceae
CK47.43 ± 16.05 b2.79 ± 0.46b2.03 ± 0.37 b2.14 ± 0.49 b2.60 ± 0.72 b1.33 ± 0.37 b1.24 ± 0.56 b3.84 ± 0.76 a1.10 ± 0.38 b0.61 ± 0.08 b
A99.15 ± 0.12 a0.06 ± 0.01b0.04 ± 0.01 b0.03 ± 0.01 c0.03 ± 0.01 c0.03 ± 0.01 c0.02 ± 0.01 b0.01 ± 0.00 b0.04 ± 0.00 c0.02 ± 0.00 b
CP92.00 ± 2.71 a0.42 ± 0.20b0.21 ± 0.11 b0.29 ± 0.06 c0.07 ± 0.04 c0.18 ± 0.09 c0.19 ± 0.09 b0.05 ± 0.02 b0.02 ± 0.01 c0.03 ± 0.01 b
N96.43 ± 1.04 a0.19 ± 0.02b0.11 ± 0.02 b0.10 ± 0.01 c0.06 ± 0.02 c0.07 ± 0.01 c0.05 ± 0.01 b0.00 ± 0.00 b0.04 ± 0.00 c0.04 ± 0.00 b
P98.72 ± 0.40 a0.03 ± 0.01b0.02 ± 0.00 b0.02 ± 0.00 c0.02 ± 0.00 c0.02 ± 0.00 c0.01 ± 0.00 b0.01 ± 0.00 b0.01 ± 0.00 c0.01 ± 0.00 b
PL23.54 ± 21.21 b8.97 ± 2.53a5.86 ± 1.71 a5.21 ± 1.21 a4.59 ± 1.30 a3.53 ± 0.87 a3.50 ± 0.94 a0.41 ± 0.15 b2.39 ± 0.62 a2.41 ± 0.69 a
PS95.35 ± 3.07 a0.08 ± 0.02b0.06 ± 0.01 b0.04 ± 0.01 c0.03 ± 0.01 c0.03 ± 0.01 c0.03 ± 0.01 b0.00 ± 0.00 b0.03 ± 0.01 c0.01 ± 0.00 b
Data are the mean ± SE. The a, b and c indicate the significant differences in relative abundance in the same column in the mean values. The same lowercase letter indicates that these is no significant difference between the groups, and different letters indicate that the differences between the groups is significant (one-way ANOVA, Tukey post-hoc test, p < 0.05).
Publisher’s Note: MDPI stays neutral with regard to jurisdictional claims in published maps and institutional affiliations.

