
Opa1 Deficiency Promotes Development of Retinal Vascular Lesions in Diabetic Retinopathy


1
Department of Medicine, Boston University School of Medicine, Boston, MA 02118, USA
2
Department of Ophthalmology, Boston University School of Medicine, Boston, MA 02118, USA
3
School of Optometry and Vision Sciences, Cardiff University, Cardiff CF24 4HQ, UK
4
Cardiff Eye Unit, University Hospital of Wales, Cardiff CF14 4XW, UK
*
Author to whom correspondence should be addressed.
Int. J. Mol. Sci. 2021, 22(11), 5928; https://doi.org/10.3390/ijms22115928
Submission received: 7 May 2021
/
Revised: 27 May 2021
/
Accepted: 27 May 2021
/
Published: 31 May 2021
(This article belongs to the Special Issue Disorders of Mitochondrial Metabolism)
Abstract
:This study investigates whether reduced optic atrophy 1 (Opa1) level promotes apoptosis and retinal vascular lesions associated with diabetic retinopathy (DR). Four groups of mice: wild type (WT) control mice, streptozotocin (STZ)-induced diabetic mice, Opa1+/− mice, and diabetic Opa1+/− mice were used in this study. 16 weeks after diabetes onset, retinas were assessed for Opa1 and Bax levels by Western blot analysis, and retinal networks were examined for acellular capillaries (AC) and pericyte loss (PL). Apoptotic cells were detected in retinal capillaries using TUNEL assay, and caspase-3 activity was assessed using fluorometric analysis. Opa1 expression was significantly downregulated in retinas of diabetic and Opa1+/− mice compared with those of WT mice. Inducing diabetes further decreased Opa1 expression in retinas of Opa1+/− mice. Increased cytochrome c release concomitant with increased level of pro-apoptotic Bax and elevated caspase-3 activity were observed in retinas of diabetic and Opa1+/− mice; the number of TUNEL-positive cells and AC/PL was also significantly increased. An additional decrease in the Opa1 level in retinas of diabetic Opa1+/− mice exacerbated the development of apoptotic cells and AC/PL compared with those of diabetic mice. Diabetes-induced Opa1 downregulation contributes, at least in part, to the development of retinal vascular lesions characteristic of DR.
1. Introduction
Loss of retinal vascular cells is a prominent characteristic lesion in early DR [1,2], one of the leading causes of blindness in working-age adults [3]. It has become increasingly evident that mitochondrial abnormalities play a central role in contributing to the pathogenesis of DR [4,5,6,7,8,9,10,11,12,13,14,15,16]. In particular, high glucose (HG)- or diabetes-induced alteration to mitochondrial morphology has been shown to promote apoptotic cell death [4,7,8,10,11,12,13,14,15,16,17]. Specifically, downregulation of a key mitochondrial fusion protein, optic atrophy 1 (Opa1), was recently shown to contribute to mitochondrial fragmentation in retinal endothelial cells [8]. However, the extent to which Opa1 downregulation plays a role in promoting apoptotic cell death, leading to the development of retinal vascular lesions associated with DR, is unclear.
Among proteins responsible for regulating mitochondrial dynamics, Opa1 is of particular interest for its role in apoptotic cristae remodeling, mitochondrial fusion, and maintenance of mitochondrial DNA essential for energy metabolism [18,19,20,21,22]. Although mitochondrial fusion is driven by Opa1 in the inner mitochondrial membrane and by mitofusin1/2 (Mfn1/Mfn2) proteins in the outer mitochondrial membrane [23], the effects of Opa1 deficiency were reported to be more severe [23,24,25]. Cellular exposure to apoptotic inducer results in a marked decrease in Opa1 but not Mfn1 or Mfn2 levels [24], and mutations in Opa1 homologs were reported to negatively influence cell growth and survival at a drastically higher rate than mutations in outer membrane fusion proteins, Mfn1 and Mfn2 [23,26]. Control of cytosolic Ca2+ levels, NF-kβ signaling, and angiogenic gene expression in endothelial cells are also known to be regulated by Opa1 [27].
The release of cytochrome c is traditionally accepted as a signature of apoptosis. However, studies have shown that cytochrome c release does not always lead to cell death, and that commitment to cell death is regulated downstream of cytochrome c release [28,29,30]. In HeLa cells treated with a caspase inhibitor, cytochrome c release was present despite reduced caspase activity, mitochondrial membrane potential, and decreased cell death [31], suggesting that cytochrome c release may not necessarily translate to apoptotic cell loss. We have shown that a diabetes-induced decrease in retinal Opa1 levels promotes cytochrome c release [8]; however, it has not been documented that this cytochrome c release results in the characteristic development of acellular capillaries and pericyte loss seen in DR. Therefore, in the present study, the effects of Opa1 downregulation and subsequent cytochrome c release in the diabetic retina on the development of retinal vascular cell loss associated with DR were investigated.
To determine whether reduced Opa1 levels promote Bax activation, trigger cytochrome c release, and thereby contribute to the development of retinal vascular cell loss, retinas of Opa1+/− mice were examined in this study. Additionally, we evaluated whether inducing diabetes in Opa1+/− mice exacerbates the severity of retinal vascular lesions compared with those of diabetic wild-type mice.
2. Results
2.1. Genotyping of Animals
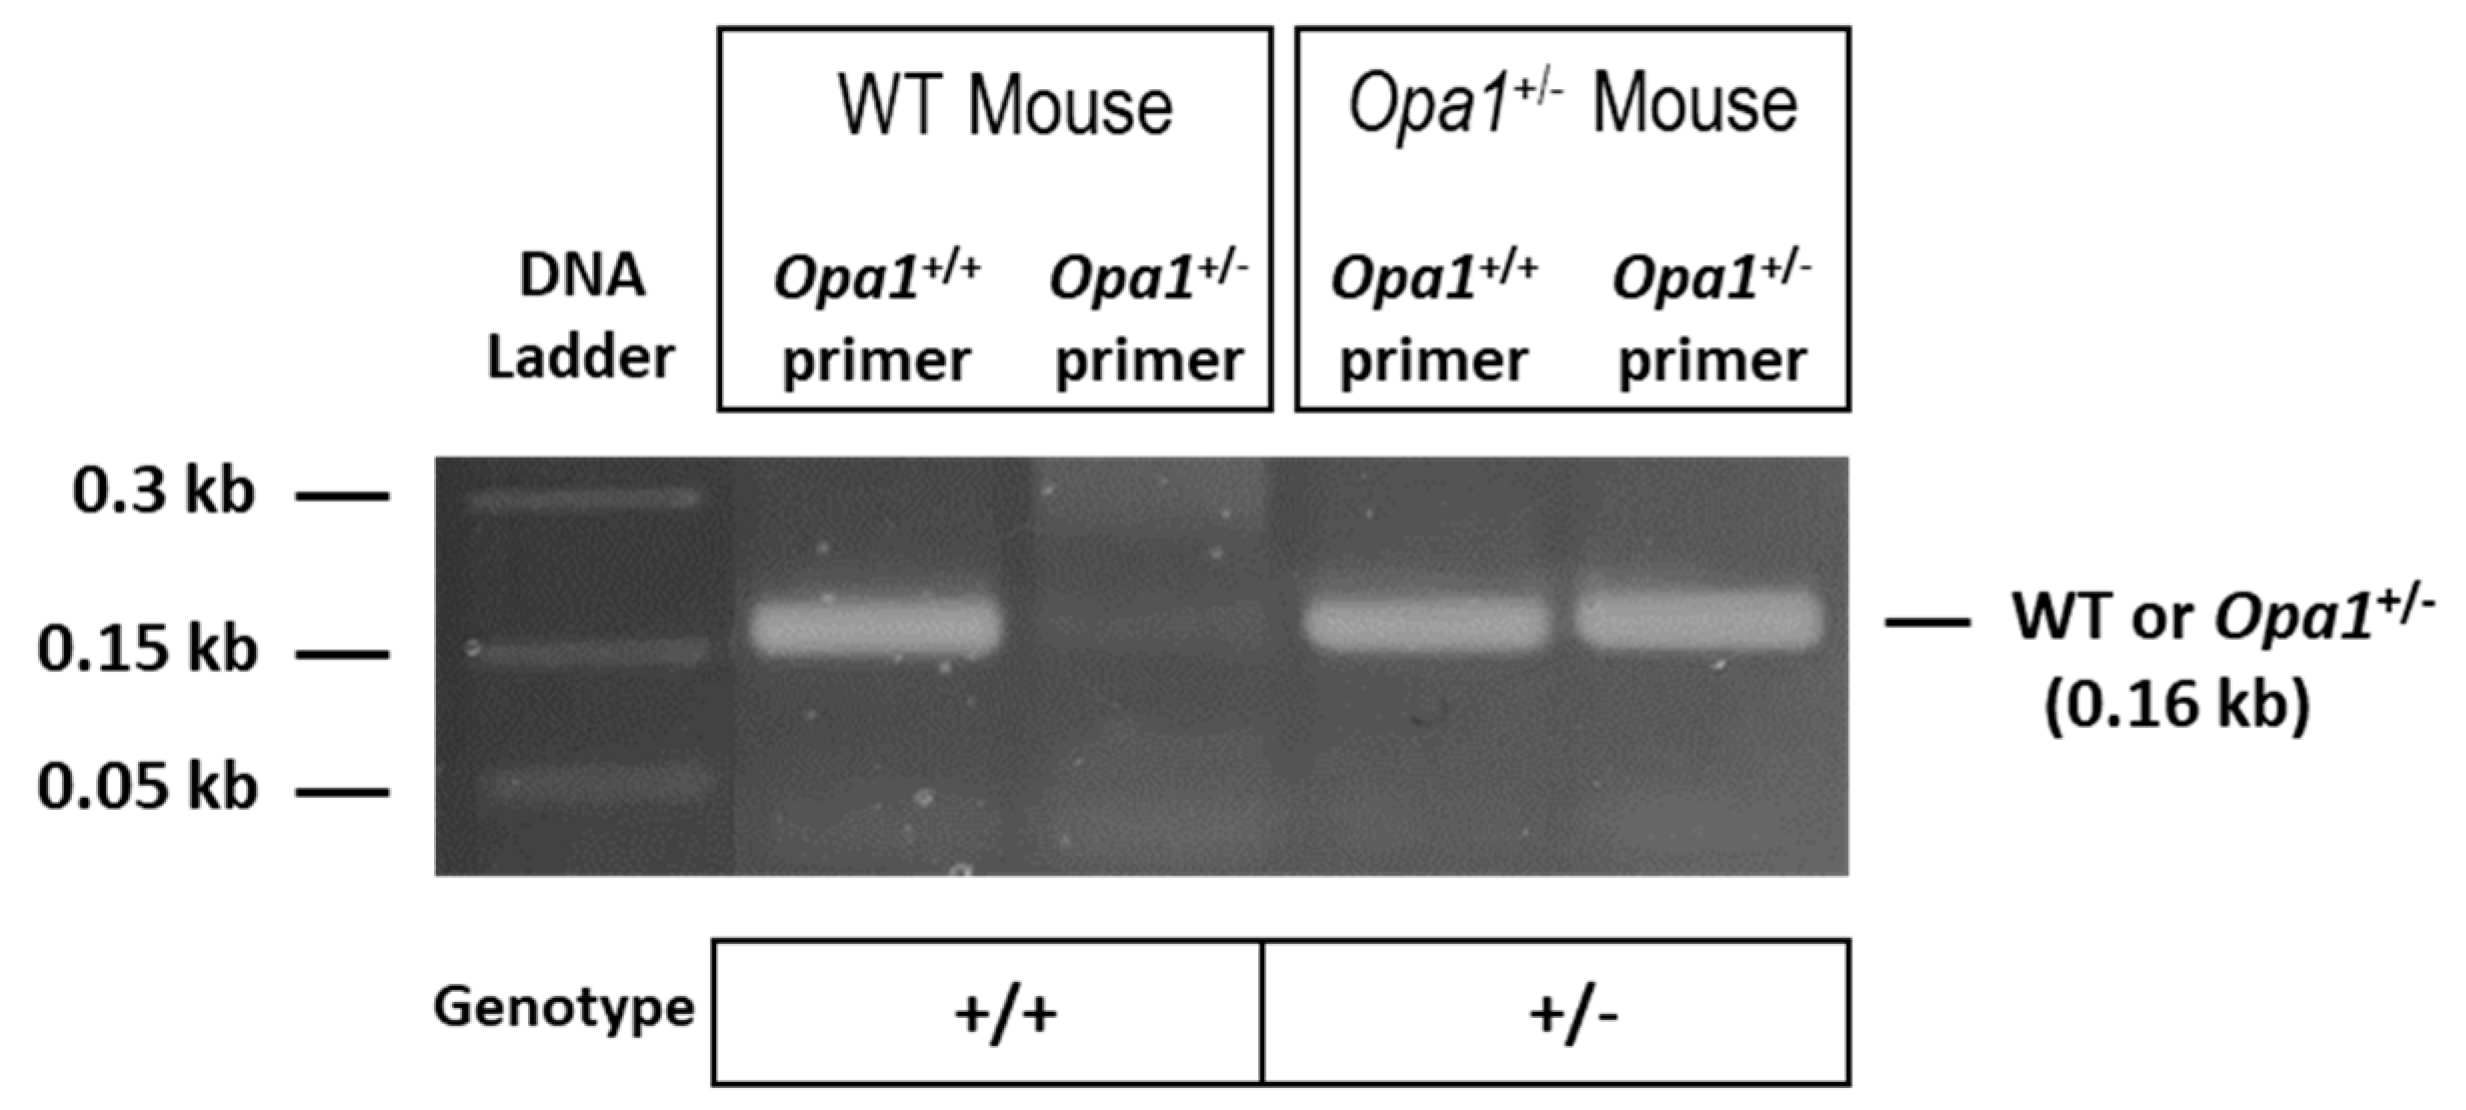
Genotypes of animals used in the present study were confirmed through PCR analysis using DNA derived from the animals’ tail tips. PCR data showed that wild-type (WT) animals (Opa1+/+) and Opa1 heterozygous knockout (Opa1+/−) animals exhibit a band at 0.16 kb (Figure 1).
2.2. Effect of Diabetes on Opa1 Expression and Distribution in Retinal Capillary Networks
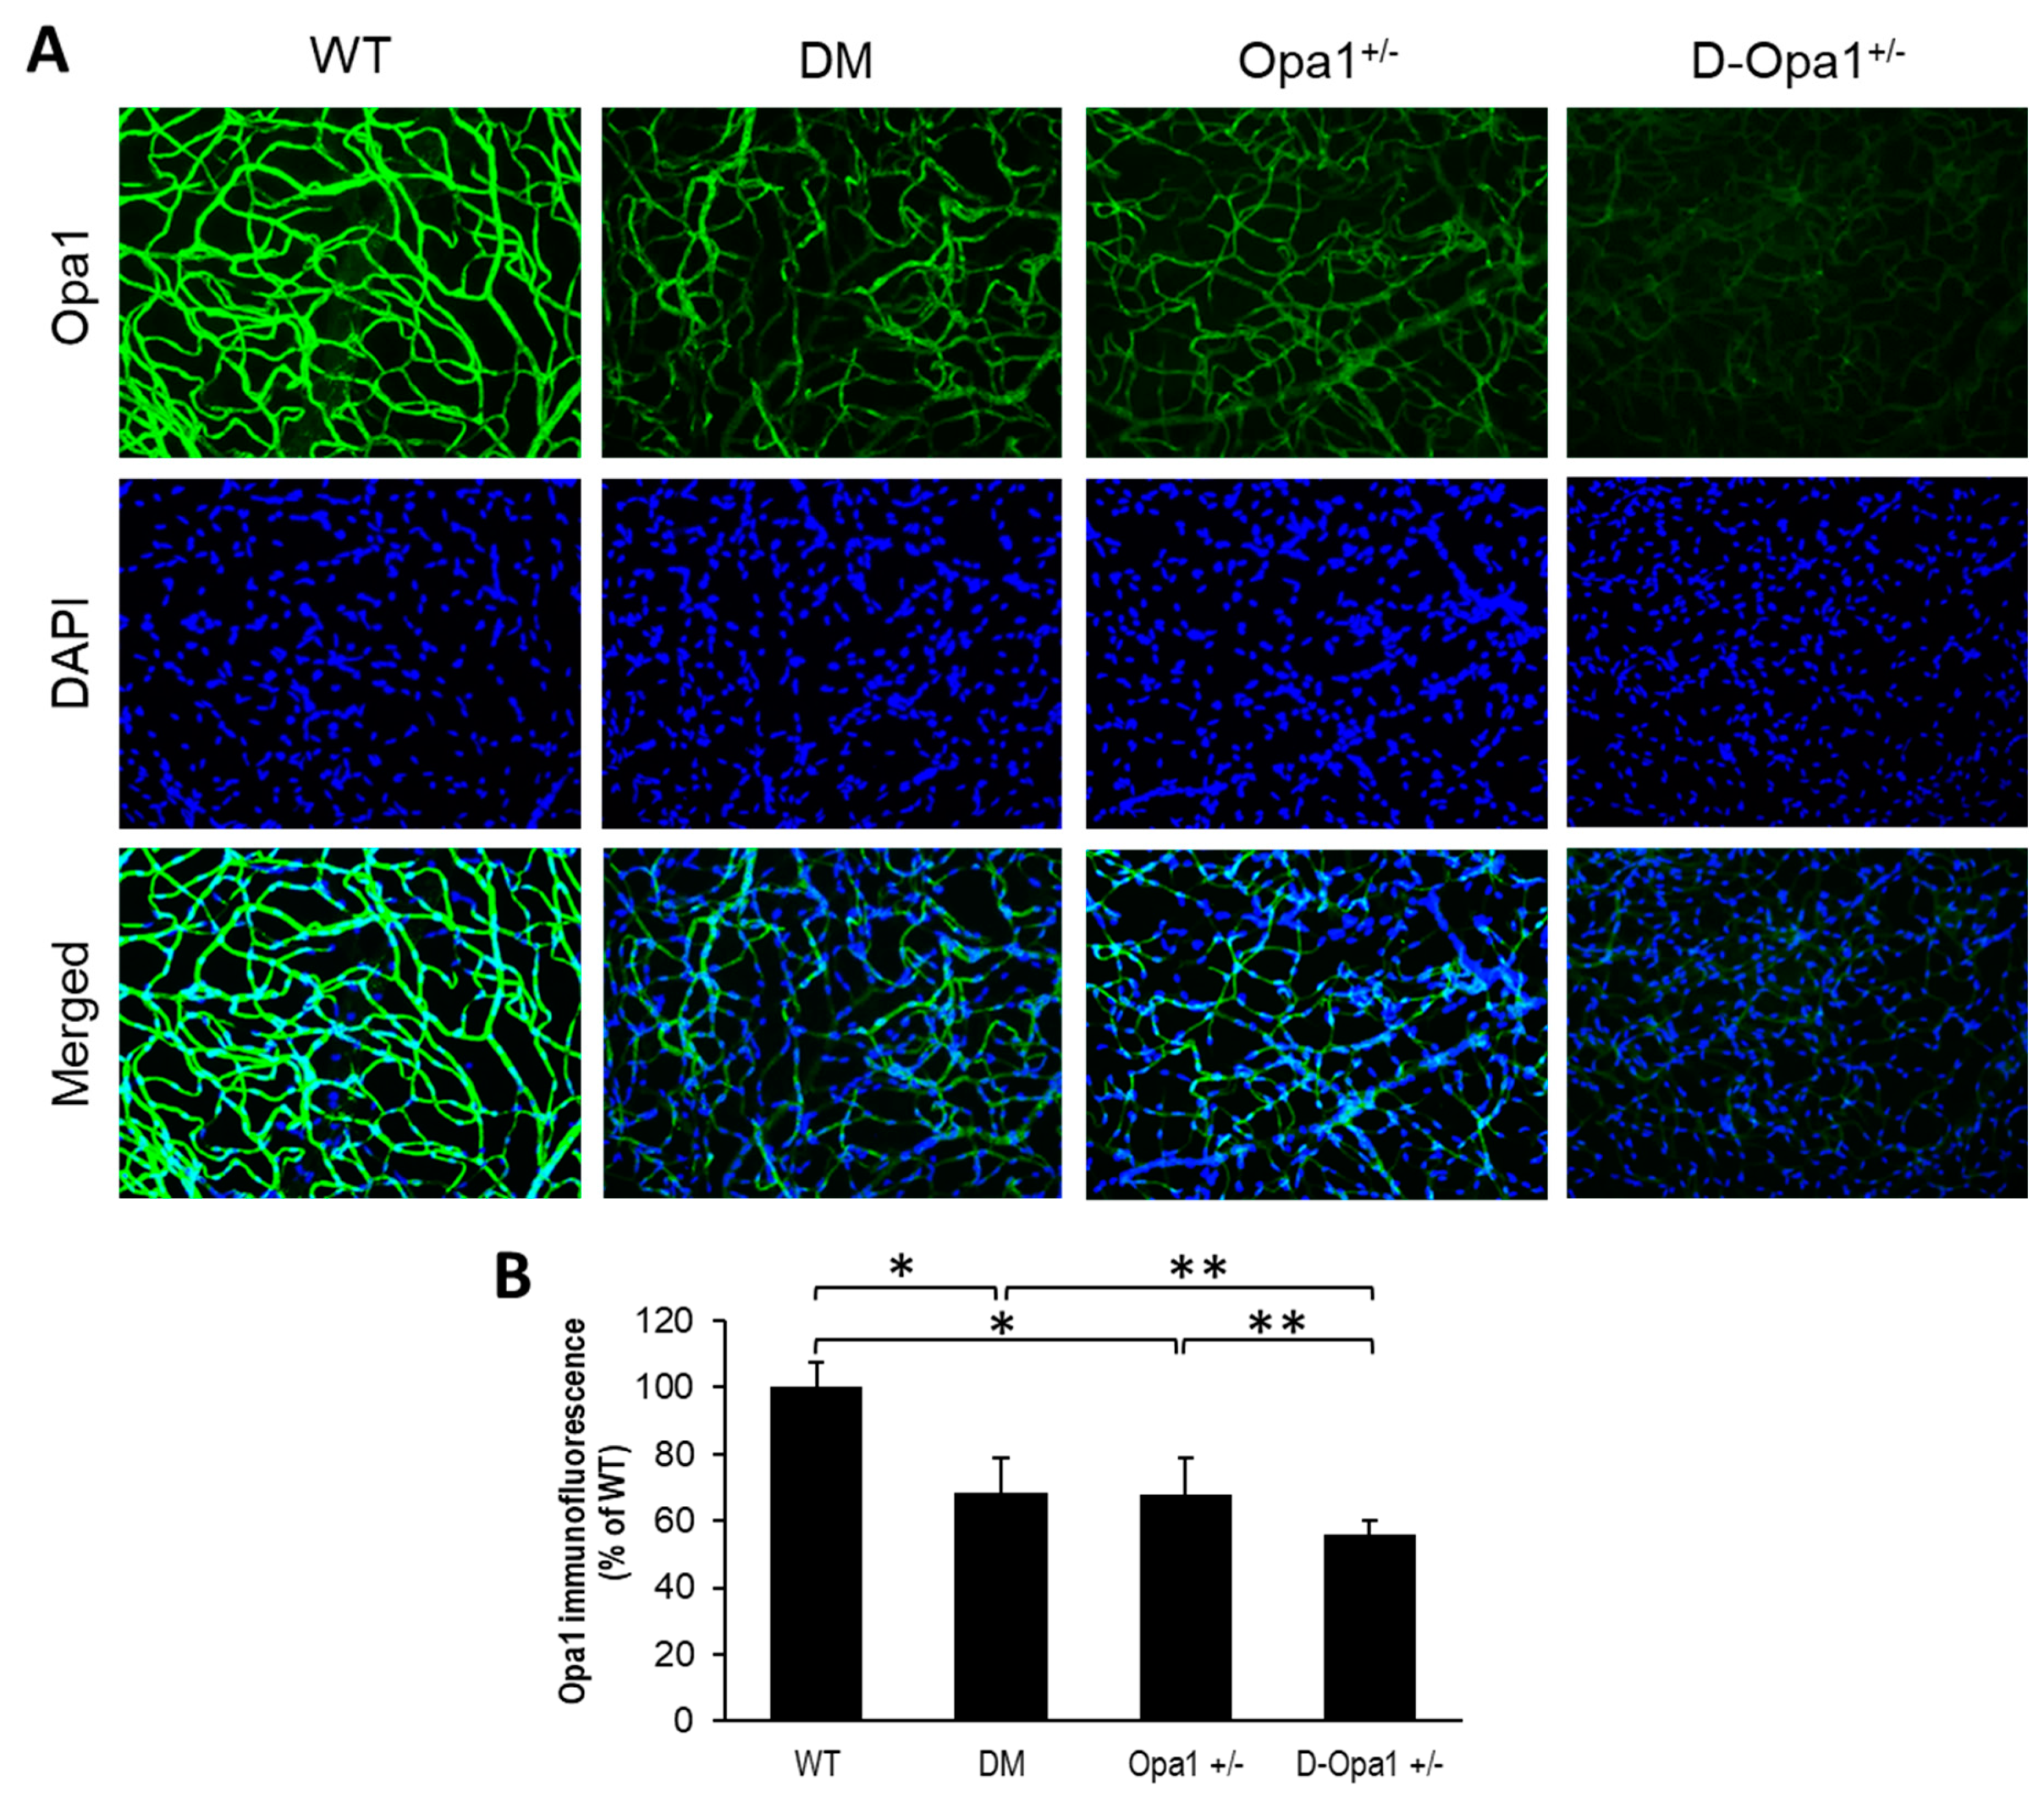
To determine whether the distribution of Opa1 is altered in retinal capillary networks of diabetic animals and Opa1+/− animals, Opa1 immunostaining was performed in retinal trypsin digests (RTDs) from each experimental group. Interestingly, Opa1 immunostaining was significantly decreased in RTDs of diabetic mice compared with that of non-diabetic WT mice (68 ± 10% of WT vs. 100 ± 7% of WT, p < 0.01; n = 6; Figure 2A,B). Opa1 immunostaining was significantly decreased in RTDs of diabetic Opa1+/− mice compared with that of diabetic mice (56 ± 4% of WT vs. 68 ± 10% of WT, p < 0.05; n = 6; Figure 2A,B) and Opa1+/− mice (56 ± 4% of WT vs. 68 ± 11% of WT, p < 0.05; n = 6; Figure 2A,B).
2.3. Diabetes-Induced Opa1 Downregulation Promotes Apoptosis
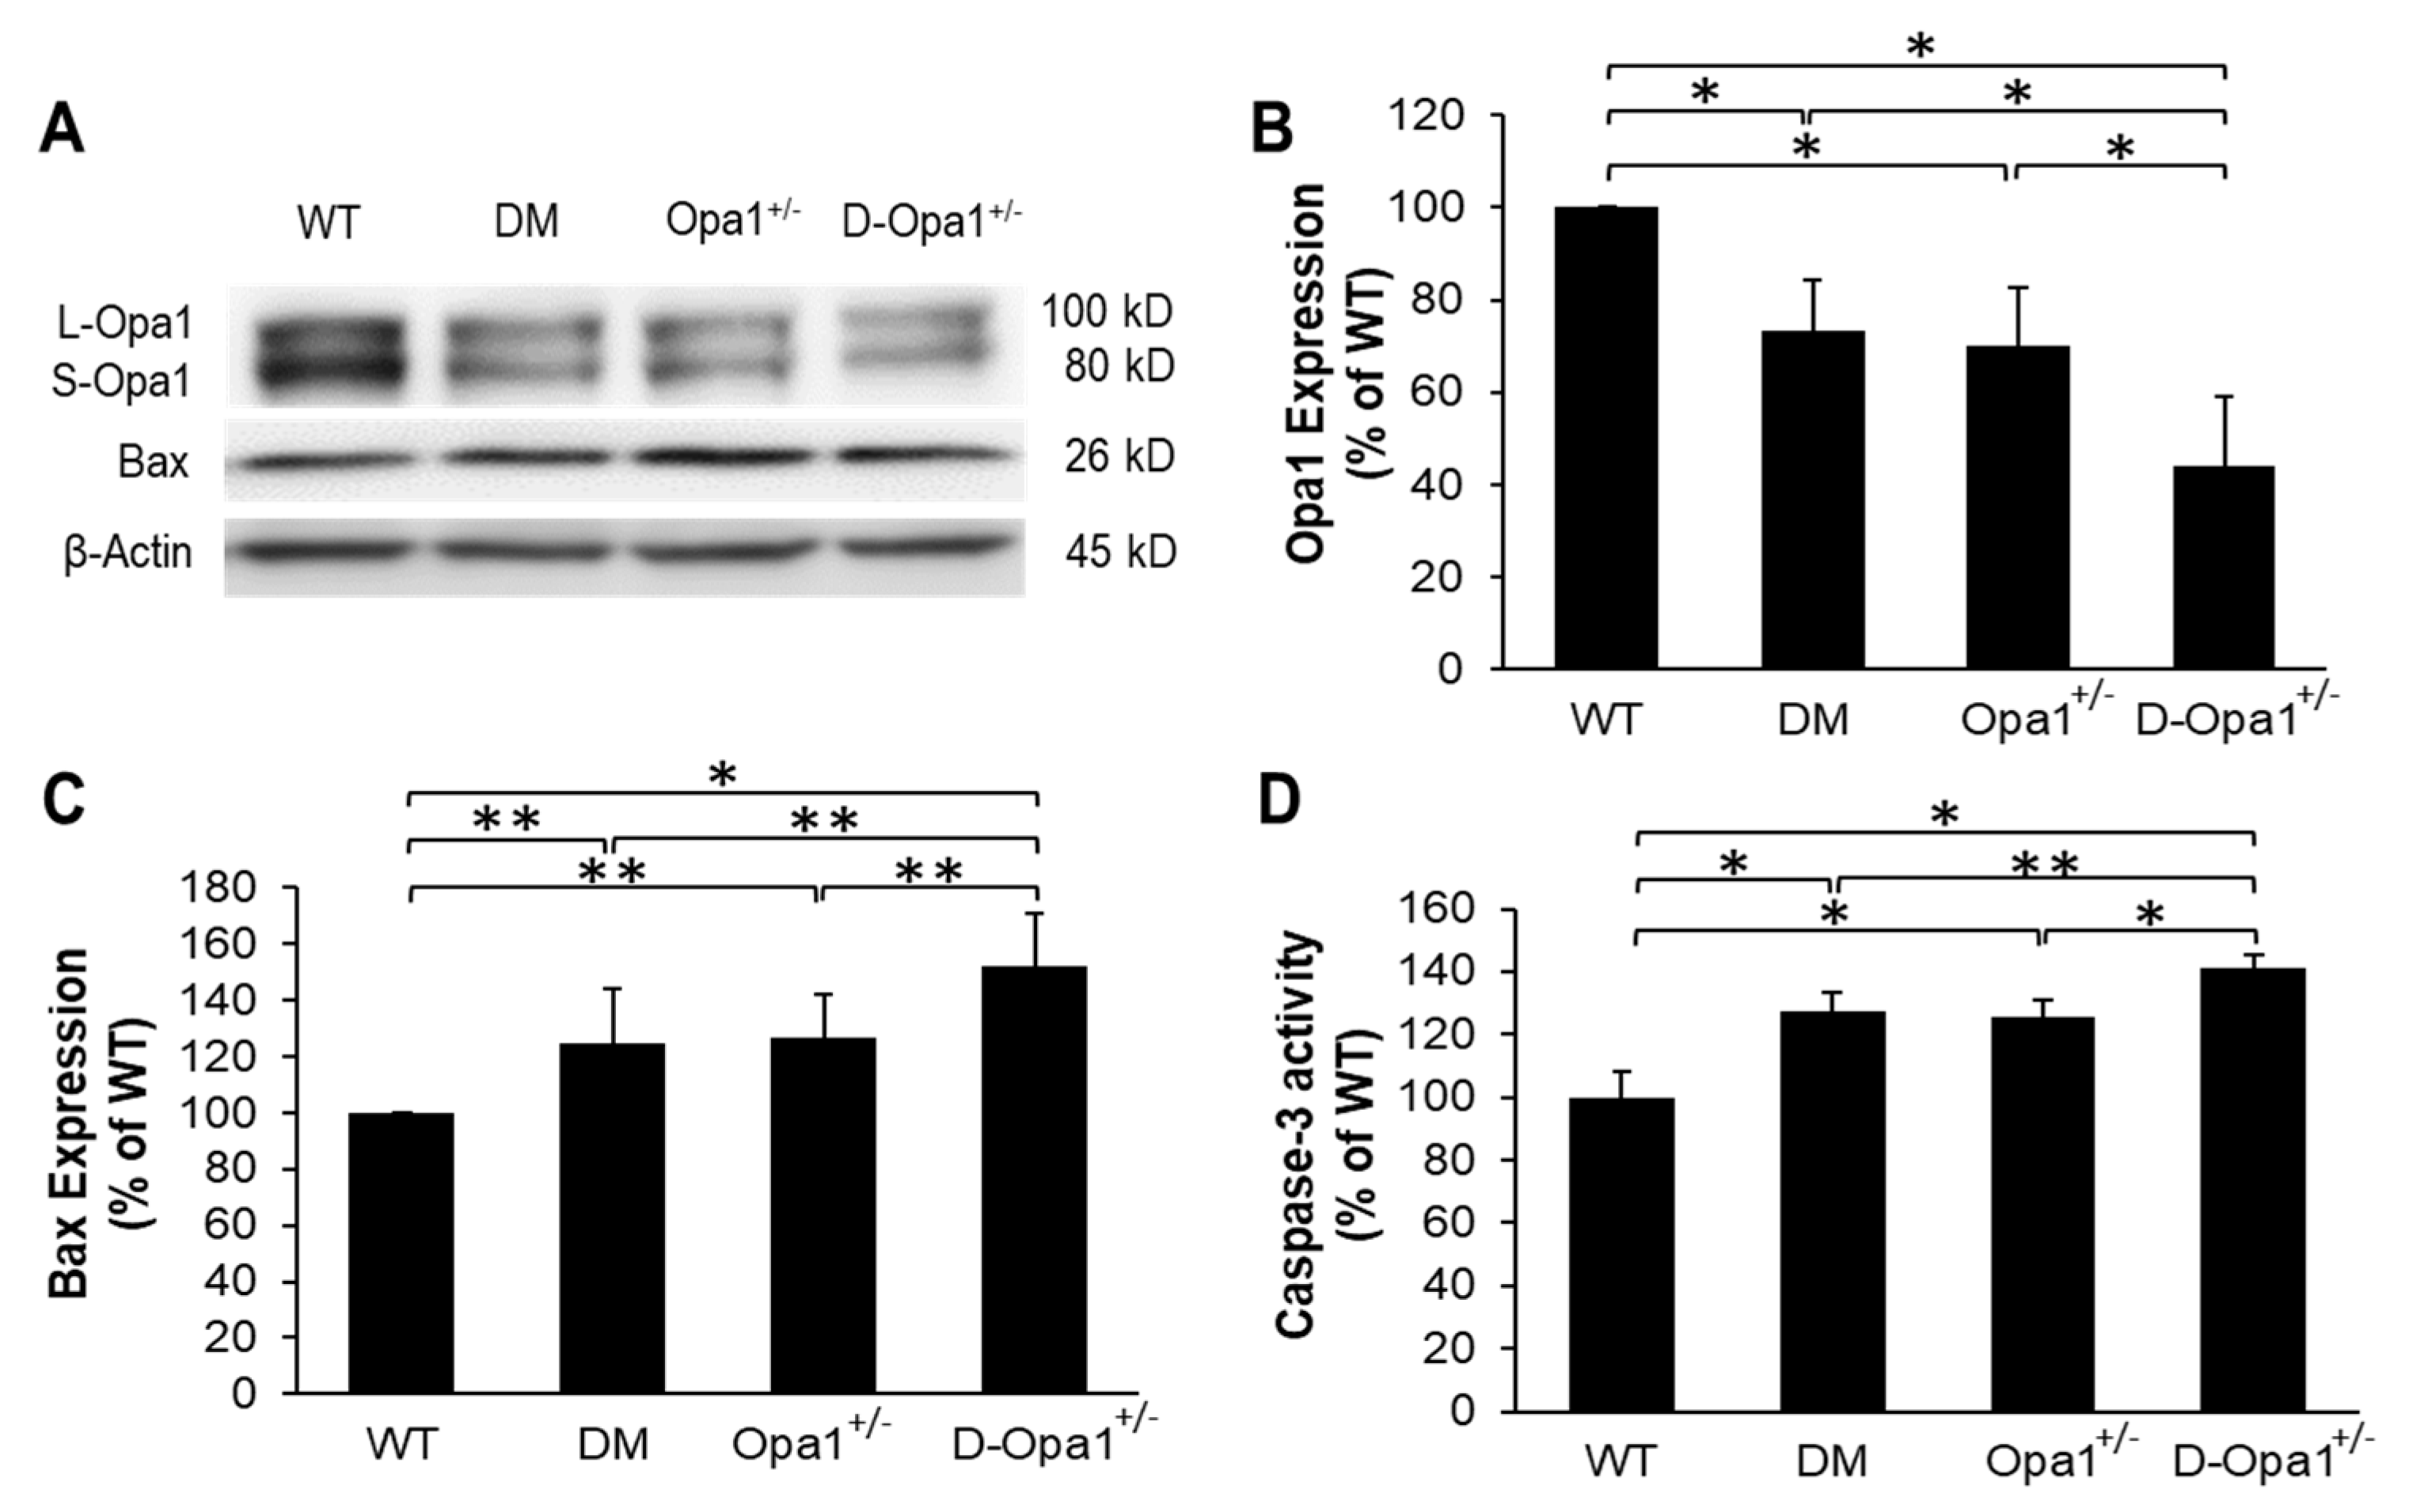
Western blot analysis showed that Opa1 expression level is significantly downregulated in diabetic mouse retinas compared with that of WT mouse retinas (73 ± 11% of WT, p < 0.01; n = 6; Figure 3A,B). Additionally, a 1.5-fold decrease in the ratio of short Opa1 isoform (S-Opa1) over long Opa1 isoform (L-Opa1) was observed in diabetic mouse retinas compared with those of non-diabetic WT mouse retinas (Figure 3A). As expected, retinas of Opa1+/− mice exhibited a significant decrease in Opa1 expression compared with that of WT mice (70 ± 13% of WT, p < 0.01; n = 6; Figure 3A,B). In parallel, Opa1 expression was further reduced in retinas of diabetic Opa1+/− mice (44 ± 15% of WT, p < 0.01; n = 6; Figure 3A,B) compared with retinas of diabetic mice. In retinas of diabetic mice, gene expression levels of pro-apoptotic Bax were significantly increased (Bax: 125 ± 20% of WT, p < 0.05; n = 6; Figure 3A,C) concomitant with increased caspase-3 activity (127 ± 6% of WT, p < 0.01; n = 6; Figure 3D) compared with those of WT mouse retinas. Interestingly, reduced Opa1 level in retinas of Opa1+/− mice showed a similar increase in Bax expression (126 ± 15% of WT, p < 0.05; n = 6; Figure 3A,C) and caspase-3 activation (126 ± 6% of WT, p < 0.01; n = 6; Figure 3D) compared with those of WT mouse retinas. Retinas of diabetic Opa1+/− mice exhibited further increase in Bax expression (152 ± 19% of WT, p < 0.05; n = 6; Figure 3A,C) and caspase-3 activation (141 ± 4% of WT, p < 0.05; n = 6; Figure 3D) compared with those of diabetic mouse retinas.
2.4. Effects of Reduced Opa1 Levels on Cytochrome c Release
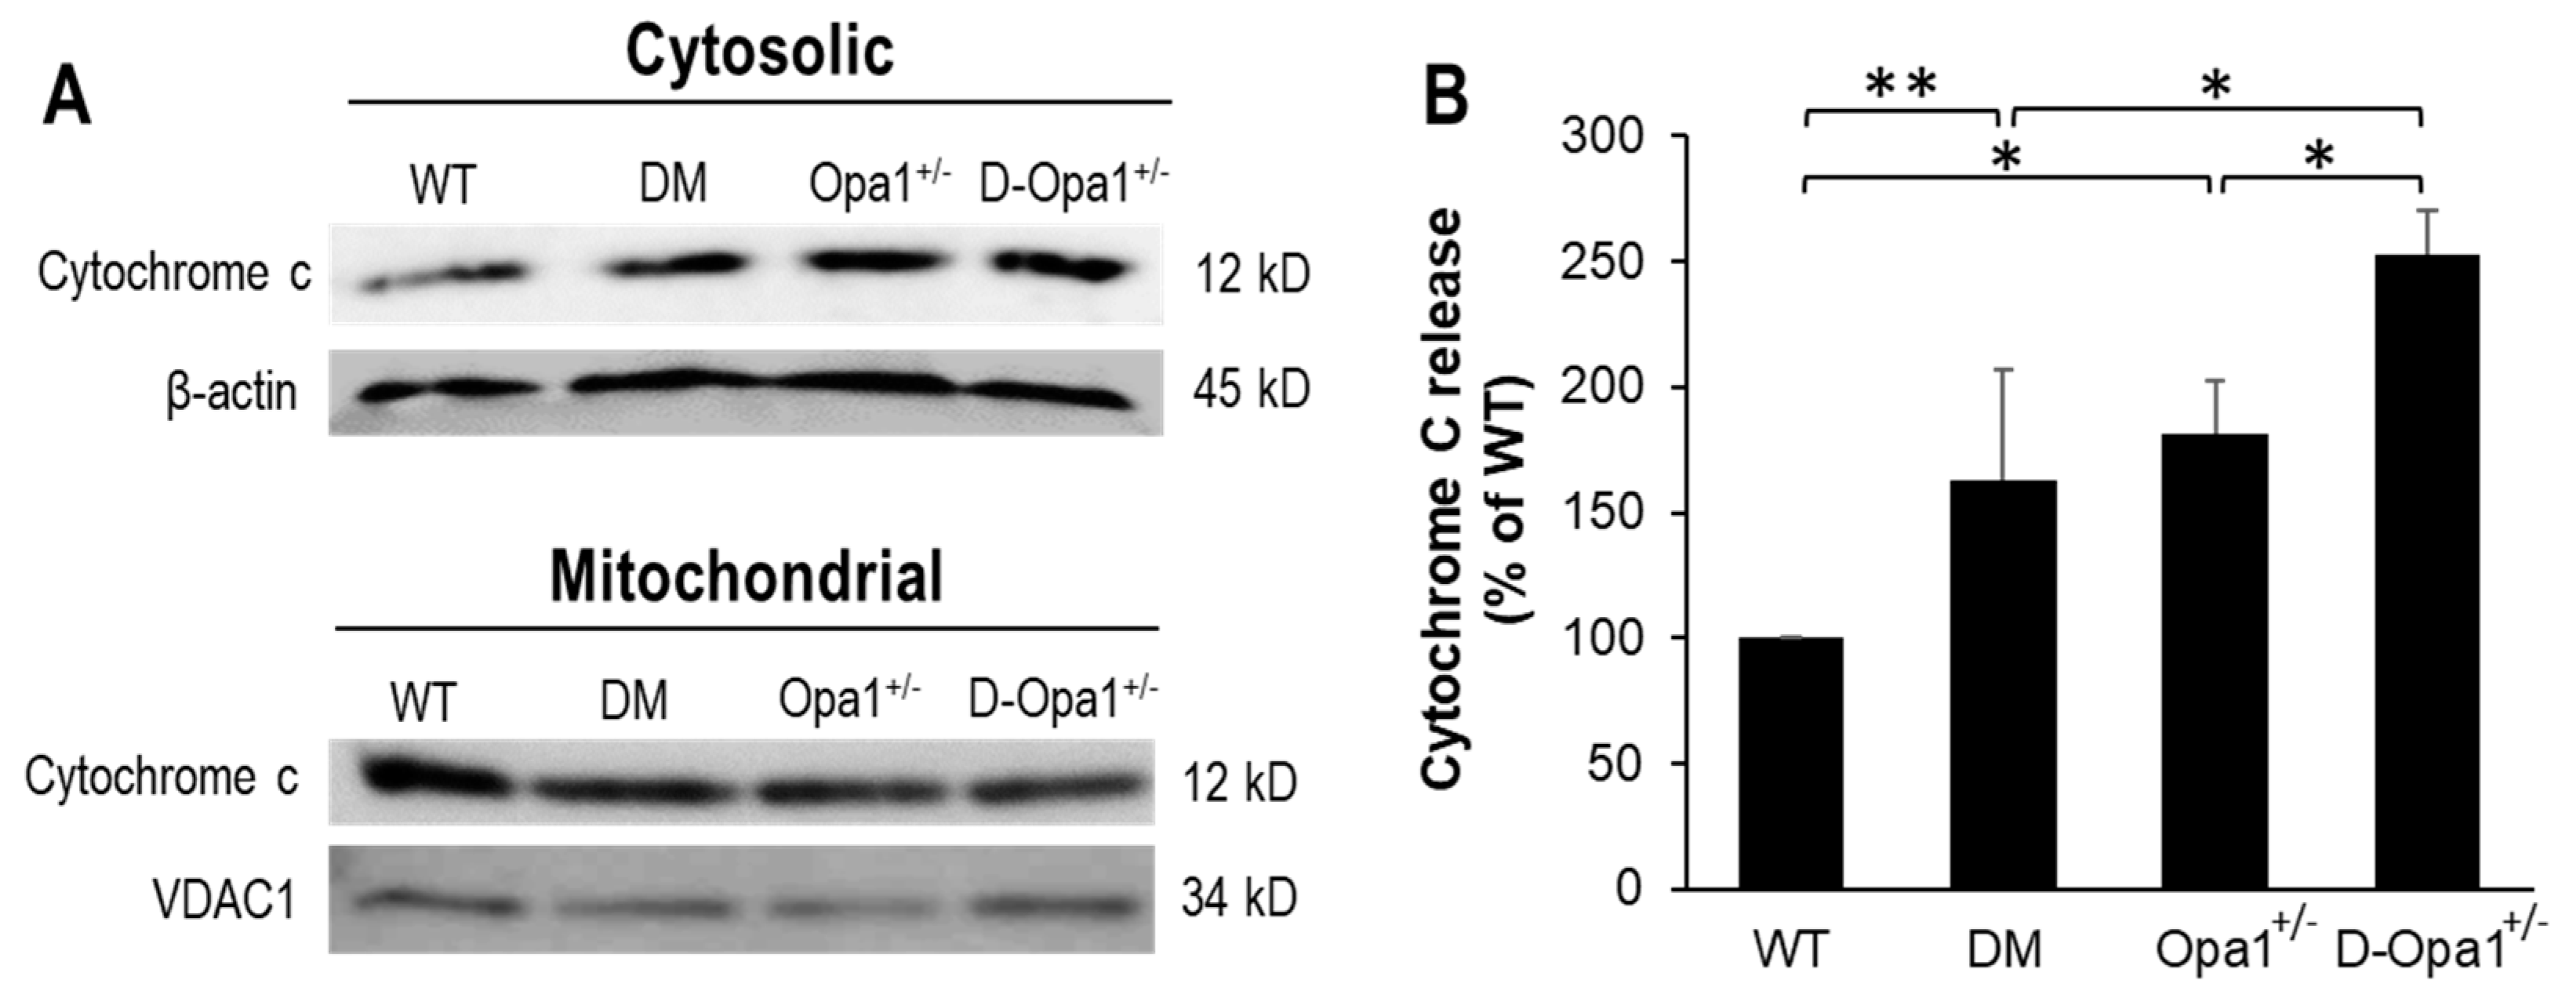
Western blot data indicated that retinas of diabetic mice exhibited elevated cytochrome c release compared with that in retinas of non-diabetic WT mice (163 ± 43% of WT, p < 0.05; n = 6; Figure 4A,B). Additionally, retinas of Opa1+/− mice showed elevated cytochrome c release compared with that in retinas of non-diabetic WT mice (181 ± 21% of WT, p < 0.01; n = 6; Figure 4A,B). Interestingly, further downregulation of Opa1 in retinas of diabetic Opa1+/− mice resulted in greater elevation in cytochrome c release (253 ± 18% of WT, p < 0.01; n = 6; Figure 4A,B) compared with that in retinas of diabetic mice.
2.5. Opa1 Downregulation Promotes Apoptotic Death of Vascular Cells in the Diabetic Retina
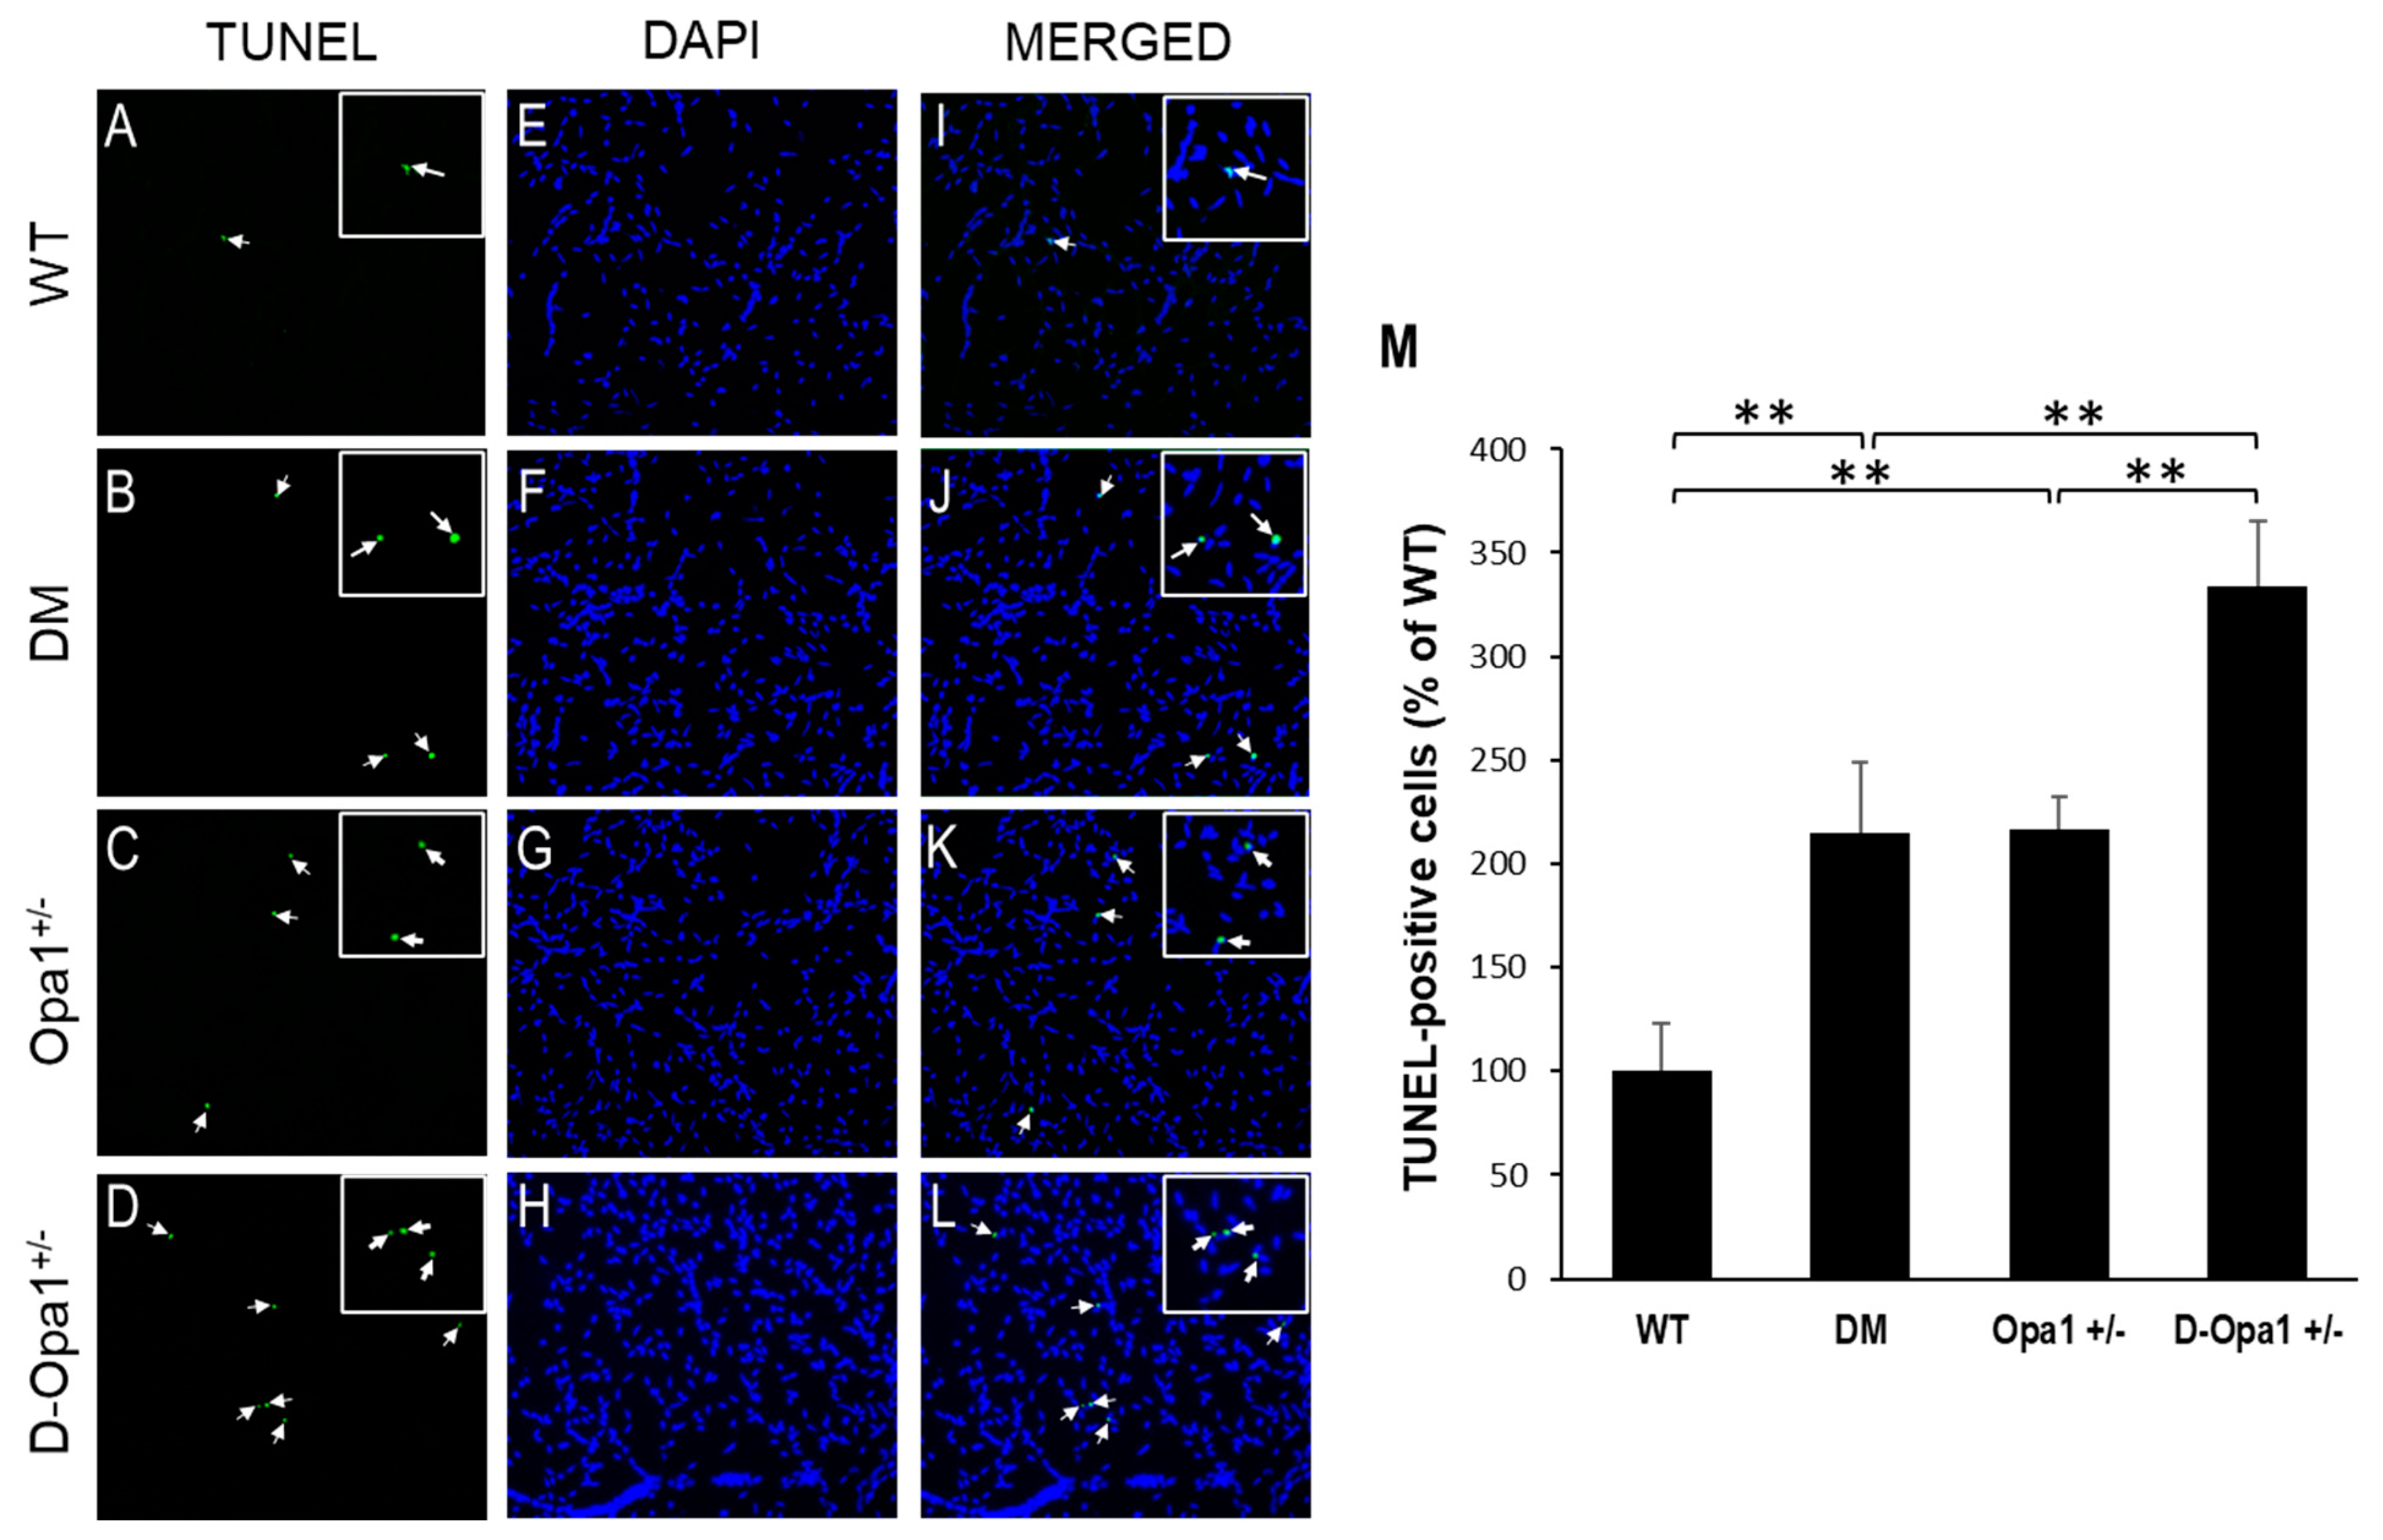
To assess whether reduced Opa1 expression contributes to apoptotic cell death in retinal vascular cells, TUNEL assay was performed in RTDs from each experimental group. Data indicated that there is a significant increase in the number of TUNEL-positive cells in RTDs of diabetic mice compared with that of non-diabetic WT mice (215 ± 34% of WT vs. 100 ± 23% of WT, p < 0.05; n = 6; Figure 5A–M). Reduced Opa1 expression alone in RTDs of Opa1+/− mice showed a similar increase in the number of TUNEL-positive cells compared with that of non-diabetic WT mice (217 ± 16% of WT vs. 100 ± 23% of WT, p < 0.05; n = 6; Figure 5A–M). Interestingly, when Opa1 levels were further reduced in diabetic Opa1+/− mice, the number of TUNEL-positive cells was significantly increased in RTDs of diabetic Opa1+/− mice compared with that of diabetic mice (334 ± 31% of WT vs. 215 ± 34% of WT, p < 0.05; n = 6; Figure 5A–M).
2.6. Diabetes-Induced Opa1 Downregulation Promotes Development of AC and PL
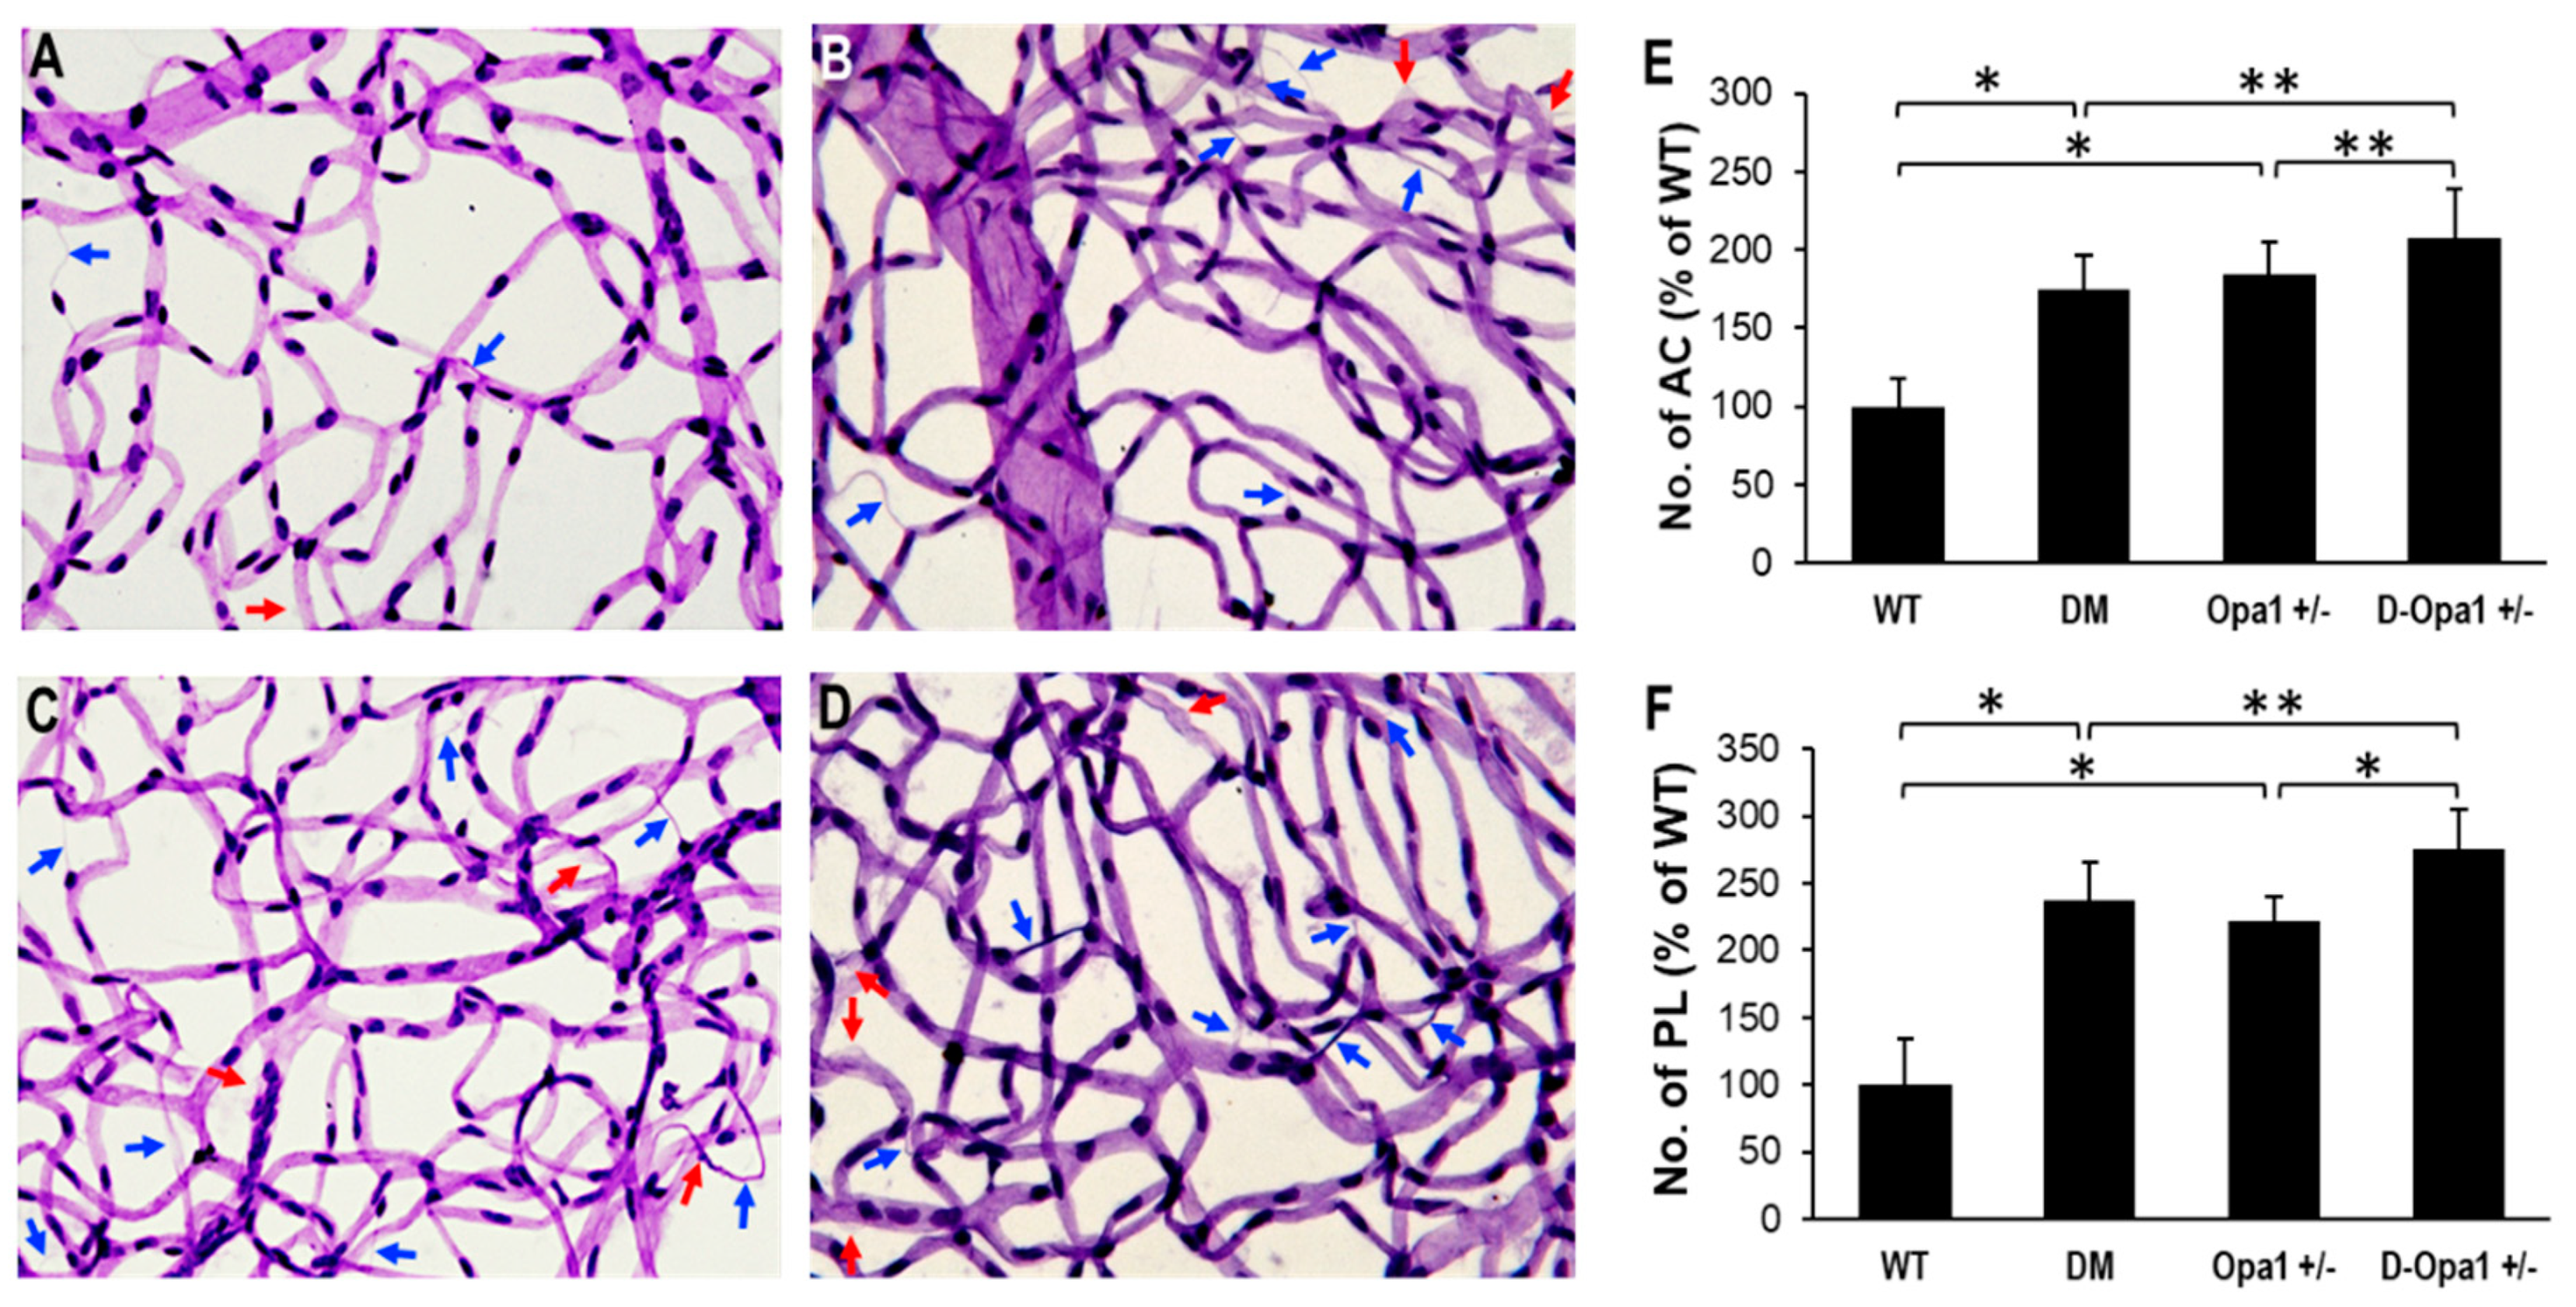
To evaluate the effects of diabetes and reduced Opa1 levels in the development of AC and PL, retinal trypsin digestion was carried out and the numbers of AC and PL between the experimental groups were analyzed. RTD data indicated a significant increase in the numbers of AC and PL in retinal capillary networks of diabetic mice compared with those of non-diabetic WT mice (AC: 175 ± 21% of WT vs. 100 ± 18% of WT, p < 0.01; n = 12; Figure 6A–F, PL: 237 ± 28% of WT vs. 100 ± 34% of WT, p < 0.01; n = 12; Figure 6A–F). Reduced Opa1 levels alone in RTDs of Opa1+/− mice exhibited a similar increase in the numbers of AC and PL compared with those of non-diabetic WT mice (AC: 184 ± 21% of WT vs. 100 ± 18% of WT, p < 0.01; n = 12; Figure 5A–F, PL: 221 ± 19% of WT vs. 100 ± 34% of WT, p < 0.01; n = 12; Figure 6A–F). Interestingly, when Opa1 levels were reduced further in diabetic Opa1+/− mice, the numbers of AC and PL were significantly elevated compared with those of diabetic mice (AC: 208 ± 31% of WT vs. 175 ± 21% of WT, p < 0.05; n = 12; Figure 5A–F, PL: 276 ± 29% of WT vs. 208 ± 31% of WT, p < 0.05; n = 12; Figure 6A–F).
3. Discussion
The present study shows that diabetes-induced Opa1 downregulation stimulates Bax activation, triggers cytochrome c release, and promotes apoptosis in retinal vascular cells, ultimately leading to the development of acellular capillaries and pericyte ghosts associated with DR. It is of interest that reduced Opa1 level alone in the Opa1+/− mice was sufficient to yield similar vascular changes seen in retinas of diabetic animals. Moreover, inducing diabetes to the Opa1+/− mice accelerated apoptotic cell death, suggesting that severity of DR pathogenesis may be linked to the extent of Opa1 reduction. Additionally, a relative decrease in S-Opa1 over L-Opa1 ratio was observed in diabetic mouse retinas compared with those of non-diabetic mouse retinas. These findings suggest that not only are expression levels of Opa1 reduced, but the processing of mature Opa1 may also be compromised in diabetic retinas.
Recent studies suggest that Opa1 is downregulated in various cell types and tissues under HG or diabetic conditions [32,33,34,35,36]. Cerebral vascular smooth muscle cells grown in HG medium exhibited a significant reduction in Opa1 expression and resulted in increased mitochondrial fragmentation that contributed to compromised contractility and decreased cell proliferation [33]. Similarly, cardiomyocytes grown in HG condition and cardiac tissues from diabetic rats exhibited marked Opa1 downregulation without significant difference in Mfn1 or Mfn2 levels [34]. In a study investigating diabetic neuropathy, Opa1 was found to be significantly downregulated in motor neurons grown in HG condition and in lumbar spinal cord tissues of type 1 diabetic rats [36]. In the type 2 diabetic mouse model, db/db mice, Opa1 levels were significantly reduced in mitochondria of pancreatic islets compared with those of non-diabetic mice [35]. These findings indicate that HG- or diabetes-induced Opa1 downregulation could result in significant negative consequences related to diabetic complications.
Our recent study has shown that HG-induced downregulation of Opa1 increased cytochrome c release and promoted mitochondrial fragmentation in retinal vascular cells of diabetic rodents [8]. However, the consequences of decreased Opa1 level in the diabetic retinas have not been well established. The current study demonstrates that decreased Opa1 level contributes to Bax activation, cytochrome c release, and caspase-3 activation in retinas of diabetic mice as well as in retinas of Opa1+/− mice. Recruitment of Bax to the mitochondrial outer membrane is closely associated with mitochondrial fragmentation involving reduced mitochondrial fusion and excess fission [37]. Bax activation, which is sufficient to induce cytochrome c release [38,39], likely acts through mitochondrial outer membrane permeabilization ultimately leading to apoptosis. Other studies have shown Opa1 plays a critical role in maintaining mitochondrial cristae opening [21] and that if these openings are perturbed, cytochrome c localized within the mitochondrial cristae could escape into the cytosol, triggering caspase activation and cell death [24,25]. Findings from our present study indicate that reduced Opa1 level not only compromises mitochondrial inner membrane integrity and leads to cytochrome c release, but also contributes at least in part to mitochondrial outer membrane permeabilization through Bax upregulation, ultimately leading to caspase-3 activation and cell death.
Loss of Opa1 negatively impacts mitochondrial morphology through mitochondrial swelling and development of localized constrictions in the mitochondria leading to mitochondrial fragmentation [40]. Importantly, Opa1 deficiency leads to significant mitochondrial fragmentation, which in turn could impair respiratory function [41]. Mice with decreased Opa1 levels express mitochondrial respiratory deficiency, a selective loss of respiratory complex IV subunits [42] and may ultimately compromise visual function [42]. Opa1 downregulation has also been implicated in contributing to inflammation known to participate in the development and progression of retinal damage in diabetes. Studies have shown that Opa1 deficiency could generate abnormally activated T cells and promote inflammation [43]. More recently, Opa1 ablation was shown to cause muscle inflammation through NF-Kβ activation and enhanced pro-inflammatory gene expression [44]. Taken together, these findings suggest future studies are necessary to address the role of pro-inflammatory effects as well as compromised mitochondrial bioenergetics underlying reduced Opa1 in the context of DR pathogenesis.
Our current study confirms that a decrease in Opa1 levels can promote apoptotic death of retinal vascular cells and lead to the formation of acellular capillaries and pericyte loss characteristic of DR pathogenesis. Moreover, induction of diabetes in Opa1+/− mice accelerates apoptotic cell death and capillary degeneration, suggesting that the extent of Opa1 downregulation may be linked to the severity of retinal vascular lesions in DR. Overall findings from the current study suggest that diabetes-induced Opa1 downregulation could be a potential target against the development of retinal vascular lesions in DR.
4. Materials and Methods
4.1. Animals
The present study was conducted following the guidelines of the ARVO Statement for the Use of Animals in Ophthalmic and Vision Research, and approved by the IACUC Committee of Boston University School of Medicine (PROTO201800411; approved on 9 March 2021). To account for any sex-related differences, both male and female mice were investigated. Specifically, 12 male and 12 female WT C57/BL6J mice obtained from Jackson Laboratory (Bar Harbor, ME), as well as 12 male and 12 female Opa1+/− mice with the C57/BL6J strain kindly provided by Dr. Marcela Votruba [42] were utilized to conduct experiments. A detailed methodology on how Opa1+/− mice were generated can be found in a study by [42]. Polymerase chain reaction (PCR) using a MasterMix (Promega, Madison, WI, USA) was performed to verify the genotype of the experimental animals used in the study. Primer sequences included in the PCR reaction were as follows: Primer 1, 5′–CTCTTCATGTATCTGTGGTC–3′; Primer 2, 5′–TTACCCGTGGTAGGTGATCATG–3′; and Primer 3, 5′–TTACCCGTGGTAGGTGATCATA–3′. The Opa1+/+ allele was identified at a band present at 160 bp amplified by primers 1 and 2. The Opa1+/− allele was detected at a band present at 160 bp amplified by primers 1 and 3. In the present study, the Opa1−/− mice were not included as the genotype is embryonically lethal [42,45].
To induce type 1 diabetes, STZ was injected intraperitoneally at a concentration of 40 mg/kg body weight daily for 5 days in 12 WT mice and 12 Opa1+/− mice. Animals representing non-diabetic controls received intraperitoneal injections of citrate buffer as vehicle. To verify the diabetes status in the animals, blood and urine glucose levels were measured 3 days post-STZ injection. Routine blood glucose assessment was performed 3 times per week. Depending on the hyperglycemic status, NPH insulin injections were administered to achieve a level of ~350 mg/dL. After 16 weeks of diabetes onset, animals were sacrificed, blood was collected from each animal and blood glucose and HbA1c levels were measured. Following sacrifice, retinas from each animal were isolated, and total protein extracted from all samples.
4.2. Opa1 Expression and Distribution in Retinal Capillary Networks
To study the distribution and expression of Opa1 in the retinal vasculature, retinal capillary networks were subjected to immunostaining with Opa1 antibody. The retinal capillary networks were washed several times with 1× PBS and subjected briefly to ice-cold methanol, followed by additional PBS washes. Then, the RTDs were exposed to a 2% BSA solution diluted in 1× PBS for 15 min at room temperature to block non-specific antibody binding. Following blocking, the RTDs were subjected to a primary antibody solution containing mouse monoclonal Opa1 antibody (1:200 in 2% BSA-PBS solution, Catalog #sc-393296, Santa Cruz Biotechnology, Dallas, TX, USA) and incubated overnight at 4 °C in a moist chamber. The following day, RTDs were washed in PBS and incubated at room temperature with FITC-conjugated rabbit anti-mouse IgG secondary antibody (1:100 in 2% BSA-PBS Solution, Catalog #315-097-003, Jackson ImmunoResearch, West Grove, PA, USA) for 1 h. After three PBS washes, RTDs were counterstained with DAPI, and mounted in SlowFade Diamond Antifade Mountant reagent (SlowFade Diamond; Molecular Probes, Eugene, OR, USA). Digital images were captured, and Opa1 immunostaining was quantified from 10 random representative fields from each RTD, with equal exposure time for all compared panels for each antigen.
4.3. Isolation of Cytosolic and Mitochondrial Fractions from Retinas
Retinas of WT mice, diabetic mice, Opa1+/− mice, and diabetic Opa1+/− mice were isolated, and mitochondrial and cytosolic protein were obtained from the tissues using the Mitochondria Isolation Kit (Thermo Scientific, Waltham, MA, USA) following the manufacturer’s instructions. Briefly, retinal tissues were lysed, centrifuged, supernatant separated and isolated as cytosolic fraction, and centrifuged once more to obtain mitochondrial fractions as previously described [8]. Protein representing mitochondrial and cytosolic fractions were assessed using Western blot analysis for cytochrome c levels.
4.4. Western Blot Analysis
Retinal tissues from experimental animals were extracted and protein isolated for analyzing Opa1, Bax, and cytochrome c levels as previously described [8]. The membrane was incubated overnight with mouse monoclonal Opa1 antibody (1:1000, Catalog #sc-393296, Santa Cruz Biotechnology, Dallas, TX, USA), rabbit cytochrome c antibody (1:1000, Catalog#11940, Cell Signaling, Danvers, MA, USA), or rabbit Bax antibody (1:1000, Catalog #2772, Cell Signaling, Danvers, MA, USA) in Tris-buffered solution containing 0.1% Tween-20 (TTBS) and 5% bovine serum albumin. After TTBS washes, the membrane was exposed to a secondary antibody using anti-rabbit IgG, AP-conjugated antibody (1:3000, Catalog #7054, Cell Signaling) or anti-mouse IgG, AP-conjugated antibody (1:3000, Catalog #7056, Cell Signaling) at room temperature and subjected to Immun-Star chemiluminescent substrate (Bio-Rad Laboratories, Hercules, CA, USA). Western blot signals were captured using a digital imager (Fujifilm LAS-4000, Fujifilm, Tokyo, Japan) and densitometry performed using the ImageJ software v1.53i (NIH, Bethesda, MD, USA). B-actin (1:1000, Catalog #4967, Cell Signaling) and VDAC1 (1:1000, Catalog #sc-390996, Santa Cruz Biotechnology, Dallas, TX, USA) antibodies were subsequently used on stripped membranes to verify equal loading of protein in each lane.
4.5. Assessment of Caspase-3 Activity
To evaluate caspase-3 activity in retinas of diabetic animals and Opa1+/− animals, fluorometric analysis was carried out using a commercially available caspase-3 assay kit (Abcam, Cambridge, UK; Catalog #ab39383). Lysates from retinal tissues were isolated using the kit’s proprietary lysis buffer, incubated on ice for 10 min, and homogenized. Following BCA assay of the retinal tissue lysates, 20 μg of protein from each sample was used to perform fluorometric evaluation of caspase-3 activity. The retinal lysates were mixed with reaction buffer containing DTT (10 mM final concentration) and Acetyl-Asp-Glu-Val-Asp-7-amino-4 trifluoromethylcoumarin (DEVD-AFC) (50 µM final concentration), a fluorogenic substrate specific to caspase-3. The reaction mixture representing each sample was transferred to corresponding wells in a 96-well plate, incubated at 37 °C for 2 h, and subjected to fluorescent excitation and emission at 400 nm and 505 nm, respectively. Specifically, cleavage of the DEVD-AFC substrate is carried out by activated caspase-3 resulting in the formation of free AFC molecules, which can be detected at 400 nm excitation and 505 nm emission [46]. Therefore, relative difference in DEVD-AFC cleavage between experimental groups was used to analyze caspase-3 activity.
4.6. Terminal dUTP Nick-End Labeling Assay
To identify cells undergoing apoptosis, terminal deoxynucleotidyl transferase-mediated uridine 5′-triphosphate-biotin nick end labeling (TUNEL) assay was performed using a commercially available kit (ApopTag, Sigma, Temecula, CA, USA) as previously described [47]. Briefly, retinal capillaries were fixed in paraformaldehyde, permeabilized in EtOH-acetic acid, washed in PBS, and incubated in deoxyribonucleotidyl transferase enzyme for one hour at 37 °C. The capillary networks were mounted using antifade reagent (SlowFade Diamond Antifade, Cat#S36963; Invitrogen, Carlsbad, CA, USA) and DAPI. Images from 10 random fields were captured using a digital microscope (Nikon Eclipse; TE2000-S, Nikon, Tokyo, Japan) and analyzed for TUNEL-positive cells.
4.7. Retinal Trypsin Digestion and Assessment of Acellular Capillaries and Pericyte Loss
After sacrifice, eyes were enucleated and placed in 10% formalin, and retinas isolated and exposed to 0.5M glycine for 24 h. To isolate retinal capillaries, RTD was performed as described [48]. Briefly, retinas were subjected to 3% trypsin, glia removed through tapping with a single hair brush, and mounted on a silane-coated slide. RTDs were stained with periodic acid-Schiff and hematoxylin as described [49]. Using a digital camera attached to a microscope (Nikon Eclipse; TE2000-S, Nikon, Tokyo, Japan), 10 representative fields were imaged and assessed for AC and PL in a blinded manner. Vessels without endothelial cells and pericytes represented ACs. PL was determined by counting pericyte ghosts, which appear as “empty shells” representing dead pericytes.
4.8. Statistical Analysis
Data are shown as mean ± standard deviation. Values representing experimental groups are shown as percentages of the control. The normalized values were subjected to one-way ANOVA followed by Bonferroni’s post hoc test. Statistical significance was considered at p < 0.05.
Author Contributions
Conceptualization, S.R.; methodology, D.K. and M.V.; formal analysis, D.K. and S.R.; investigation, D.K. and S.R.; resources, M.V. and S.R.; writing—original draft preparation, D.K. and S.R.; writing—review and editing, D.K., M.V. and S.R.; and funding acquisition, S.R. All authors have read and agreed to the published version of the manuscript.
Funding
This research was supported by NEI, NIH grant EY027082 (SR).
Institutional Review Board Statement
The study was conducted according to the guidelines of the ARVO Statement for the Use of Animals in Ophthalmic and Vision Research and approved by the IACUC Committee of Boston University (PROTO201800411; approved on 9 March 2021).
Informed Consent Statement
Not applicable.
Data Availability Statement
Data presented in the article are available by request to corresponding author, Sayon Roy ([email protected]).
Acknowledgments
We acknowledge the technical support by Maeve Evans in the study.
Conflicts of Interest
The authors declare no conflict of interest.
References
- Duh, E.J.; Sun, J.K.; Stitt, A.W. Diabetic retinopathy: Current understanding, mechanisms, and treatment strategies. JCI Insight 2017, 2. [Google Scholar] [CrossRef]
- Mizutani, M.; Kern, T.S.; Lorenzi, M. Accelerated death of retinal microvascular cells in human and experimental diabetic retinopathy. J. Clin. Investig. 1996, 97, 2883–2890. [Google Scholar] [CrossRef]
- Wong, T.Y.; Sabanayagam, C. Strategies to Tackle the Global Burden of Diabetic Retinopathy: From Epidemiology to Artificial Intelligence. Ophthalmologica 2020, 243, 9–20. [Google Scholar] [CrossRef]
- Oshitari, T.; Yamamoto, S.; Hata, N.; Roy, S. Mitochondria- and caspase-dependent cell death pathway involved in neuronal degeneration in diabetic retinopathy. Br. J. Ophthalmol. 2008, 92, 552–556. [Google Scholar] [CrossRef]
- Kowluru, R.A. Mitochondria damage in the pathogenesis of diabetic retinopathy and in the metabolic memory associated with its continued progression. Curr. Med. Chem. 2013, 20, 3226–3233. [Google Scholar] [CrossRef] [PubMed]
- Kowluru, R.A.; Mishra, M. Therapeutic targets for altering mitochondrial dysfunction associated with diabetic retinopathy. Expert Opin. Ther. Targets 2018, 22, 233–245. [Google Scholar] [CrossRef] [PubMed]
- Roy, S.; Kim, D.; Sankaramoorthy, A. Mitochondrial Structural Changes in the Pathogenesis of Diabetic Retinopathy. J. Clin. Med. 2019, 8, 1363. [Google Scholar] [CrossRef] [PubMed] [Green Version]
- Kim, D.; Roy, S. Effects of Diabetes on Mitochondrial Morphology and Its Implications in Diabetic Retinopathy. Investig. Ophthalmol. Vis. Sci. 2020, 61, 10. [Google Scholar] [CrossRef] [PubMed]
- Miller, D.J.; Cascio, M.A.; Rosca, M.G. Diabetic Retinopathy: The Role of Mitochondria in the Neural Retina and Microvascular Disease. Antioxidants 2020, 9, 905. [Google Scholar] [CrossRef]
- Kim, D.; Sankaramoorthy, A.; Roy, S. Downregulation of Drp1 and Fis1 Inhibits Mitochondrial Fission and Prevents High Glucose-Induced Apoptosis in Retinal Endothelial Cells. Cells 2020, 9, 1662. [Google Scholar] [CrossRef]
- Roy, S.; Kern, T.S.; Song, B.; Stuebe, C. Mechanistic Insights into Pathological Changes in the Diabetic Retina: Implications for Targeting Diabetic Retinopathy. Am. J. Pathol. 2017, 187, 9–19. [Google Scholar] [CrossRef] [Green Version]
- Roy, S.; Trudeau, K.; Roy, S.; Tien, T.; Barrette, K.F. Mitochondrial dysfunction and endoplasmic reticulum stress in diabetic retinopathy: Mechanistic insights into high glucose-induced retinal cell death. Curr. Clin. Pharmacol. 2013, 8, 278–284. [Google Scholar] [CrossRef]
- Tien, T.; Zhang, J.; Muto, T.; Kim, D.; Sarthy, V.P.; Roy, S. High Glucose Induces Mitochondrial Dysfunction in Retinal Muller Cells: Implications for Diabetic Retinopathy. Investig. Ophthalmol. Vis. Sci. 2017, 58, 2915–2921. [Google Scholar] [CrossRef]
- Trudeau, K.; Molina, A.J.; Guo, W.; Roy, S. High glucose disrupts mitochondrial morphology in retinal endothelial cells: Implications for diabetic retinopathy. Am. J. Pathol. 2010, 177, 447–455. [Google Scholar] [CrossRef] [PubMed]
- Trudeau, K.; Molina, A.J.; Roy, S. High glucose induces mitochondrial morphology and metabolic changes in retinal pericytes. Investig. Ophthalmol. Vis. Sci. 2011, 52, 8657–8664. [Google Scholar] [CrossRef] [Green Version]
- Trudeau, K.; Muto, T.; Roy, S. Downregulation of mitochondrial connexin 43 by high glucose triggers mitochondrial shape change and cytochrome C release in retinal endothelial cells. Investig. Ophthalmol. Vis. Sci. 2012, 53, 6675–6681. [Google Scholar] [CrossRef] [PubMed] [Green Version]
- Shin, E.S.; Sorenson, C.M.; Sheibani, N. Diabetes and retinal vascular dysfunction. J. Ophthalmic. Vis. Res. 2014, 9, 362–373. [Google Scholar] [CrossRef] [PubMed]
- Yang, L.; Tang, H.; Lin, X.; Wu, Y.; Zeng, S.; Pan, Y.; Li, Y.; Xiang, G.; Lin, Y.F.; Zhuang, S.M.; et al. OPA1-Exon4b Binds to mtDNA D-Loop for Transcriptional and Metabolic Modulation, Independent of Mitochondrial Fusion. Front. Cell Dev. Biol. 2020, 8, 180. [Google Scholar] [CrossRef] [PubMed]
- Chen, H.; Chomyn, A.; Chan, D.C. Disruption of fusion results in mitochondrial heterogeneity and dysfunction. J. Biol. Chem. 2005, 280, 26185–26192. [Google Scholar] [CrossRef] [PubMed] [Green Version]
- Chen, H.; Vermulst, M.; Wang, Y.E.; Chomyn, A.; Prolla, T.A.; McCaffery, J.M.; Chan, D.C. Mitochondrial fusion is required for mtDNA stability in skeletal muscle and tolerance of mtDNA mutations. Cell 2010, 141, 280–289. [Google Scholar] [CrossRef] [PubMed] [Green Version]
- Frezza, C.; Cipolat, S.; Martins de Brito, O.; Micaroni, M.; Beznoussenko, G.V.; Rudka, T.; Bartoli, D.; Polishuck, R.S.; Danial, N.N.; De Strooper, B.; et al. OPA1 controls apoptotic cristae remodeling independently from mitochondrial fusion. Cell 2006, 126, 177–189. [Google Scholar] [CrossRef] [Green Version]
- Olichon, A.; Guillou, E.; Delettre, C.; Landes, T.; Arnaune-Pelloquin, L.; Emorine, L.J.; Mils, V.; Daloyau, M.; Hamel, C.; Amati-Bonneau, P.; et al. Mitochondrial dynamics and disease, OPA1. Biochim. Biophys. Acta 2006, 1763, 500–509. [Google Scholar] [CrossRef] [Green Version]
- van der Bliek, A.M.; Shen, Q.; Kawajiri, S. Mechanisms of mitochondrial fission and fusion. Cold Spring Harb. Perspect. Biol. 2013, 5. [Google Scholar] [CrossRef]
- Arnoult, D.; Grodet, A.; Lee, Y.J.; Estaquier, J.; Blackstone, C. Release of OPA1 during apoptosis participates in the rapid and complete release of cytochrome c and subsequent mitochondrial fragmentation. J. Biol. Chem. 2005, 280, 35742–35750. [Google Scholar] [CrossRef] [PubMed] [Green Version]
- Olichon, A.; Baricault, L.; Gas, N.; Guillou, E.; Valette, A.; Belenguer, P.; Lenaers, G. Loss of OPA1 perturbates the mitochondrial inner membrane structure and integrity, leading to cytochrome c release and apoptosis. J. Biol. Chem. 2003, 278, 7743–7746. [Google Scholar] [CrossRef] [PubMed] [Green Version]
- Yarosh, W.; Monserrate, J.; Tong, J.J.; Tse, S.; Le, P.K.; Nguyen, K.; Brachmann, C.B.; Wallace, D.C.; Huang, T. The molecular mechanisms of OPA1-mediated optic atrophy in Drosophila model and prospects for antioxidant treatment. PLoS Genet 2008, 4, e6. [Google Scholar] [CrossRef] [Green Version]
- Herkenne, S.; Ek, O.; Zamberlan, M.; Pellattiero, A.; Chergova, M.; Chivite, I.; Novotna, E.; Rigoni, G.; Fonseca, T.B.; Samardzic, D.; et al. Developmental and Tumor Angiogenesis Requires the Mitochondria-Shaping Protein Opa1. Cell Metab. 2020, 31, 987–1003.e1008. [Google Scholar] [CrossRef] [PubMed]
- Garrido, C.; Galluzzi, L.; Brunet, M.; Puig, P.E.; Didelot, C.; Kroemer, G. Mechanisms of cytochrome c release from mitochondria. Cell Death Differ. 2006, 13, 1423–1433. [Google Scholar] [CrossRef] [PubMed] [Green Version]
- Von Ahsen, O.; Waterhouse, N.J.; Kuwana, T.; Newmeyer, D.D.; Green, D.R. The ’harmless’ release of cytochrome c. Cell Death Differ. 2000, 7, 1192–1199. [Google Scholar] [CrossRef] [Green Version]
- Ow, Y.P.; Green, D.R.; Hao, Z.; Mak, T.W. Cytochrome c: Functions beyond respiration. Nat. Rev. Mol. Cell Biol. 2008, 9, 532–542. [Google Scholar] [CrossRef]
- Bossy-Wetzel, E.; Newmeyer, D.D.; Green, D.R. Mitochondrial cytochrome c release in apoptosis occurs upstream of DEVD-specific caspase activation and independently of mitochondrial transmembrane depolarization. EMBO J. 1998, 17, 37–49. [Google Scholar] [CrossRef] [PubMed] [Green Version]
- Patten, D.; Harper, M.E.; Boardman, N. Harnessing the protective role of OPA1 in diabetic cardiomyopathy. Acta Physiol. 2020, 229, e13466. [Google Scholar] [CrossRef] [PubMed]
- Guo, Y.; Wang, S.; Liu, Y.; Fan, L.; Booz, G.W.; Roman, R.J.; Chen, Z.; Fan, F. Accelerated cerebral vascular injury in diabetes is associated with vascular smooth muscle cell dysfunction. Geroscience 2020, 42, 547–561. [Google Scholar] [CrossRef]
- Ding, M.; Liu, C.; Shi, R.; Yu, M.; Zeng, K.; Kang, J.; Fu, F.; Mi, M. Mitochondrial fusion promoter restores mitochondrial dynamics balance and ameliorates diabetic cardiomyopathy in an optic atrophy 1-dependent way. Acta Physiol. 2020, 229, e13428. [Google Scholar] [CrossRef]
- Li, J.; Du, H.; Zhang, M.; Zhang, Z.; Teng, F.; Zhao, Y.; Zhang, W.; Yu, Y.; Feng, L.; Cui, X.; et al. Amorphous solid dispersion of Berberine mitigates apoptosis via iPLA2beta/Cardiolipin/Opa1 pathway in db/db mice and in Palmitate-treated MIN6 beta-cells. Int. J. Biol. Sci. 2019, 15, 1533–1545. [Google Scholar] [CrossRef] [Green Version]
- Chen, L.; Huang, J.; Li, X.C.; Liu, S.Y.; Li, Y.H.; Wang, Q.; Yang, J.J.; Cao, H.M.; Hu, Q.K.; He, L.J. High-glucose Induced Mitochondrial Dynamics Disorder of Spinal Cord Neurons in Diabetic Rats and its Effect on Mitochondrial Spatial Distribution. Spine 2019, 44, E715–E722. [Google Scholar] [CrossRef] [PubMed]
- Maes, M.E.; Grosser, J.A.; Fehrman, R.L.; Schlamp, C.L.; Nickells, R.W. Completion of BAX recruitment correlates with mitochondrial fission during apoptosis. Sci. Rep. 2019, 9, 16565. [Google Scholar] [CrossRef] [PubMed] [Green Version]
- Jurgensmeier, J.M.; Xie, Z.; Deveraux, Q.; Ellerby, L.; Bredesen, D.; Reed, J.C. Bax directly induces release of cytochrome c from isolated mitochondria. Proc. Natl. Acad. Sci. USA 1998, 95, 4997–5002. [Google Scholar] [CrossRef] [PubMed] [Green Version]
- Yamaguchi, R.; Lartigue, L.; Perkins, G.; Scott, R.T.; Dixit, A.; Kushnareva, Y.; Kuwana, T.; Ellisman, M.H.; Newmeyer, D.D. Opa1-mediated cristae opening is Bax/Bak and BH3 dependent, required for apoptosis, and independent of Bak oligomerization. Mol. Cell 2008, 31, 557–569. [Google Scholar] [CrossRef] [Green Version]
- Griparic, L.; van der Wel, N.N.; Orozco, I.J.; Peters, P.J.; van der Bliek, A.M. Loss of the intermembrane space protein Mgm1/OPA1 induces swelling and localized constrictions along the lengths of mitochondria. J. Biol. Chem. 2004, 279, 18792–18798. [Google Scholar] [CrossRef] [Green Version]
- Sun, S.; Erchova, I.; Sengpiel, F.; Votruba, M. Opa1 Deficiency Leads to Diminished Mitochondrial Bioenergetics With Compensatory Increased Mitochondrial Motility. Investig. Ophthalmol. Vis. Sci. 2020, 61, 42. [Google Scholar] [CrossRef]
- Davies, V.J.; Hollins, A.J.; Piechota, M.J.; Yip, W.; Davies, J.R.; White, K.E.; Nicols, P.P.; Boulton, M.E.; Votruba, M. Opa1 deficiency in a mouse model of autosomal dominant optic atrophy impairs mitochondrial morphology, optic nerve structure and visual function. Hum. Mol. Genet. 2007, 16, 1307–1318. [Google Scholar] [CrossRef] [Green Version]
- Corrado, M.; Samardzic, D.; Giacomello, M.; Rana, N.; Pearce, E.L.; Scorrano, L. Deletion of the mitochondria-shaping protein Opa1 during early thymocyte maturation impacts mature memory T cell metabolism. Cell Death Differ. 2021. [Google Scholar] [CrossRef]
- Rodriguez-Nuevo, A.; Diaz-Ramos, A.; Noguera, E.; Diaz-Saez, F.; Duran, X.; Munoz, J.P.; Romero, M.; Plana, N.; Sebastian, D.; Tezze, C.; et al. Mitochondrial DNA and TLR9 drive muscle inflammation upon Opa1 deficiency. EMBO J. 2018, 37. [Google Scholar] [CrossRef]
- Alavi, M.V.; Bette, S.; Schimpf, S.; Schuettauf, F.; Schraermeyer, U.; Wehrl, H.F.; Ruttiger, L.; Beck, S.C.; Tonagel, F.; Pichler, B.J.; et al. A splice site mutation in the murine Opa1 gene features pathology of autosomal dominant optic atrophy. Brain 2007, 130, 1029–1042. [Google Scholar] [CrossRef] [Green Version]
- Xiang, J.; Chao, D.T.; Korsmeyer, S.J. BAX-induced cell death may not require interleukin 1 beta-converting enzyme-like proteases. Proc. Natl. Acad. Sci. USA 1996, 93, 14559–14563. [Google Scholar] [CrossRef] [Green Version]
- Kim, D.; Mecham, R.P.; Nguyen, N.H.; Roy, S. Decreased lysyl oxidase level protects against development of retinal vascular lesions in diabetic retinopathy. Exp. Eye Res. 2019, 184, 221–226. [Google Scholar] [CrossRef]
- Kuwabara, T.; Cogan, D.G. Studies of retinal vascular patterns. I. Normal architecture. Arch. Ophthalmol. 1960, 64, 904–911. [Google Scholar] [CrossRef]
- Tien, T.; Muto, T.; Barrette, K.; Challyandra, L.; Roy, S. Downregulation of Connexin 43 promotes vascular cell loss and excess permeability associated with the development of vascular lesions in the diabetic retina. Mol. Vis. 2014, 20, 732–741. [Google Scholar]
Figure 1.
PCR analysis using mice tail tip DNA indicating genotypes of Opa1 heterozygous knockout (+/−) and wild-type (WT) mice. The wild-type Opa1 allele (Opa1+/+) and the disrupted allele (Opa1+/−) are both represented by a band at 0.16kb.
Figure 1.
PCR analysis using mice tail tip DNA indicating genotypes of Opa1 heterozygous knockout (+/−) and wild-type (WT) mice. The wild-type Opa1 allele (Opa1+/+) and the disrupted allele (Opa1+/−) are both represented by a band at 0.16kb.

Figure 2.
Opa1+/− mice exhibit reduced Opa1 immunofluorescence in the retinal capillary network. (A) Representative images of Opa1 immunofluorescence (green) and DAPI (blue) in retinal capillaries of wild type (WT) mice and Opa1+/− mice; 20x magnification. (B) Graphical illustration of cumulative data shows decreased Opa1 immunofluorescence in retinal capillaries of Opa1+/− mice compared with that of WT mice. * p < 0.01, n = 6; ** p < 0.05, n = 6.

Figure 3.
Reduced Opa1 expression increases Bax and caspase-3 activity in Opa1+/− mouse retinas. (A) Representative WB image shows Opa1 and Bax expression in the retinas of WT, diabetic (DM), Opa1+/−, and diabetic Opa1+/− (D-Opa1+/−) mice. (B) Graphical illustration of cumulative data shows diabetes significantly downregulates Opa1 expression and that D-Opa1+/− exhibit further decrease in Opa1 expression. Graphical illustrations of cumulative data suggest reduced Opa1 levels in D-Opa1+/− mice promotes a diabetes-induced increase in (C) Bax levels and (D) caspase-3 activity. Data are expressed as mean ± SD. * p < 0.01, n = 6; ** p < 0.05, n = 6.

Figure 4.
Reduced Opa1 expression in diabetic Opa1+/− mouse retinas accelerates cytochrome c release. (A) Representative WB image shows cytochrome c levels in cytosolic and mitochondrial fractions in retinas of WT, diabetic (DM), Opa1+/−, and diabetic Opa1+/− (D-Opa1+/−) mice. (B) Graphical illustration of cumulative data shows diabetes and reduced Opa1 level significantly upregulate cytochrome c release, and that further reduction in Opa1 expression in retinas of D-Opa1+/− mice results in greater elevation in cytochrome c release. Data are expressed as mean ± SD. * p < 0.01, n = 6; ** p < 0.05, n = 6.

Figure 5.
Reduced Opa1 level exacerbates diabetes-induced apoptosis of vascular cells in retinal capillary networks. Representative images show TUNEL-positive cells (arrows) in retinal capillaries of (A) WT mice, (B) diabetic (DM) mice, (C) Opa1+/− mice, and (D) diabetic Opa1+/− mice (D-Opa1+/−). (E–H) Corresponding images of DAPI-stained cells in the retinal capillary networks, respectively. (I–L) Merged images show TUNEL-positive cells are superimposed with DAPI-stained cells; 20× magnification. Insets represent enlarged images of TUNEL-positive cells. (M) Graph representing cumulative data shows increased number of TUNEL-positive cells in retinal capillaries of diabetic mice compared with that of WT mice, while retinal capillary networks of D-Opa1+/− mice show a further increase in the number of TUNEL-positive cells compared with that of diabetic mice. Data are presented as mean ± SD. ** = p < 0.05, n = 6.

Figure 6.
Effects of diabetes or decreased Opa1 level on AC and PL development in mouse retinas. (A–D) Representative images of retinal capillaries from (A) WT, (B) DM, (C) Opa1+/−, and (D) D-Opa1+/− mice show an increased number of AC (blue arrows) and PL (red arrows) in the diabetic mouse retina compared with those of the control mouse retina; 40× magnification. Importantly, the number of AC and PL is increased in retinas of D-Opa1+/− mice compared with that of diabetic mice. Graphical illustrations of cumulative data show reduced Opa1 levels in the D-Opa1+/− mouse retina exacerbates the development of (E) AC and (F) PL. Data are expressed as mean ± SD. * = p < 0.01, n = 12; ** = p < 0.05, n = 12.

Publisher’s Note: MDPI stays neutral with regard to jurisdictional claims in published maps and institutional affiliations. |
© 2021 by the authors. Licensee MDPI, Basel, Switzerland. This article is an open access article distributed under the terms and conditions of the Creative Commons Attribution (CC BY) license (https://creativecommons.org/licenses/by/4.0/).
Share and Cite
MDPI and ACS Style
Kim, D.; Votruba, M.; Roy, S. Opa1 Deficiency Promotes Development of Retinal Vascular Lesions in Diabetic Retinopathy. Int. J. Mol. Sci. 2021, 22, 5928. https://doi.org/10.3390/ijms22115928
AMA Style
Kim D, Votruba M, Roy S. Opa1 Deficiency Promotes Development of Retinal Vascular Lesions in Diabetic Retinopathy. International Journal of Molecular Sciences. 2021; 22(11):5928. https://doi.org/10.3390/ijms22115928
Chicago/Turabian StyleKim, Dongjoon, Marcela Votruba, and Sayon Roy. 2021. "Opa1 Deficiency Promotes Development of Retinal Vascular Lesions in Diabetic Retinopathy" International Journal of Molecular Sciences 22, no. 11: 5928. https://doi.org/10.3390/ijms22115928
Note that from the first issue of 2016, this journal uses article numbers instead of page numbers. See further details here.