
A Pilot Study of Changes in the Level of Catecholamines and the Activity of α-2-Macroglobulin in the Tear Fluid of Patients with Parkinson’s Disease and Parkinsonian Mice

 ,
,
Abstract
: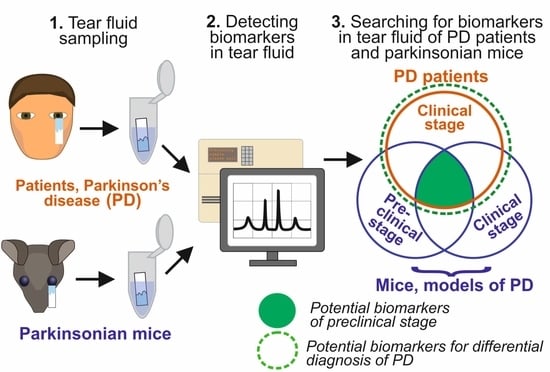
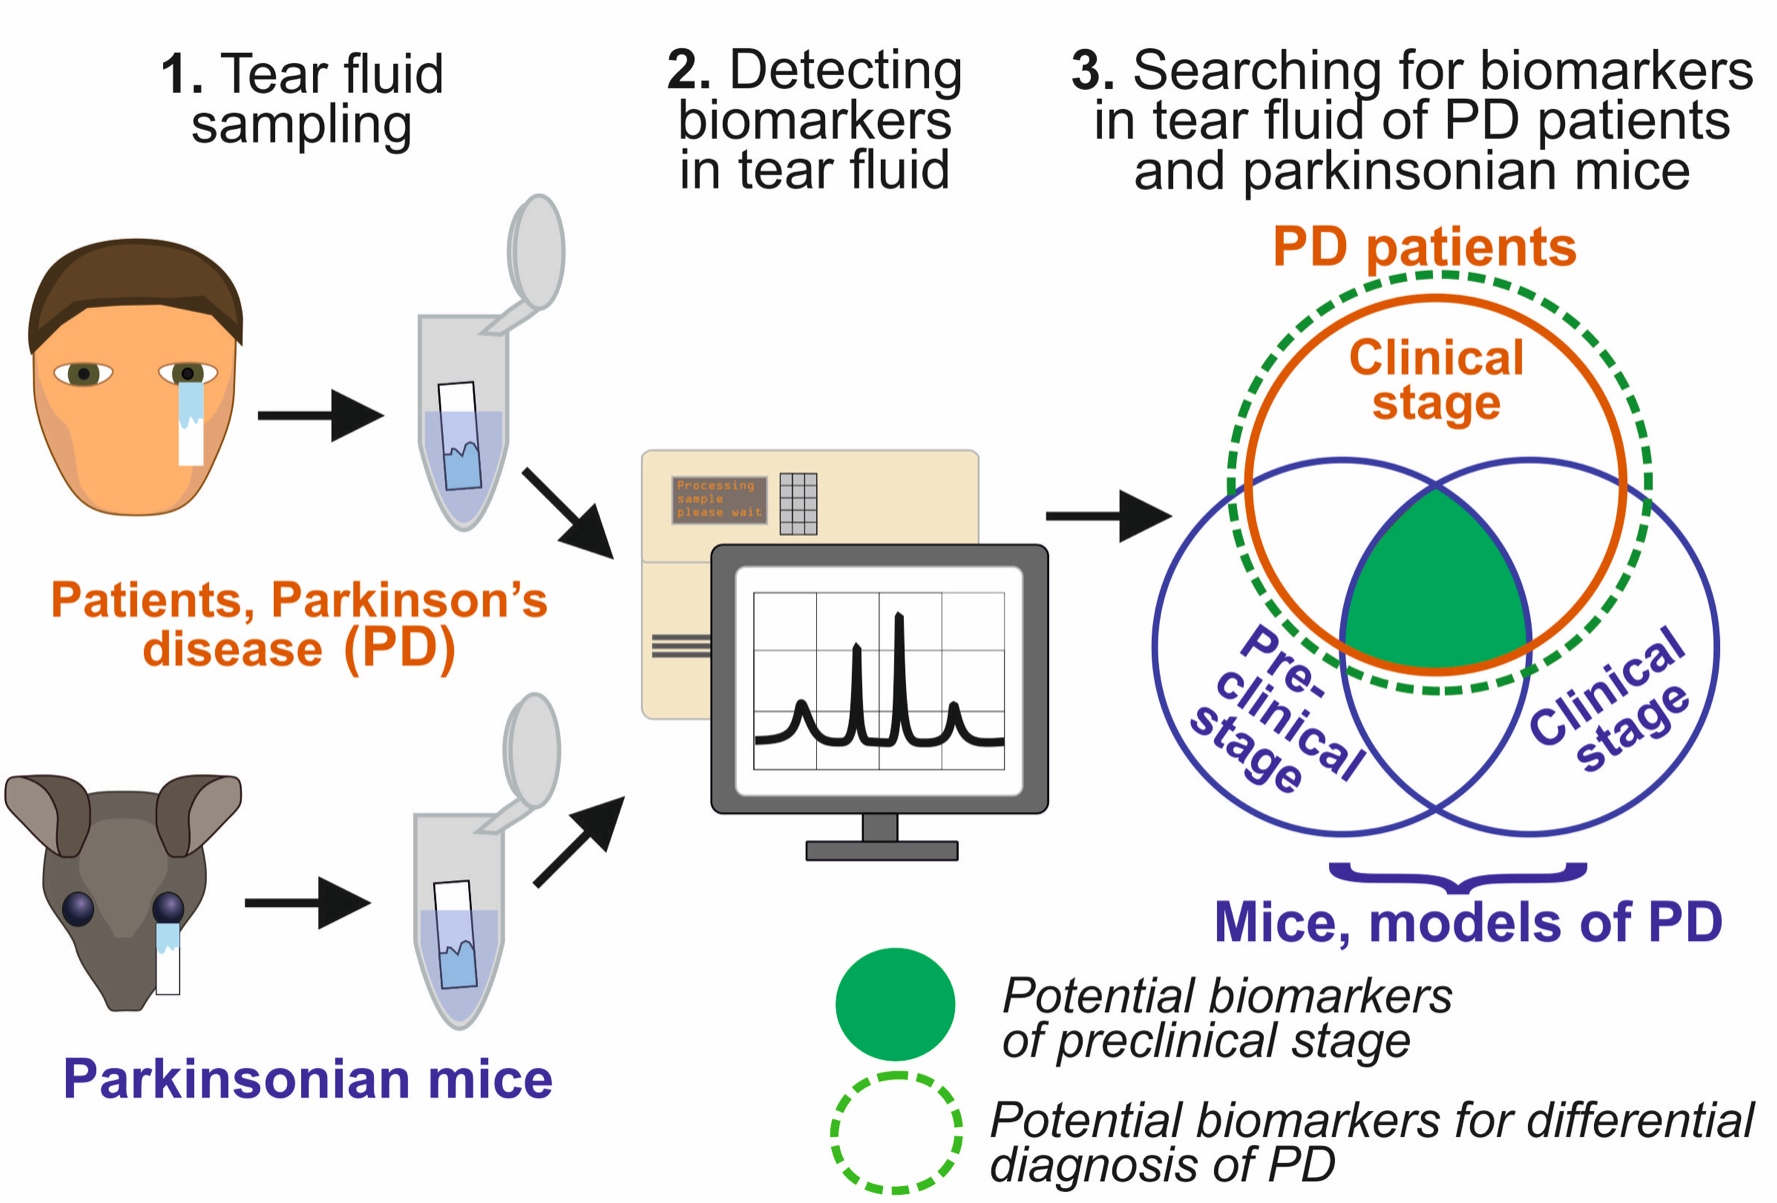
1. Introduction
2. Results
2.1. Clinical and Ophtalmological Characteristics of PD Patients and Control Subjects
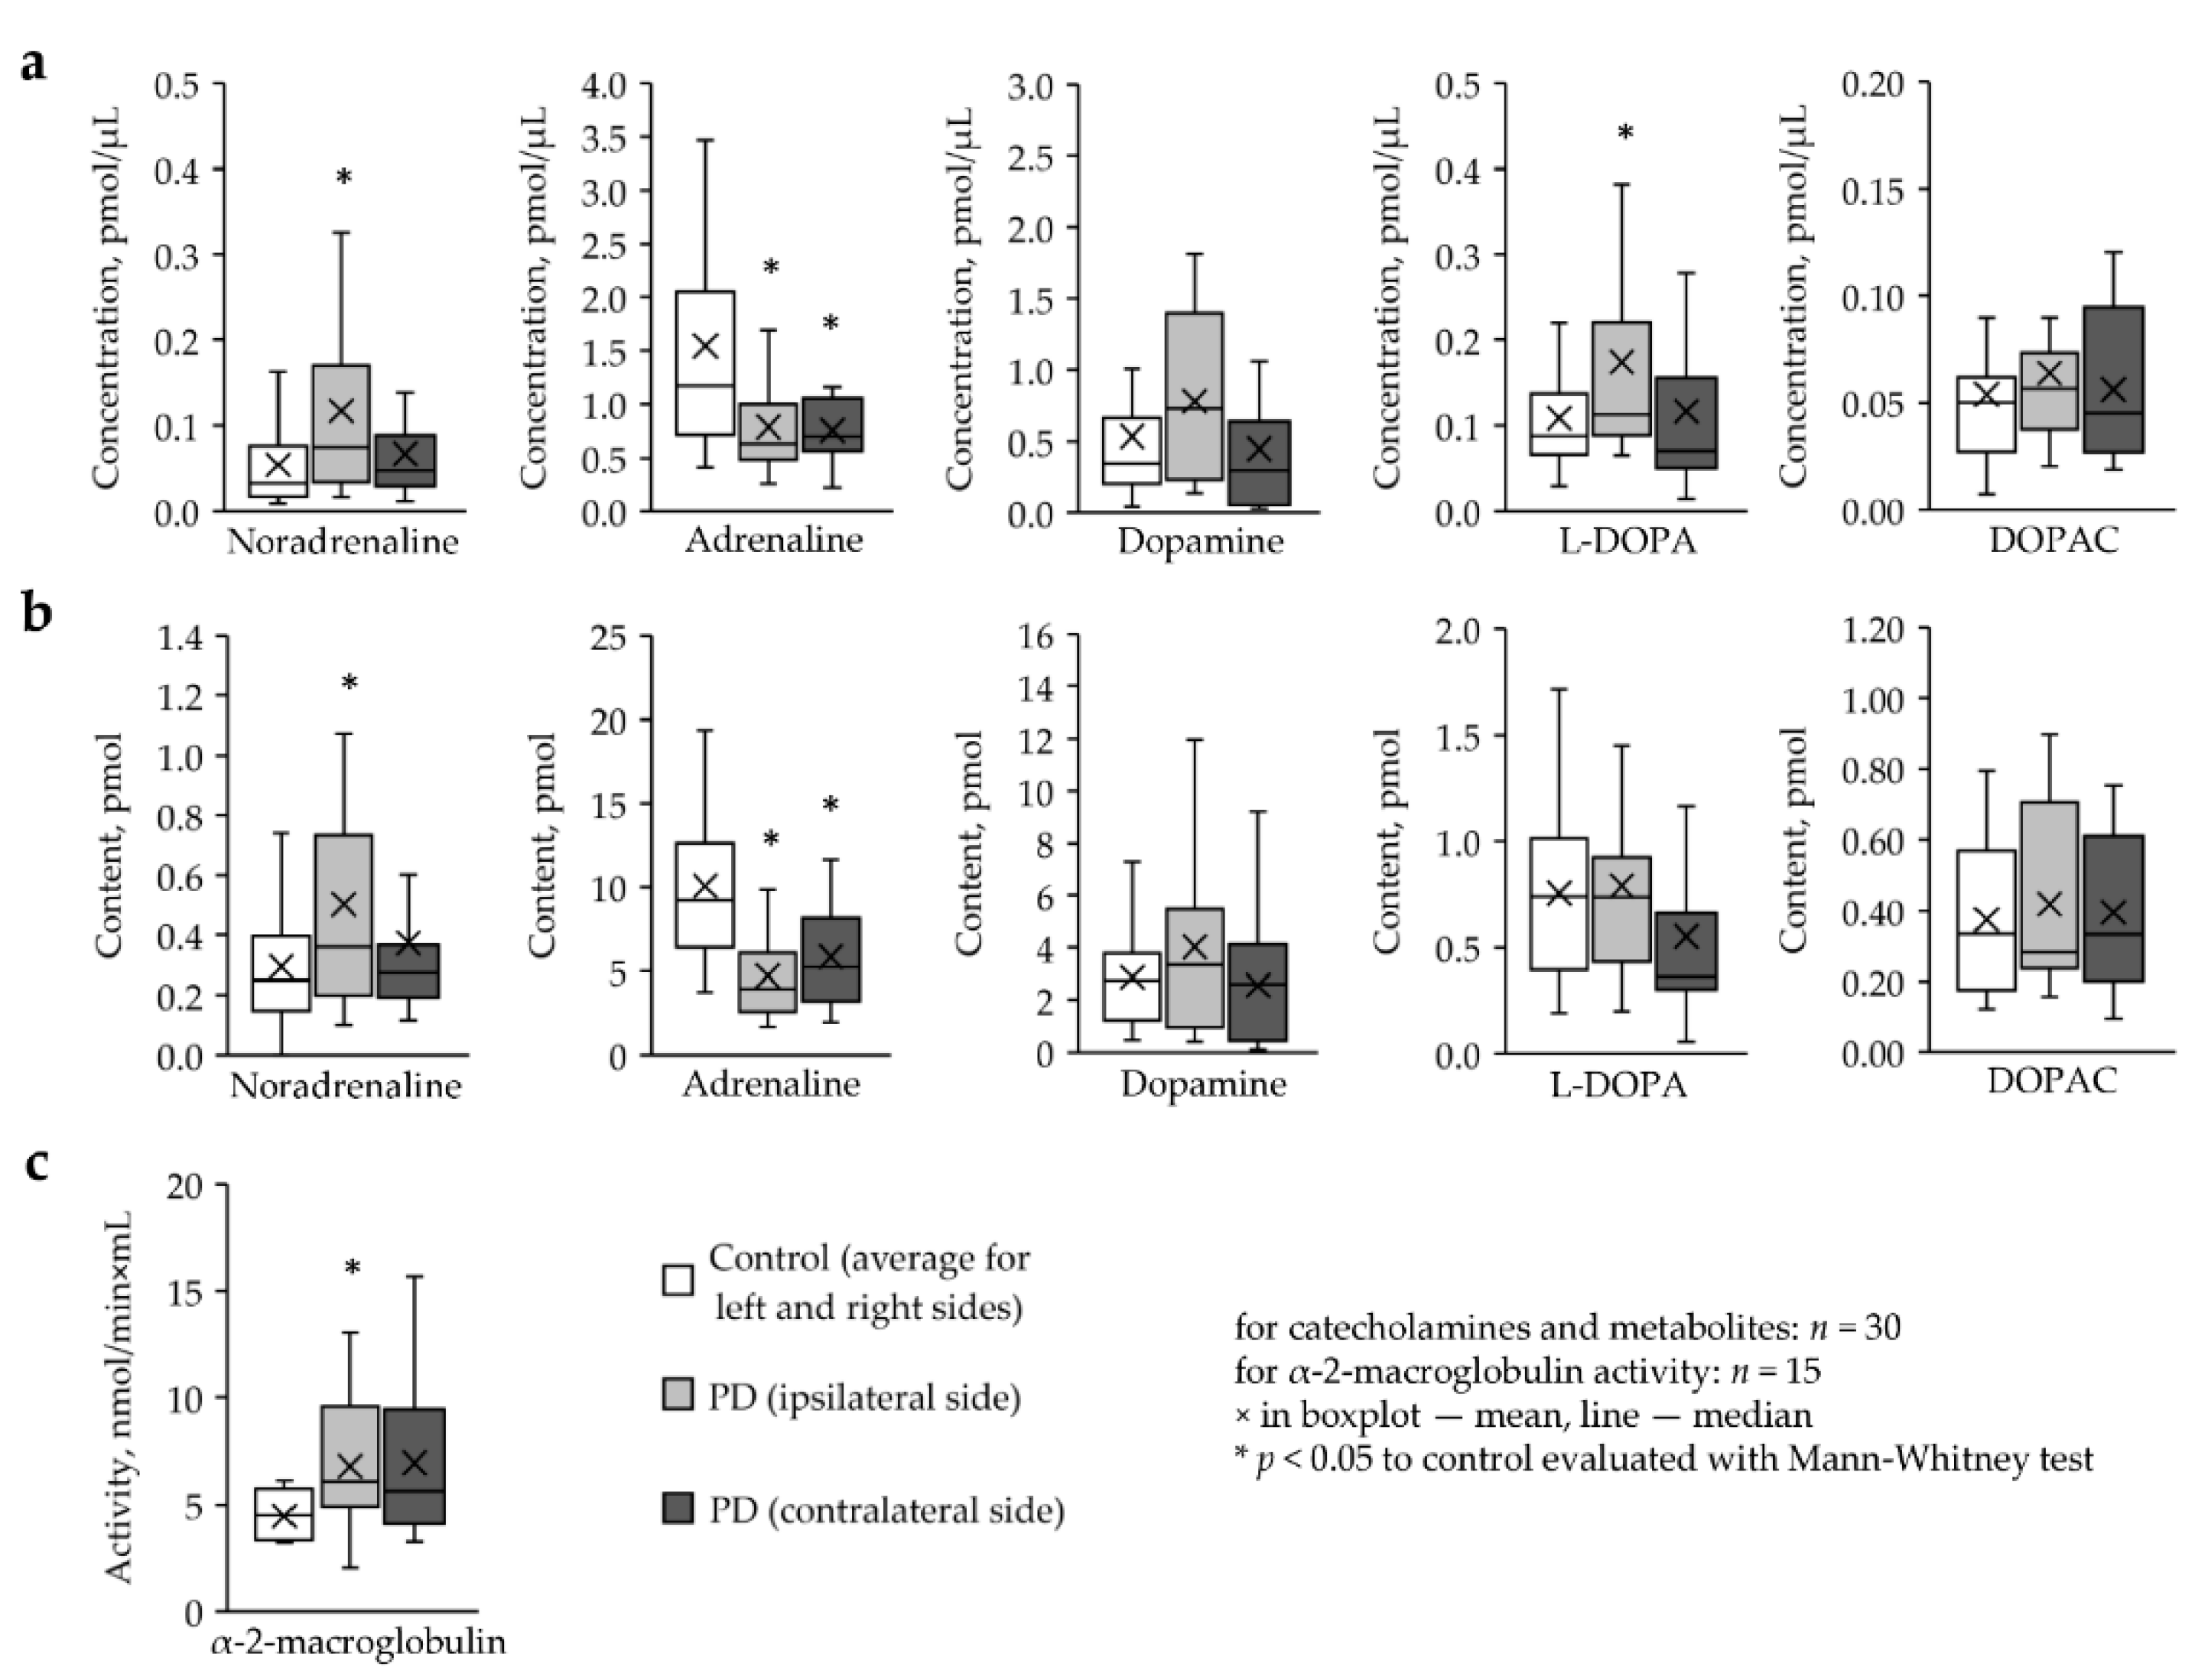
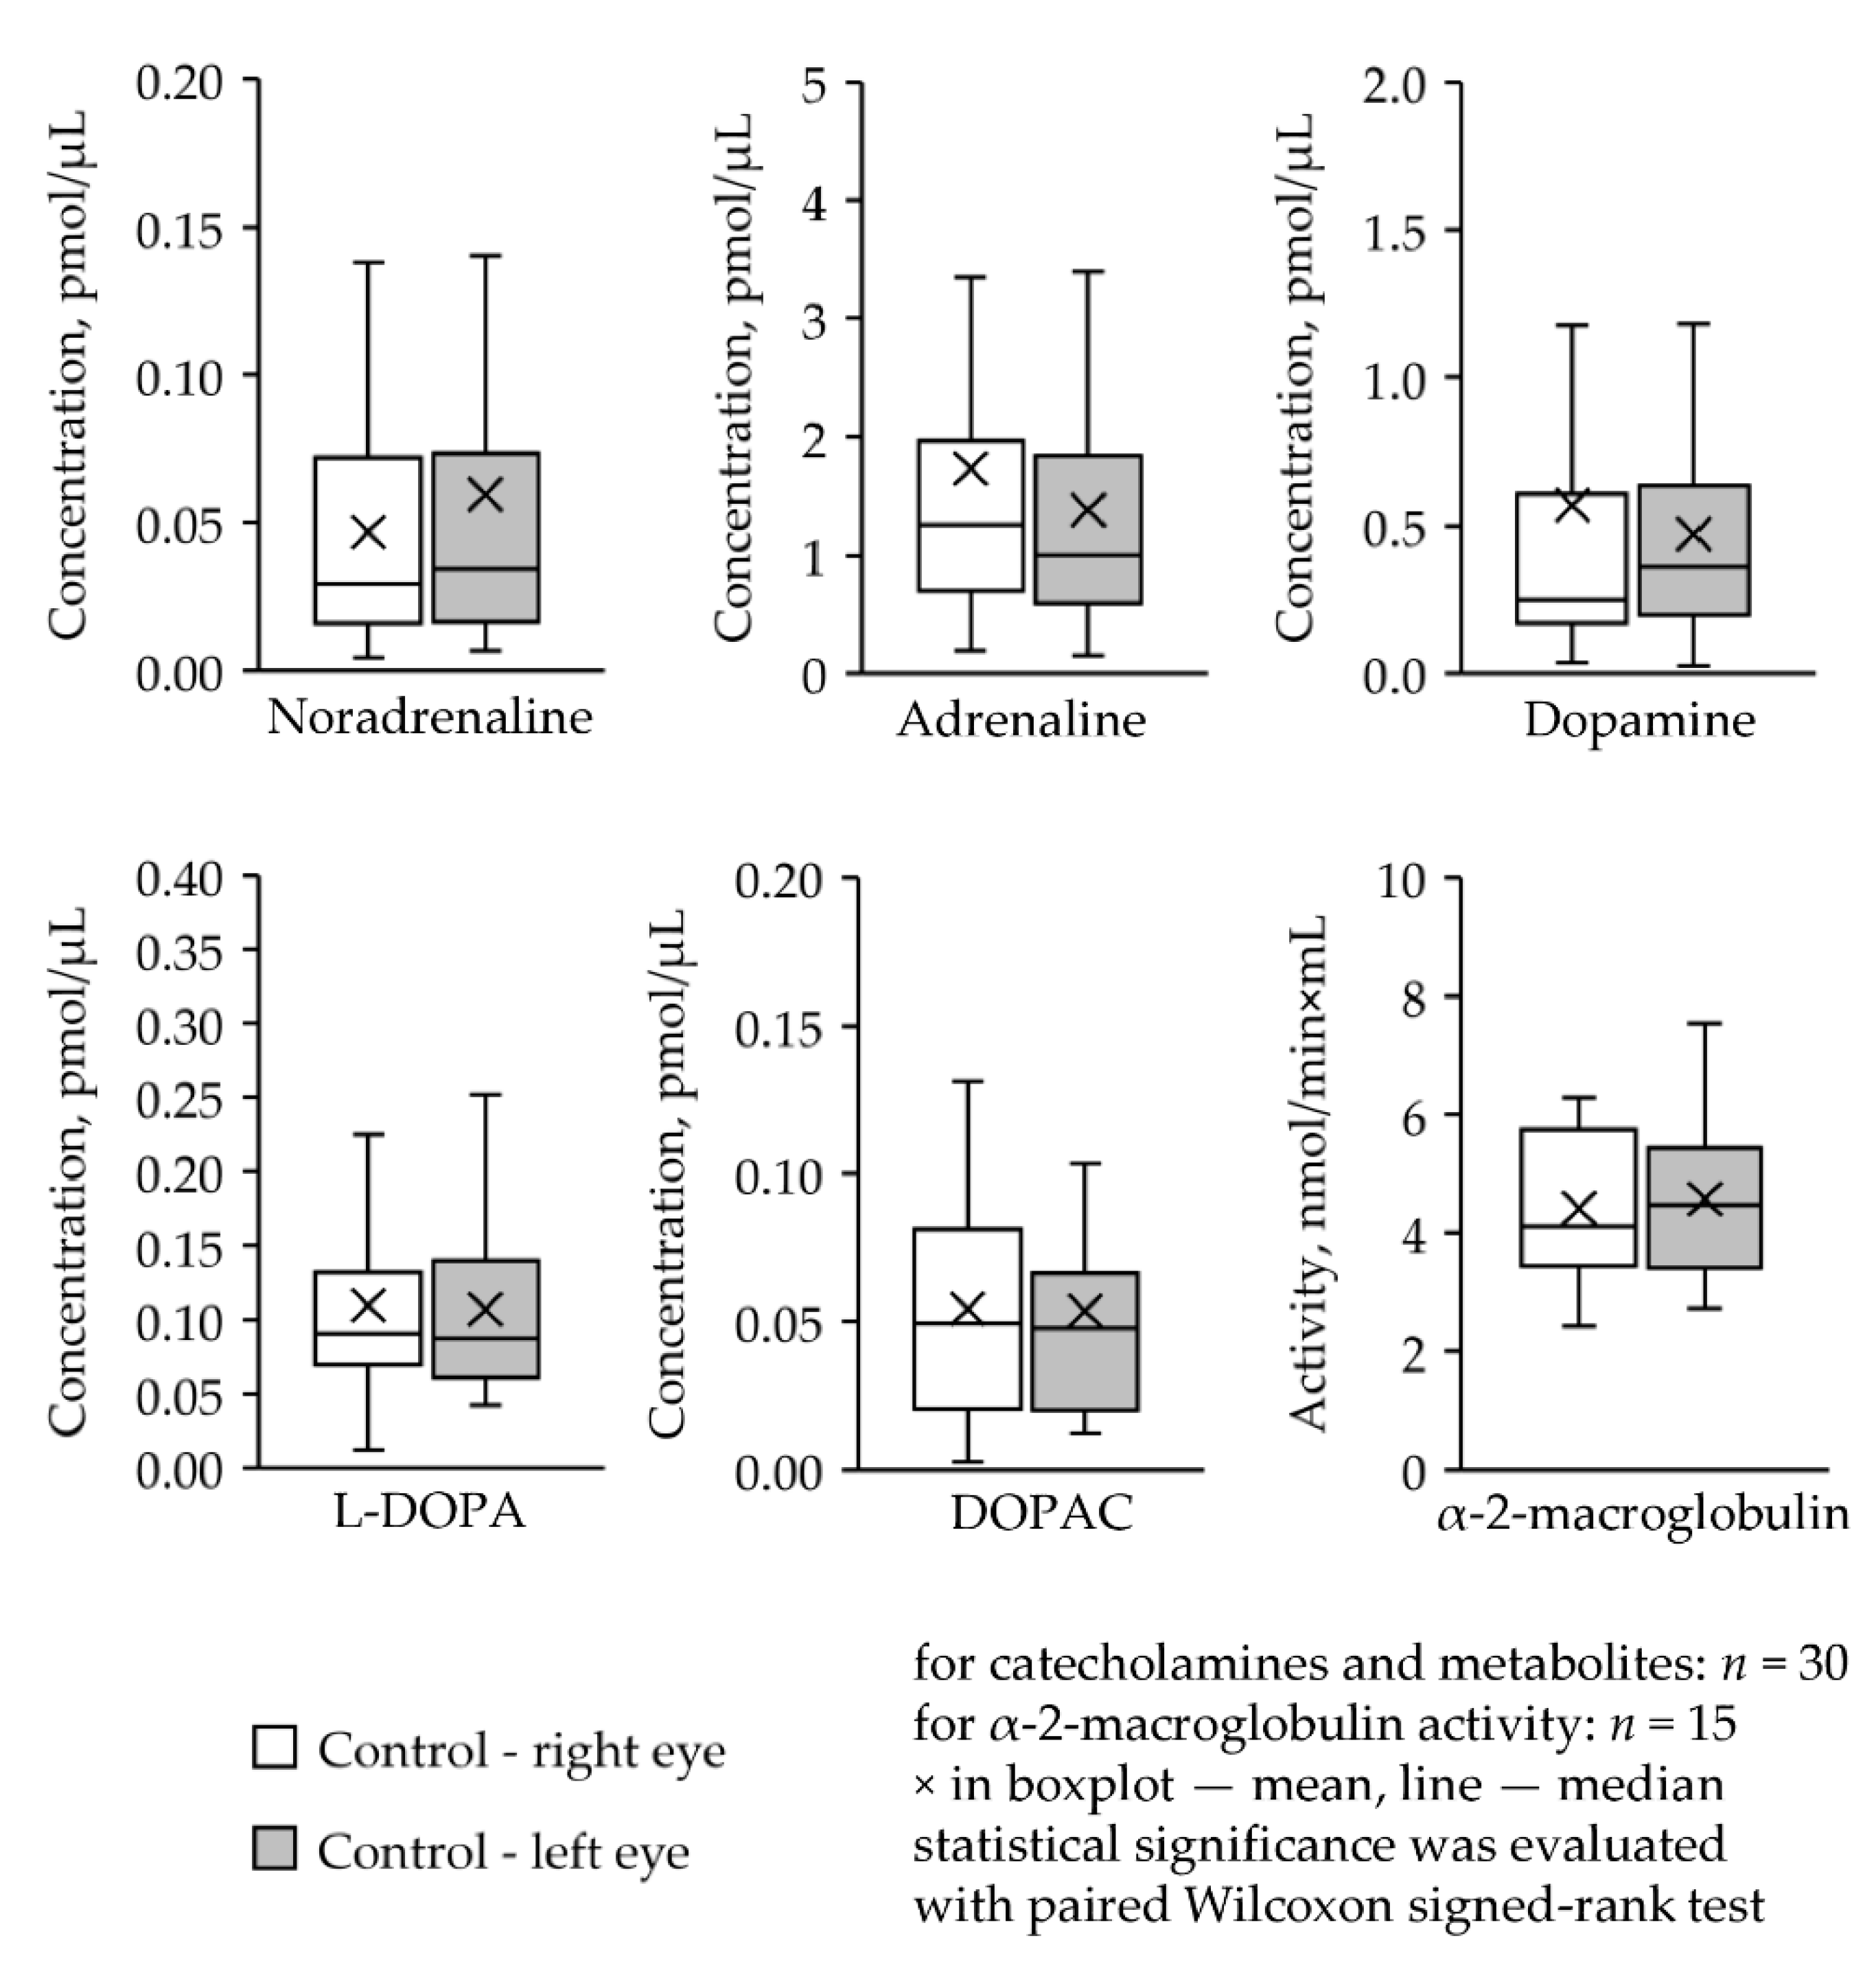
2.2. Quantification of Catecholamines and Metabolites and Activity of α-2-Macroglobulin in the Tear Fluid in PD Patients and the Control Group
2.3. Comparison of Gender Differences in Biomarkers in the Tear Fluid of PD Patients and Controls and Correlation Analysis with the Severity of Disease
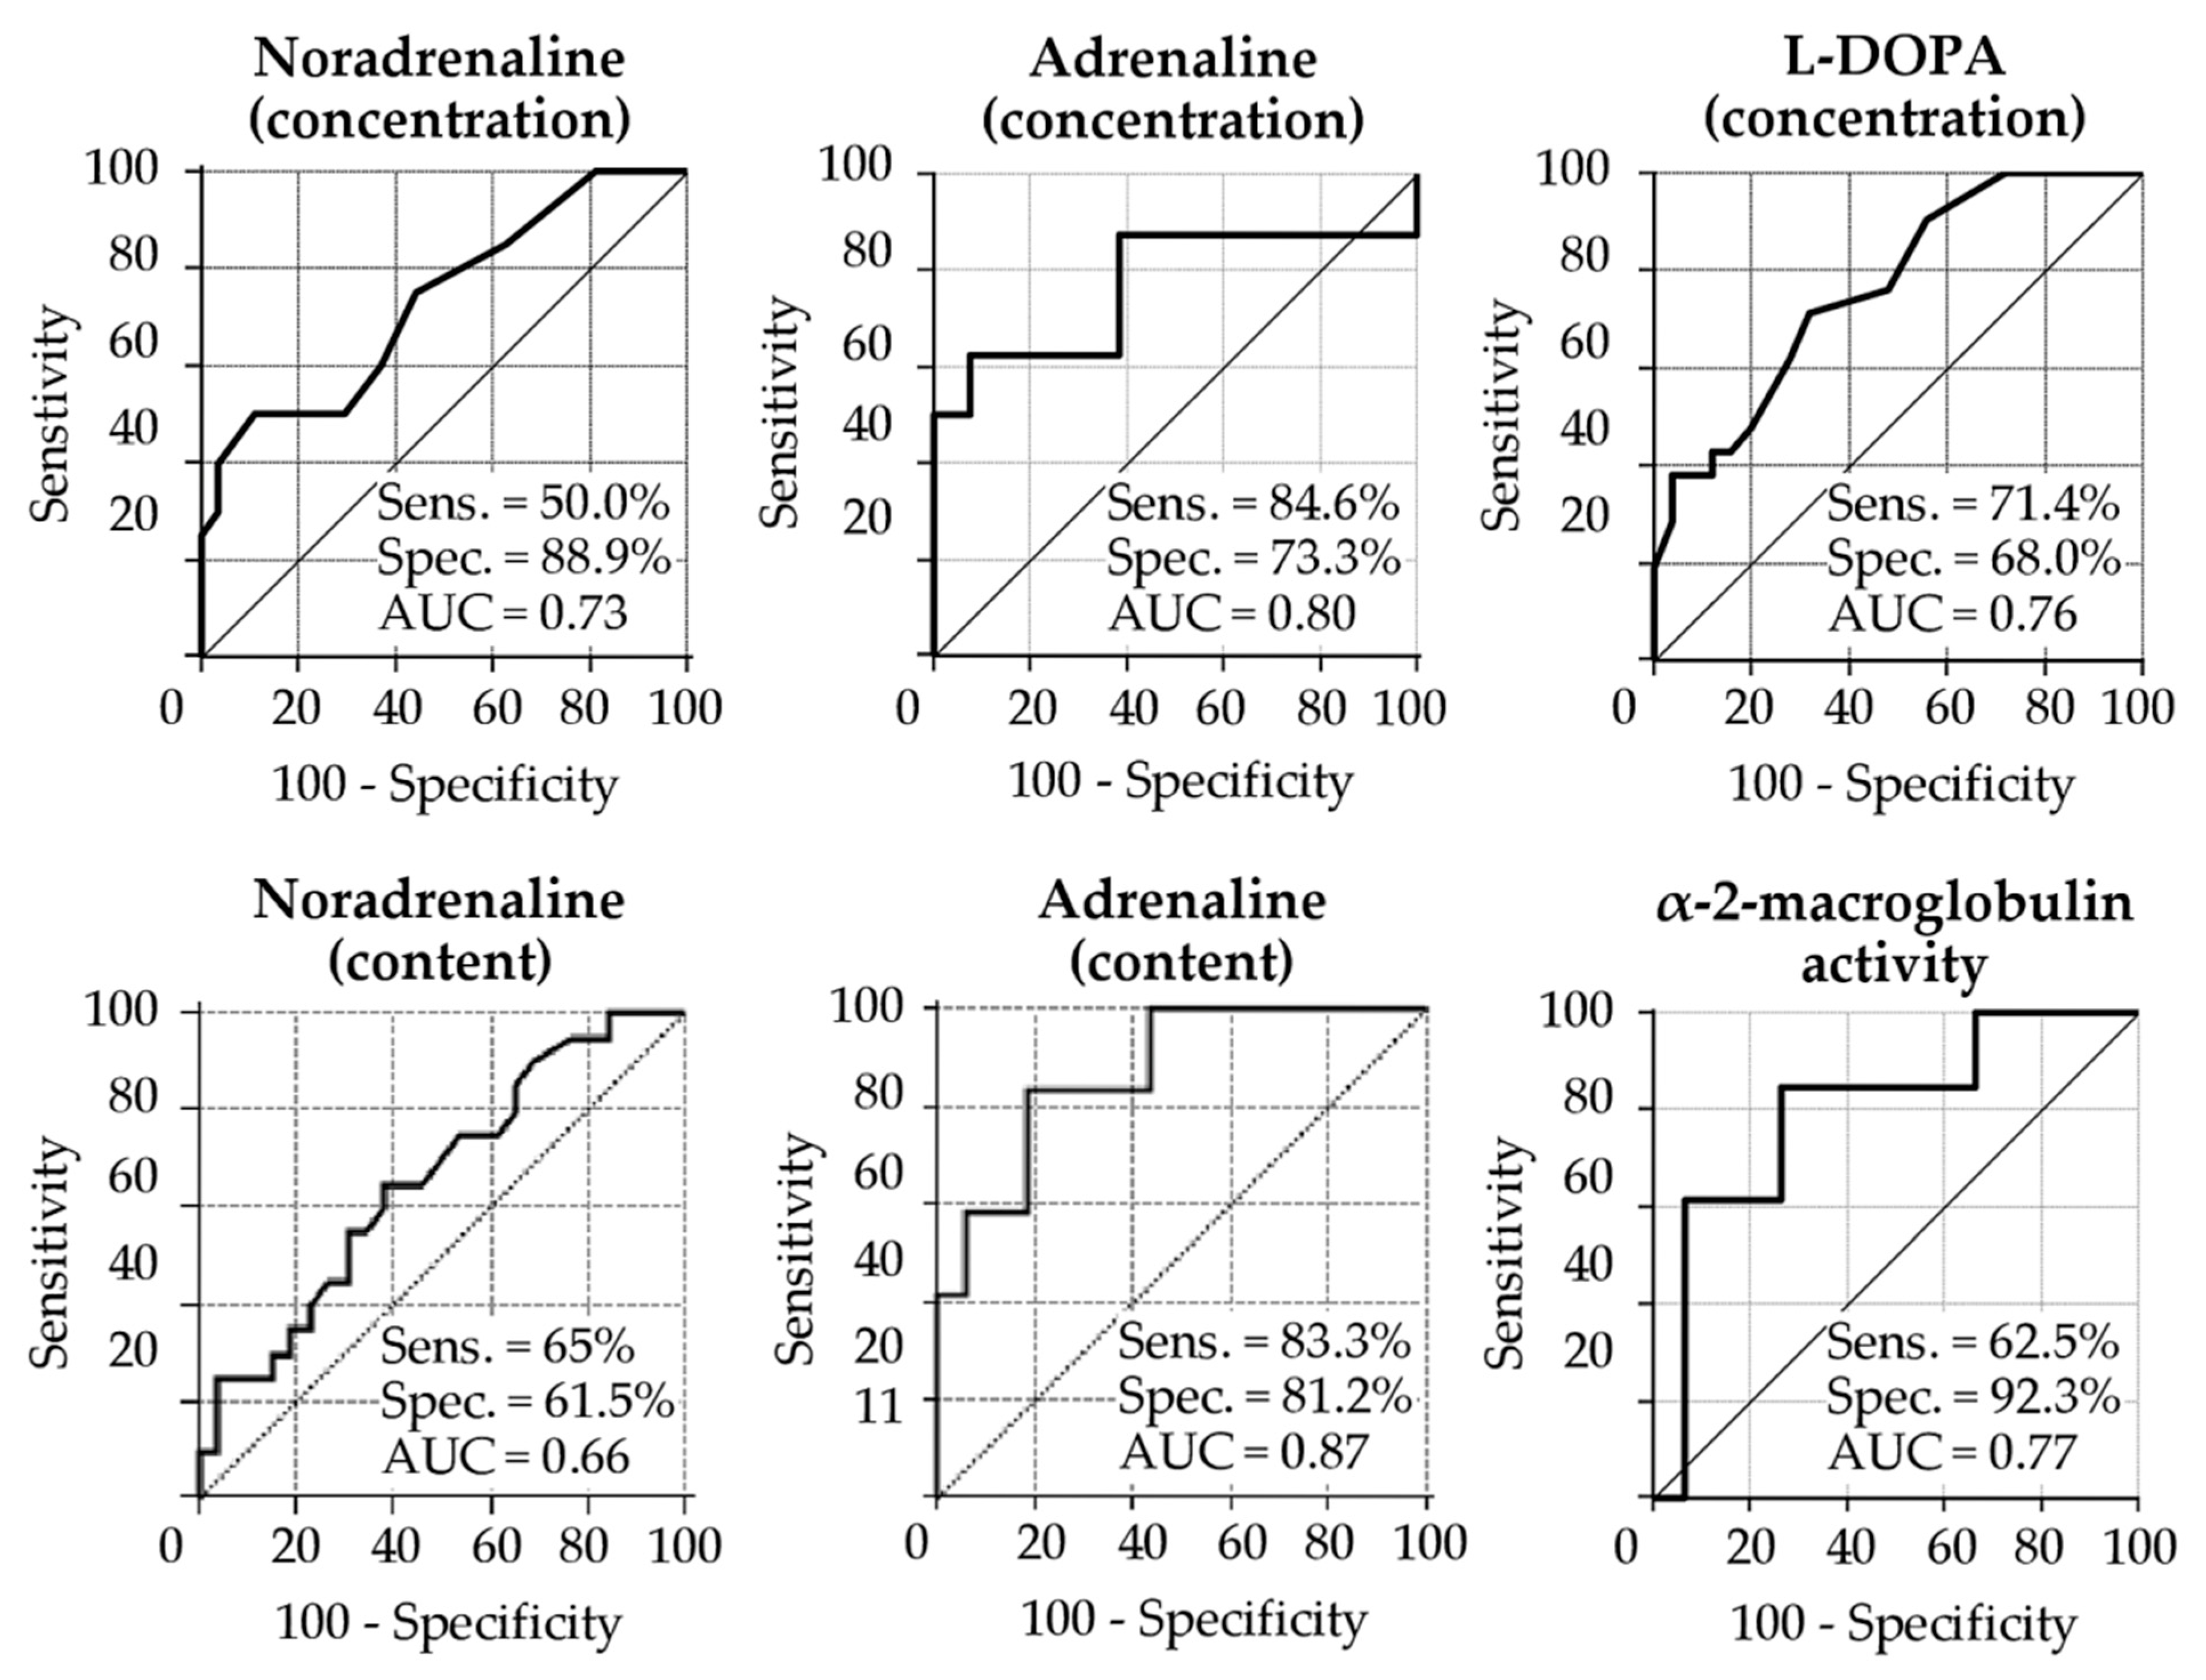
2.4. ROC Analysis of Biomarkers in the Tear Fluid in PD Patients and Control Subjects
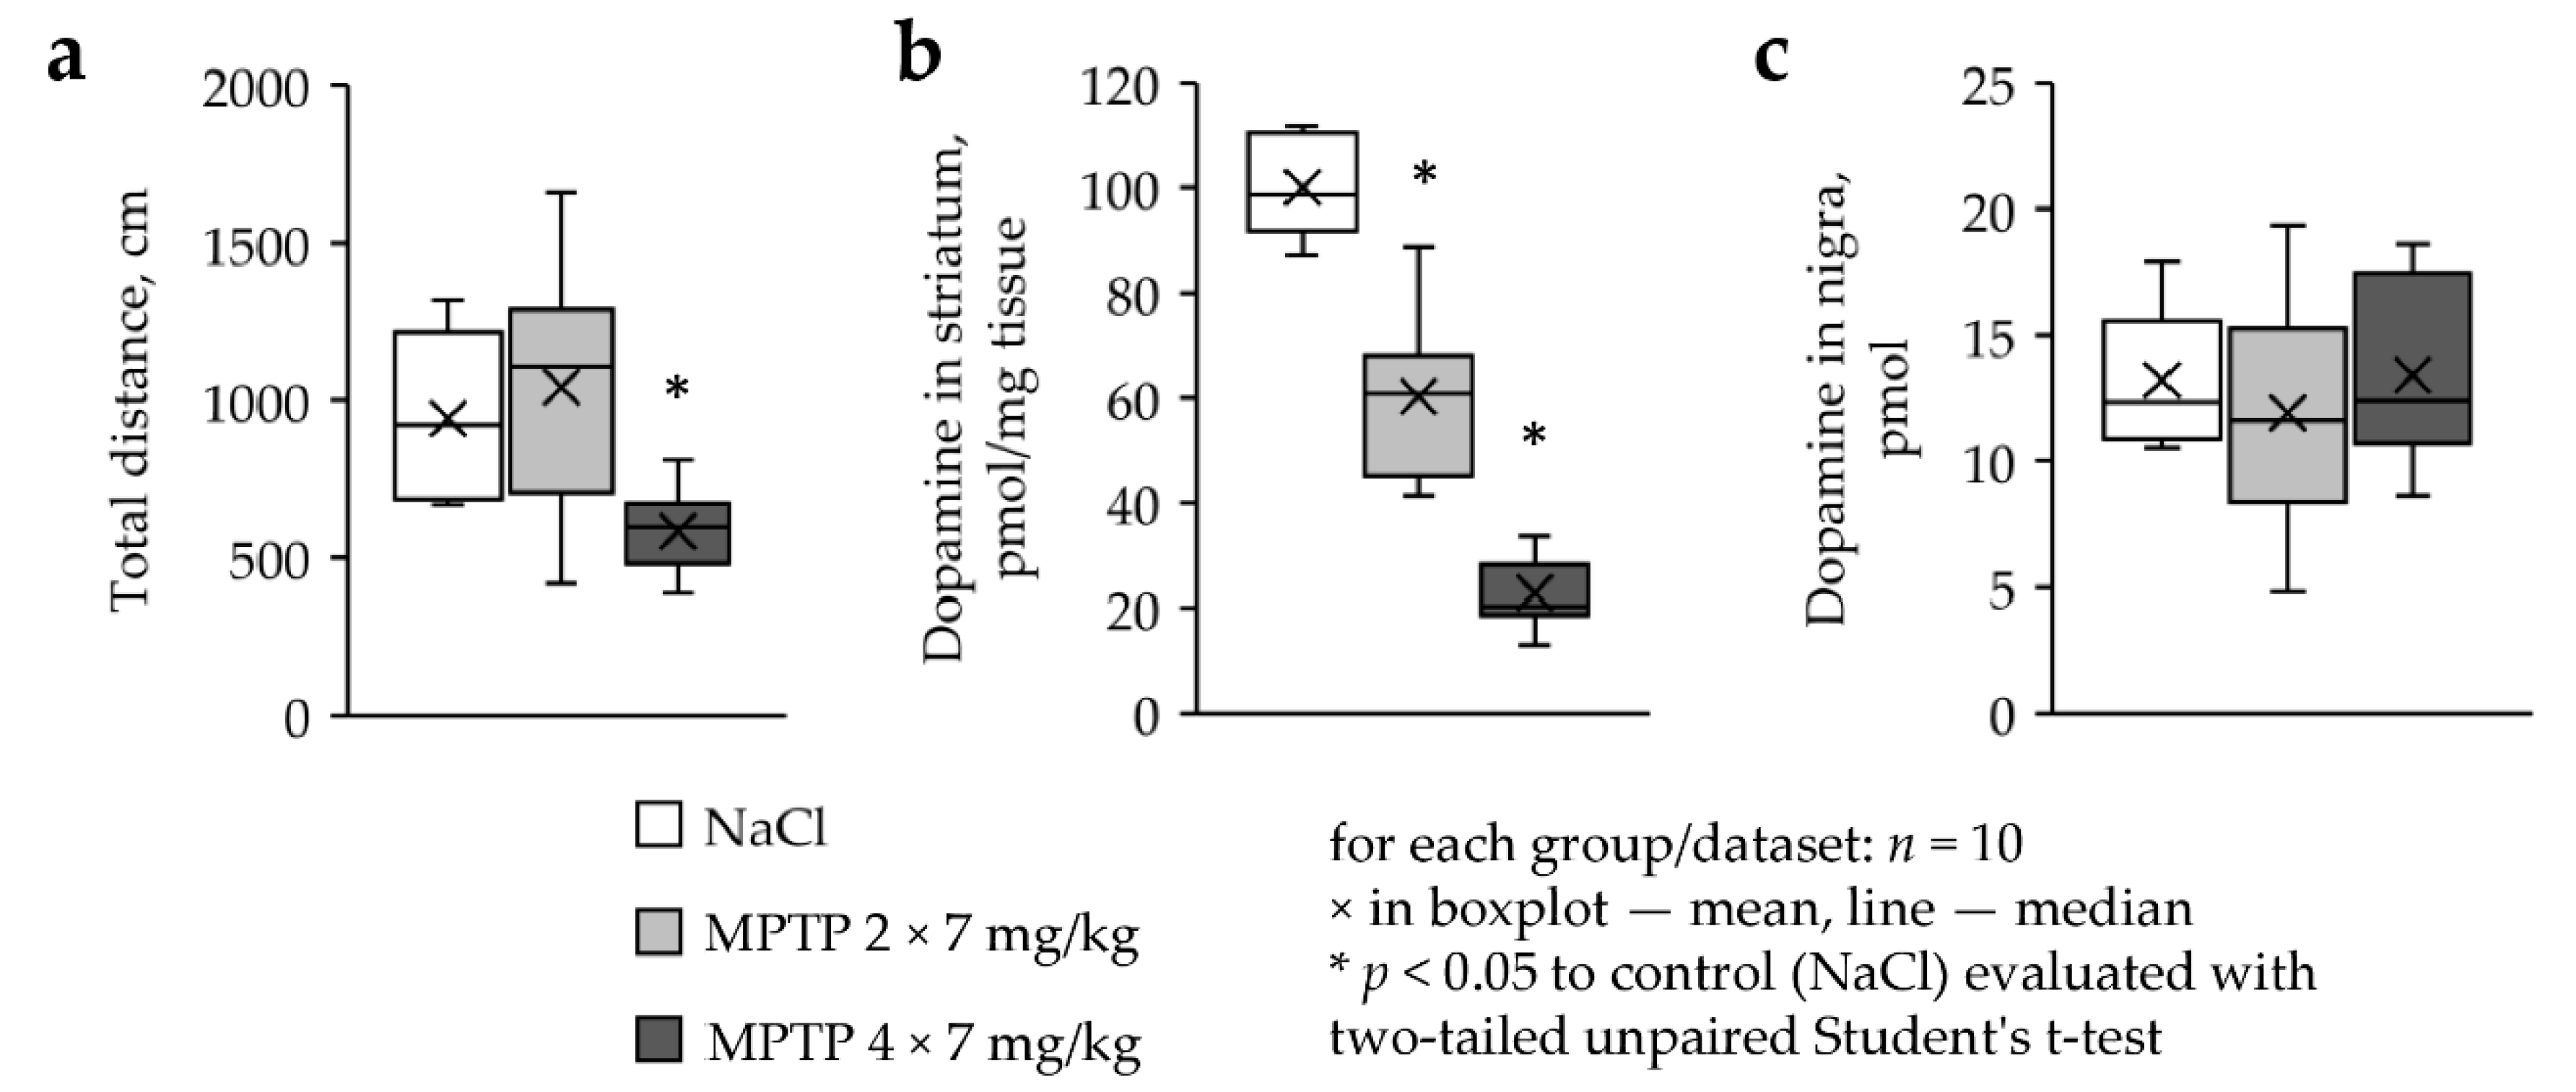
2.5. Motor Behavior and Dopamine Levels in the Nigrostriatal System in MPTP-Treated and Control Mice
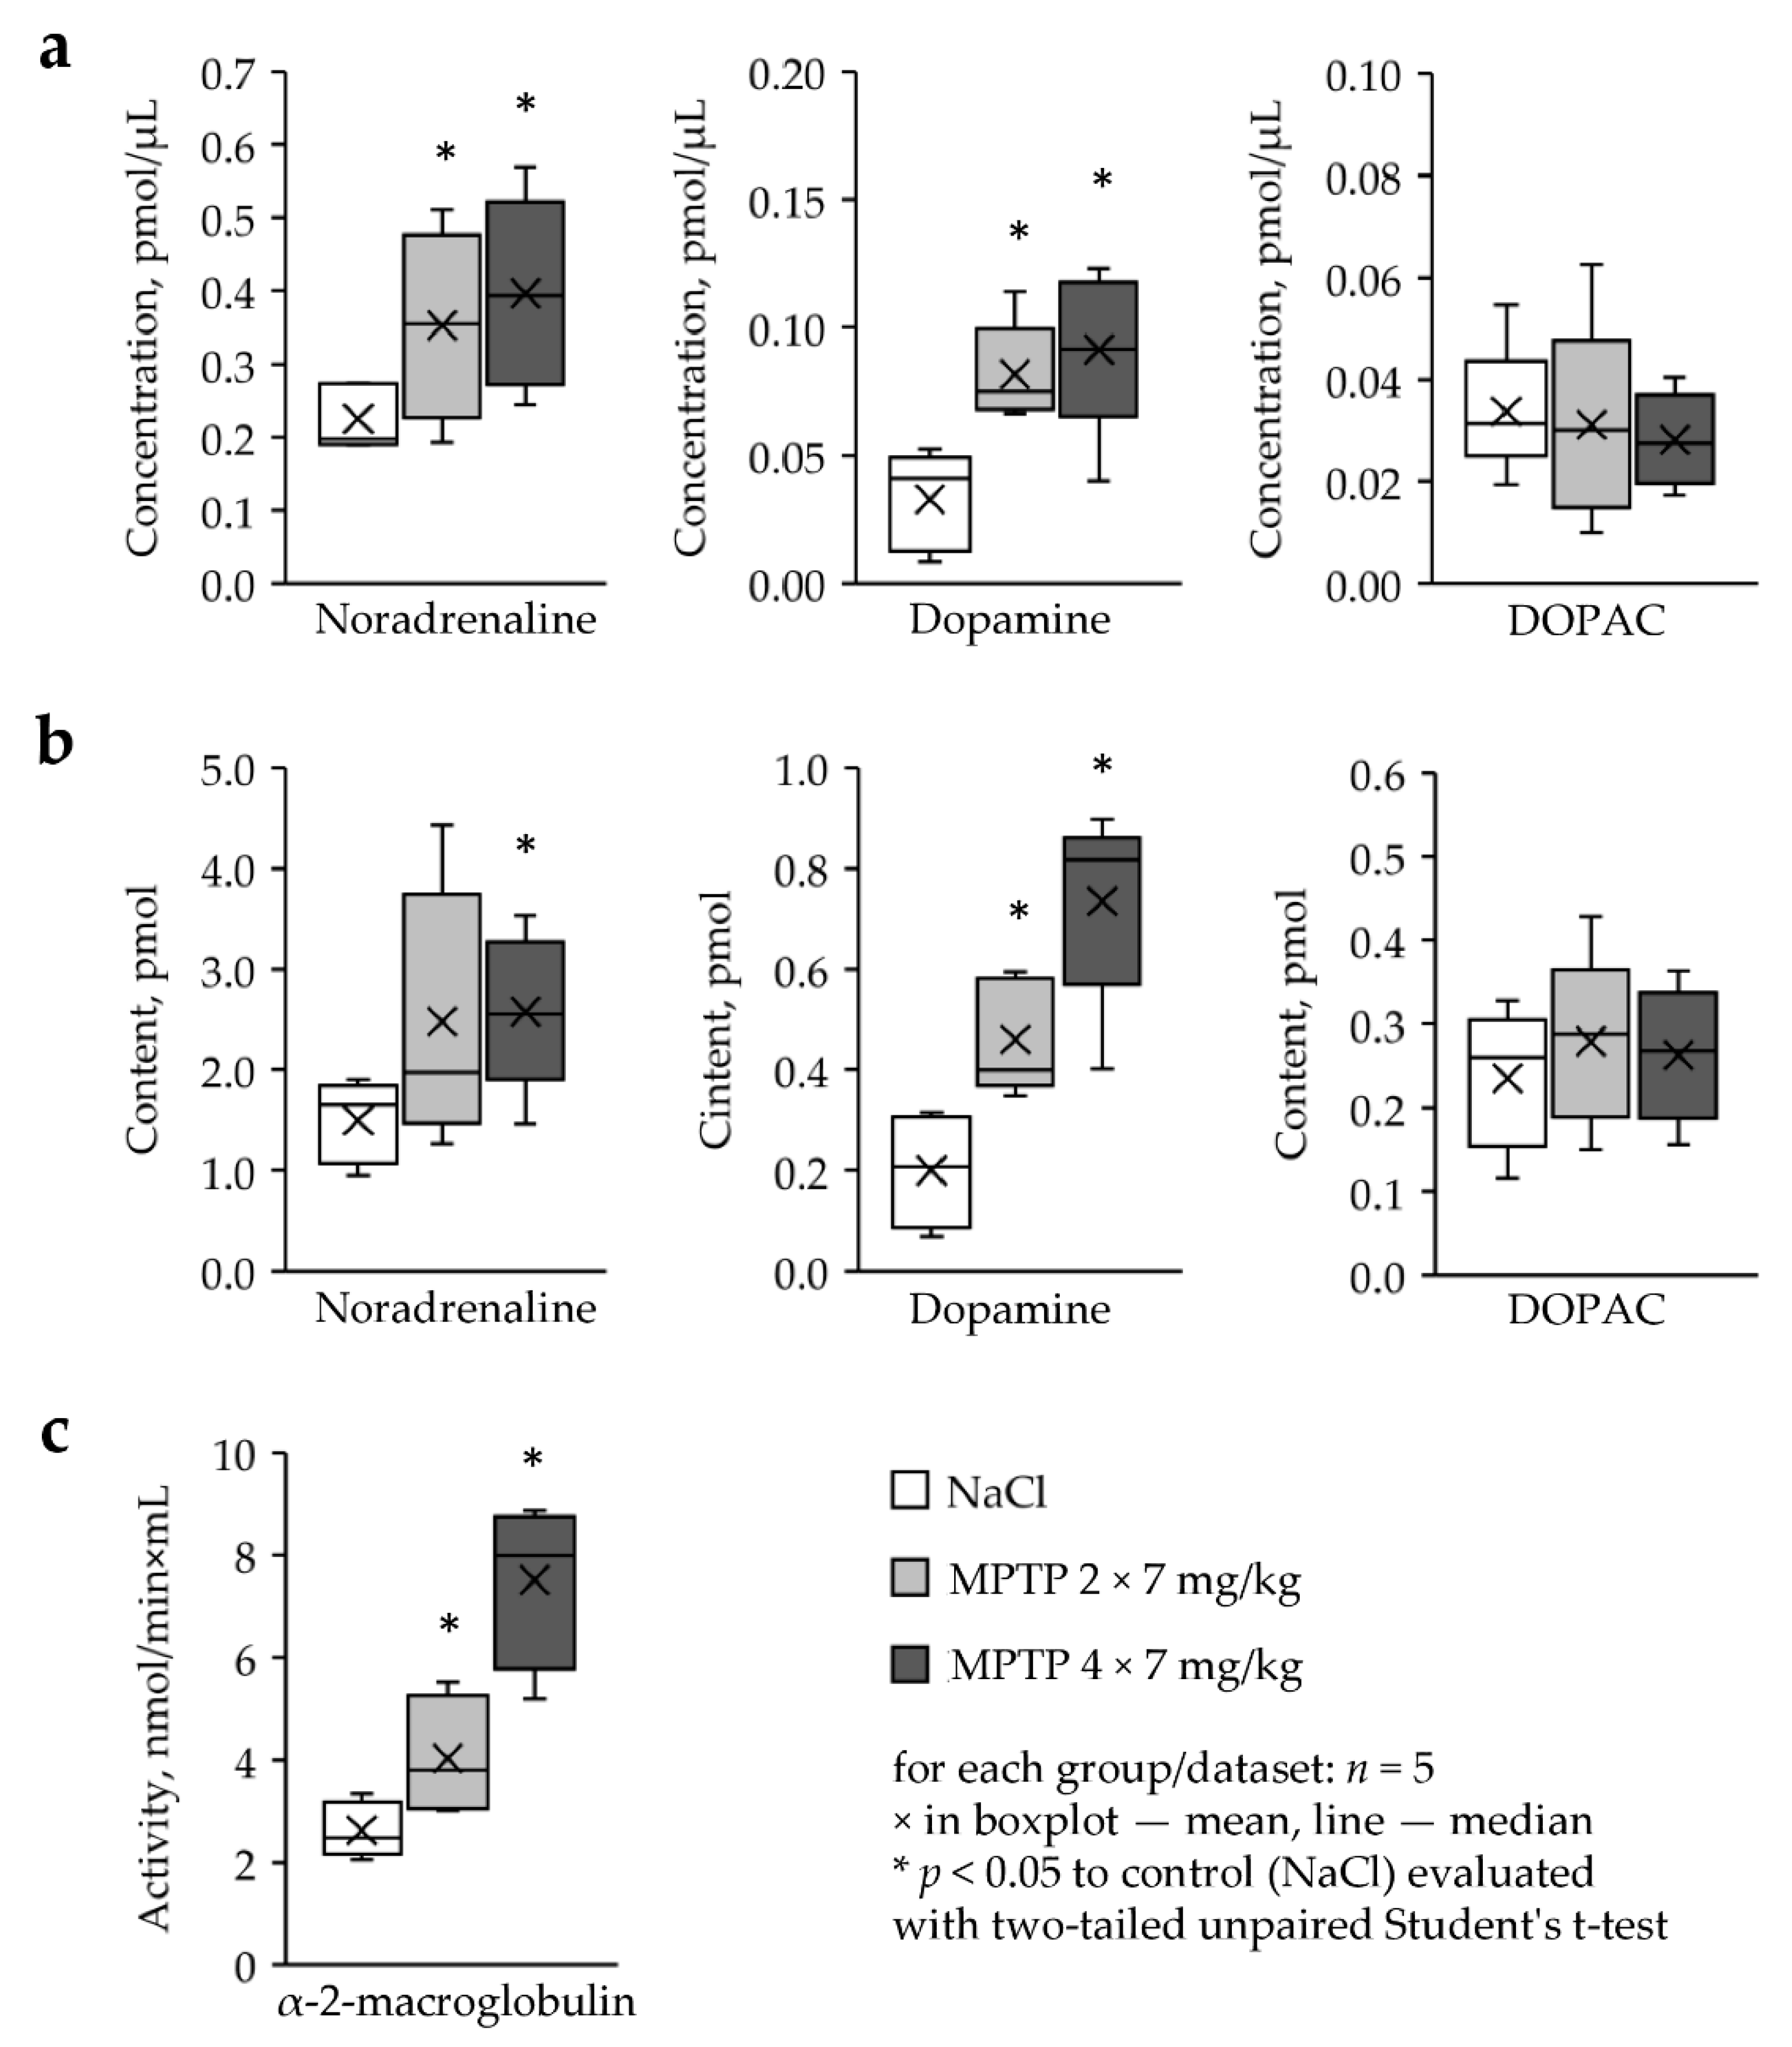
2.6. Concentration and Content of Catecholamines and Metabolites, as well as the Activity of α-2-Macroglobulin in the Tear Fluid in MPTP-Treated and Control Mice
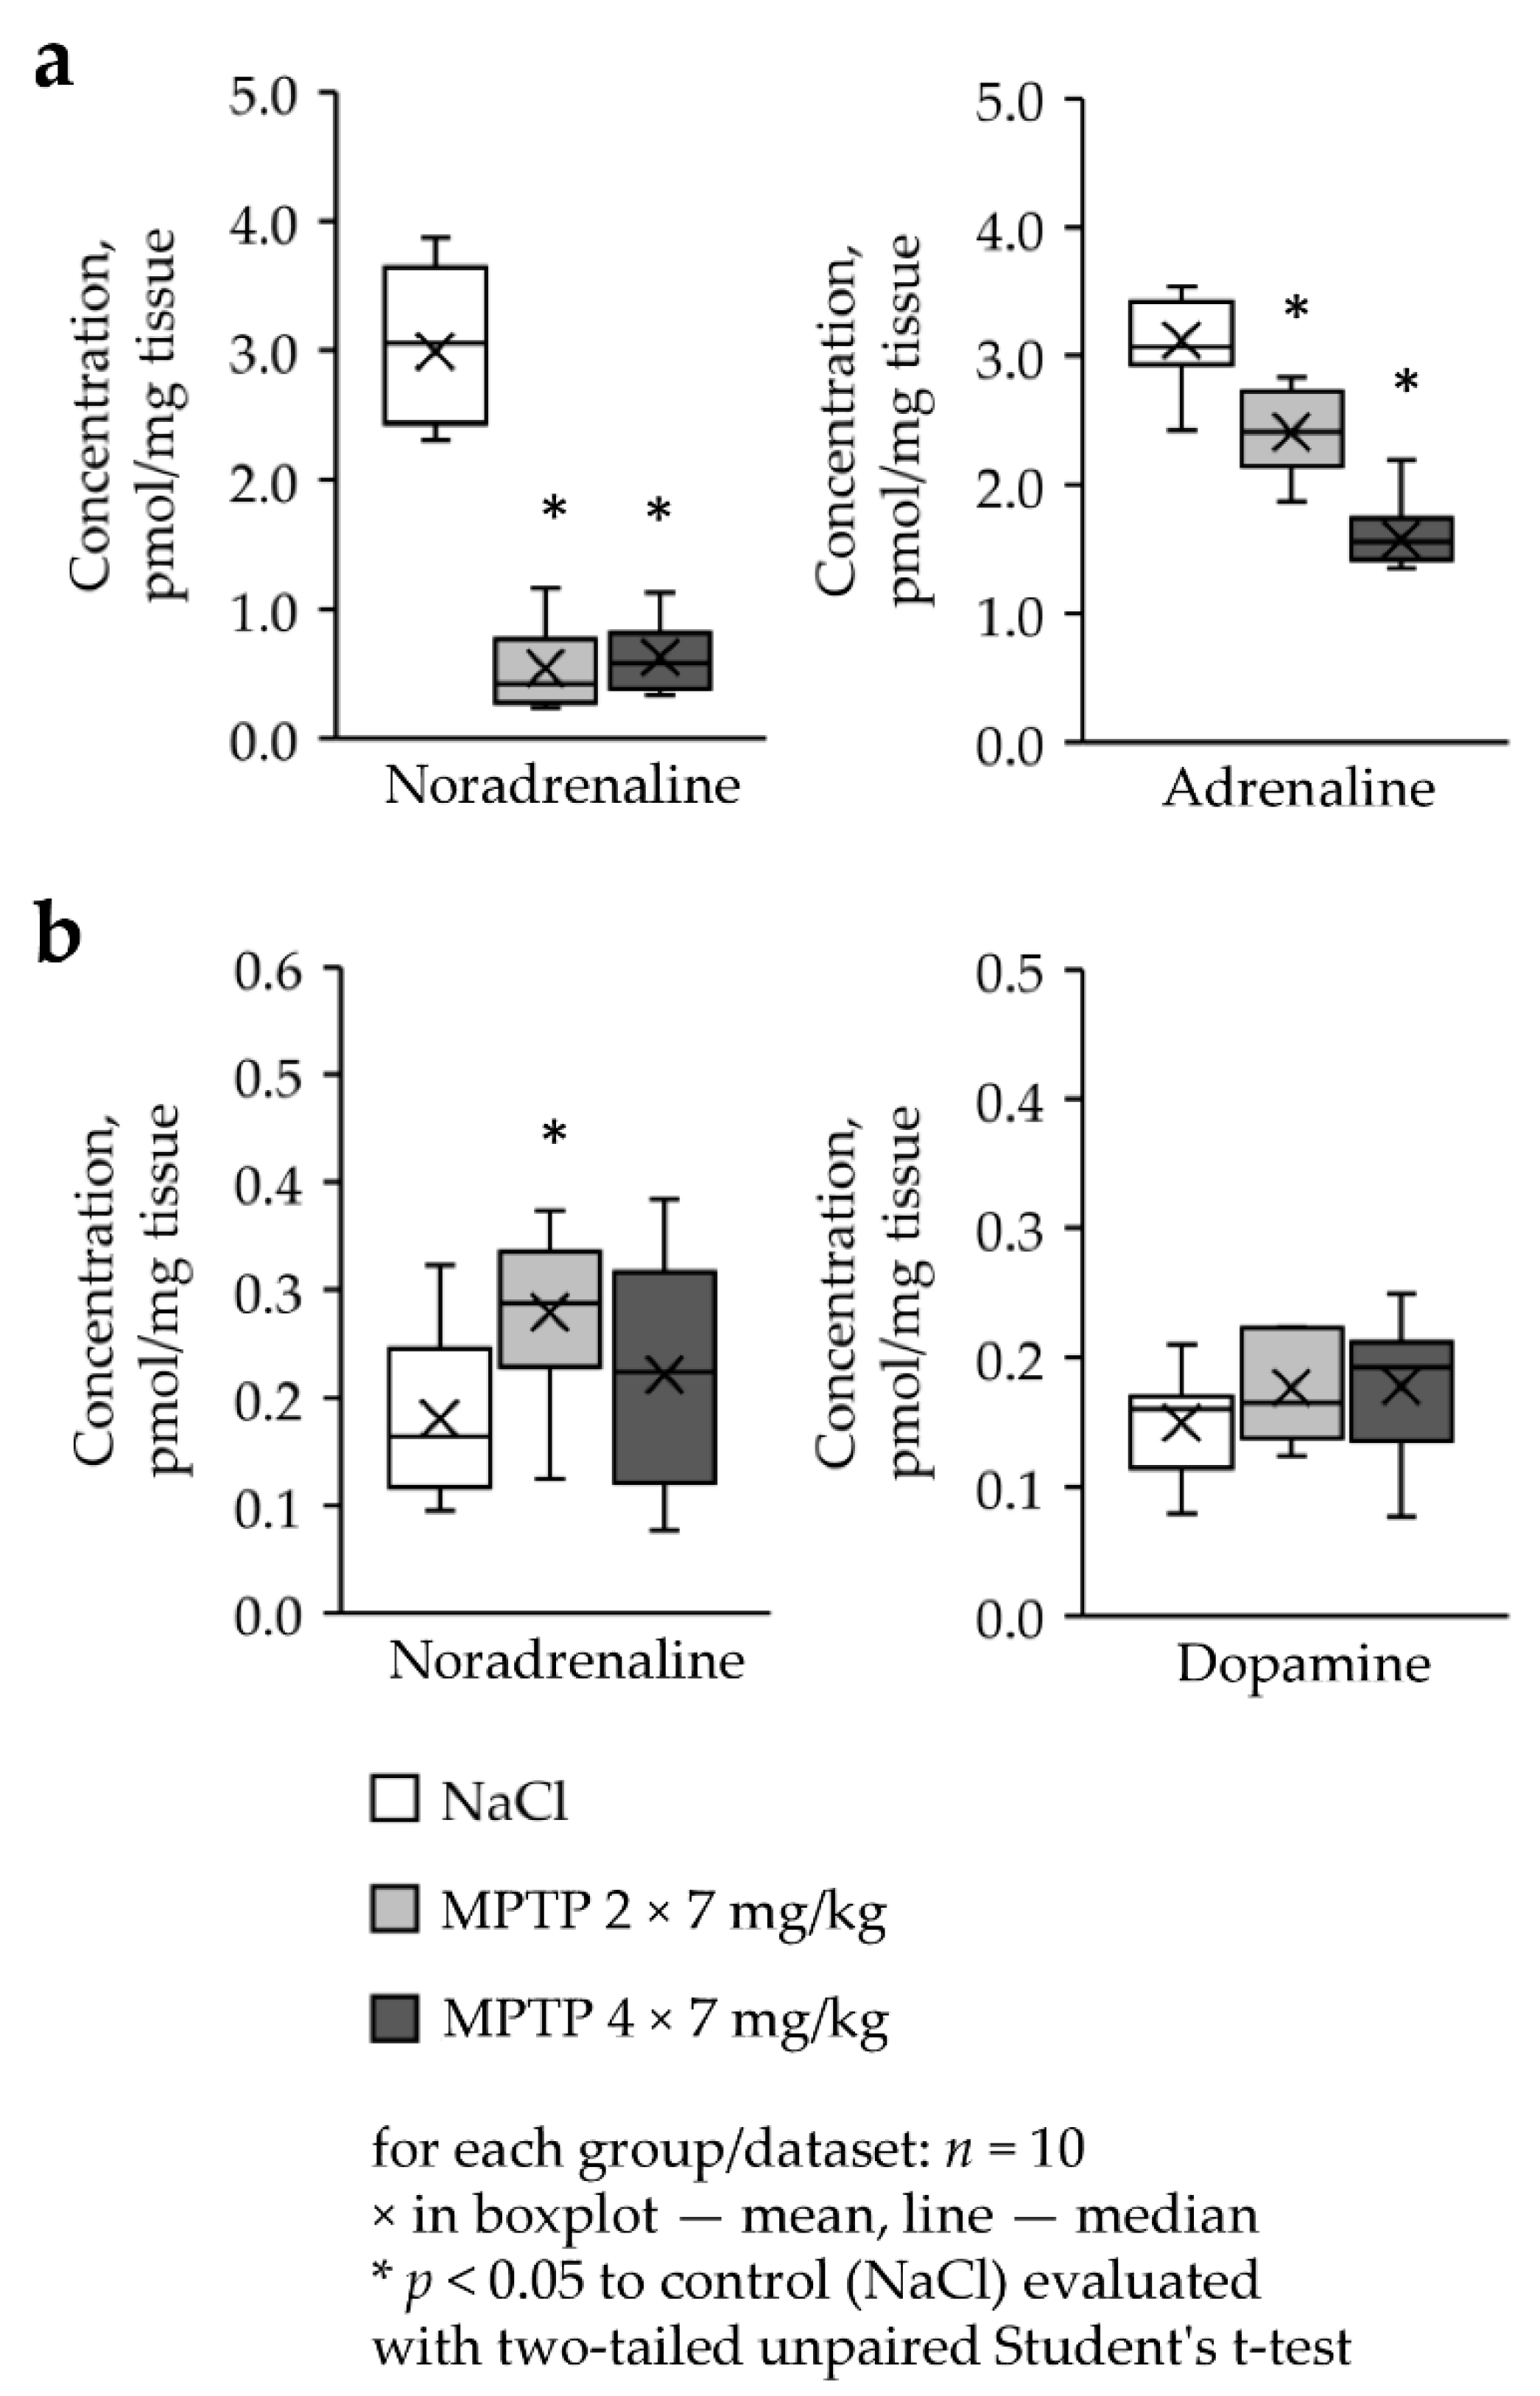
2.7. Concentration of Catecholamines in Lacrimal Glands in MPTP-Treated and Control Mice
3. Discussion
3.1. Catecholamines and Metabolites in the Tear Fluid as Potential Biomarkers of PD
3.2. Catecholamines and Metabolites in the Tear Fluid as Potential Biomarkers of PD at the Preclinical Stage
3.3. Activity of α-2-Macroglobulin in Tears as a Biomarker of PD
3.4. Diagnostic Accuracy of Tear Fluid Biomarkers
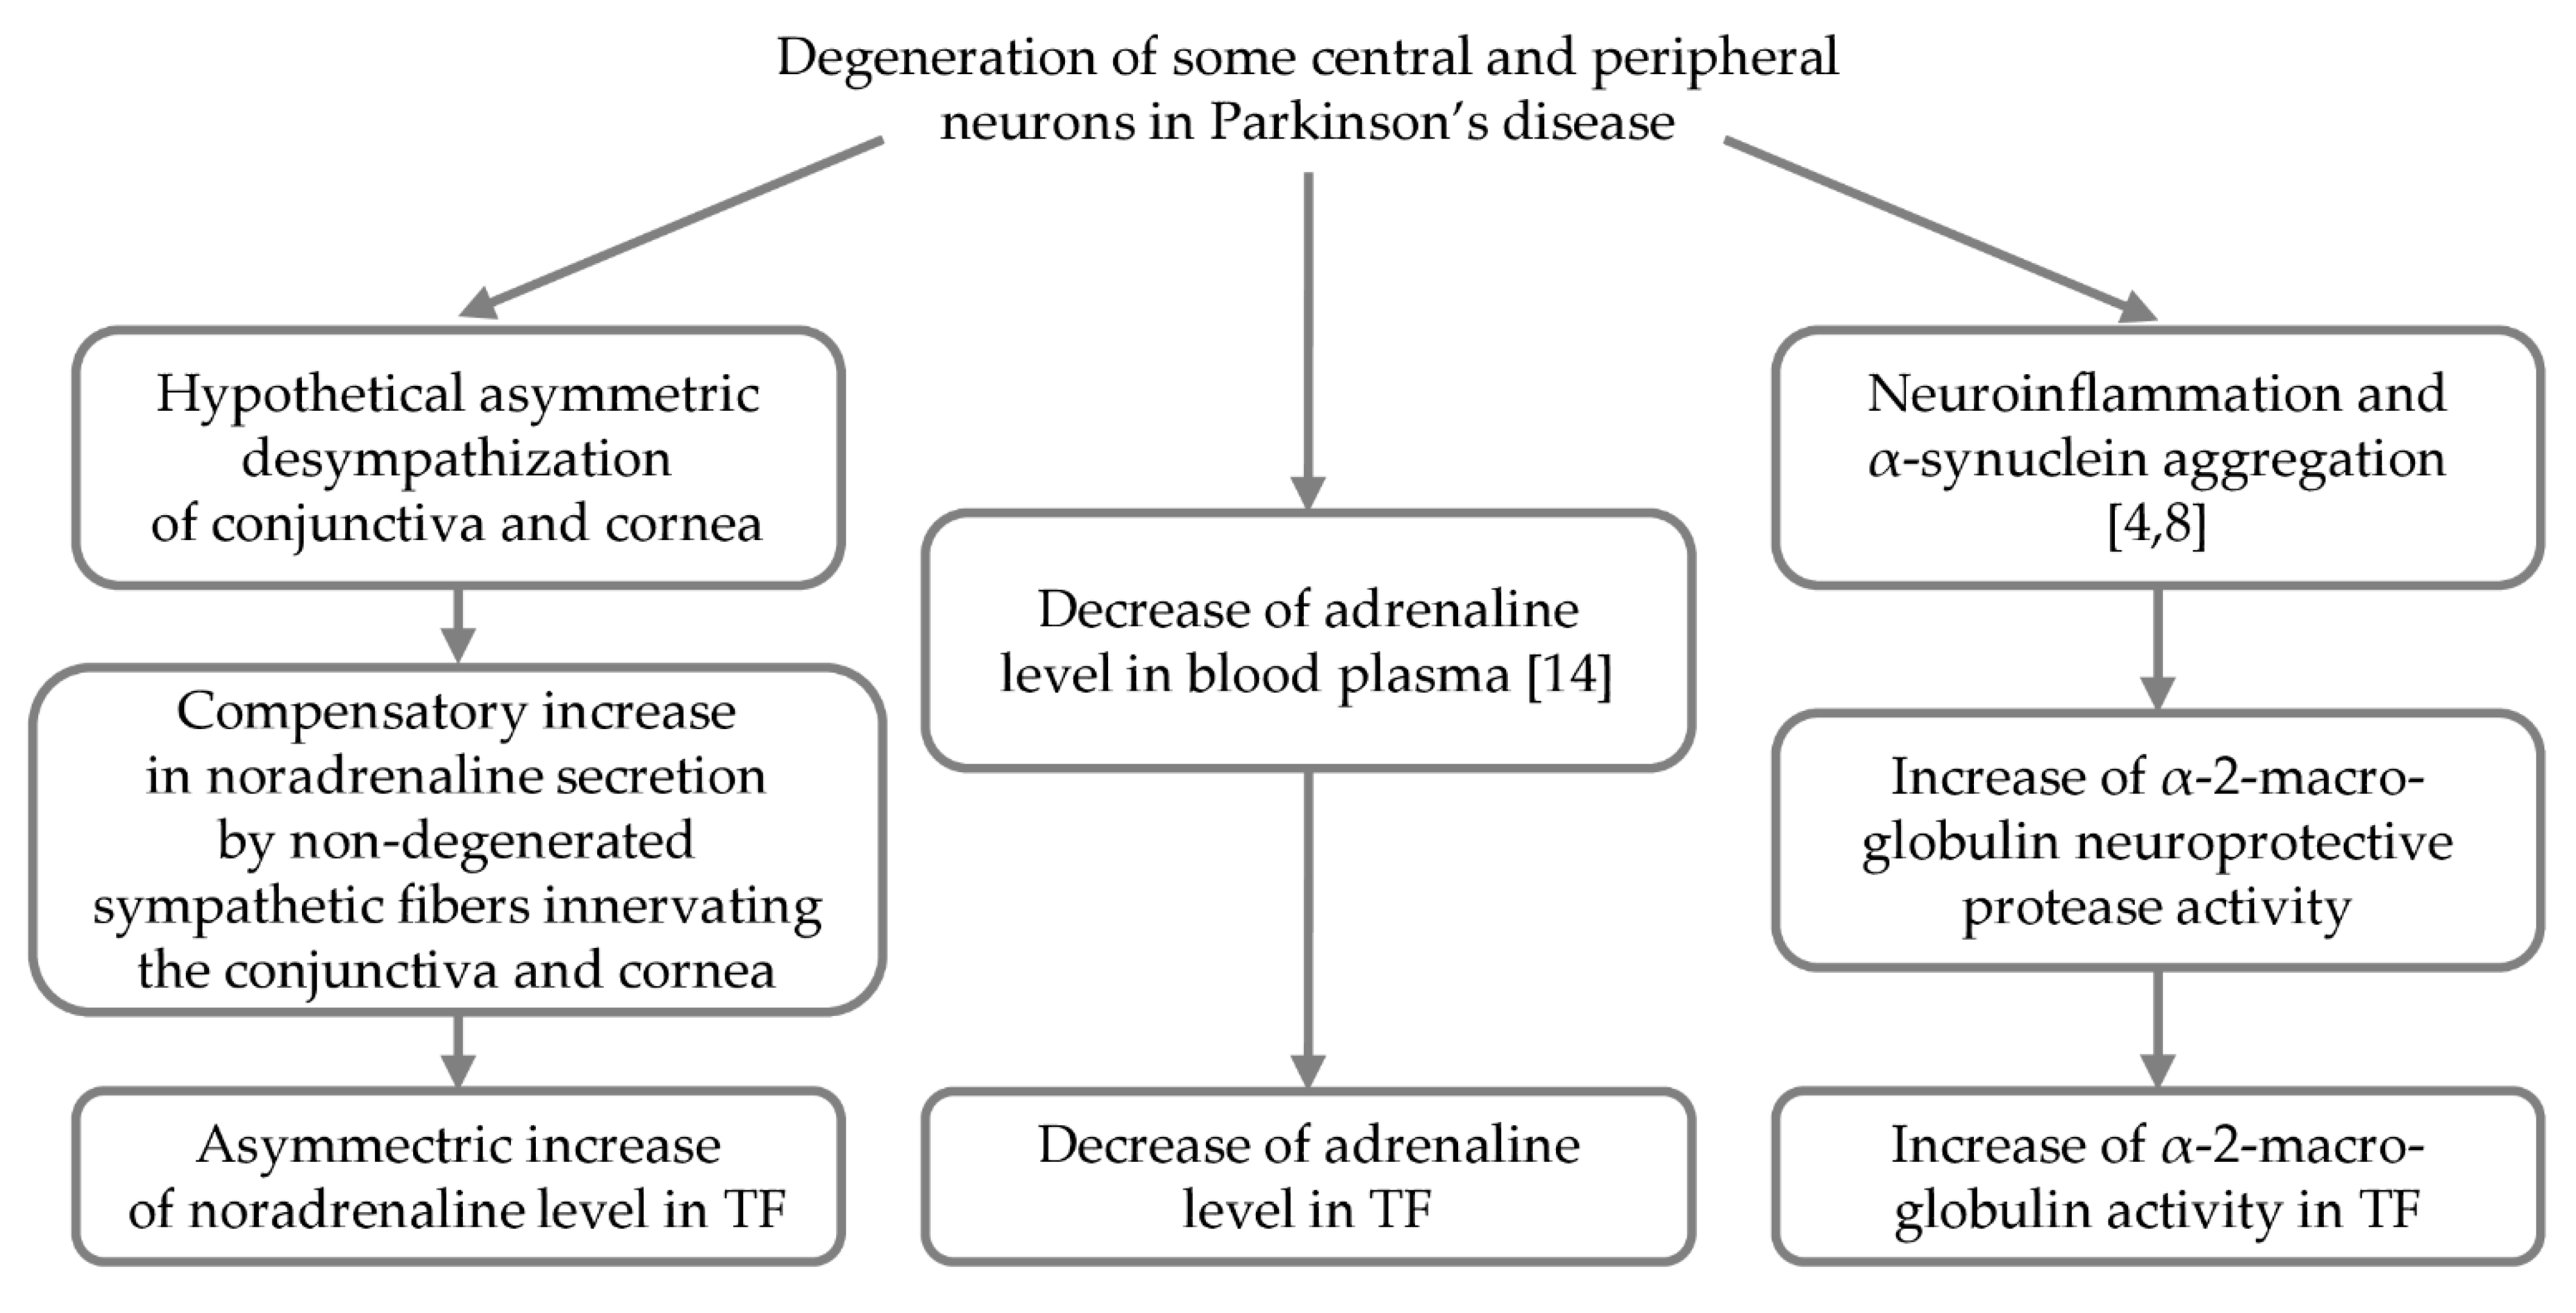
3.5. Lacrimal Glands as Potential Sources of Catecholamines in the Tear Fluid
4. Materials and Methods
4.1. Characteristics of PD Patients and Control Subjects Designed for Tear Fluid Sampling
4.2. Animals and Experimental Procedures
4.3. Tear Fluid and Brain Tissue Sampling in Animals
4.4. HPLC Assay of Catecholamines and Metabolites
4.5. In Vitro Assay of α-2-Macroglobulin Activity
4.6. Reproducibility of the Assays
4.7. Statistical Analysis
5. Conclusions
- (1)
- Untreated PD patients at an early clinical stage manifest increased levels of noradrenaline and α-2-macroglobulin activity, as well as a decrease in the level of adrenaline in the TF, which are considered as candidate biomarkers for the differential diagnosis of PD;
- (2)
- Changes in the level of noradrenaline were found in the TF of PD patients mainly on the ipsilateral side, whereas changes in the level of adrenaline and α-2-macroglobulin activity were observed in TF on both sides;
- (3)
- Changes in the level of noradrenaline and α-2-macroglobulin activity in TF observed in untreated PD patients at the clinical stage have been validated in animal models of PD as potential biomarkers of the preclinical stage;
- (4)
- The lacrimal glands in control animals and in PD models contain catecholamines; their concentration in control animals differs from that in PD models, which suggests that these glands are one of the sources of catecholamines in TF.
Author Contributions
Funding
Institutional Review Board Statement
Informed Consent Statement
Data Availability Statement
Acknowledgments
Conflicts of Interest
Appendix A


| Control | Right Eye | Left Eye | |||||
|---|---|---|---|---|---|---|---|
| Biomarker | Male | Female | p-Value | Male | Female | p-Value | |
| Concentration, pmol/µL | Noradrenaline | 0.03 ± 0.01 | 0.05 ± 0.01 | 0.31 | 0.04 ± 0.01 | 0.05 ± 0.01 | 0.27 |
| L-DOPA | 0.09 ± 0.02 | 0.10 ± 0.01 | 0.69 | 0.10 ± 0.02 | 0.09 ± 0.01 | 0.69 | |
| DOPAC | 0.05 ± 0.03 | 0.06 ± 0.01 | 0.66 | 0.05 ± 0.03 | 0.06 ± 0.01 | 0.81 | |
| Dopamine | 0.64 ± 0.30 | 0.53 ± 0.16 | 0.71 | 0.57 ± 0.11 | 0.42 ± 0.08 | 0.26 | |
| Adrenaline | 1.44 ± 0.59 | 2.10 ± 0.50 | 0.45 | 1.15 ± 0.25 | 1.86 ± 0.39 | 0.27 | |
| Content, pmol | Noradrenaline | 0.23 ± 0.06 | 0.31 ± 0.05 | 0.29 | 0.23 ± 0.06 | 0.36 ± 0.08 | 0.28 |
| L-DOPA | 0.89 ± 0.13 | 0.77 ± 0.10 | 0.48 | 0.59 ± 0.09 | 0.73 ± 0.10 | 0.37 | |
| DOPAC | 0.41 ± 0.20 | 0.36 ± 0.07 | 0.76 | 0.55 ± 0.14 | 0.33 ± 0.08 | 0.19 | |
| Dopamine | 3.11 ± 0.83 | 2.75 ± 0.47 | 0.69 | 2.63 ± 0.38 | 2.68 ± 0.60 | 0.95 | |
| Adrenaline | 11.2 ± 1.99 | 10.7 ± 1.84 | 0.88 | 9.84 ± 2.04 | 9.35 ± 1.50 | 0.88 | |
| α-2-macroglobulin activity, nmol/min×mL | 5.16 ± 0.58 | 4.19 ± 0.33 | 0.16 | 4.92 ± 0.80 | 4.37 ± 0.44 | 0.53 | |
| PD Patients | Ipsilateral Side | Contralateral Side | |||||
| Biomarker | Male | Female | p-Value | Male | Female | p-Value | |
| Concentration, pmol/µL | Noradrenaline | 0.10 ± 0.03 | 0.15 ± 0.05 | 0.39 | 0.08 ± 0.02 | 0.06 ± 0.01 | 0.56 |
| L-DOPA | 0.18 ± 0.03 | 0.17 ± 0.05 | 0.93 | 0.14 ± 0.03 | 0.09 ± 0.02 | 0.29 | |
| DOPAC | 0.07 ± 0.02 | 0.04 ± 0.01 | 0.30 | 0.06 ± 0.01 | 0.06 ± 0.03 | 0.95 | |
| Dopamine | 0.71 ± 0.18 | 0.85 ± 0.22 | 0.63 | 0.54 ± 0.17 | 0.31 ± 0.08 | 0.31 | |
| Adrenaline | 0.73 ± 0.09 | 0.85 ± 0.25 | 0.60 | 0.84 ± 0.11 | 0.63 ± 0.19 | 0.31 | |
| Content, pmol | Noradrenaline | 0.51 ± 0.14 | 0.49 ± 0.15 | 0.92 | 0.40 ± 0.10 | 0.33 ± 0.08 | 0.61 |
| L-DOPA | 0.86 ± 0.13 | 0.70 ± 0.11 | 0.38 | 0.62 ± 0.13 | 0.48 ± 0.09 | 0.40 | |
| DOPAC | 0.42 ± 0.11 | 0.41 ± 0.11 | 0.92 | 0.38 ± 0.09 | 0.42 ± 0.14 | 0.81 | |
| Dopamine | 4.84 ± 1.45 | 3.01 ± 0.75 | 0.31 | 2.35 ± 0.58 | 2.84 ± 0.94 | 0.64 | |
| Adrenaline | 4.55 ± 1.04 | 4.93 ± 1.27 | 0.82 | 6.29 ± 1.30 | 5.21 ± 1.05 | 0.56 | |
| α-2-macroglobulin activity, nmol/min×mL | 7.33 ± 1.46 | 5.96 ± 1.51 | 0.63 | 6.05 ± 1.18 | 8.49 ± 2.70 | 0.46 | |
References
- Postuma, R.B.; Berg, D.; Stern, M.; Poewe, W.; Olanow, C.W.; Oertel, W.; Obeso, J.; Marek, K.; Litvan, I.; Lang, A.E.; et al. MDS clinical diagnostic criteria for Parkinson’s disease. Mov. Disord. 2015, 30, 1591–1601. [Google Scholar] [CrossRef] [PubMed]
- Bernheimer, H.; Birkmayer, W.; Hornykiewicz, O.; Jellinger, K.; Seitelberger, F. Brain dopamine and the syndromes of Parkinson and Huntington. Clinical, morphological and neurochemical correlations. J. Neurol. Sci. 1973, 20, 415–455. [Google Scholar] [CrossRef]
- Bezard, E.; Gross, C.E. Compensatory mechanisms in experimental and human Parkinsonism: Towards a dynamic approach. Prog. Neurogibol. 1998, 55, 93–116. [Google Scholar] [CrossRef]
- Ugrumov, M. Development of early diagnosis of Parkinson’s disease: Illusion or reality? CNS Neurosci. Ther. 2020, 26, 997–1009. [Google Scholar] [CrossRef] [PubMed]
- Meissner, W.G.; Frasier, M.; Gasser, T.; Goetz, C.G.; Lozano, A.; Piccini, P.; Obeso, J.A.; Rascol, O.; Schapira, A.; Voon, V.; et al. Priorities in Parkinson’s disease research. Nat. Rev. Drug Discov. 2011, 10, 377–393. [Google Scholar] [CrossRef]
- Seidl, S.E.; Potashkin, J.A. The promise of neuroprotective agents in Parkinson’s disease. Front. Neurol. 2011, 2, 68. [Google Scholar] [CrossRef] [PubMed] [Green Version]
- Jellinger, K.A. Neurobiology of cognitive impairment in Parkinson’s disease. Exp. Rev. Neurother. 2012, 12, 1451–1466. [Google Scholar] [CrossRef] [PubMed]
- Comi, C.; Magistrelli, L.; Oggioni, G.D.; Carecchio, M.; Fleetwood, T.; Cantello, R.; Mancini, F.; Antonini, A. Peripheral nervous system involvement in Parkinson’s disease: Evidence and controversies. Parkinsonism Relat. Disord. 2014, 20, 1329–1334. [Google Scholar] [CrossRef]
- Postuma, R.B.; Berg, D. Advances in markers of prodromal Parkinson disease. Nat. Rev. Neurol. 2016, 12, 622–634. [Google Scholar] [CrossRef]
- Langston, J.W. The Parkinson’s complex: Parkinsonism is just the tip of the iceberg. Ann. Neurol. 2006, 59, 591–596. [Google Scholar] [CrossRef]
- Sharma, S.; Moon, C.S.; Khogali, A.; Haidous, A.; Chabenne, A.; Ojo, C.; Jelebinkov, M.; Kurdi, Y.; Ebadi, M. Biomarkers in Parkinson’s disease (recent update). Neurochem. Int. 2013, 63, 201–229. [Google Scholar] [CrossRef] [PubMed]
- Delenclos, M.; Jones, D.R.; McLean, P.J.; Uitti, R.J. Biomarkers in Parkinson’s disease: Advances and strategies. Parkinsonism Relat. Disord. 2016, 22, S106–S110. [Google Scholar] [CrossRef] [PubMed] [Green Version]
- Fereshtehnejad, S.M.; Lökk, J. Orthostatic hypotension in patients with Parkinson’s disease and atypical parkinsonism. Parkinsons Dis. 2014, 2014, 475854. [Google Scholar] [CrossRef] [Green Version]
- Kim, A.; Nigmatullina, R.; Zalyalova, Z.; Soshnikova, N.; Krasnov, A.; Vorobyeva, N.; Georgieva, S.; Kudrin, V.; Narkevich, V.; Ugrumov, M. Upgraded Methodology for the Development of Early Diagnosis of Parkinson’s Disease Based on Searching Blood Markers in Patients and Experimental Models. Mol. Neurobiol. 2019, 56, 3437–3450. [Google Scholar] [CrossRef]
- Kim, A.R.; Nodel, M.R.; Pavlenko, T.A.; Chesnokova, N.B.; Yakhno, N.N.; Ugrumov, M.V. Tear Fluid Catecholamines As Biomarkers of the Parkinson’s Disease: A Clinical and Experimental Study. Acta Nat. 2019, 11, 99–103. [Google Scholar] [CrossRef] [PubMed]
- Ugrumov, M.V.; Khaindrava, V.G.; Kozina, E.A.; Kucheryanu, V.G.; Bocharov, E.V.; Kryzhanovsky, G.N.; Kudrin, V.S.; Narkevich, V.B.; Klodt, P.M.; Rayevsky, K.S.; et al. Modeling of presymptomatic and symptomatic stages of parkinsonism in mice. Neuroscience 2011, 181, 175–188. [Google Scholar] [CrossRef]
- Andersen, A.D.; Binzer, M.; Stenager, E.; Gramsbergen, J.B. Cerebrospinal fluid biomarkers for Parkinson’s disease—A systematic review. Acta Neurol. Scand. 2017, 135, 34–56. [Google Scholar] [CrossRef]
- Boerger, M.; Funke, S.; Leha, A.; Roser, A.E.; Wuestemann, A.K.; Maass, F.; Bähr, M.; Grus, F.; Lingor, P. Proteomic analysis of tear fluid reveals disease-specific patterns in patients with Parkinson’s disease—A pilot study. Parkinsonism Relat. Disord. 2019, 63, 3–9. [Google Scholar] [CrossRef]
- <named-content content-type="background:white">Roda, M.; Ciavarella, C.; Giannaccare, G.; Versura, P. Biomarkers in Tears and Ocular Surface: A Window for Neurodegenerative Diseases. Eye Contact Lens. 2020, 46, S129–S134. [Google Scholar] [CrossRef]
- Edman, M.C.; Janga, S.R.; Kakan, S.S.; Okamoto, C.T.; Freire, D.; Feigenbaum, D.; Lew, M.; Hamm-Alvarez, S.F. Tears—more to them than meets the eye: Why tears are a good source of biomarkers in Parkinson’s disease. Biomark. Med. 2020, 14, 151–163. [Google Scholar] [CrossRef]
- Çomoğlu, S.S.; Güven, H.; Acar, M.; Öztürk, G.; Koçer, B. Tear levels of tumor necrosis factor-alpha in patients with Parkinson’s disease. Neurosci. Lett. 2013, 553, 63–67. [Google Scholar] [CrossRef] [PubMed]
- Hamm-Alvarez, S.F.; Okamoto, C.T.; Janga, S.R.; Feigenbaum, D.; Edman, M.C.; Freire, D.; Shah, M.; Ghanshani, R.; Mack, W.J.; Lew, M.F. Oligomeric α-synuclein is increased in basal tears of Parkinson’s patients. Biomark. Med. 2019, 13, 941–952. [Google Scholar] [CrossRef] [PubMed]
- Sathe, S.; Sakata, M.; Beaton, A.R.; Sack, R.A. Identification, origins and the diurnal role of the principal serine protease inhibitors in human tear fluid. Curr. Eye Res. 1998, 17, 348–362. [Google Scholar] [CrossRef] [PubMed]
- Cater, J.H.; Wilson, M.R.; Wyatt, A.R. Alpha-2-Macroglobulin, a Hypochlorite-Regulated Chaperone and Immune System Modulator. Oxid. Med. Cell Longev. 2019, 2019, 5410657. [Google Scholar] [CrossRef] [PubMed] [Green Version]
- Krüger, R.; Menezes-Saecker, A.M.; Schöls, L.; Kuhn, W.; Müller, T.; Woitalla, D.; Berg, D.; Berger, K.; Przuntek, H.; Epplen, J.T.; et al. Genetic analysis of the alpha2-macroglobulin gene in early- and late-onset Parkinson’s disease. Neuroreport 2000, 11, 2439–2442. [Google Scholar] [CrossRef]
- Tang, G.; Zhang, M.; Xie, H.; Jiang, S.; Wang, Z.; Xu, L.; Hao, Y.; Lin, D.; Lan, H.; Wang, Y.; et al. Alpha-2 macroglobulin I1000 V polymorphism in Chinese sporadic Alzheimer’s disease and Parkinson’s disease. Neurosci. Lett. 2002, 328, 195–197. [Google Scholar] [CrossRef]
- Guo, X.; Tang, P.; Li, X.; Chong, L.; Zhang, X.; Li, R. Association between two α-2-macroglobulin gene polymorphisms and Parkinson’s disease: A meta-analysis. Int. J. Neurosci. 2016, 126, 193–198. [Google Scholar] [CrossRef]
- Dursun, E.; Gezen-Ak, D.; Hanağası, H.; Bilgiç, B.; Lohmann, E.; Ertan, S.; Atasoy, İ.L.; Alaylıoğlu, M.; Araz, Ö.S.; Önal, B.; et al. The interleukin 1 alpha, interleukin 1 beta, interleukin 6 and alpha-2-macroglobulin serum levels in patients with early or late onset Alzheimer’s disease, mild cognitive impairment or Parkinson’s disease. J. Neuroimmunol. 2015, 283, 50–57. [Google Scholar] [CrossRef]
- Gupta, A.K.; Pokhriyal, R.; Khan, M.I. Cerebrospinal Fluid Proteomics For Identification Of α2-Macroglobulin as a Potential Biomarker To Monitor Pharmacological Therapeutic Efficacy In Dopamine Dictated Disease States of Parkinson’s Disease And Schizophrenia. Neuropsychiatr. Dis. Treat. 2019, 15, 2853–2867. [Google Scholar] [CrossRef] [Green Version]
- Armstrong, R.A. Visual symptoms in Parkinson’s disease. Parkinsons Dis. 2011, 2011, 908306. [Google Scholar] [CrossRef] [PubMed] [Green Version]
- Marfurt, C.F.; Ellis, L.C. Immunohistochemical localization of tyrosine hydroxylase in corneal nerves. J. Comp. Neurol. 1993, 336, 517–531. [Google Scholar] [CrossRef] [PubMed]
- Dartt, D.A.; McCarthy, D.M.; Mercer, H.J.; Kessler, T.L.; Chung, E.H.; Zieske, J.D. Localization of nerves adjacent to goblet cells in rat conjunctiva. Curr. Eye Res. 1995, 14, 993–1000. [Google Scholar] [CrossRef] [PubMed]
- Ding, C.; Walcott, B.; Keyser, K.T. Sympathetic neural control of the mouse lacrimal gland. Investig. Ophthalmol. Vis. Sci. 2003, 44, 1513–1520. [Google Scholar] [CrossRef] [PubMed] [Green Version]
- Martin, X.D.; Brennan, M.C. Dopamine and its metabolites in human tears. Eur. J. Ophthalmol. 1993, 3, 83–88. [Google Scholar] [CrossRef]
- Trope, G.E.; Rumley, A.G. Catecholamine concentrations in tears. Exp. Eye Res. 1984, 39, 247–250. [Google Scholar] [CrossRef]
- Zubareva, T.V.; Kiseleva, Z.M. Catecholamine content of the lacrimal fluid of healthy people and glaucoma patients. Ophthalmologica 1977, 175, 339–344. [Google Scholar] [CrossRef]
- Kim, A.R.; Pavlenko, T.A.; Katargina, L.A.; Chesnokova, N.B.; Ugrumov, M.V. Biochemical and Functional Changes in the Eye as a Manifestation of Systemic Degeneration of the Nervous System in Parkinsonism. Acta Nat. 2018, 10, 62–67. [Google Scholar] [CrossRef] [Green Version]
- Ahlskog, J.E.; Uitti, R.J.; Tyce, G.M.; O’Brien, J.F.; Petersen, R.C.; Kokmen, E. Plasma catechols and monoamine oxidase metabolites in untreated Parkinson’s and Alzheimer’s diseases. J. Neurol. Sci. 1996, 136, 162–168. [Google Scholar] [CrossRef]
- Bouhaddi, M.; Vuillier, F.; Fortrat, J.O.; Cappelle, S.; Henriet, M.T.; Rumbach, L.; Regnardet, J. Impaired cardiovascular autonomic control in newly and long-term-treated patients with Parkinson’s disease: Involvement of L-dopa therapy. Auton. Neurosci. 2004, 116, 30–38. [Google Scholar] [CrossRef]
- Chia, L.G.; Cheng, F.C.; Kuo, J.S. Monoamines and their metabolites in plasma and lumbar cerebrospinal fluid of Chinese patients with Parkinson’s disease. J. Neurol. Sci. 1993, 116, 125–134. [Google Scholar] [CrossRef]
- Eldrup, E.; Mogensen, P.; Jacobsen, J.; Pakkenberg, H.; Christensen, N.J. CSF and plasma concentrations of free norepinephrine, dopamine, 3,4-dihydroxyphenylacetic acid (DOPAC), 3,4-dihydroxyphenylalanine (DOPA), and epinephrine in Parkinson’s disease. Acta Neurol. Scand. 1995, 92, 116–121. [Google Scholar] [CrossRef] [PubMed]
- Tohgi, H.; Abe, T.; Saheki, M.; Yamazaki, K.; Murata, T. Concentration of catecholamines and indoleamines in the cerebrospinal fluid of patients with vascular parkinsonism compared to Parkinson’s disease patients. J. Neural. Transm. 1997, 104, 441–449. [Google Scholar] [CrossRef] [PubMed]
- Maass, F.; Michalke, B.; Willkommen, D.; Leha, A.; Schulte, C.; Tönges, L.; Mollenhauer, B.; Trenkwalder, C.; Rückamp, D.; Börger, M.; et al. Elemental fingerprint: Reassessment of a cerebrospinal fluid biomarker for Parkinson’s disease. Neurobiol. Dis. 2020, 134, 104677. [Google Scholar] [CrossRef]
- Hu, Y.Q.; Dluzen, D.E.; Koo, P.H. Intracranial infusion of monoamine-activated alpha 2-macroglobulin decreases dopamine concentrations within the rat caudate putamen. J. Neurosci. Res. 1994, 38, 531–537. [Google Scholar] [CrossRef]
- Djaldetti, R.; Ziv, I.; Melamed, E. The mystery of motor asymmetry in Parkinson’s disease. Lancet Neurol. 2006, 5, 796–802. [Google Scholar] [CrossRef]
- Chahine, L.M.; Stern, M.B.; Chen-Plotkin, A. Blood-based biomarkers for Parkinson’s disease. Parkinsonism Relat. Disord. 2014, 20, S99–S103. [Google Scholar] [CrossRef] [Green Version]
- Costa, M.F.B.N.A.D.; Reisdorfer, E.; Kempfer, S.S.; Fernandes, G.C.M.; Porporatti, A.L.; Canto, G.L. Diagnostic validity of biomarkers in Parkinson’s Disease: Systematic review and meta-analysis. Rev. Bras. Enferm. 2018, 71, 3074–3083. [Google Scholar] [CrossRef]
- Gao, L.; Tang, H.; Nie, K.; Wang, L.; Zhao, J.; Gan, R.; Huang, J.; Zhu, R.; Feng, S.; Duan, Z.; et al. Cerebrospinal fluid alpha-synuclein as a biomarker for Parkinson’s disease diagnosis: A systematic review and meta-analysis. Int. J. Neurosci. 2015, 125, 645–654. [Google Scholar] [CrossRef] [PubMed]
- Ignjatovic, V.; Geyer, P.E.; Palaniappan, K.K.; Chaaban, J.E.; Omenn, G.S.; Baker, M.S.; Deutsch, E.W.; Schwenk, J.M. Mass Spectrometry-Based Plasma Proteomics: Considerations from Sample Collection to Achieving Translational Data. J. Proteome Res. 2019, 6, 4085–4097. [Google Scholar] [CrossRef] [PubMed]
- Dartt, D.A. Neural regulation of lacrimal gland secretory processes: Relevance in dry eye diseases. Prog. Retin. Eye Res. 2009, 28, 155–177. [Google Scholar] [CrossRef] [Green Version]
- Metzger, J.M.; Emborg, M.E. Autonomic dysfunction in Parkinson disease and animal models. Clin. Auton. Res. 2019, 29, 397–414. [Google Scholar] [CrossRef] [PubMed]
- Pavlenko, T.A.; Chesnokova, N.B.; Nodel, M.R.; Kim, A.R.; Ugrumov, M.V. Molecular Mechanisms and Clinical Manifestations of Catecholamine Dysfunction in the Eye in Parkinson’s Disease As a Basis for Developing Early Diagnosis. Acta Nat. 2020, 12, 52–62. [Google Scholar] [CrossRef]
- Börger, M.; Funke, S.; Bähr, M.; Grus, F.; Lingor, P. Biomarker sources for Parkinson’s disease: Time to shed tears? Basal Ganglia 2015, 5, 63–69. [Google Scholar] [CrossRef]
- Belmonte, C.; Nichols, J.J.; Cox, S.M.; Brock, J.A.; Begley, C.G.; Bereiter, D.A.; Dartt, D.A.; Galor, A.; Hamrah, P.; Ivanusic, J.J.; et al. TFOS DEWS II pain and sensation report. Ocul. Surf. 2017, 15, 404–437. [Google Scholar] [CrossRef] [PubMed] [Green Version]
- Grueb, M.; Wallenfels-Thilo, B.; Denk, O. Monoamine receptors in human corneal epithelium and endothelium. Acta Ophthalmol. Scand. 2006, 84, 110–115. [Google Scholar] [CrossRef] [PubMed]
- Sebbag, L.; Allbaugh, R.A.; Weaver, A.; Seo, Y.J.; Mochel, J.P. Histamine-Induced Conjunctivitis and Breakdown of Blood-Tear Barrier in Dogs: A Model for Ocular Pharmacology and Therapeutics. Front. Pharmacol. 2019, 10, 752. [Google Scholar] [CrossRef] [PubMed]
- Nagatsu, T. Isoquinoline neurotoxins in the brain and Parkinson’s disease. Neurosci. Res. 1997, 29, 99–111. [Google Scholar] [CrossRef]
- Vaccari, C.; El Dib, R.; Gomaa, H.; Lopes, L.C.; de Camargo, J.L. Paraquat and Parkinson’s disease: A systematic review and meta-analysis of observational studies. J. Toxicol. Environ. 2019, 22, 172–202. [Google Scholar] [CrossRef]
- Jackson-Lewis, V.; Przedborski, S. Protocol for the MPTP mouse model of Parkinson’s disease. Nat. Protoc. 2007, 2, 141–151. [Google Scholar] [CrossRef]
- Rehman, A.A.; Ahsan, H.; Khan, F.H. α-2-Macroglobulin: A physiological guardian. J. Cell Physiol. 2013, 228, 1665–1675. [Google Scholar] [CrossRef]
- Barcelona, P.F.; Saragovi, H.U. A Pro-Nerve Growth Factor (proNGF) and NGF Binding Protein, α2-Macroglobulin, Differentially Regulates p75 and TrkA Receptors and Is Relevant to Neurodegeneration Ex Vivo and In Vivo. Mol. Cell. Biol. 2015, 35, 3396–3408. [Google Scholar] [CrossRef] [PubMed] [Green Version]
- Goetz, C.G.; Tilley, B.C.; Shaftman, S.R.; Stebbins, G.T.; Fahn, S.; Martinez-Martin, P.; Poewe, W.; Sampaio, C.; Stern, M.B.; Dodel, R.; et al. Movement Disorder Society-sponsored revision of the Unified Parkinson’s Disease Rating Scale (MDS-UPDRS): Scale presentation and clinimetric testing results. Mov. Disord. 2008, 15, 2129–2170. [Google Scholar] [CrossRef] [PubMed]
- Finley, J.K.; Farmer, D.; Emmerson, E.; Cruz Pacheco, N.; Knox, S.M. Manipulating the murine lacrimal gland. J. Vis. Exp. 2014, 18, e51970. [Google Scholar] [CrossRef] [PubMed] [Green Version]
- Shinomiya, K.; Ueta, M.; Kinoshita, S. A new dry eye mouse model produced by exorbital and intraorbital lacrimal gland excision. Sci. Rep. 2018, 8, 1483. [Google Scholar] [CrossRef]
- Chuang, W.H.; Liu, P.C.; Hung, C.Y.; Lee, K.K. Purification, characterization and molecular cloning of alpha-2-macroglobulin in cobia, Rachycentron canadum. Fish Shellfish Immunol. 2014, 41, 346–355. [Google Scholar] [CrossRef]


| Cohort | Early Symptomatic Untreated PD Patients | Control Subjects | |
|---|---|---|---|
| Parameter | |||
| N | 31 | 32 | |
| Gender, male/female | 18/13 | 11/21 | |
| Age, years | 60.4 ± 1.9 | 56.6 ± 2.0 | |
| PD stage assessment | Hoehn–Yahr scale | 1.7 ± 0.1 | – |
| UPDRS II (daily activity) | 8.0 ± 0.9 | – | |
| UPDRS III (motor activity) | 22.8 ± 2.2 | – | |
| Motor symptoms | duration since onset, years | 2.4 ± 0.3 | – |
| side of onset, right/left | 15/16 | – | |
| Total volume of tear fluid collected from both eyes, µL | 11.7 ± 0.9 * | 16.8 ± 1.7 | |
| Intraocular pressure in right/left eye, mm hg | 23.6 ± 0.8/23.7 ± 0.7 | 22.1 ± 0.7/22.5 ± 0.7 | |
| Parameter 1 | Hoehn and Yahr Score (Range: 1–3) | UPDRS III Score (Range: 4–36) | |||
|---|---|---|---|---|---|
| Parameter 2 | r | p-Value | r | p-Value | |
| Concentration | Noradrenaline | 0.33 | 0.15 | 0.36 | 0.12 |
| L-DOPA | 0.17 | 0.45 | 0.28 | 0.22 | |
| DOPAC | 0.00 | 1.00 | −0.02 | 0.97 | |
| Dopamine | 0.31 | 0.20 | 0.50 | 0.04 * | |
| Adrenaline | 0.35 | 0.24 | 0.37 | 0.22 | |
| Content | Noradrenaline | 0.31 | 0.18 | 0.21 | 0.37 |
| L-DOPA | −0.01 | 0.96 | −0.04 | 0.85 | |
| DOPAC | −0.02 | 0.94 | −0.02 | 0.95 | |
| Dopamine | 0.18 | 0.44 | 0.06 | 0.81 | |
| Adrenaline | −0.38 | 0.22 | −0.50 | 0.09 | |
| α-2-macroglobulin activity | −0.12 | 0.78 | −0.33 | 0.39 | |
| Source | Tear Fluid | Exorbital Glands | Blood Plasma (from [14]) | |||||||
| Biomarker | PD patients, ipsilateral side | PD patients, contralateral side | Mice, modeling preclinical PD | Mice, modeling clinical PD | Mice, modeling preclinical PD | Mice, modeling clinical PD | PD patients | Mice, modeling preclinical PD | Mice, modeling clinical PD | |
| Concentration/content | Noradrenaline | ↑/↑ | =/= | ↑/= | ↑/↑ | ↓ | ↓ | ↓ | = | = |
| Adrenaline | ↓/↓ | ↓/↓ | - | - | ↓ | ↓ | ↓ | = | = | |
| Dopamine | =/= | =/= | ↑/↑ | ↑/↑ | - | - | ↓ | ↓ | = | |
| L-DOPA | ↑/= | =/= | - | - | - | - | ↓ | ↓ | ↓ | |
| DOPAC | =/= | =/= | =/= | =/= | - | - | ↓ | ↓ | ↓ | |
| α-2-macroglobulin activity | ↑ | ↑ | ↑ | ↑ | n/s | n/s | n/s | n/s | n/s | |
| № | Criteria | PD Patients | Control |
|---|---|---|---|
| 1. | Idiopathic PD | + | - |
| 2. | Secondary Parkinsonism | - | - |
| 3. | Other extrapyramidal and neurological diseases | - | - |
| 4. | Psychiatric disorders | - | - |
| 5. | Ophthalmic diseases (acute eye inflammation, ocular trauma, PD related retinal disorders) | - | - |
| 6. | Endocrine diseases | - | - |
| 7. | Stroke and trauma over the past two years | - | - |
| 8. | Somatic symptom disorders | - | - |
| 9. | Neoplasms, including malignant tumors | - | - |
| 10. | Specific antiparkinsonian therapy (levodopa, dopamine receptor agonists, monoamine oxidase inhibitors, amantadine, etc.) | - | - |
| 11. | Antagonists of dopamine receptors (metoclopramide, domperidone, cinnarizine, etc.) | - | - |
| 12. | Sympatholytics (reserpine) | - | - |
| 13. | Agonists and antagonists of serotonin and adenosine receptors | - | - |
Publisher’s Note: MDPI stays neutral with regard to jurisdictional claims in published maps and institutional affiliations. |
© 2021 by the authors. Licensee MDPI, Basel, Switzerland. This article is an open access article distributed under the terms and conditions of the Creative Commons Attribution (CC BY) license (https://creativecommons.org/licenses/by/4.0/).
Share and Cite
Bogdanov, V.; Kim, A.; Nodel, M.; Pavlenko, T.; Pavlova, E.; Blokhin, V.; Chesnokova, N.; Ugrumov, M. A Pilot Study of Changes in the Level of Catecholamines and the Activity of α-2-Macroglobulin in the Tear Fluid of Patients with Parkinson’s Disease and Parkinsonian Mice. Int. J. Mol. Sci. 2021, 22, 4736. https://doi.org/10.3390/ijms22094736
Bogdanov V, Kim A, Nodel M, Pavlenko T, Pavlova E, Blokhin V, Chesnokova N, Ugrumov M. A Pilot Study of Changes in the Level of Catecholamines and the Activity of α-2-Macroglobulin in the Tear Fluid of Patients with Parkinson’s Disease and Parkinsonian Mice. International Journal of Molecular Sciences. 2021; 22(9):4736. https://doi.org/10.3390/ijms22094736
Chicago/Turabian StyleBogdanov, Vsevolod, Alexander Kim, Marina Nodel, Tatiana Pavlenko, Ekaterina Pavlova, Victor Blokhin, Natalia Chesnokova, and Michael Ugrumov. 2021. "A Pilot Study of Changes in the Level of Catecholamines and the Activity of α-2-Macroglobulin in the Tear Fluid of Patients with Parkinson’s Disease and Parkinsonian Mice" International Journal of Molecular Sciences 22, no. 9: 4736. https://doi.org/10.3390/ijms22094736